
Abstract
This research examines differences in the compensation of male and female executive directors and chief financial officers in nonprofit organizations. We utilize executive transition periods within organizations as an empirical strategy for isolating how gender impacts the salaries of two people who occupy the same role in the same organization. Two waves of IRS 990 compensation data are used to assess compensation practices over the past two decades. The good news includes an overall increase in the number of women holding executive positions and indications that the discriminatory component of pay (discrepancies for two people holding the same position within the same organization) is relatively small and may be decreasing. This good news, however, is accompanied by bad news: large cross-sectional gaps in pay that result from an over-representation of male executives in the largest nonprofits and those in industries with the highest executive pay.
Keywords
Introduction
In a sector that embraces equity as a core value and relies predominantly on women for the human capital that powers organizations, a large gender pay gap has the potential to erode employee morale and create human resource challenges (Mesch & Rooney, 2008). Women account for approximately 75% of the nonprofit workforce but are underrepresented at top levels of leadership (Lee, 2019; Mesch & Rooney, 2008; Pynes, 2000). They are frequently paid less than their male counterparts in middle and upper management positions (Blau & Kahn, 2017; Gibelman, 2000; Lennon et al., 2013), even after controlling for factors such as age and education (Gibelman, 2000).
Salary is an important recruitment tool for executives, managers and skilled employees in the nonprofit sector (Tierney, 2006); thus, a sizable gender pay gap can have a consequential impact on the vitality and performance of the sector over time. If women perceive executive compensation practices to be unfair in a sector, they may pursue leadership roles in other sectors or decline to step into leadership positions altogether, thus depriving nonprofits of female managers in the hiring pool and potential leadership talent. When nonprofits fail to recruit women to leadership positions, they can also miss out on the unique benefits that women bring to organizations when they serve in executive roles (Eagly, 2007; Eagly et al., 2003).
The gender pay gap is a persistent feature of the US economy that is not unique to the nonprofit sector, but research indicates some progress. In 1980, the median US female wage earner received 56 cents for every dollar paid to the median male earner (Goldin, 2014). 1 Through efforts to eliminate gender-based pay differences, such as the Equal Pay Act of 1963 and the Lilly Ledbetter Fair Pay Act of 2009, women earned 77 cents on the dollar in 2010 (Goldin, 2014) and 82 cents by 2017 (Brown & Patten, 2017). Slow, steady progress toward equal pay occurred for three decades following the 1980s but has stalled since the early 2010s (Blau & Kahn, 2017).
Research on the pay gap illustrates three distinct discrepancies—differences in the rates at which women hold leadership positions across types of organizations (industry and size), salary differences that arise from appointing women to different leadership roles within organizations, and differences in pay for men and women holding the same positions in the same organizations. The first two types are often characterized as sorting processes that arise through some combination of individual preferences that shape which opportunities they pursue, the gendering of professions, and the discretion of the hiring committee exercised during recruitment, screening, and interview processes. The third type is closest to a legal definition of pay discrimination—pay differences observed for individuals holding the same rank, title, and responsibilities within the same organization. In other words, when people are systematically paid differently for nearly identical work. This study introduces a new approach to isolating the third type of pay gap using leadership transitions as a practical and robust method for separating the within-role variance in pay from the overall gap. This approach thus advances our knowledge of the pay gap by separating pay differences that arise from men and women holding leadership roles in very different types of organizations from discrepancies between men and women holding the same positions within the same organizations.
This research contributes to the literature on nonprofit executive pay in several ways. First, we focus on two crucial roles in the nonprofit sector—executive directors and chief financial officers. We chose these two positions because both roles are typically held by a single person in an organization; thus, we can safely assume that outgoing and incoming executives in those roles will have similar responsibilities and that their pay should be comparable. While executive directors’ academic degrees and career pathways will vary widely, chief financial officers mostly come from accounting or finance and have similar professional credentials. Using both positions thus serves as a check on assumptions used in the models. Second, we introduce a new public IRS 990 compensation dataset that offers the potential to provide timely and consistent pay gap estimates. Third, we use two distinct datasets that allow us to observe compensation practices over a 20-year period in order to examine the persistence of the pay gap. Fourth, we use a difference-in-difference estimator to calculate the pay gap for individuals holding identical job titles within the same organizations. This estimation strategy allows us to isolate the discrimination component from other factors contributing to the total pay gap.
We find some optimistic evidence on the nature of the nonprofit pay gap. First, more female executive directors were hired in 2015 than in 2000 (in absolute terms and as a proportion of new executive hires). Second, after isolating the wage discrimination component from some of the alternative explanations for compensation differences in top leadership positions, the gender pay gap is less than half the size of previous estimates (see Figure 1). The bad news is that gender persists as a predictor of pay even when ruling out the competing explanations of position segregation (e.g. glass ceiling effects) and occupational sorting (e.g. self-selection or steering into redistributive agencies or smaller organizations). Results suggest that the total pay gap likely arises through sorting across nonprofit subsectors (industries) or organizational types within subsectors, and from the failure of the largest organizations to promote women to top leadership roles.
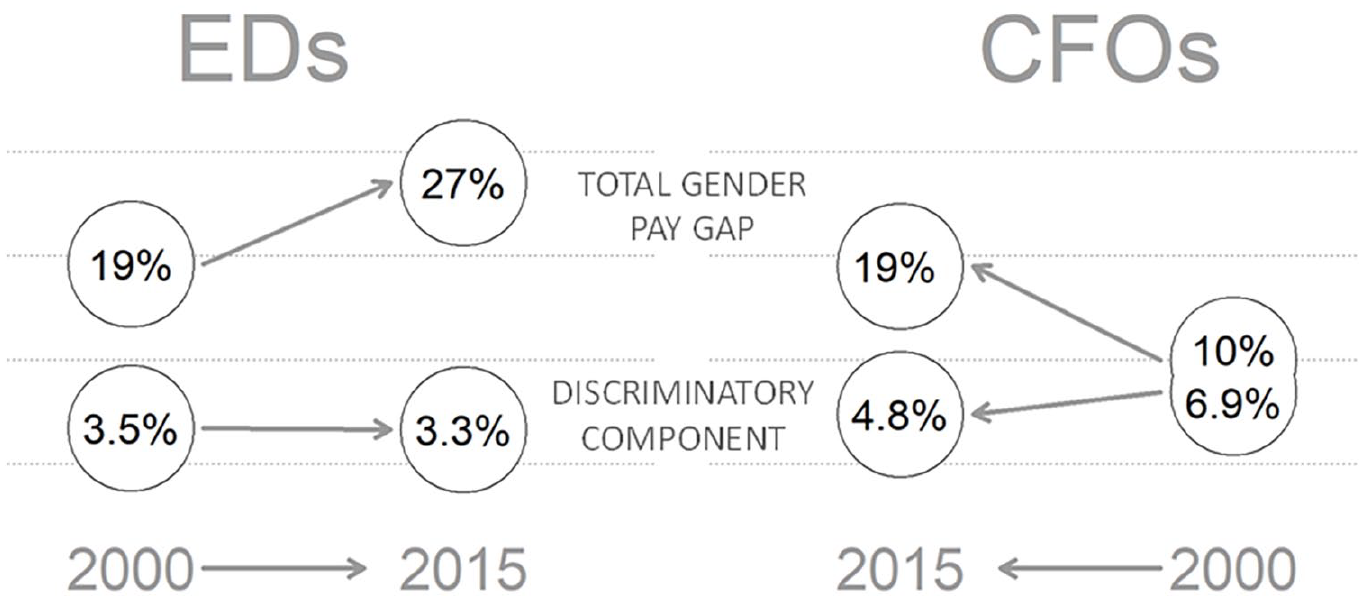
Total and discriminatory pay gaps when examining leadership transitions—2000 to 2015.
Review of Existing Work
Although women represent the majority of staff and volunteer positions in nonprofit organizations (Lee, 2019; Lennon et al., 2013; Pynes, 2000), women are underrepresented in executive and financial management positions. Several theories provide explanations for why these discrepancies might occur. The theory of occupational/agency segregation (Bishu & Alkadry, 2017; Blau & Kahn, 2006, 2007) posits that the tendency for men and women to work in different types of occupations and industries is a significant cause of the wage gap (Blau et al., 2013; Blau & Kahn, 2017). Structurally, occupational and agency segregation can work in two distinct ways. First, position segregation within organizations may create a glass ceiling for female employees. Organizational barriers, thus, can prevent women from breaking through to higher-level positions. The lack of women in upper-level positions may be due to women entering organizations at lower ranks and factors denying women upward mobility once in an organization (Alkadry & Tower, 2006). We cannot examine glass ceiling effects with these data because it would require data on who applies to open positions, whereas we can only observe the outcome of the hiring process.
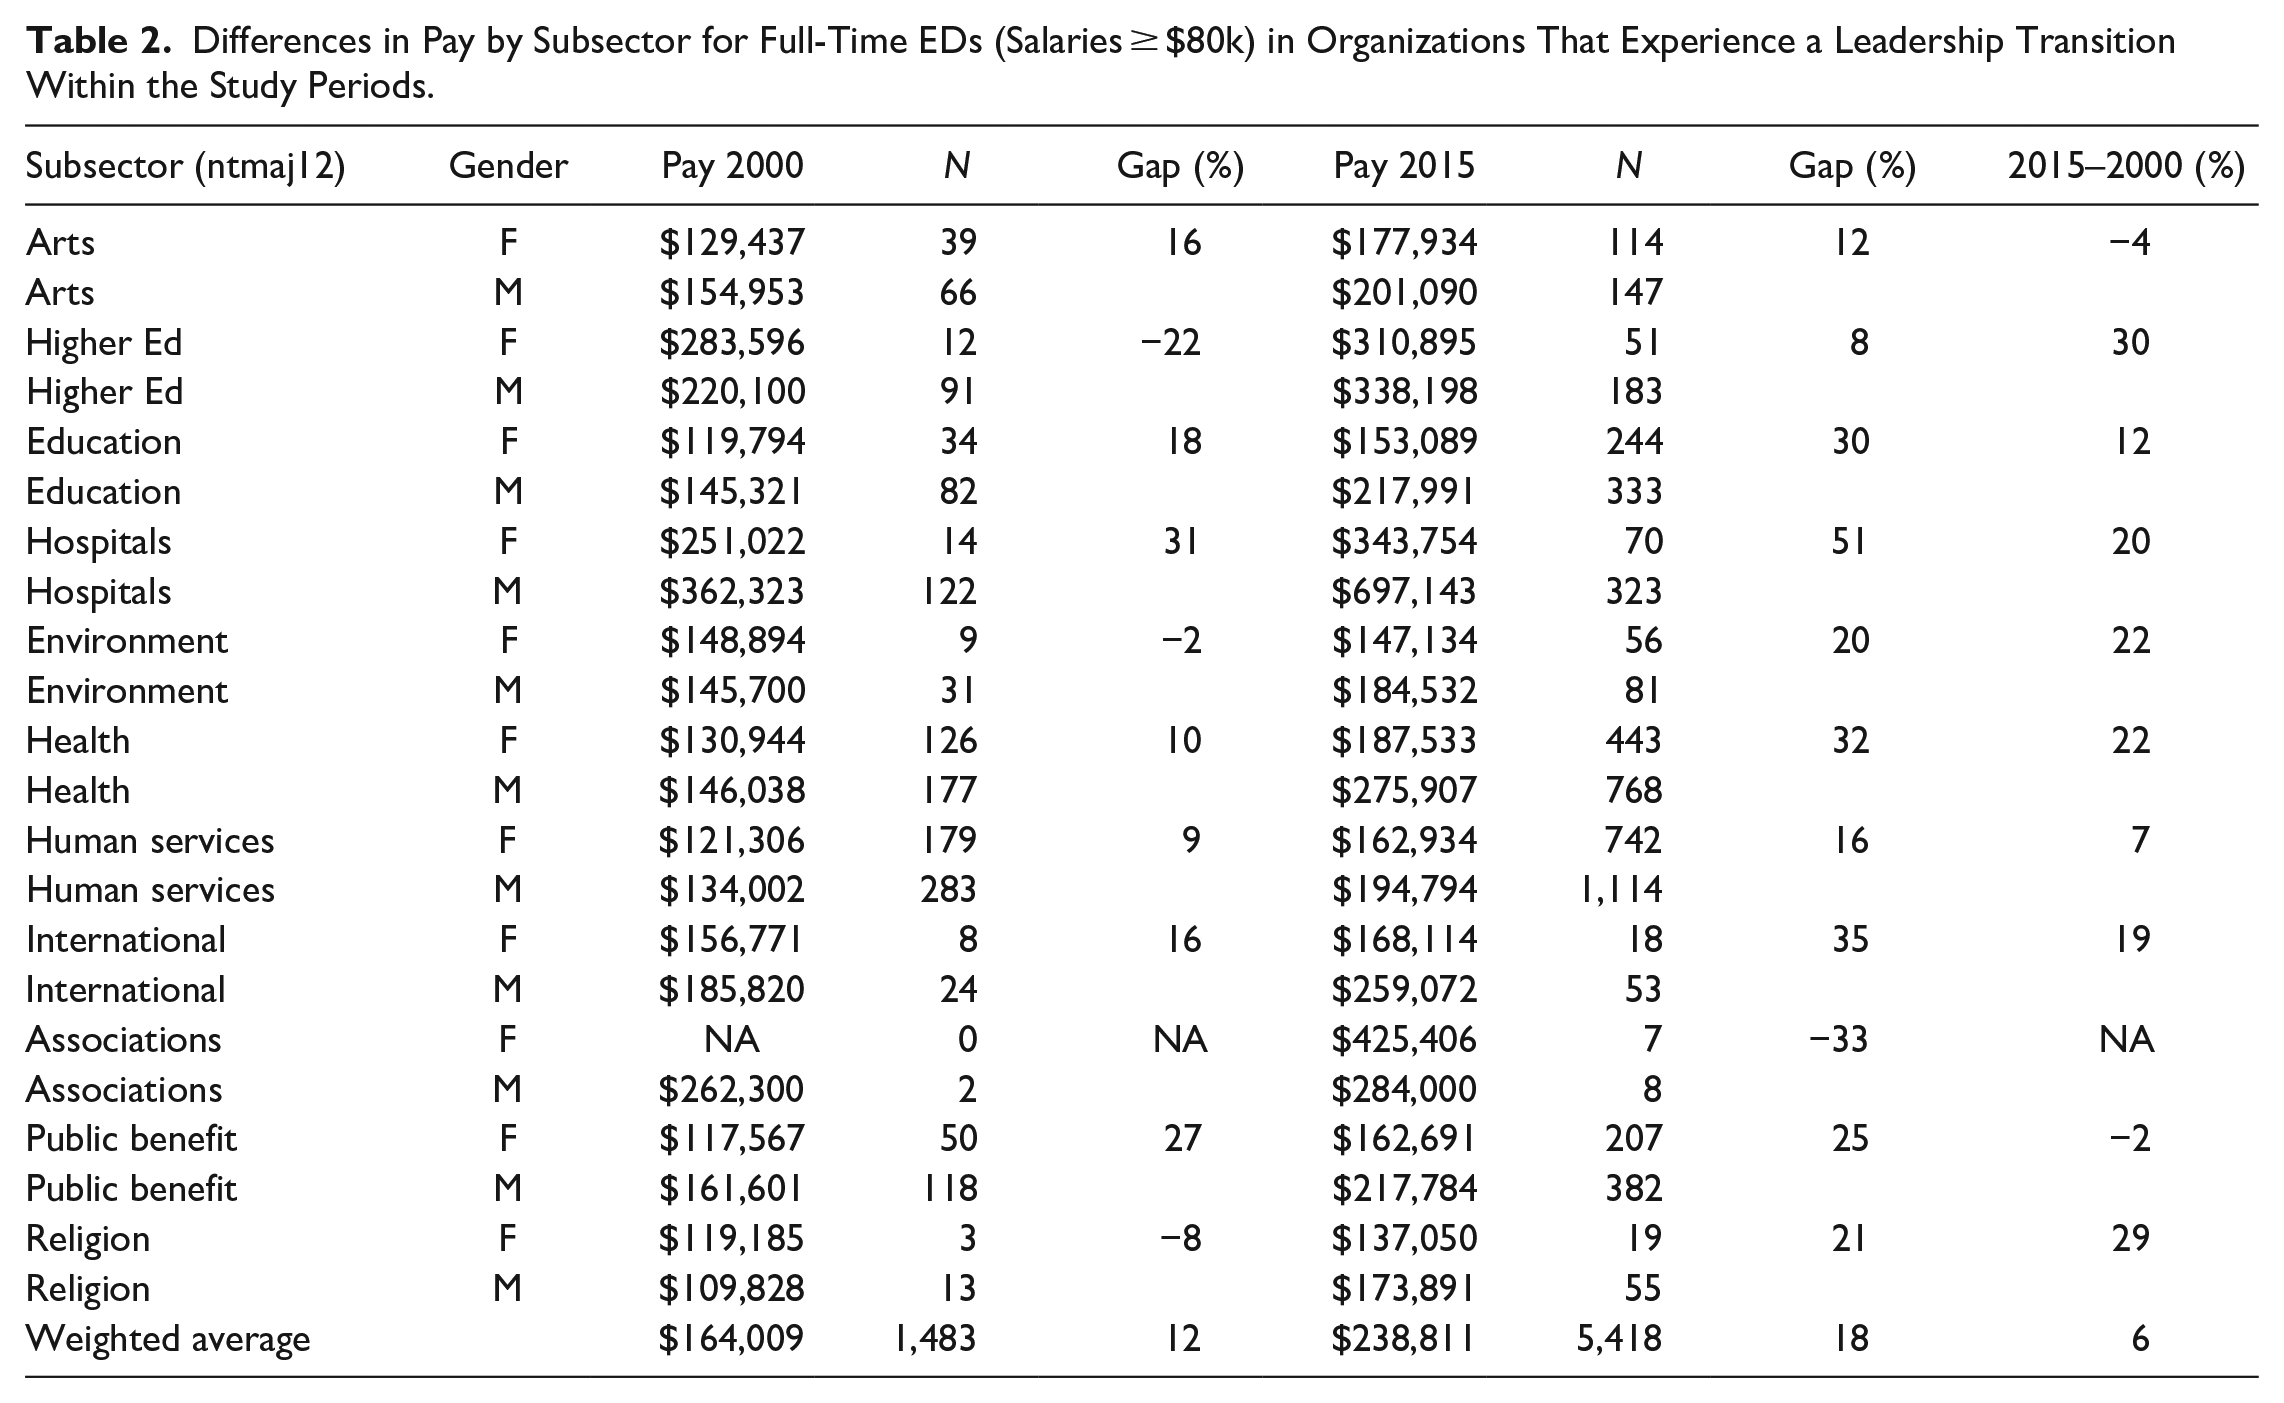
Occupational segregation also leads to a pay gap when women work for different types of agencies than their male counterparts (Alkadry & Tower, 2006). As Rabovsky and Lee (2018, p. 2) note, “socially constructed female traits such as gentleness and empathy and roles such as caring are often valued less than masculine traits and roles, which might prevent women from entering male-dominated college majors or occupations.” Previous research supports this claim by demonstrating that women face “glass walls” when seeking employment in certain departments or types of work that are associated with masculine traits (Miller et al., 1999; Sneed, 2007). This sorting leads to concentrations of female employees in service-oriented organizations or offices (Sneed, 2007). Scholars have noted that redistributive government agencies pay less than their counterparts (Choi, 2015; Sneed, 2007), which comports with research that suggests “occupations traditionally filled by women typically pay comparable workers less than occupations traditionally filled by men” (Faulk et al., 2013, p. 1272). The pay disparity between agencies and women’s overrepresentation in redistributive agency employment explains part of the gender pay gap in the public sector (for examples of this, see Choi, 2015; Sneed, 2007). Similarly, research suggests that executive compensation practices vary significantly by nonprofit subsector (Frumkin & Keating, 2001; Grasse et al., 2014; Oster, 1998). Specifically, arts-based organizations will compensate executives differently than, for example, universities and healthcare nonprofits (see Table 2 below).
Research demonstrates that organization size, measured using financial resources or the number of staff, is correlated to ED and CFO pay (Frumkin & Keating, 2001; Grasse et al., 2014; Hallock, 2002). The relationship between size and compensation exists because “executives in charge of ‘larger’ organizations . . . are responsible for both more people and more resources” (Grasse et al., 2014, p. 379). If women are more likely to lead smaller organizations with more limited resources (Pynes, 2000), the gender wage gap may be partly due to women sorting or being sorted into smaller organizations when they pursue leadership roles. For example, Bertrand and Hallock (2001) studied US firms from 1992 to 1997 and found a 45% gender compensation gap among high-level executives. However, their study suggests that a majority of the gap can be explained by the fact that women in their sample tended to manage smaller companies and were less likely to hold the position of CEO, Chair, or President (Bertrand & Hallock, 2001). While women occupy the majority of senior management positions in nonprofits with limited budgets (less than $250,000), they hold only 23.7% of senior management positions in organizations with budgets between $25 and $50 million and only 16.3% of positions in organizations with budgets over $50 million (Lennon et al., 2013).
Research suggests that employee flexibility is rewarded with higher pay, which may also contribute to pay gaps. Goldin (2014) notes that many professional firms offer higher hourly wages for employees working more than 40 hours a week, resulting in compensation practices penalizing employees who perform well but require flexibility. “Greedy” jobs in industries like corporate law and finance pay premiums for employees who can work unpredictable schedules and travel on short notice instead of paying directly for discrete deliverables. For example, two lawyers might produce two identical deliverables of equal quality. Still, the lawyer providing them during evenings and weekends will get paid a premium for the same deliverable. Goldin argues that these “greedy” jobs drive most of the gender pay gap. It is a subtle form of wage discrimination that rewards loyalty instead of the ability to create value on discrete tasks since loyalty is easier to measure. Industries like pharmacies that have standardized pay across tasks and have built processes that allow employees to hand off work seamlessly have both high pay and high pay equity.
Another example uses data from Uber drivers. The study identifies a small wage gap of about 5%, primarily explained by differences in driver preferences for the time of day they work and the speed they drive (Cook et al. 2018). These results demonstrate that a pay gap does not always arise from differences in wages (the algorithm sets the price of a trip before knowing which driver is assigned), nor is it necessarily discriminatory. The pay gap can operate in more subtle ways, such as the disproportionate weight of caretaking responsibilities in a family and safety concerns that shape preferences regarding the timing of Uber shifts (Blau & Kahn, 1999, 2007).
This study accounts for organizational size and occupational segregation using within-organization comparisons that operationalize the pay gap as a difference in salary for two people holding the same executive position in the same nonprofit. We include individuals from organizations in subsectors focused on the arts, culture, and humanities; environment and animals; human services; public and social benefit; and religion-related subsectors. We exclude two of the largest 501(c)3 organizations from the sample, hospitals and universities, since they tend to be distinct from other charities.
Our research builds on the relevant literature in several important ways. There is notable work on executive directors but little research on nonprofit chief financial officer compensation, except for Hallock (2002) and Roomkin and Weisbrod (1999). This study is the first to estimate nonprofit CFO compensation directly rather than grouping them into a general managerial category. We include these individuals due to the expected homogeneity of their job responsibilities and training, although we acknowledge this expectation is based on the for-profit literature (Collier & Wilson, 1994a, 1994b; Jenkins, 1985; Sellers et al., 2016; Trahan & Gitman, 1995), and samples of CFOs in higher education (McFall, 1999). It is also the first empirical effort that controls for financial performance measures that may affect nonprofit CFO compensation.
We examine gender differences in compensation, controlling for factors beyond those accounted for in prior compensation models (e.g., Bertrand & Hallock, 2001) and using within-organization estimators and samples constructed to isolate leadership transitions within organizations. We also leverage large IRS datasets to develop estimates from representative and meaningful samples (Frunkin & Keating, 2001; Grasse et al., 2014; Hallock, 2002). These approaches allow us to develop a robust measure of a discriminatory component of the pay gap, defined as differences in pay for male and female executives doing the same work (same title in the same organization). Results shed light on how hiring and compensation processes can help explain the observed gap.
Hypotheses
The literature on executive compensation suggests that female EDs and CFOs earn less than their male counterparts, even when holding constant organizational factors such as size, financial performance, revenue capture, and other resources. Consequently, the primary hypothesis of the study is the pay gap hypothesis:
The skill sets of successful executive directors and chief financial officers differ. There is no single, inclusive skill set for executive directors due to the diversity of the nonprofit sector (Millesen & Bies, 2007). However, this may not be true for chief financial officers. Private sector research indicates that chief financial officers have very similar job responsibilities and training (Collier & Wilson, 1994a, 1994b; Jenkins, 1985; Sellers et al., 2016; Trahan & Gitman, 1995). Compensation committees generally set, manage, and change executive pay; these tend to operate according to the general theory of compensation (Hoitash et al., 2012). Similar qualifications and backgrounds may limit the potential bias of compensation-setting under these circumstances. Consequently, the second hypothesis is:
Using newly available data, we can more precisely isolate the component of the executive pay gap that represents unequal pay for the same work in leadership roles. We are interested in the persistence of this gap and whether it has changed. We introduce a robust methodology that produces a consistent measure of the pay gap, offering a way for the sector to benchmark whether the gap is growing or shrinking over time.
We do not attempt to produce models designed to explain variance in executive pay. Therefore, we do not include measures of the levels of education and years of experience of individual EDs or CFOs. Instead, we focus on executive hiring transitions because they allow us to observe how individuals’ compensation differs when performing the same job. A within-organization pay gap would still violate the principle of equal pay for equal work regardless of credentials.
Similarly, gendered differences in professional or managerial experience are not exogenous. They may be influenced by the same social norms—gendered notions of leadership that result in fewer opportunities for women to receive mentorship, early-career managerial experience, or be otherwise directed toward leadership roles. Women are also more likely to have career gaps because of caretaking responsibilities. Thus, past professional experience can arguably be shaped by implicit gender bias, so including such measures as control variables would result in an underestimate of the pay gap because we are “explaining” some of it by including variables that are endogenous to gender. As a result, we posit that our estimate of the pay gap for pairs of individuals holding the same leadership positions in the same nonprofits, which omits this professional experience, will result in a more accurate representation of the actual discriminatory gap. More so, it provides a consistently replicable methodology that can be utilized with public data to measure changes over time and across geographies or industries.
Data and Methods
Gender compensation studies can be challenging to implement because compensation is typically private information, making data hard to acquire. Many studies use self-reported measures of pay that are prone to bias or may not generalize well. This study leverages executive compensation data that is part of mandatory annual reporting on IRS 990 tax forms. As a result, it is a representative sample of tax-filing 501(c)3 organizations, drawn from official tax filings often prepared by accountants and reviewed by outside firms, reducing concerns about intentional misreporting.
We estimate models using two large-scale data panels that cover discrete periods: the National Center for Charitable Statistics (NCCS) 1998 to 2003 digitized database and more recent electronic IRS 990 filers from 2009 to 2019. 2 We selected these periods as we believe they are the most complete publicly-available records of charity executive compensation. 3 Except for religious organizations, all 501(c)3 nonprofits that exceed $25,000 in total revenue were required to file form 990 returns until 2009, with the revenue threshold raised to $50,000 thereafter. We estimate the gender pay gap in 2000 using the digitized panel and the year 2015 using the e-file panel, offering a unique perspective on the change in pay over this period. 4 We estimate the total pay gap across organizations. This includes differences that may be a function of sorting male and female executives into organizations and a pay discrimination component arising from different pay for the same work within organizations. This triangulation approach offers unique insight into the nature and dynamics of the executive pay gap in the nonprofit sector.
The Full Executive Pay Gap: Cross-Sectional Models
Using a cross-sectional approach, we first estimate the total pay gap of male and female executives across organizations. These models include only newly hired executive directors and chief financial officers while excluding hospital and university subsectors, which are outliers. These basic models capture the average pay differences for male and female executives across organizations among these new hires:

Compensation represents the total compensation of executives reported on the 990 forms; the period t+1 represents pay in the year following the hire of a new executive (see below for more data). All compensation has been adjusted to 2020 dollars (natural log). We include only organizations with a single individual in each executive role and only organizations with total compensation over $80,000 to ensure we compare full-time executives. Although leadership transitions occur in different calendar years, this is still a cross-sectional estimate. It represents all new hires in each panel; each executive appears only once in this estimate (the first full year in their new executive role). Table 1 shows pay gaps for both executive directors and chief financial officers in both periods.
Unconditioned Gender Pay Gaps Among New Hires (Logged 2020 Dollars).
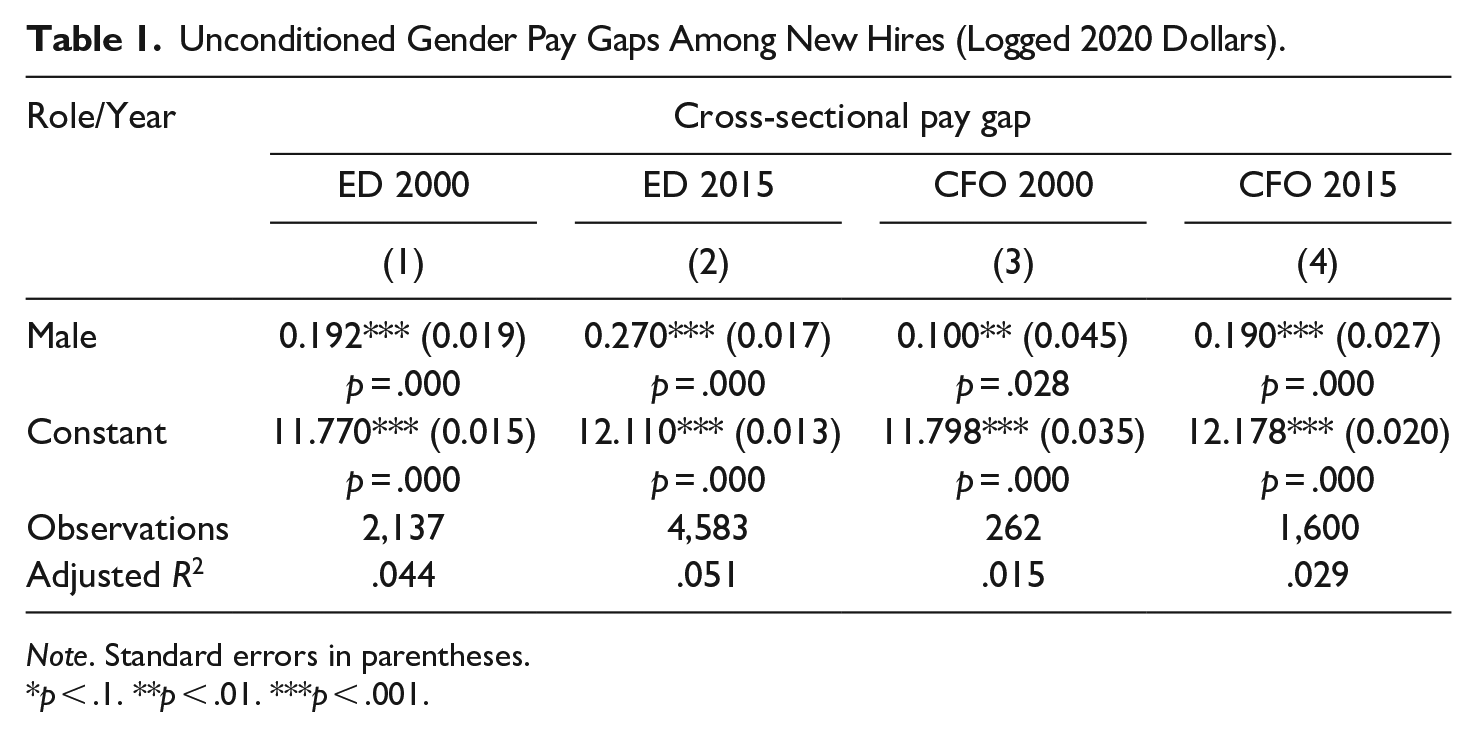
Note. Standard errors in parentheses.
p < .1. **p < .01. ***p < .001.
Cross-sectional models (Table 1) provide information about average salary differences for these executives that arise from the sorting processes that lead men and women to different types of organizations (size and subsector). We exclude organizational controls; we are not trying to explain the pay gap away, only to measure it in raw form (gender is correlated with organization size, for example, so controlling for size will bias the gap downward). Table 2 displays salary differences by subsector (major NTEE category).
Differences in Pay by Subsector for Full-Time EDs (Salaries ≥ $80k) in Organizations That Experience a Leadership Transition Within the Study Periods.
Estimating Pay Discrimination: Replacement Compensation
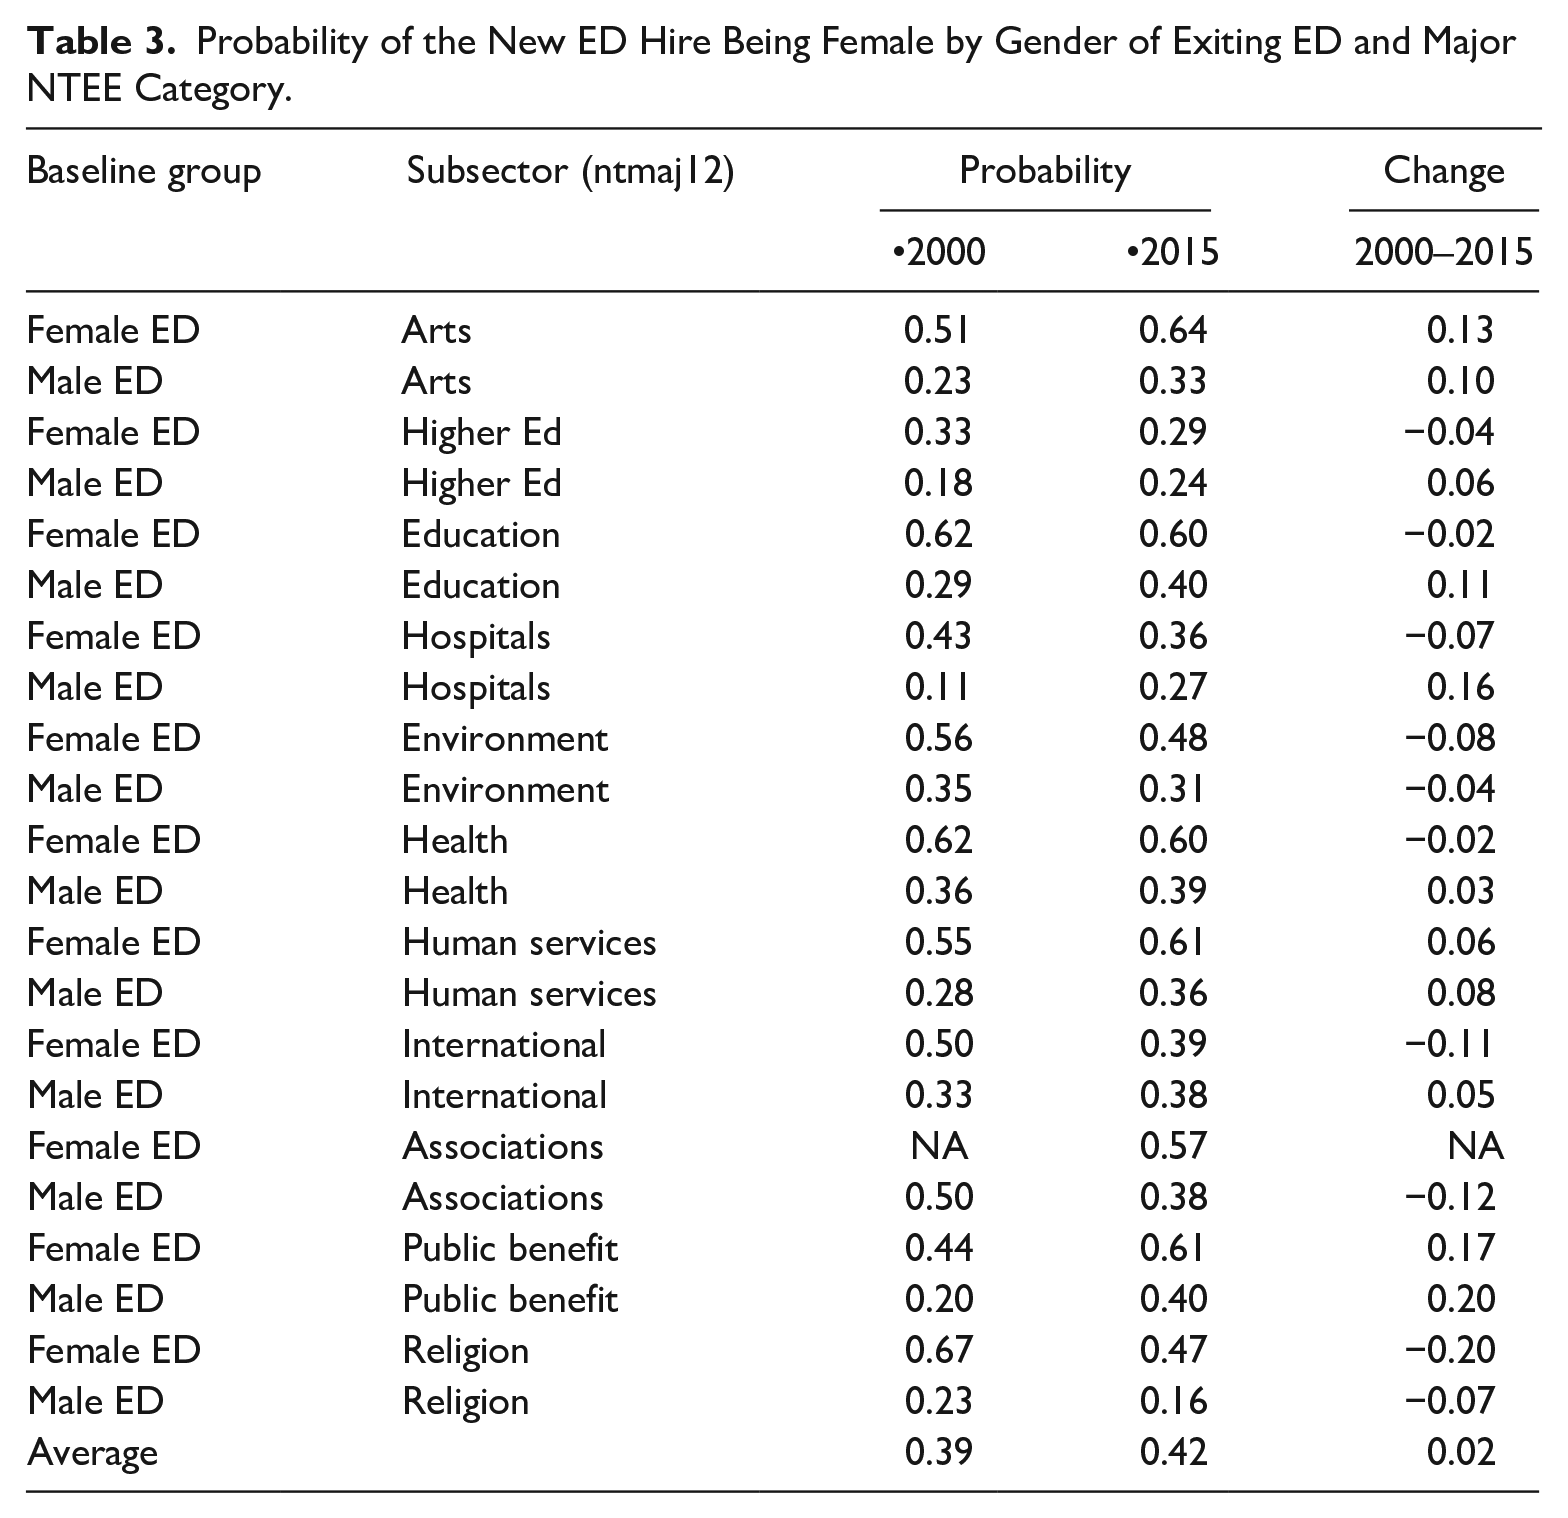
The nonprofit executive pay gap is largely caused by sorting processes that distribute male and female executives across organizations. These may be due to the self-selection or steering of female candidates, causing clustering in their distribution by size or industry (see Table 3), or to glass ceilings that prevent women from choosing the type of organizations they desire to lead. As demonstrated above, this process explains a substantial portion of executive compensation differences across genders (Barbeito & Bowman, 1998; Frumkin & Keating, 2001, Hallock, 2002; Oster, 1998; Roomkin & Weisbrod, 1999). The pay discrimination component, which arises from how the hiring committee determines the salary level during the hiring process, is harder to estimate. We use models that leverage within-firm wage differences that are observable only during executive hiring transitions. The models isolate cases where nonprofits hire new executive directors and compare the salaries of incoming and outgoing directors to estimate the discriminatory component of the total pay gap.
Probability of the New ED Hire Being Female by Gender of Exiting ED and Major NTEE Category.
Utilizing wages of ingoing and outgoing directors allows us to eliminate differences due to sorting since we observe the compensation of men and women holding the same position in the same organization. Since the estimate is based upon variance over time within the same organization, it isolates pay discrimination from the sorting and selection, i.e. men and women lead different types of organizations, as well as tenure in an organization to explain the gender pay gap.
This identification strategy relies on organizational leadership transitions from the entry of new EDs or CFOs. We identify new hires utilizing changes to the names of the executives listed in Part VII Compensation of Officers, Directors, Trustees, Key Employees, Highest Compensated Employees, and Independent Contractors of the 990 form. If the name of the executive director or chief financial officer changed from year t-1 to t, we classified an individual as a new hire. In our compensation models, we intentionally omit time-period t and instead focus on period t+1, thereby avoiding the year where two directors likely served for part of a fiscal calendar and thus reported partial salaries (as seen in Figure 2).
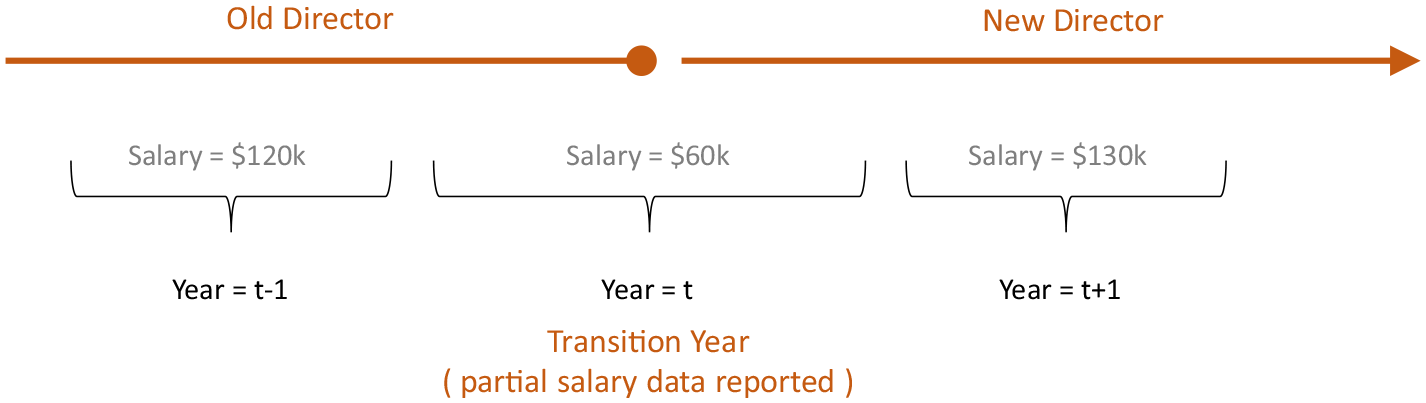
Identifying leadership change.
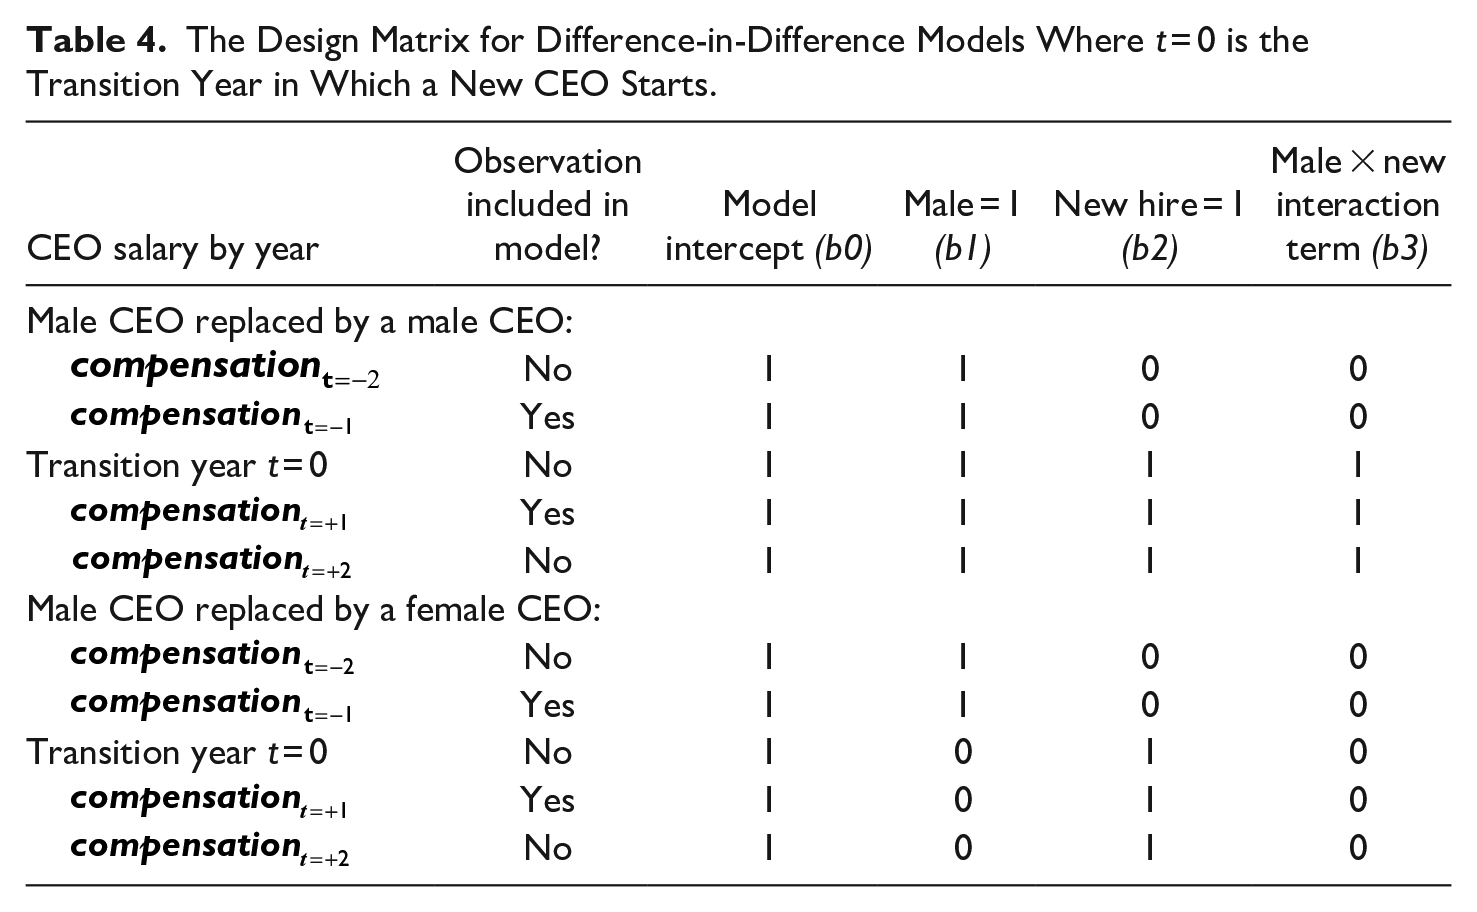
Although we have multiple observations of compensation in our nonprofits, models rely only on years around executive transitions. These cases allow us to observe how compensation varies between outgoing and incoming executives, specifically focusing on gender differences. What happens to pay as a nonprofit replaces a female ED with a male ED versus when a nonprofit hires another female? What about cases where organizations replace a male ED? We expect compensation to be higher for men, so we use females as the reference group and males as the “treatment” group in the binary gender variable. Similarly, we formulate a binary change in position variable where the outgoing director is coded as zero and the incoming director is coded as one. Table 4 demonstrates the organization of our data:
The Design Matrix for Difference-in-Difference Models Where t = 0 is the Transition Year in Which a New CEO Starts.
Difference-in-Difference Models
Difference-in-difference models can account for selection related to differences in both initial pay rates and the likelihood of hiring a new director of a different gender. In a subsector with a small proportion of female board members, a female is unlikely to replace a male, for example. Given the nature of the work in some organizations with female executives, it might also be unlikely that they recruit a male director. In other instances, such as in some religious organizations, a male director might be less likely to be replaced with a female director.
If these hiring processes are correlated with organizational size and salary structure, failing to account for baseline conditions would bias the pay gap estimate. The difference-in-difference model can account for pre-treatment differences under certain conditions. Compensation practices for new directors in the “control” group (those nonprofits that hire a new director with the same gender as the outgoing director) must be a fair representation of the pay increase we expect to observe for new executive hires, independent of gender differences. If we observe a 10% recruitment premium for new directors in the control group, we expect that a similar premium would also be necessary to recruit new directors in the treatment group. This method of capturing the secular trend allows for the generation of a counterfactual salary, an estimate of what incoming female EDs would get paid if recruited in the same manner as male EDs. The pay gap is a function of these implied counterfactuals (as seen in Figure 3 below).
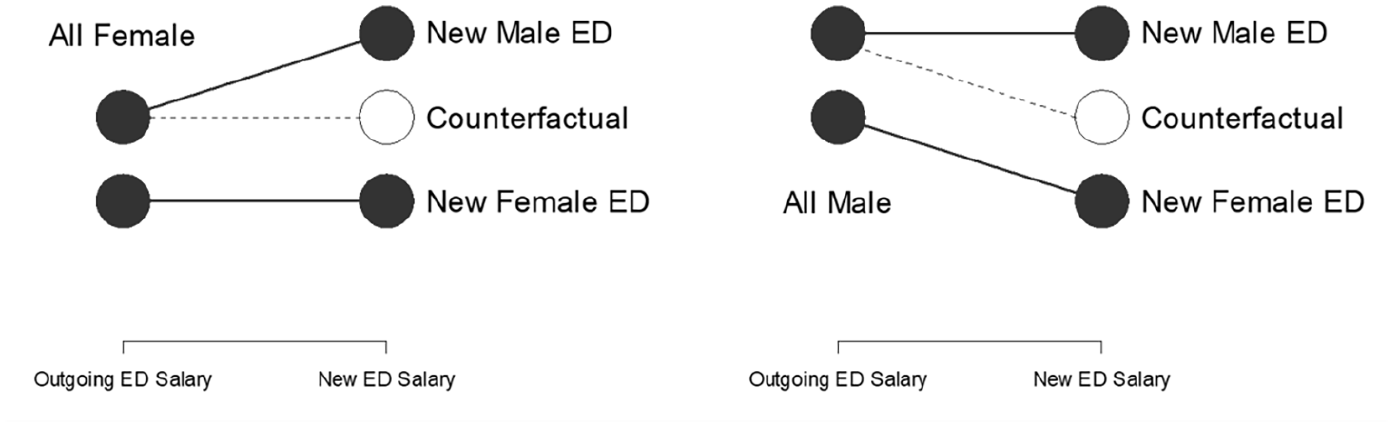
Counterfactuals in difference-in-difference models.
The treatment group’s counterfactual represents what men would get paid absent a gender pay gap. The gap is identified by comparing this expectation to the observed reality. The model is estimated as follows:

The treatment group represents nonprofits hiring an incoming male ED, and the control group represents nonprofits hiring an incoming female. The coefficient b3 represents the estimated pay gap for female executives (or premium for males). The study group salary averages are estimated in the model as follows:
• Control group at t = −1: b0
• Control group at t = +1: b0 + b2
• Treatment group at t = −1: b0 + b1
• Expected salary for treatment group at t = +1: b0 + b1 + b2
• Actual salary for treatment group at t = +1: b0 + b1 + b2 + b3
The model is run separately for the subsample of all organizations with a female executive at time t-1 (replaced by either a male or female) and those with a male executive at time t-1 (replaced by either a male or female). The matrix X represents a set of organizational controls.
As always, difference-in-difference models rely on the presence of parallel trends. While we cannot demonstrate parallel trends before and after our study, as the analysis has utilized the only publicly available compensation data for 501(c)3 charities, our measure (inflation-adjusted logged compensation) indicates parallel trends in male and female compensation among incoming and outgoing executives during both periods analyzed below.
Dependent Variables
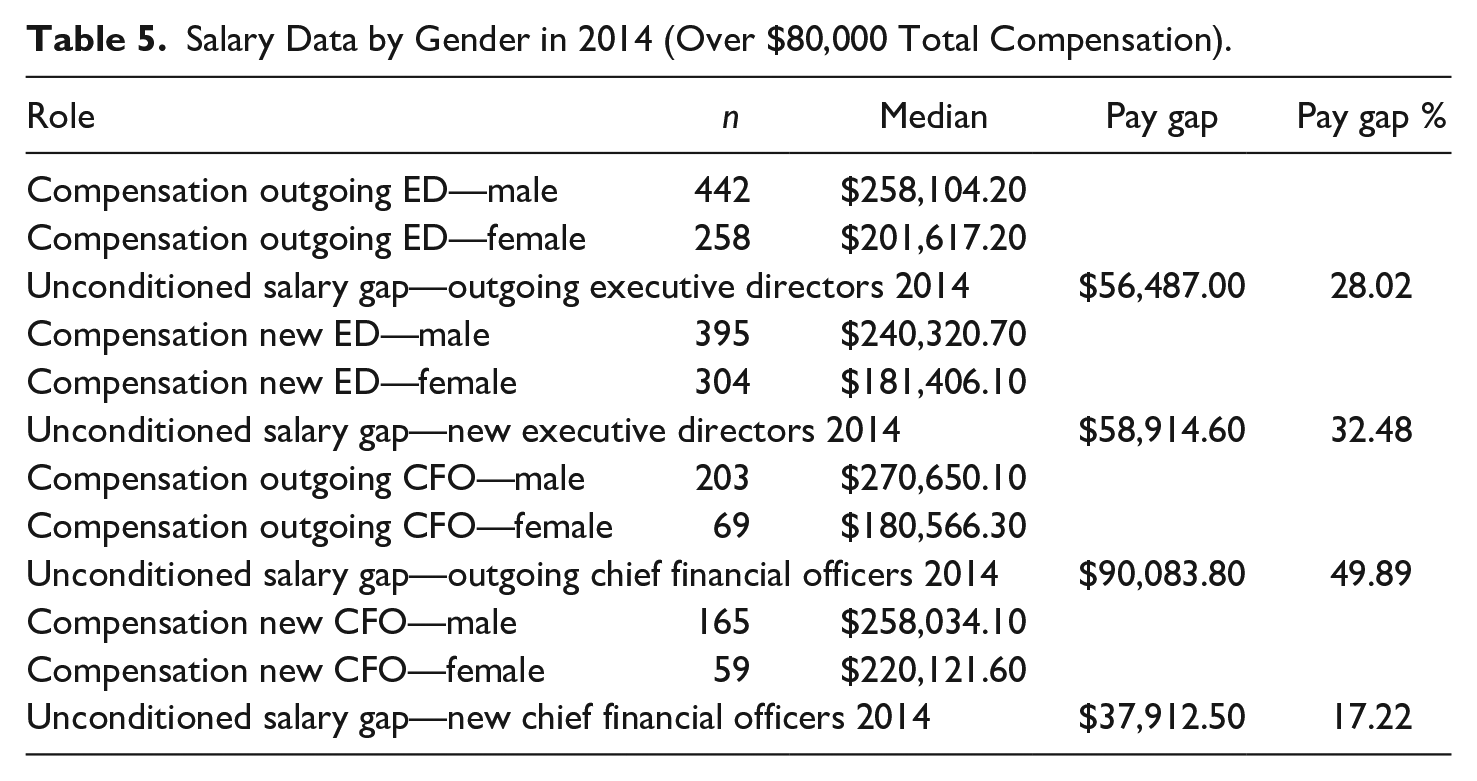
Our 2000 models utilize the reported total compensation, available in Part VII of Form 990. Here, total compensation includes benefits, bonuses, and deferred compensation. While failing to include benefits may underestimate real compensation, we also recognize that benefits may introduce noise in the data because the generosity and cost may vary by region (Roberts, 2004). An unconditional salary gap is apparent when examining the descriptive statistics on total compensation among outgoing and incoming executives from hiring decisions in 2014 (Table 5).
Salary Data by Gender in 2014 (Over $80,000 Total Compensation).
Due to changes in the Form 990, our more recent models use slightly different measures of total compensation. We rely on reported compensation (column D, comprised of wages and tips, taken from W-2/1099-MISC as above), as well as pay from related organizations (column E) and the estimated amount of other compensation from the organization and related organizations (column F). Differences in the samples and dependent variables may influence comparisons between periods.
Independent Variables
The gender of EDs and CFOs was coded using an API provided by the US Census Bureau and the Social Security Administration; this matches first names to a national birth certificate database and returns the probability of gender based on this name. 5 Although this approach introduces some misclassification, most names have a consistent gender association, offering a robust method that introduces little measurement error. Much like other analyses that have utilized self-reported survey data (Gibelman, 2000; Gray & Benson, 2003), we expect the first names of directors and leaders to be accurately reported on the 990 tax forms.
We have restricted the data to those cases, making the equivalent of $80,000 or more to capture full-time employees (inflation-adjusted to 2020 USD). We also exclude individuals in the hospital and higher education subsectors; university presidents and hospital CEOs are distinctive edge cases that differ significantly from typical nonprofit leadership positions. 6 Although 990 data contain some entry errors and inconsistencies, various data cleaning techniques have been utilized to minimize the resulting measurement problems. 7
Although organizational size could be measured as either total revenues or expenses, we employ the latter due to the greater volatility of nonprofit revenues. The executive director models include an additional measure of organizational size to capture the scope of the managerial responsibilities of nonprofit EDs—the total number of employees in the organization. This measure accounts for staff size and reflects the scope of the organization’s operations, providing more information than total expenditures would if used as the sole measure of size. The CFO models do not include this additional size measure because CFOs do not have the same managerial purview as executive directors.
We include several additional controls likely to influence ED and CFO compensation. First, it is critical to control for the generation of support and organizational expenses, as these are foundational duties of EDs. As such, the ED models include measures of the prior year’s savings indicator, program service expenses, and the percentage of revenue to the organization from several sources: direct public support, government grants, voluntary contributions, and program service revenue. The savings indicator measures whether an organization has gained net assets over the fiscal year, indicating financial vitality, and is calculated as the difference of total revenues and expenses, divided by total expenses. Values over one, which can indicate a capital campaign, some expense anomaly, or data entry error, have been re-coded as one to prevent edge cases from asserting leverage in the model. Finally, as a control for regional cost of living differences, the models include measures of income in the organization’s zip code.
The CFO models include a slightly different set of compensation-related managerial control variables. We control for organizational financial performance, as a CFO’s primary duty is to manage the organization’s financial health. We include the prior year’s defensive interval, savings indicator, and debt ratio. These represent three critical dimensions of nonprofits’ financial position, as noted by Greenlee and Bukovinsky (1998) and the important principles of capacity (liquidity as captured by defensive interval) and sustainability (debt capacity) outlined by Bowman (2011). The defensive interval indicates the number of months an organization could meet its expenses if forced to rely only on current liquid assets. The savings indicator is defined the same as in the ED models. The debt ratio measures the prior year’s total debt compared to total assets. Finally, as a control for regional cost of living influences, the models include measures of income.
Table 6 summarizes estimates from our regression models, including the coefficients of interest, their statistical significance, the data utilized, the nature of the sample included in the models, and model identification. Full regression results can be found in Appendix Tables A2 through A5.
Summary of Model Results, Data Sources, Samples, and Identifications.
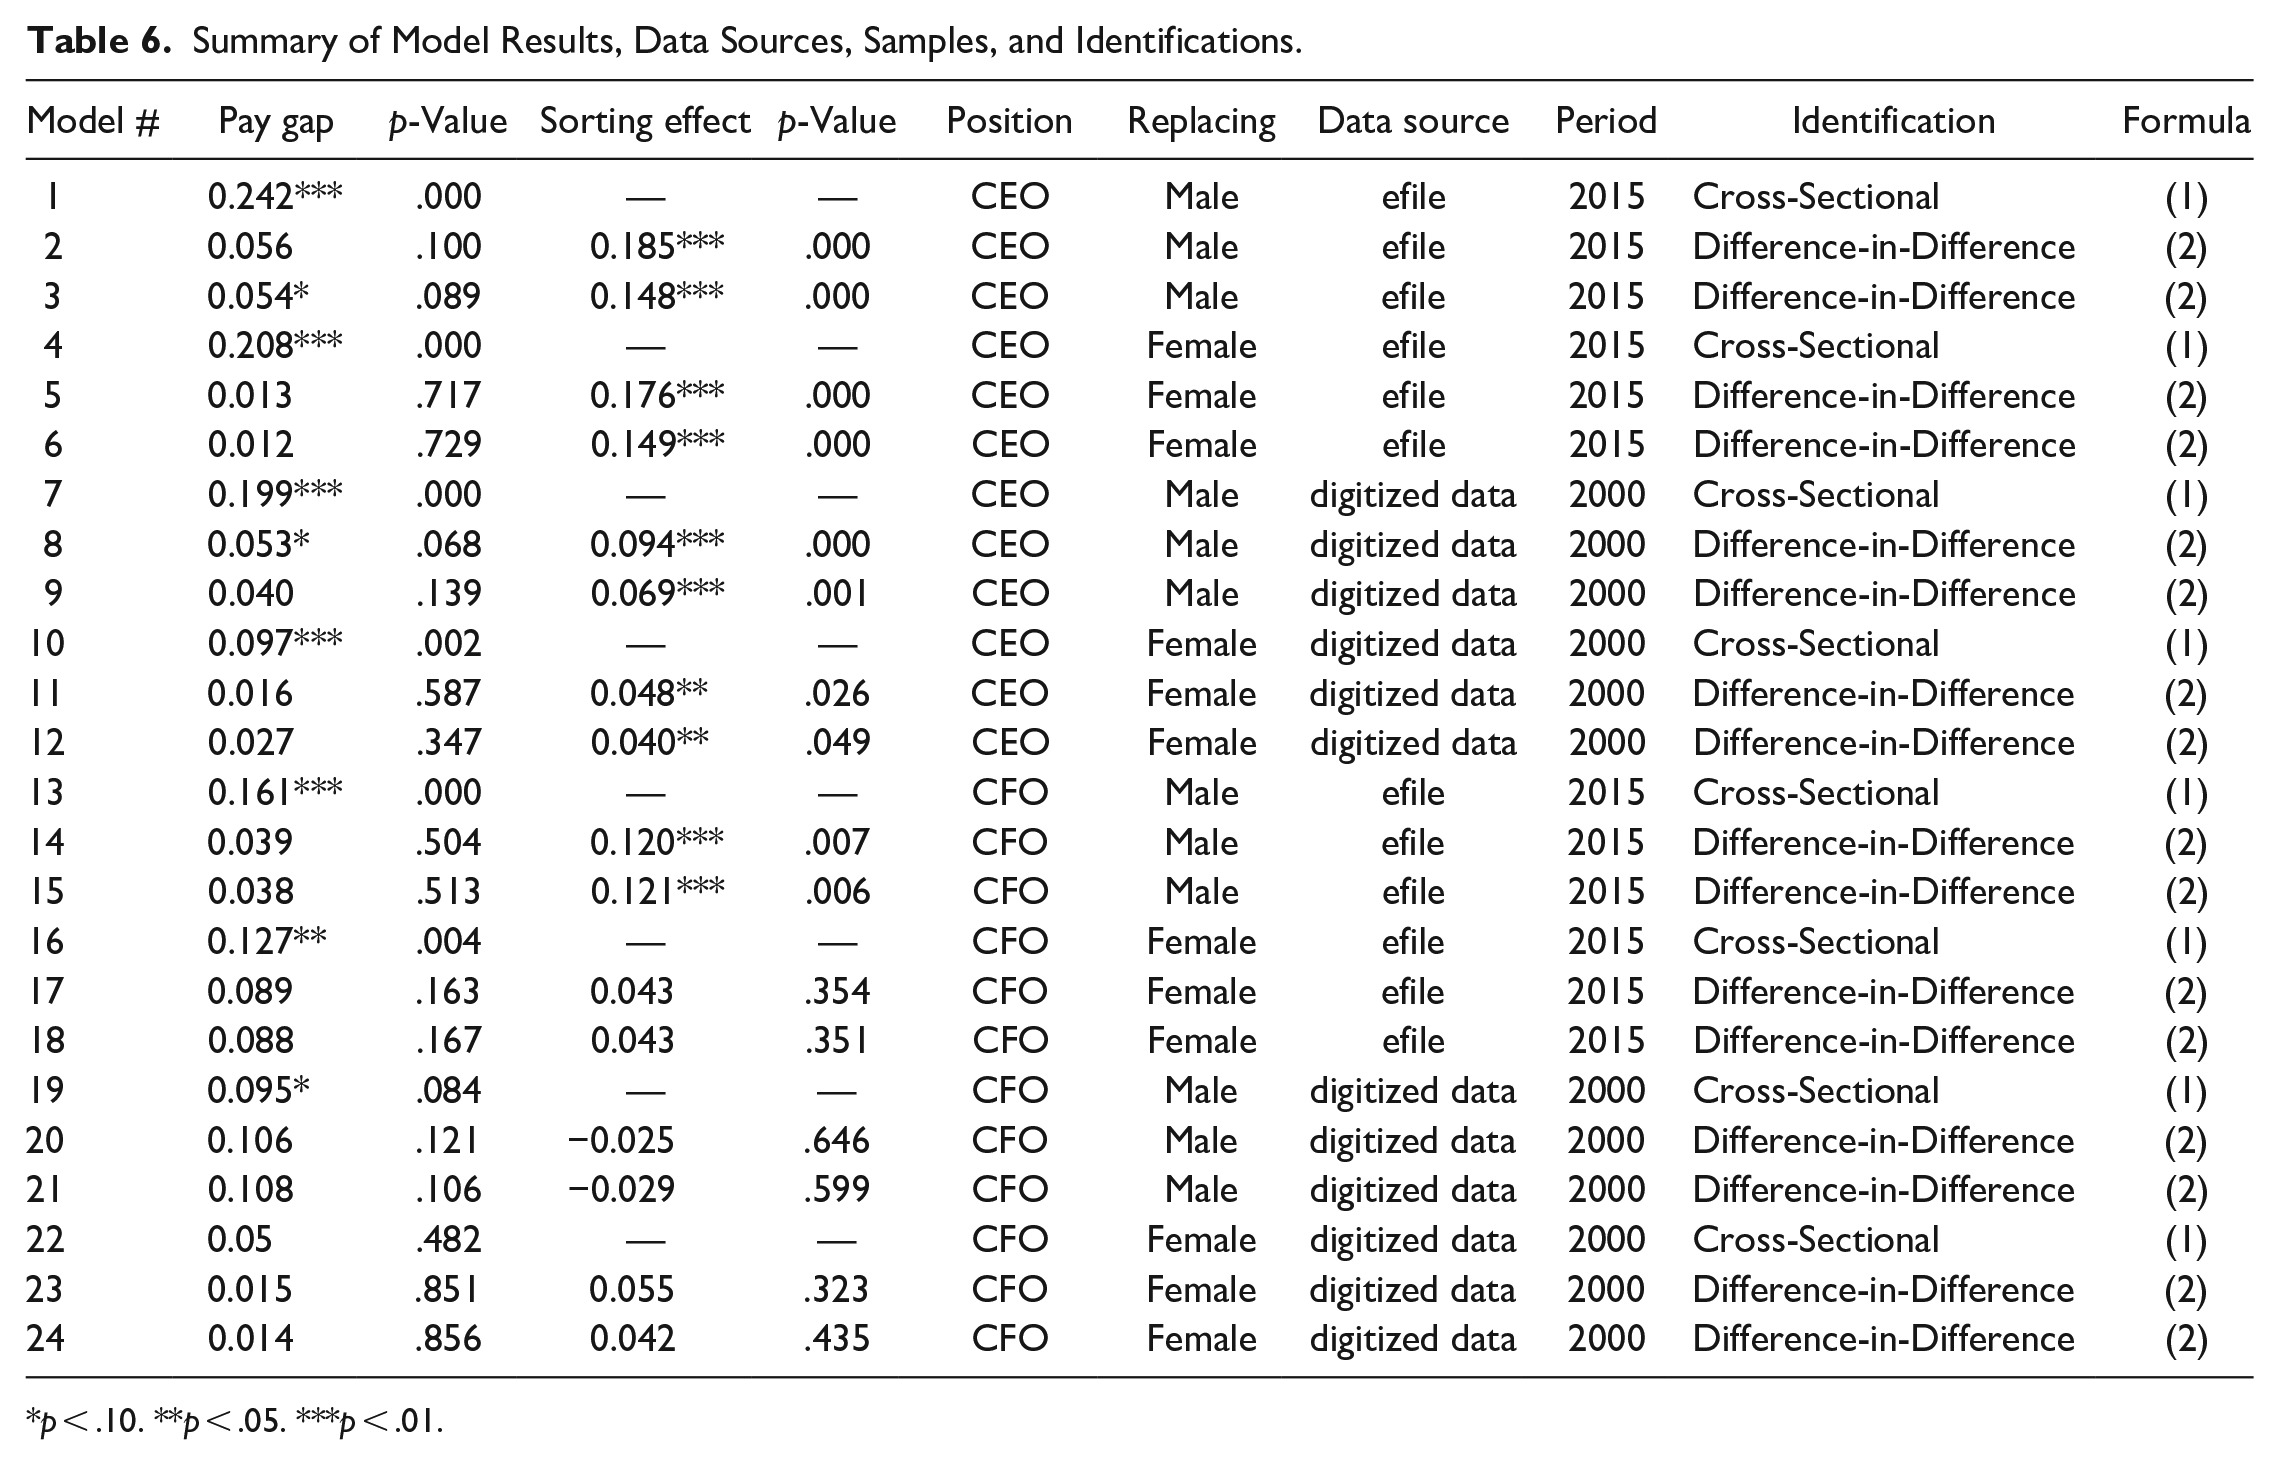
p < .10. **p < .05. ***p < .01.
Cross-Sectional Results
Our cross-sectional results (rows 1, 4, 7, 10, 13, 16, 19, 22) in Table 6; full results in Appendix Tables A2 and A3) analyze the incoming officers of nonprofit organizations with executive transitions reporting over the equivalent of $80,000 (equivalent in 2020 USD) of compensation. Results include organizations in the periods centered on the years 2015 and 2000. Models examining our executive directors indicate that males were compensated more than their female counterparts. This advantage was 24.2% in male-replacing organizations from 2015 and 20.8% in female-replacing organizations during the same period; it was 19.9 and 9.7%, respectively, in the same organizational groups from 2000. While the coefficients differ in scale, our reliance on electronic filers in models from 2015 (approximately 65% of all 501(c)3 organizations) limits our ability to use these coefficients to make precise judgments regarding the relative magnitude of the gender gap over time. It is worth noting that these effects persist even controlling for the standard of living in the organization’s location and size.
When looking at cross-sectional models of chief financial officers’ compensation (rows 13, 16, 19, and 22 in Table 6), gender is significantly associated with compensation, favoring male CFOs. We find differences of 16.1 and 12.7% in organizations replacing males and females, respectively, from 2015, and 9.5 and 5% additional compensation for males in the 2000 period, although the coefficient for gender in our final cross-sectional model is not statistically significant.
Difference-in-Difference Model Results
Cross-sectional models are challenging as they compare the compensation of individuals working across organizations. Although covariates are often included to control for organizational characteristics, there is still potential bias in coefficients representing gender differences arising from sorting across organization types. As mentioned above, the difference-in-difference approach leverages changes in salary, isolating within-organization salary gaps between incoming and outgoing directors; this facilitates the identification of the differences likely attributable to gender.
The difference-in-difference approach partitions the variance using group means. The data is divided into a “treatment” group represented by the organizations where the incoming directors are male and a “comparison” group where the incoming directors are female. Group-level compensation means are calculated before and after the leadership transitions, and the change observed in the pay of incoming male directors is used to calculate a counterfactual that represents what women would make if this change in compensation mirrored that of their male peers. The coefficient on the interaction of the variables male and new hire represents the difference between the observed salary of new female executives and the counterfactual in which they received the same pay bump as incoming male directors.
Table 6 reports the premium awarded to male new hires relative to their female peers. Separate models examine cases in which the outgoing director is either male or female. We examine two coefficients of interest. The first is an interaction term of being both new hire and male; this represents the pay premium of new male executives (the pay gap experienced by female executives). It is summarized in the column “Pay Gap” in Table 6 and labeled “Male Hiring Treatment” in Appendix Tables A2 through A5. The second coefficient represents the pay premium in organizations that hire male replacements, regardless of the prior executives’ gender. This coefficient, summarized in the column “Sorting Effect” in Table 6 and labeled “Male Hired Group” in Appendix Tables A2 through A5, isolates the difference in compensation between organizations that eventually hire a male executive and those which do not.
Our difference-in-difference models consistently demonstrate effects that are likely to limit the compensation of new female executives. This gap can be due to either pay gaps or sorting effects. In the case of executive directors, significant pay gaps are observed in models 3 and 8, representing pay gaps of about 5.3%. These effects represent the gap between observed female compensation and the counterfactual; they can also be interpreted as the compensation penalty experienced by female hires relative to their male peers. We note that this coefficient is positive in each of our models, although it is not statistically significant in models focused on female replacement. This finding is consistent with slightly higher average pay for males but substantial variations in pay among new hires.
We also observe significant sorting effects in our executive director models (2, 3, 5, 6, 8, 9, 11, and 12). These represent the difference in compensation between all of the organizations’ executive directors, grouped by the gender of the replacement hire. Coefficients indicate that organizations hiring males offer more compensation than those which do not. Examining our models with control variables, we observe the positive coefficients of 14.8% in Model 3, 14.9% in Model 6, 6.9% in Model 9, and 4% in Model 12. These coefficients indicate that, on average, male executives enter organizations offering more executive compensation. Averaging all of the pay gaps and sorting effect coefficients in our executive director difference-in-difference models gives a sense of the total compensation penalty for new female hires, approximately 16%, due to both the discriminator and sorting elements of the gap.
Figure 4 visually demonstrates the size of compensation differences using group salary figures calculated by centering covariates and taking the antilog of the study group means. The pay gap for female executive directors replacing male EDs is then calculated as their salary compared to what they would be making if they were male.
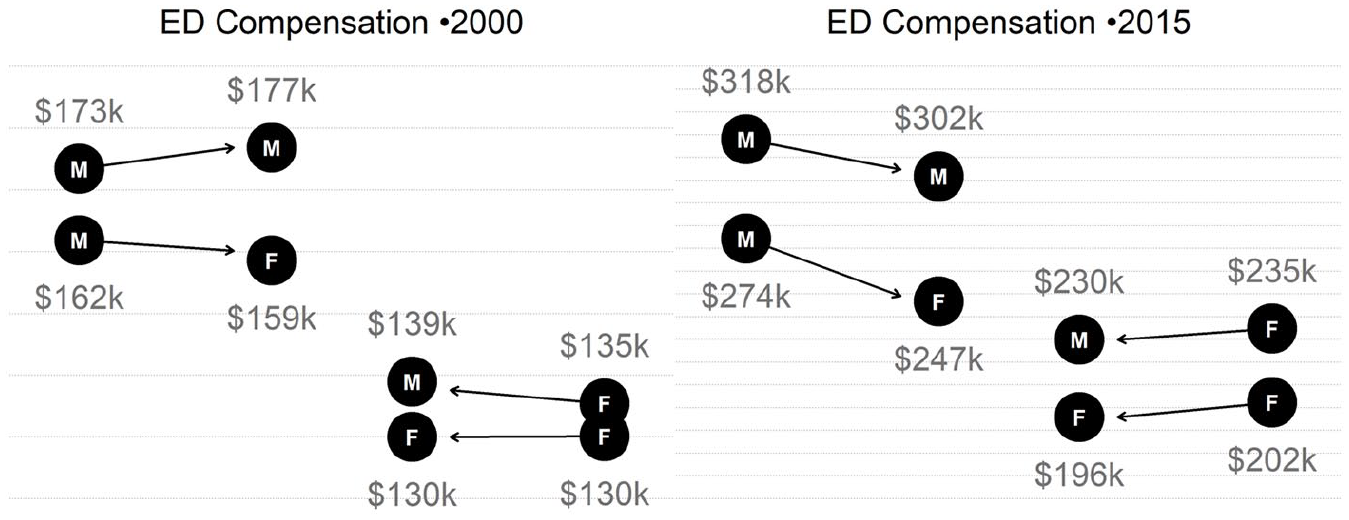
Group-level salary averages (difference-in-difference model estimates) among executive directors: adjusted to 2020 dollars.
We can look to the right-hand side of Figure 4 for an example of the effect of both sorting and discriminator elements of the pay gap. The top two groupings examine organizations with male outgoing EDs. We can see a $55K gap in the salaries of the male and female replacements. Both males and females earn less than their outgoing directors, but females are penalized more than males (10% as compared to 5%) while also replacing individuals with lower salaries (about $44K less).
The results from the difference-in-difference models examining CFOs are consistent with premiums for male hires in all models but fall short of statistical significance (rows 14, 15, 17, 18, 20, and 23 of Table 6; full results in Appendix Tables A4 and A5). Positive coefficients for sorting effects are also present in six of eight models, although only statistically significant in the case of male-replacing organizations from 2015. The direction of our compensation gap and sorting coefficients suggests a pattern consistent with CEOs, although more observations are required to improve the precision of model estimates. Figure 5 illustrates the differences in salary among CFOs in both periods calculated with our estimates, although the results are only suggestive due to the inconsistent statistical significance of model coefficients.
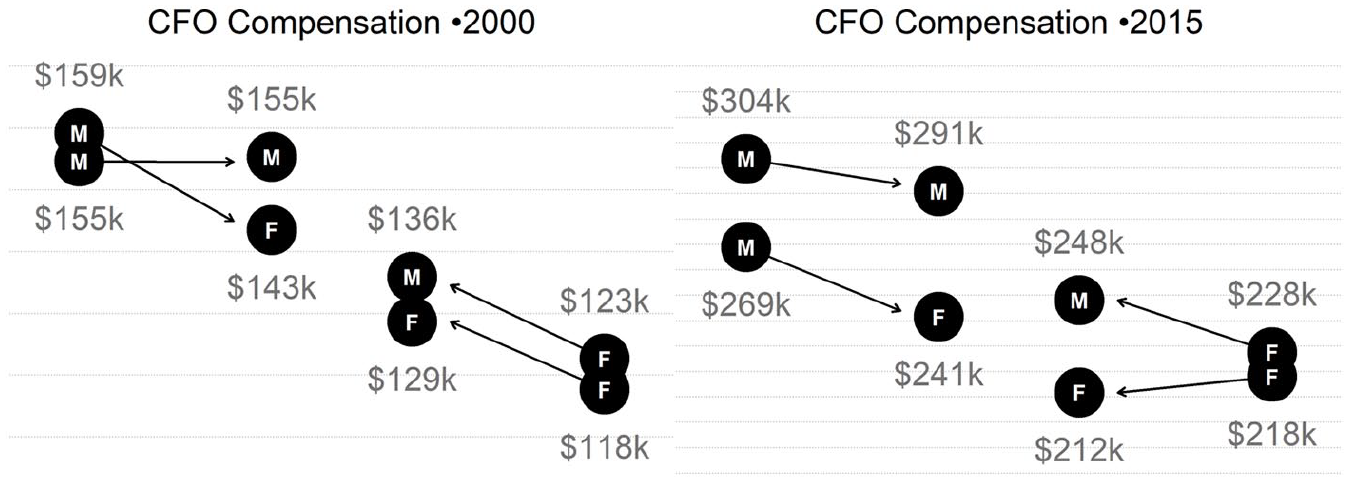
Group-level salary averages (difference-in-difference model estimates) among chief financial officers: adjusted to 2020 dollars.
Our CFO models include measures reflecting the organization’s financial health, including financial reserves, asset growth, and debt. None of these indicators are associated with CFO compensation in a substantively significant way, providing no evidence of performance-related compensation for the CFOs of charitable organizations.
Conclusions
This study offers new insight into the dynamics of the gender pay gap in the nonprofit sector in several significant ways: (1) it focuses on executives to keep measures consistent for comparative purposes, (2) it uses transitions to separate within-organization pay discrimination components of the gap from across-organization sorting of male and female executives, and (3) it uses two distinct compensation panels to examine pay disparity over time. We offer a robust estimation strategy using an easily reproducible methodology that leverages public data sources. Thus, this approach can help monitor wage gap trends, identify subsector differences, and provide a basis for better gender-balanced compensation packages in nonprofits.
The good news is that the proportion of incoming female executive directors appears to be increasing: opportunities to hold executive positions are expanding. However, the good news is largely eclipsed by the bad news. Despite increased representation and no evidence of increased pay discrimination among new hires, the overall pay gap remains sizable for nonprofit executives—approximately 19% for EDs and 15% for CFOs. So, despite progress in hiring, the disparity in opportunities across types of nonprofits (industry and size) plays a large part in the pay gap for female executives.
The dynamics driving these changes are subtle but important. The proportion of positions held by male executives can shrink at the same time that the pay gap increases. Even though female executives are being hired at a slightly higher rate (42% of the time in 2015 versus 39% of the time in 2000), the salaries of executive positions held by men have increased faster than those held by women, thus asserting more wage hegemony as the sector diversifies its leadership. Or, to look at it slightly differently, if the new wave of female executives replaces low-paid male executives, then the average male salary would increase mathematically. That would lead to an increase in a cross-sectional pay gap (all male executives compared to all female executives at a single point in time) without increasing the discriminatory component (relative rates of incoming and outgoing directors within organizations).
We can see the process play out by examining all nonprofits with baseline male EDs. In 2000, the salaries of those who replaced outgoing male directors with new male directors were $177k, compared to $159k for those who replaced male directors with female directors. Fast forward to 2015, and the pay for incoming male executives is $302k compared to $247k for incoming female executives. Note that these salaries are all in 2020 dollars, which means that across-the-board executive pay increased significantly faster than inflation over the study period for organizations in the study. But salaries for the organizations that persist in hiring male directors grew by 70% over the study period ($177k to $302k), while salaries of those that replaced a male with a female director grew by only 55% over the same period ($159k to $247k). The industries with the highest executive pay appear least likely to hire female executives.
These dynamics emphasize the importance of the hiring process over the compensation negotiation process and highlight the importance of the quality of opportunities available to female executives instead of the number of opportunities. Note that it would be possible to maintain a disparity in executive opportunities but still erase the gender pay gap if more female executives were selected to lead large organizations. Equitable pay does not require proportional representation. Ideally, women can achieve both, but at the very least, gains in representation should not come at the cost of higher pay gaps because of a greater concentration of resources in firms that fail to diversify their leadership.
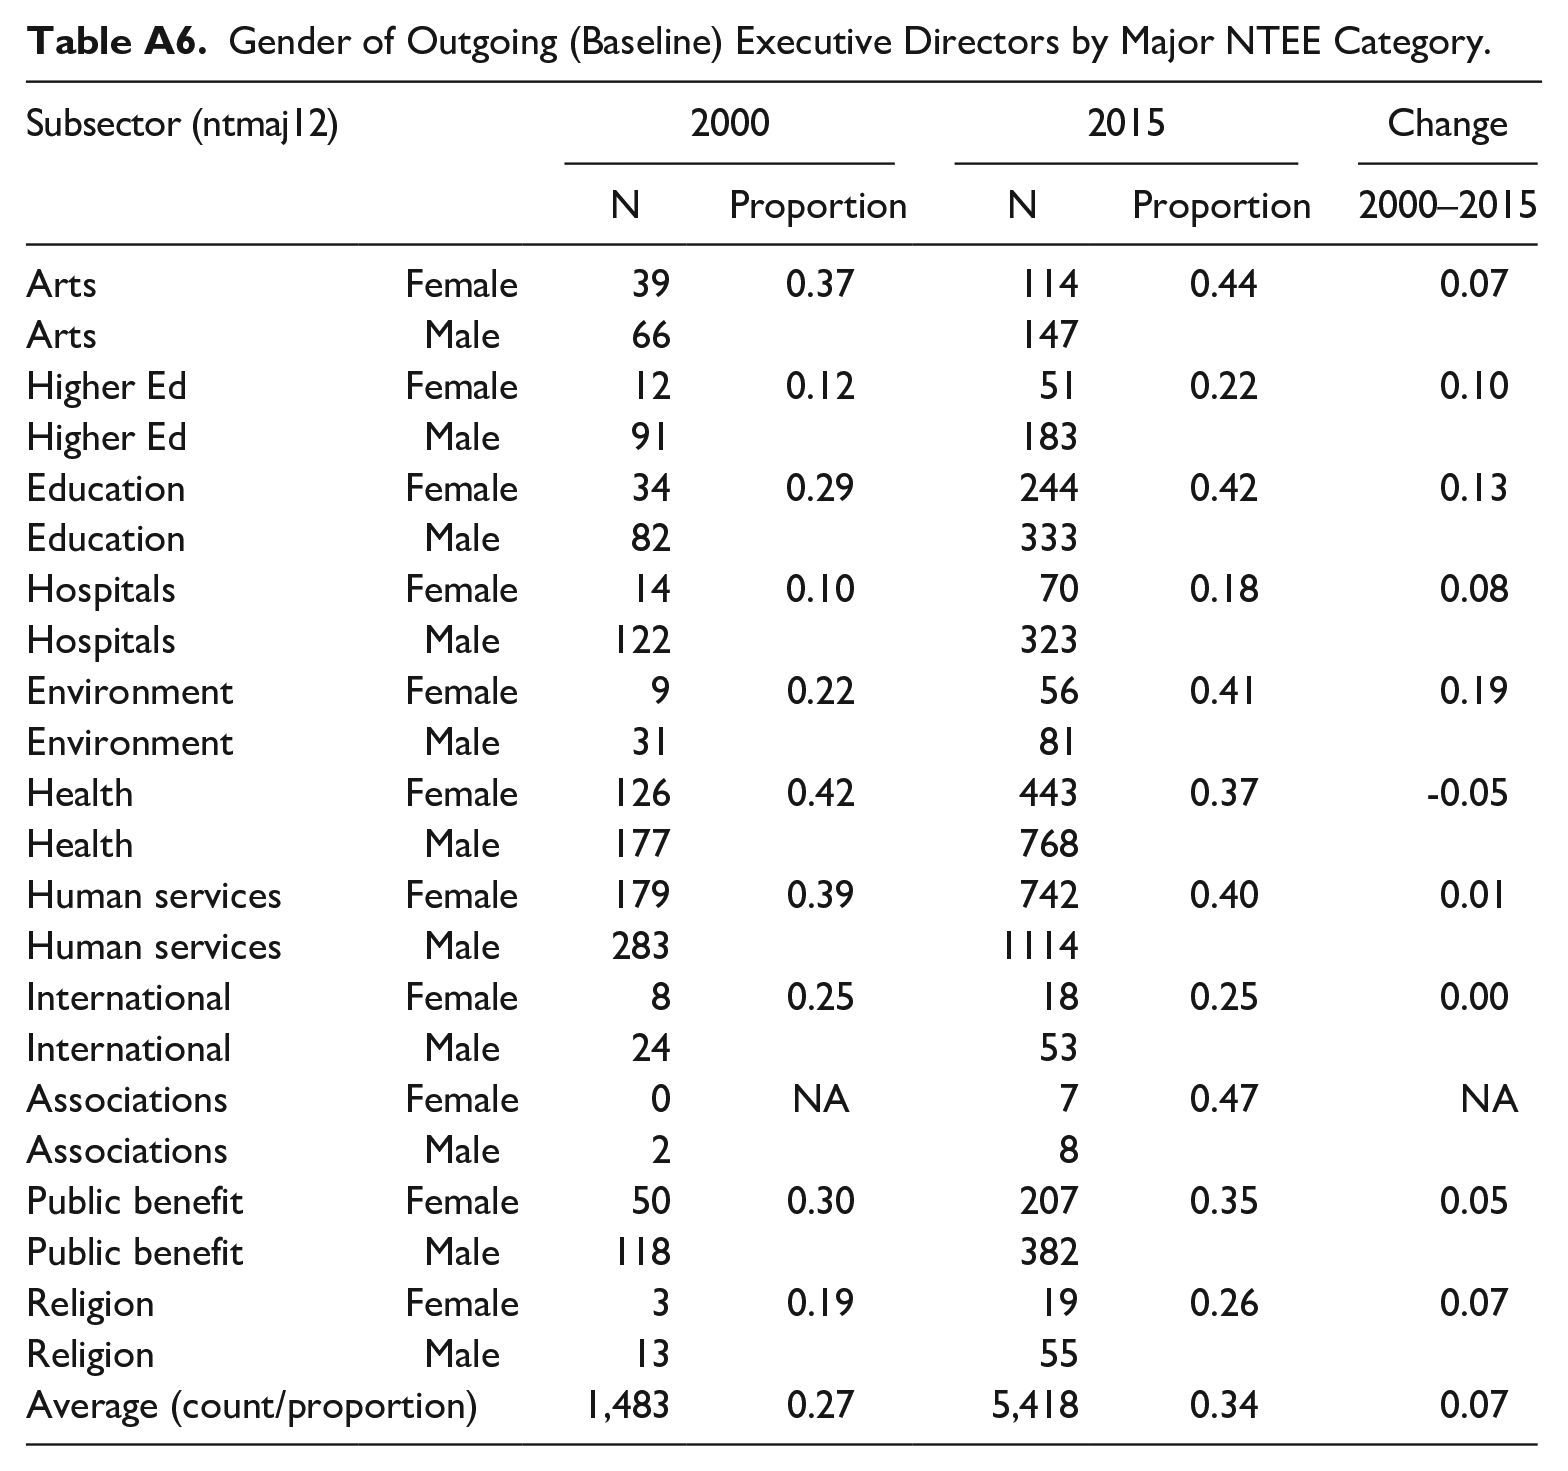
Consider the impact of within-industry sorting. The environmental subsector almost doubled representation over the study period, with the proportion of female executives increasing from 22 to 41%. Over the same period, the pay gap increased by a factor of ten, from 2 to 20%. The international subsector retained the same representation of 25% female executives over the study period, but the pay gap still jumped from 16 to 35%. Executive salaries are growing faster in the largest organizations than in the rest of the sector; women are less likely to be hired for these lucrative positions, even as they are being selected for more executive roles.
These results are instructive for sector leaders and government funders interested in equitable pay. Efforts directed at fair compensation post-hire have yielded modest results with a slight decrease in the discriminatory component of pay. However, the majority of the pay disparity arises from the likelihood of a nonprofit in a specific industry and size category hiring a female executive at all, not from those that employ both male and female executives paying them differently. Male executives dominate the highest-paying industries with the largest salaries. The concentration of resources in large organizations exacerbates the gap.
These results suggest some future avenues for productive research on executive pay. Instead of focusing on compensation committees and negotiation processes post-hire, research should more heavily examine the leadership pipeline and the types of implicit or explicit bias present during executive hiring processes. What opportunities set men up as competitive candidates for leadership positions with nonprofits? Are women given equal access to those opportunities early in their careers? What formal or informal mentoring is available within nonprofits, and are opportunities provided equally across genders? How are candidates identified during search processes for new leadership? What factors might eliminate women from candidate pools at higher rates than men? How are interviews conducted, and do they give equal weight to different leadership styles that might benefit one gender? Who is at the table making these important decisions? Do board compensation and the leadership of executive search processes influence outcomes?
The methodology outlined here offers a reproducible approach that uses public data to calculate pay gap metrics over time. It focuses on cases where two people hold the same unique role within an organization a year apart to simplify the measurement of one dimension of the pay gap: different pay for the same work. This approach provides a means to benchmark the current pay gap in the nonprofit sector and monitor compensation practices moving forward to ensure that pay practices are transparent and fair. It also helps direct attention away from compensation committees and toward hiring committees if we hope to see the future gap shrink.
Footnotes
Appendix
Gender of Outgoing (Baseline) Executive Directors by Major NTEE Category.
| Subsector (ntmaj12) | 2000 | 2015 | Change | |||
|---|---|---|---|---|---|---|
| N | Proportion | N | Proportion | 2000–2015 | ||
| Arts | Female | 39 | 0.37 | 114 | 0.44 | 0.07 |
| Arts | Male | 66 | 147 | |||
| Higher Ed | Female | 12 | 0.12 | 51 | 0.22 | 0.10 |
| Higher Ed | Male | 91 | 183 | |||
| Education | Female | 34 | 0.29 | 244 | 0.42 | 0.13 |
| Education | Male | 82 | 333 | |||
| Hospitals | Female | 14 | 0.10 | 70 | 0.18 | 0.08 |
| Hospitals | Male | 122 | 323 | |||
| Environment | Female | 9 | 0.22 | 56 | 0.41 | 0.19 |
| Environment | Male | 31 | 81 | |||
| Health | Female | 126 | 0.42 | 443 | 0.37 | -0.05 |
| Health | Male | 177 | 768 | |||
| Human services | Female | 179 | 0.39 | 742 | 0.40 | 0.01 |
| Human services | Male | 283 | 1114 | |||
| International | Female | 8 | 0.25 | 18 | 0.25 | 0.00 |
| International | Male | 24 | 53 | |||
| Associations | Female | 0 | NA | 7 | 0.47 | NA |
| Associations | Male | 2 | 8 | |||
| Public benefit | Female | 50 | 0.30 | 207 | 0.35 | 0.05 |
| Public benefit | Male | 118 | 382 | |||
| Religion | Female | 3 | 0.19 | 19 | 0.26 | 0.07 |
| Religion | Male | 13 | 55 | |||
| Average (count/proportion) | 1,483 | 0.27 | 5,418 | 0.34 | 0.07 | |
Authors’ Note
Jesse D. Lecy is also affiliated with the National Center for Charitable Statistics at the Urban Institute. Nathan J. Grasse is also affiliated with DARO.
Declaration of Conflicting Interests
The author(s) declared no potential conflicts of interest with respect to the research, authorship, and/or publication of this article.
Funding
The author(s) received no financial support for the research, authorship, and/or publication of this article.
Human Subjects Review
No institutional review for human subjects was necessary for this study.