
Abstract
Response times serve as reliable measures of engagement that are less prone to self-report biases. By utilizing response times, we examined the indicators of Successful Time Management (STM) and Unsuccessful Time Management (UTM) across the 36 countries and benchmarking participants in eTIMSS 2019 and investigated their effects on mathematics achievement through a multilevel analysis. The results showed that students use their time differentially based on item correctness, reflecting the need to include item correctness in the analyses when timing data are examined. Overall, higher-performing students exhibited higher levels of STM and lower levels of UTM, indicating they efficiently managed their time on items they answered correctly and invested relatively more time on challenging items. Conversely, lower-performing students tended to have lower STM and higher UTM, suggesting difficulties or disengagement with challenging items. However, significant differences across countries and benchmarking participants were identified, with the United States and Abu Dhabi being among the outliers. These findings provide insights into how students allocate their time during assessments, and important implications for interpreting student performance are discussed.
Introduction
Test-taking motivation, defined as the drive to optimize test performance, requires examinees to invest effort and manage their knowledge, time, and resources effectively during assessments. While early research on test-taking effort relied on self-reported measures, more recent studies advocate for behavioral indicators, particularly response time indicators from computerized tests. These indicators are less susceptible to response biases, are less intrusive, and are therefore considered a reliable behavioral measure of test engagement (Eklöf, 2010).
Studies by Schnipke and Scrams (1997), followed by Wise and colleagues, introduced concepts such as rapid guessing—where an examinee provides a response within an improbably short time frame, indicative of disengagement—and response time effort (RTE) as an aggregate measure of engaged behavior throughout the test (Wise, 2017). More recent studies have focused on examining student effort and engagement within the context of large-scale, low-stakes assessments. Implementing response time measures to detect rapid guessing at the item level involves establishing appropriate thresholds. Examinees responding below this threshold are classified as rapid guessers, suggesting disengagement from genuine solution behavior (Wise & DeMars, 2006). Over the past two decades, various methods have been proposed for determining such thresholds, including fixed time points applicable to all items, judgmental decisions based on item characteristics or response time distributions (Setzer et al., 2013), and approaches that consider item performance in conjunction with response time (Guo et al., 2016).
Despite extensive research, there is no consensus on an optimal threshold identification method for rapid guessing (Rios & Deng, 2021). Simple methods, like the universally applied 5-second rule, or item-specific, normative cut-offs, are straightforward to implement but are criticized for higher rates of misclassification errors, while efforts to reduce false positives by adjusting thresholds invariably increase the risk of false negatives (Wise, 2017). More advanced modeling techniques have also been used for these purposes, such as mixture models or item response theory (IRT) models (Ulitzsch et al., 2020).
Another major limitation of the existing methods is the inability to differentiate correct from incorrect rapid responses. Some students may respond quickly due to their familiarity with the item content leading to correct answers after minimal time to process the question. However, this situation is fundamentally different from other students who respond quickly and incorrectly. Failing to account for this distinction can lead to inaccurate interpretations of the relationship between response time, performance, and effort.
Given the complexities noted above, there is growing interest in moving beyond a binary rapid-guess flag toward more informative measures that consider how time use intersects with performance. The goal is to capture not just “was this response fast?” but to concurrently consider “whether this fast response was correct or incorrect” in order to examine what such summative concurrences imply. Papanastasiou and Michaelides (2024) introduced two indicators of test-taking behaviors that integrate response accuracy with timing data to understand test-taking effort. The Successful Time Management (STM) indicator cumulatively captures the instances where examinees answer items correctly in less time than the median response time, whereas the Unsuccessful Time Management (UTM) indicator cumulatively captures the instances where they answer incorrectly in less time than the median. These indicators were first tested with data from the United States, although they were not tested with data from other countries. Therefore, the purpose of this study is to: (1) Examine STM and UTM distributions across all countries and benchmarking participants in eTIMSS 2019 for Grade 4 mathematics, across different achievement levels and benchmarks; (2) Examine the effects of STM and UTM as predictors of achievement across the different countries and benchmarking participants, through multilevel modeling.
If the behaviors captured by STM and UTM are associated with test performance, they may constitute sources of variance unrelated to the constructs the test purports to measure. If identified, they may reveal test-taking approaches, adaptive or not, that are malleable. Based on the relevant findings and on the types of variations that are identified, targeted interventions can be designed for utilizing specific metacognitive skills that examinees could use during testing sessions.
Methods
This study analyzed data from 36 regions (30 countries and 6 benchmarking participants) from the digitally administered Trends in International Mathematics and Science Study (eTIMSS) 2019. eTIMSS 2019 used a matrix sampling design, splitting the total pool of items into 14 separate achievement booklets (Martin et al., 2020). To ensure maximal comparability of the data and to maintain the integrity of the comparative analyses, only data from Booklet 1 were analyzed. Additionally, the analysis focused exclusively on the multiple-choice mathematics items since their dichotomous scoring allows for clear attribution of response time to each scored item.
Given that students were nested within regions, a two-level multilevel analysis was performed in Mplus 8.2 to address the hierarchical structure of the data. To address any deviations from the normality assumptions, the robust maximum-likelihood estimation was used along with the senate weight based on the recommendations by Fishbein et al. (2021).
The calculation of the two indicators was based on deviations from the median for each item within each region, to avoid having the threshold influenced by outliers (see Equations (1), (2), and (3)). So, for the student j who responded to item i in less time than the median, the absolute value of the time difference equals • •


Results
Average Times and Percentage Occurrences of STM and UTM
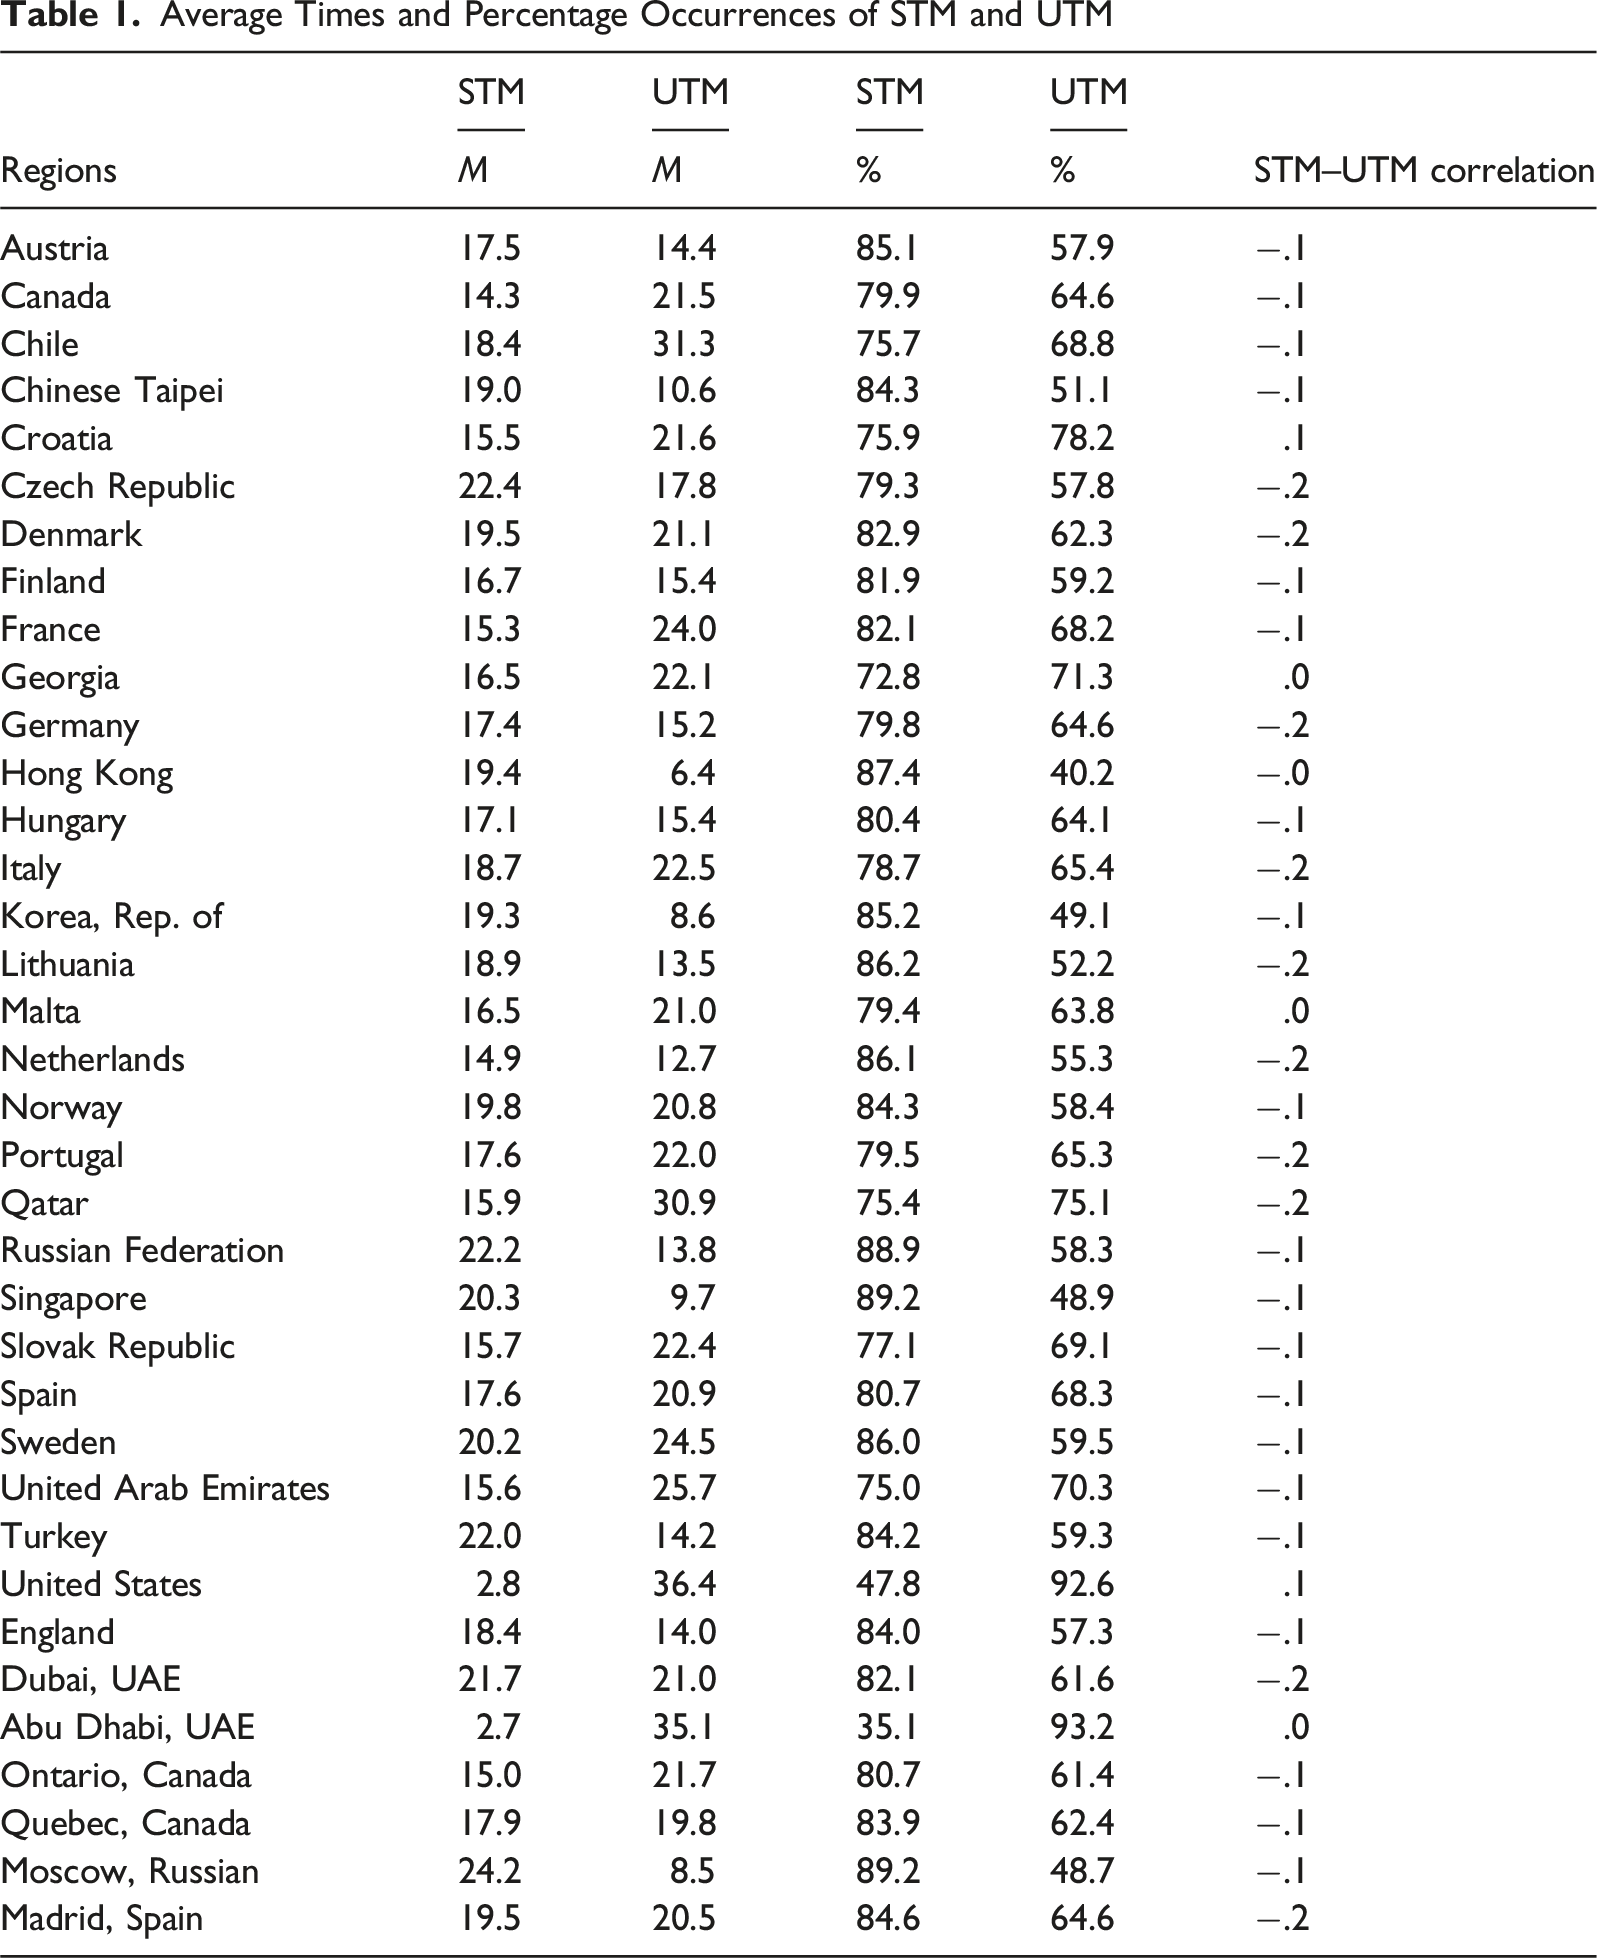
The final column of Table 1 displays the correlations between STM and UTM by region. Overall, the correlations tended to be weak and negative. In most cases, the correlations were equal to −.1. In 10 regions, the correlation was equal to −.2, while in four regions, this was equal to .0. Only in Croatia, the correlation was positive and equal to .1.
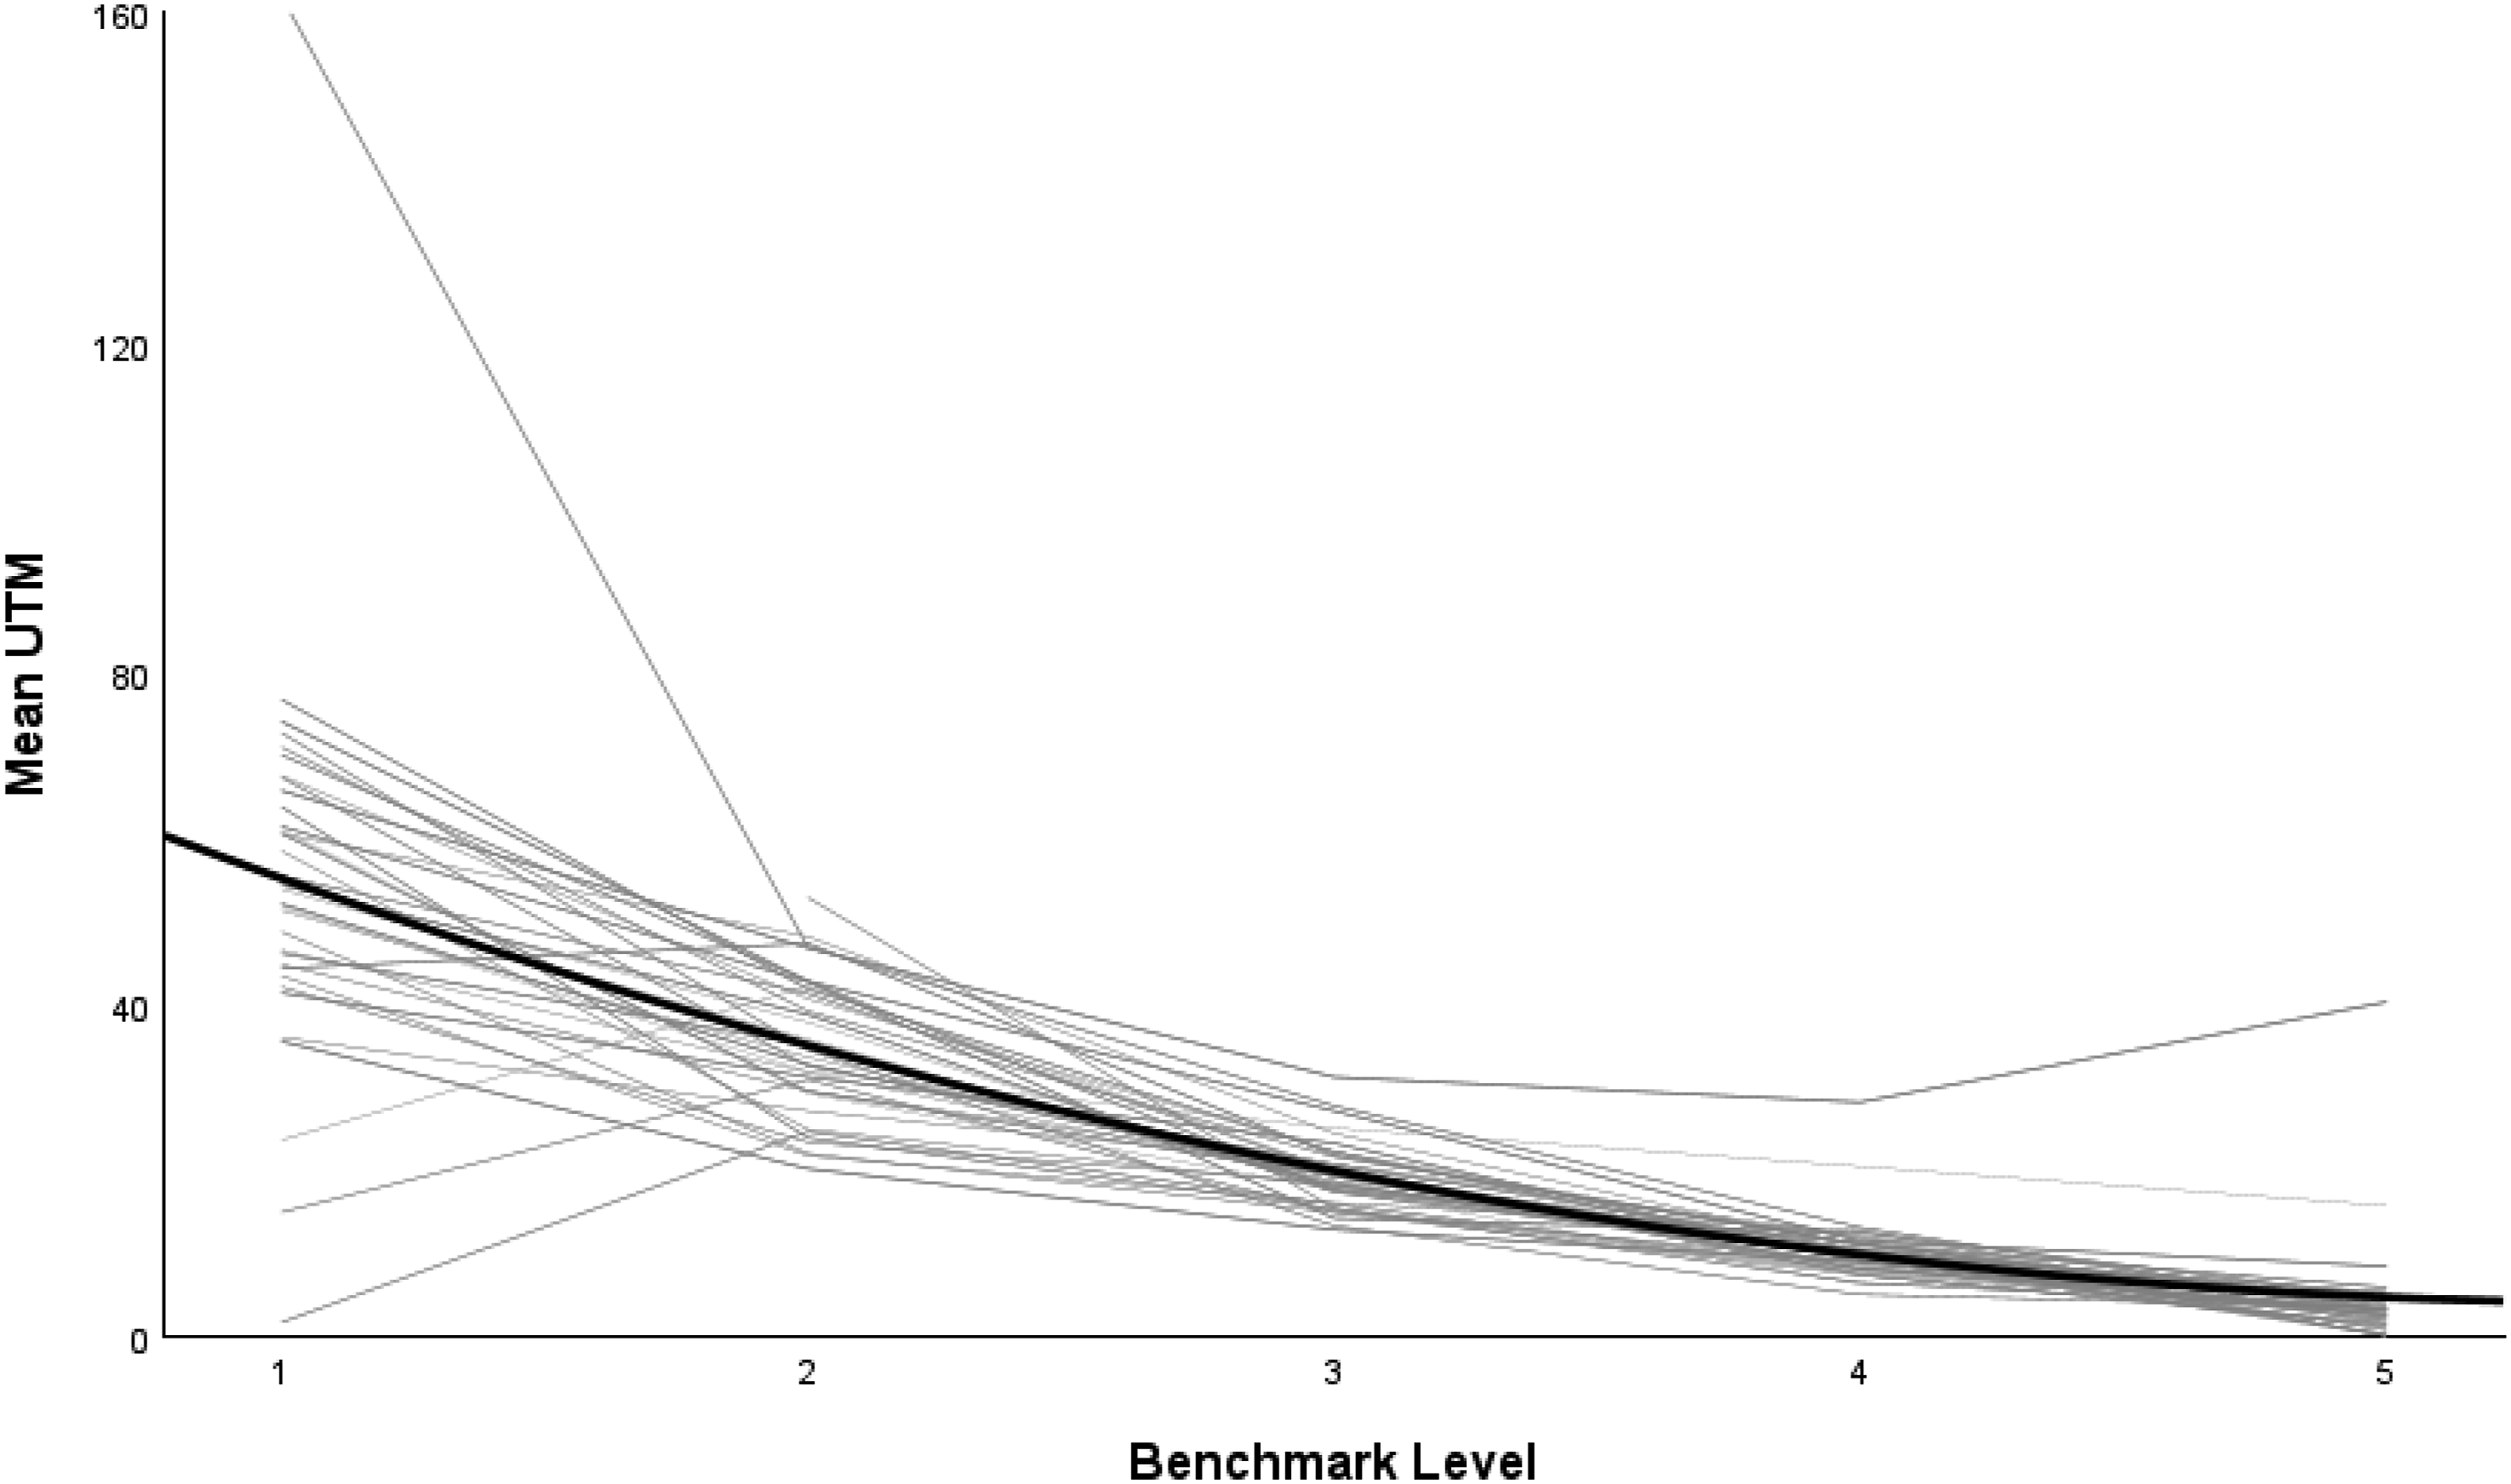
The two focal variables were also compared across regions and benchmark levels, which are presented in Figures 1 and 2, along with a quadratic fit line in bold. Overall, regarding the STM variable, students in the higher benchmarks tended to use less time than the median on the items they answered correctly, compared to the students in the lower benchmarks. The opposite pattern appeared for UTM, where the students in the lower benchmark levels tended to have higher levels of UTM. The more detailed average values of STM and UTM by country and benchmark level are included in Table A1 in the Appendix. Magnitude of STM across benchmarks Magnitude of UTM across benchmarks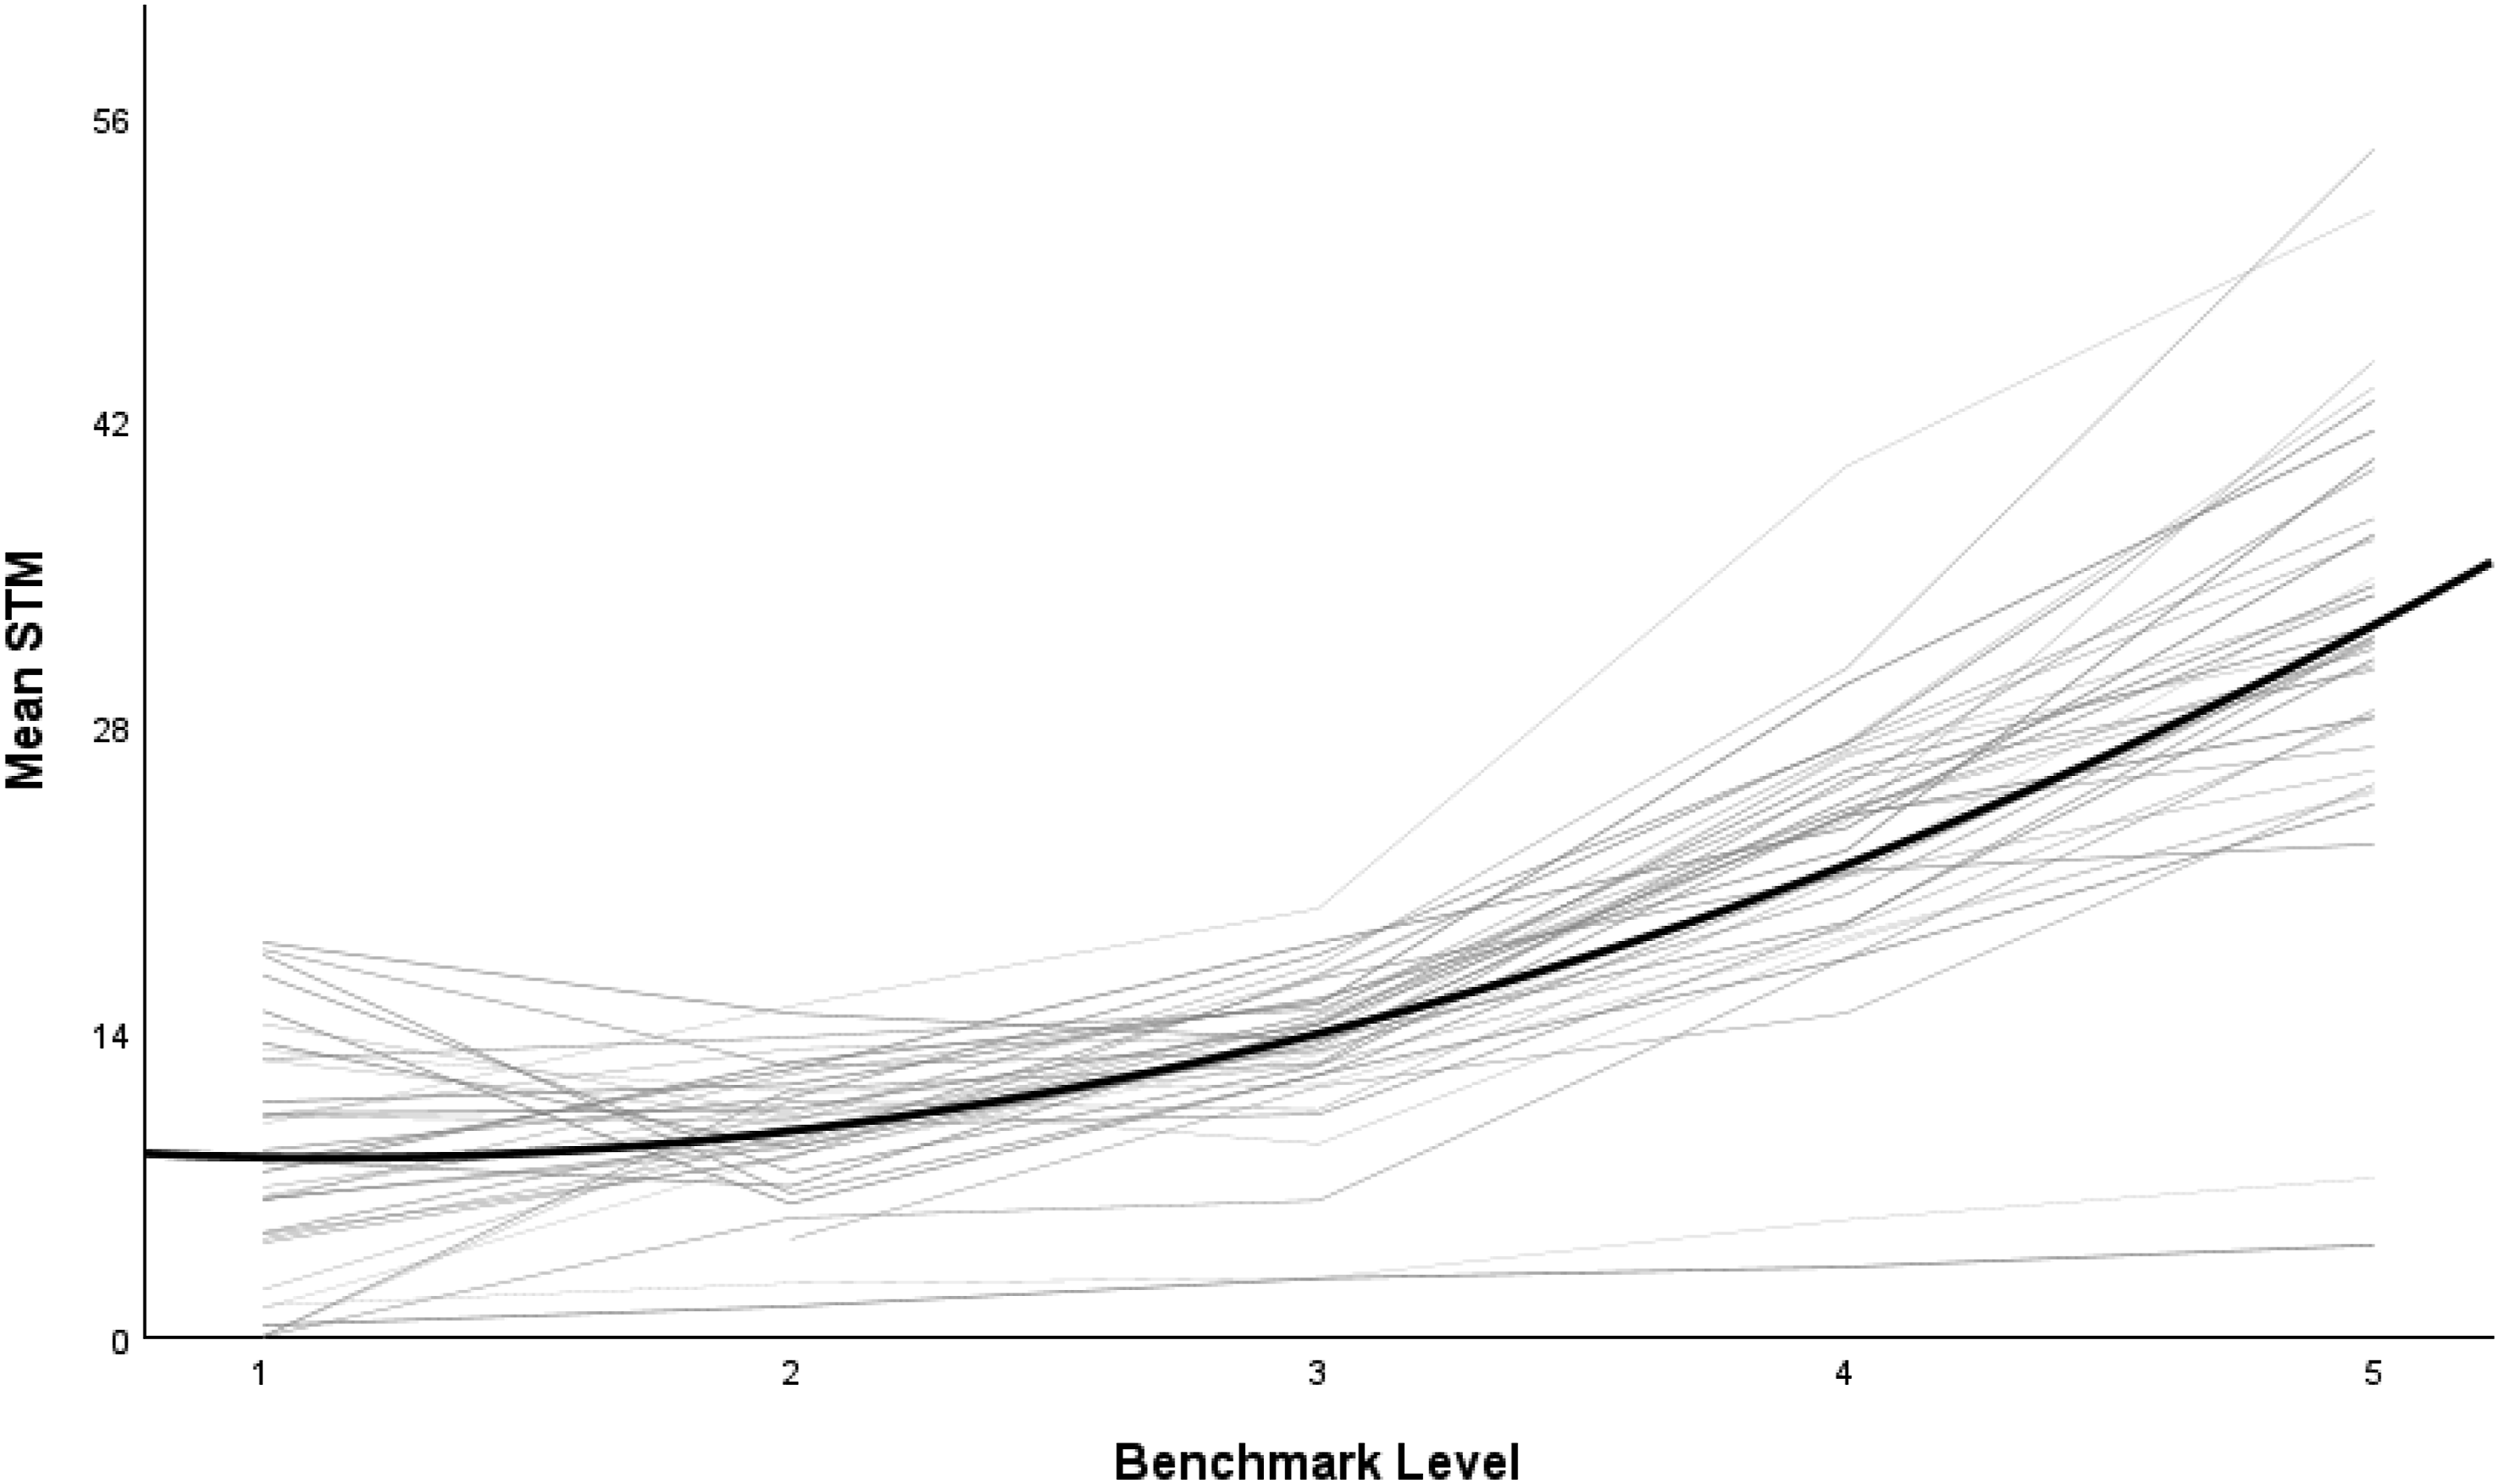
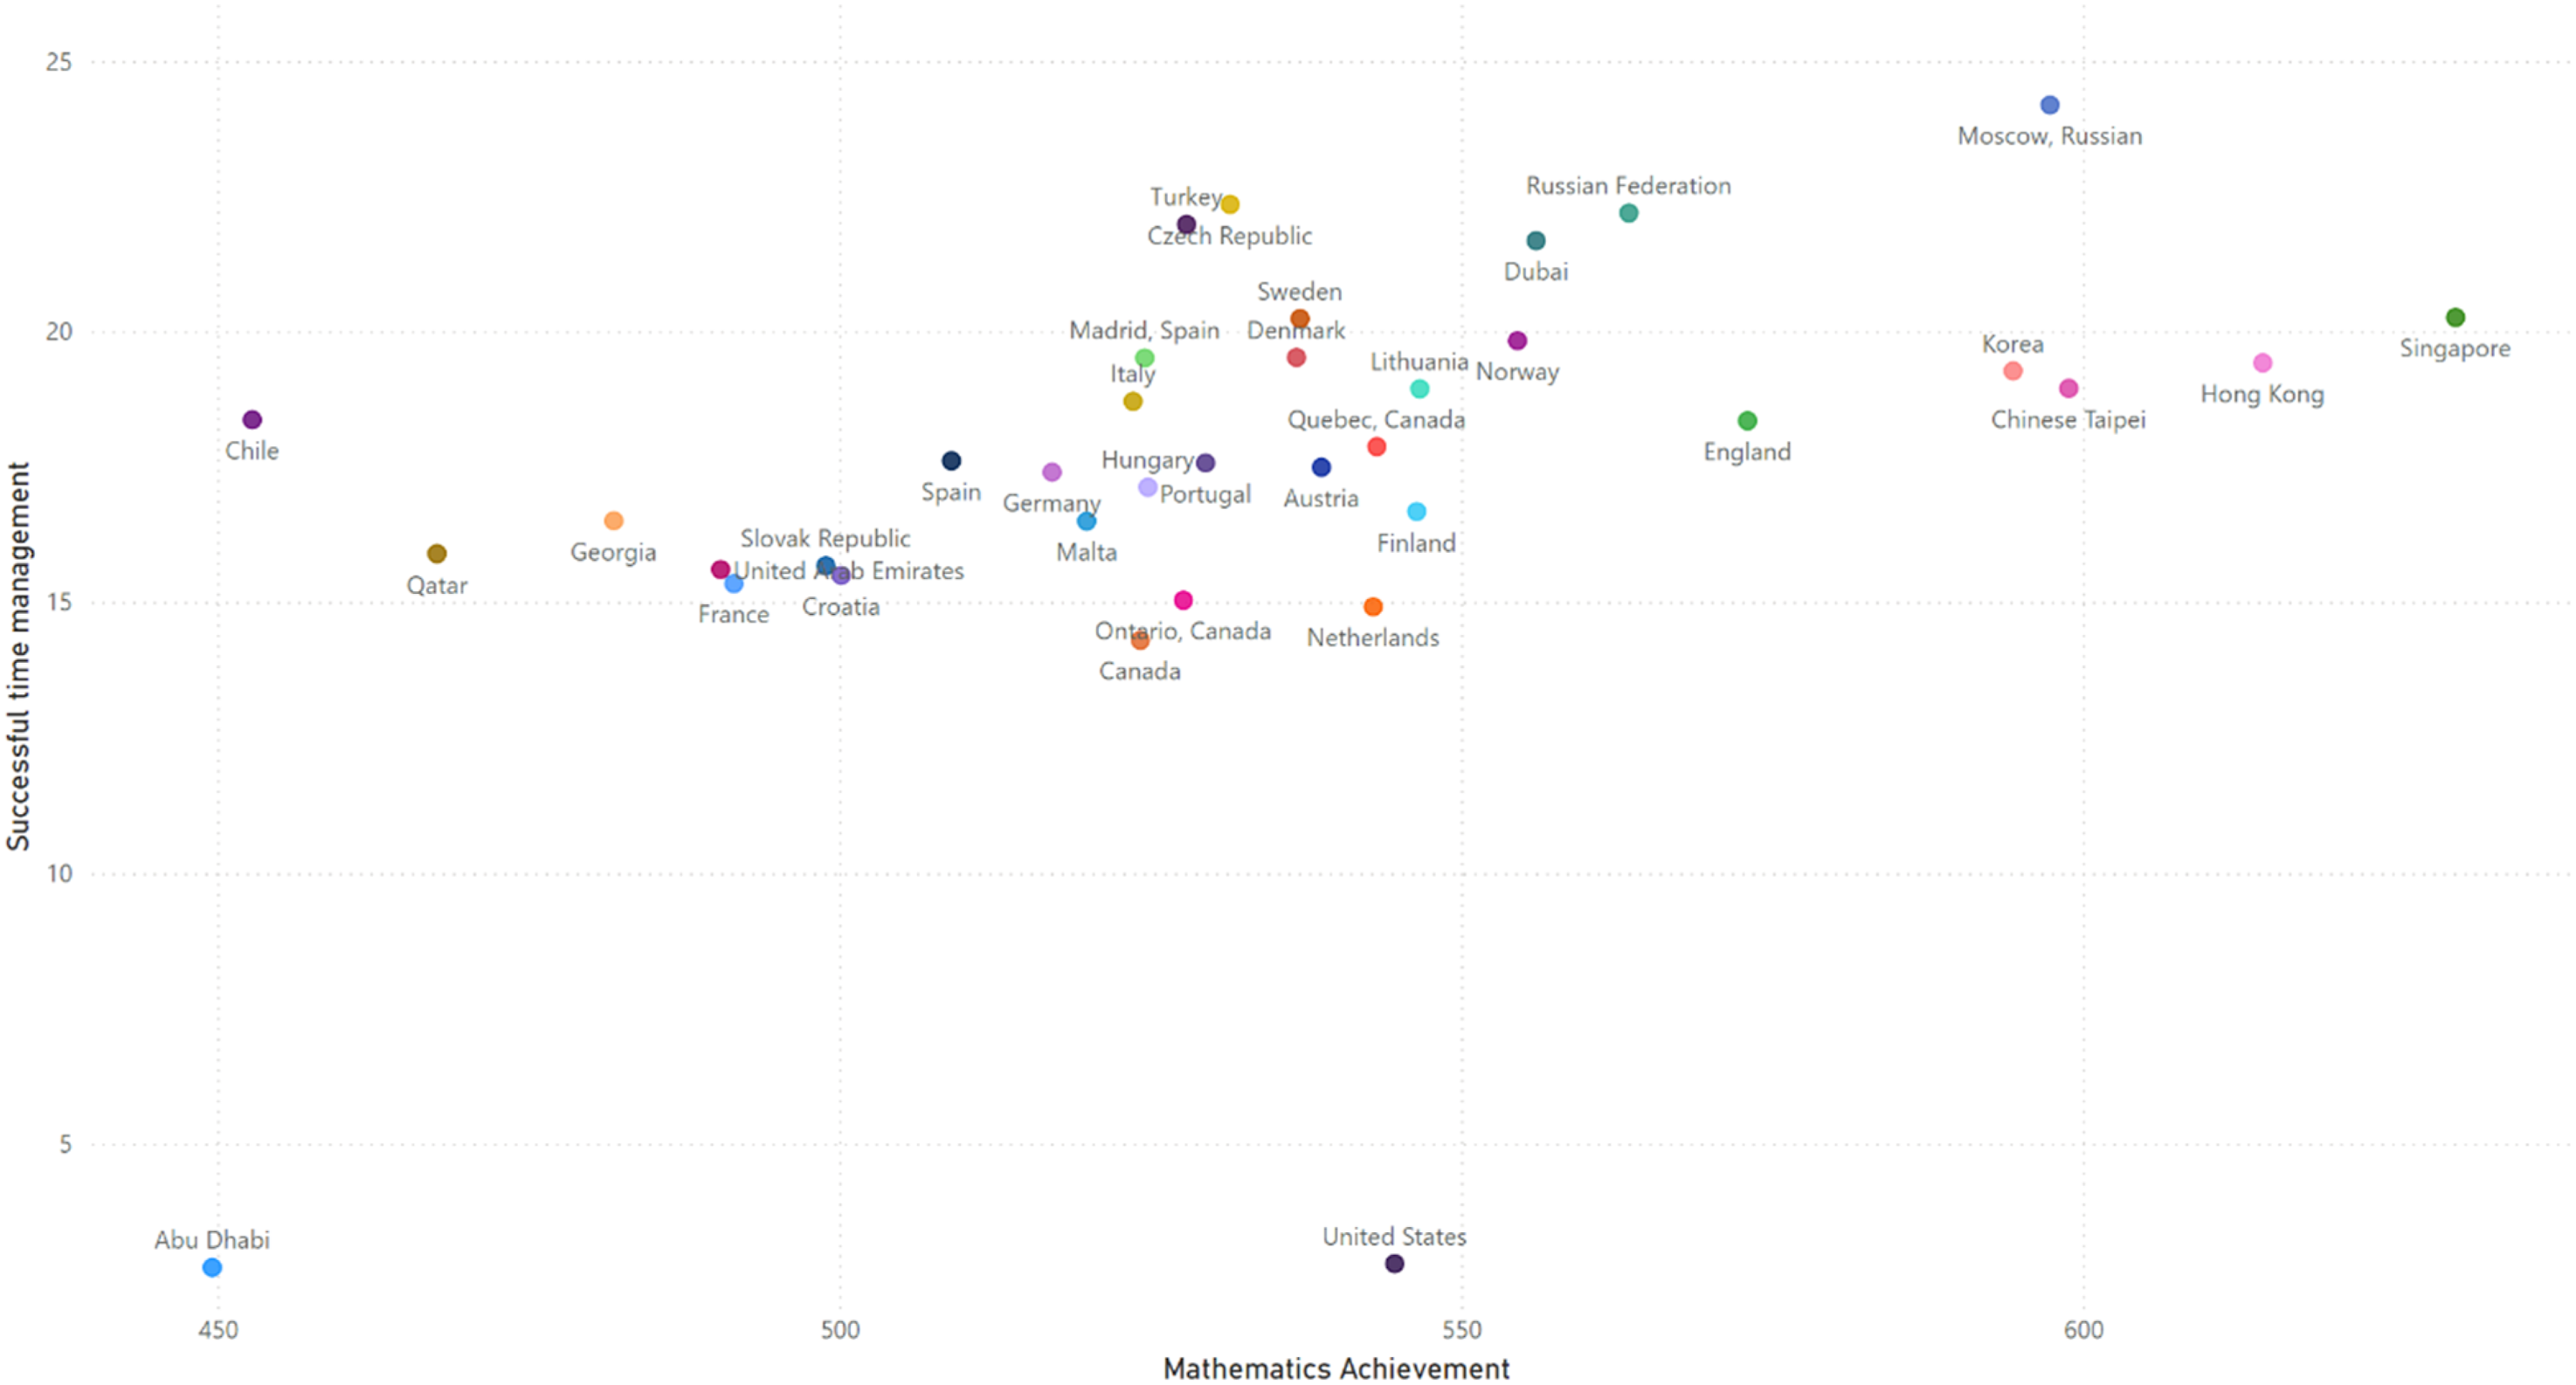
The scatterplot in Figure 3 shows a distinct negative relationship between average region achievement and UTM, with the regions with the largest amount of UTM having lower achievement, while the regions with the lower UTM having higher average achievement. The relationship between achievement and STM in Figure 4 was not as clear though, although to some extent higher levels of STM were also associated with higher levels of achievement. Scatterplot of mathematics achievement and magnitude of UTM in seconds Scatterplot of mathematics achievement and magnitude of STM in seconds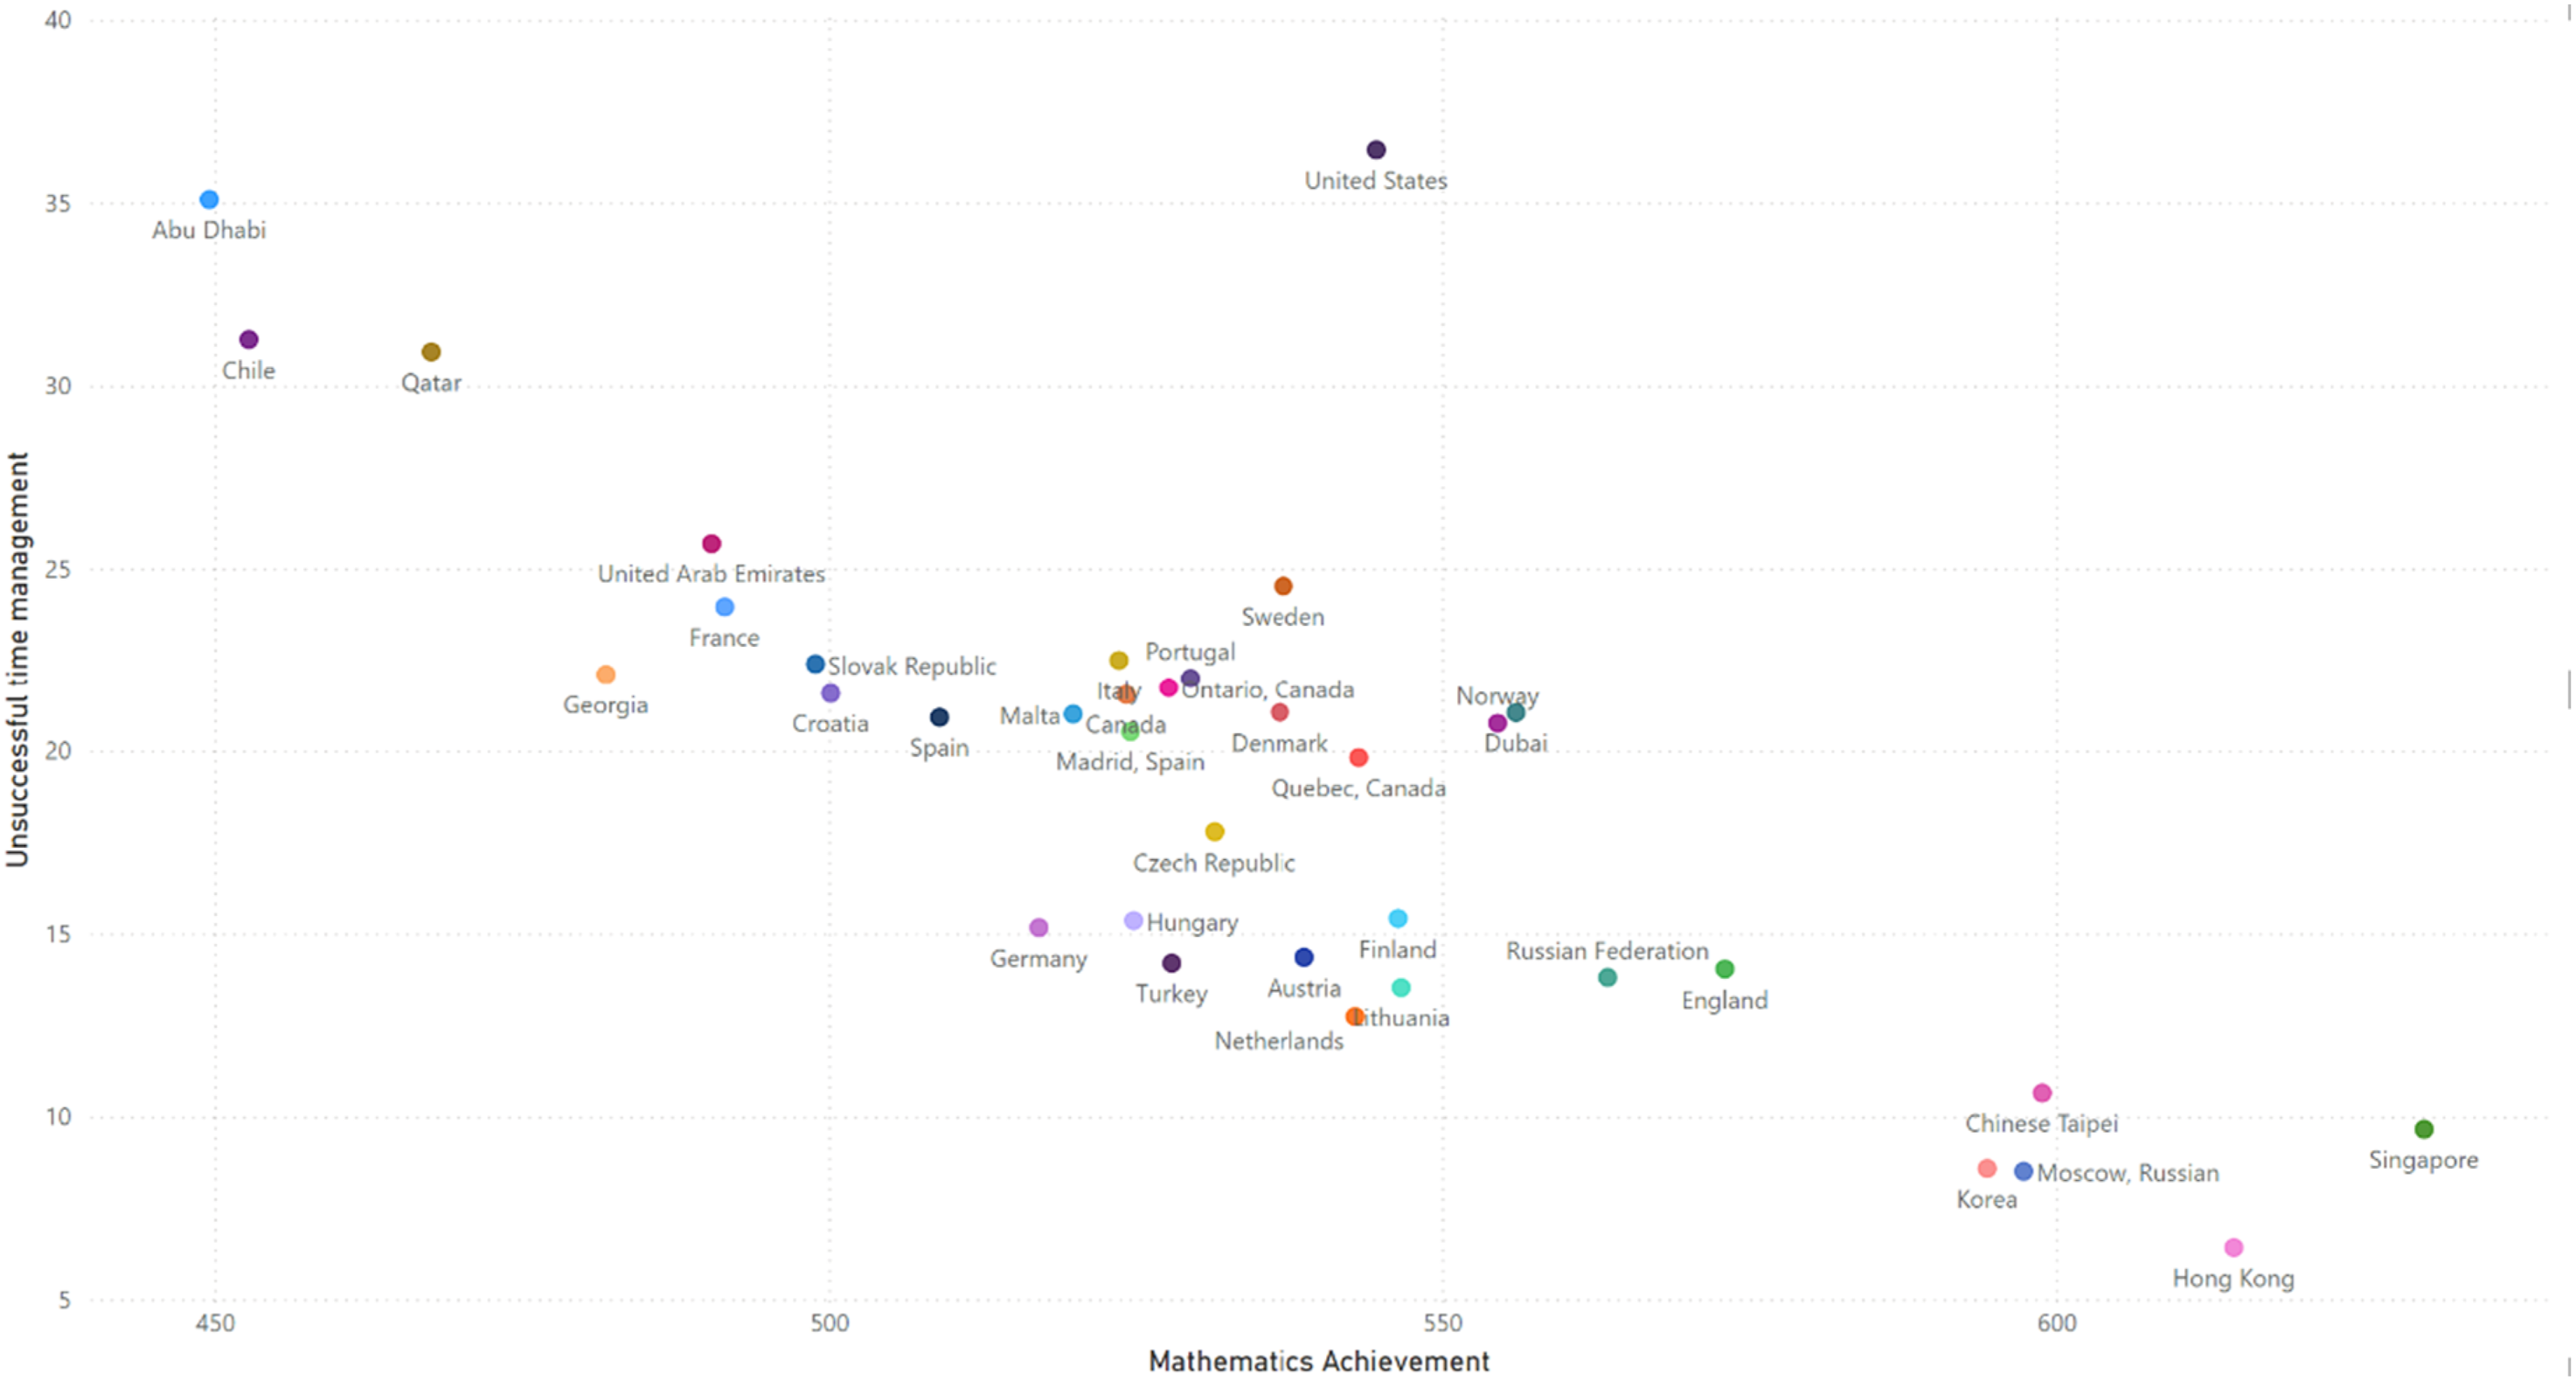
Results of the Two-Level Multilevel Model
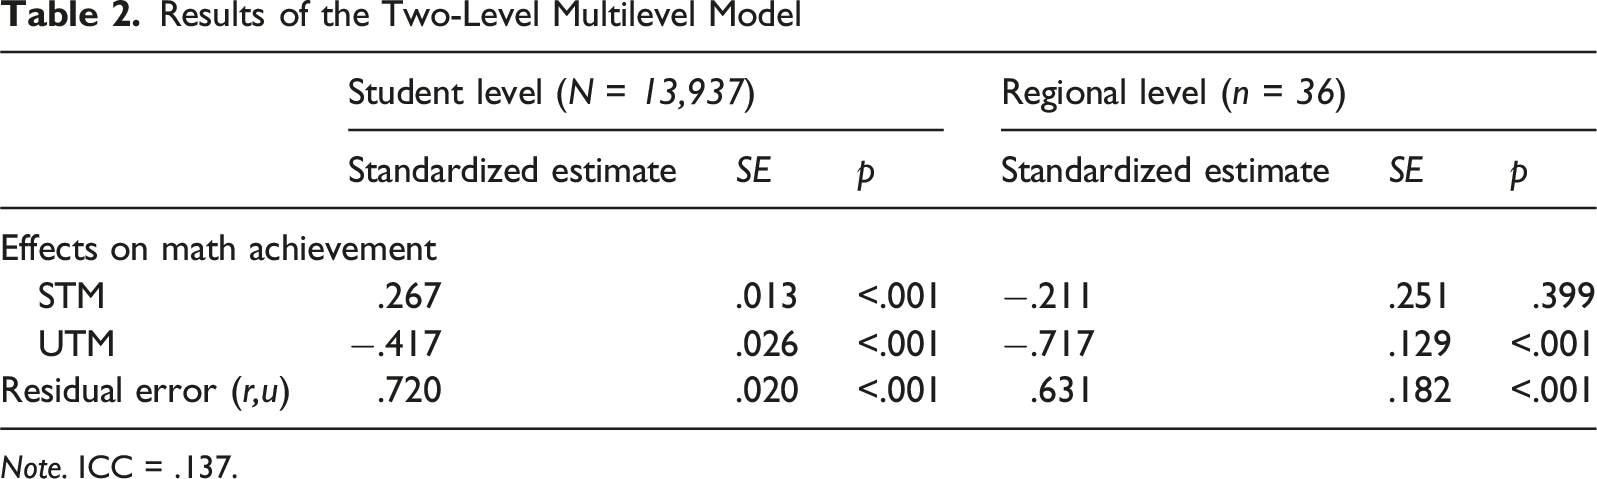
Note. ICC = .137.
Discussion
This study has demonstrated that the indicators of STM and UTM are useful for providing additional information regarding how students allocate their time during the testing process, by focusing on the occasions where students respond rapidly to multiple-choice items. Across performance benchmarks, both indicators showed consistent trajectories. When moving from the lowest benchmark to the highest, the amount of STM tended to increase, whereas the opposite pattern was observed for the UTM variable. These variations support two claims. First, examinees tend to use their time differentially depending on their ability. Higher-performing students often have a stronger grasp of the subject matter, allowing them to recognize and solve familiar problems more quickly and efficiently. Consequently, they spend less time on items they answer correctly. In contrast, lower-performing students are less likely to be able to do this successfully, as reflected by the small magnitude of their STM.
In contrast, UTM was consistently higher among lower-performing students, particularly in the lower benchmarks. Interpreted behaviorally, this pattern indicates that these students were more likely to respond incorrectly after spending less time than is typical for the item. One plausible explanation is a time-allocation tradeoff: when an item is perceived as too demanding, students may move on quickly in order to preserve time for other items. A second explanation is disengagement: students may reduce effort when they anticipate failure, which can also produce brief response times and incorrect answers. Because both mechanisms can produce the same observed pattern, the present findings do not, by themselves, distinguish strategic time management from low persistence. Instead, the results show that fast incorrect responding is systematically associated with lower achievement and varies across benchmark groups and regions. The contribution of the UTM indicator is that it quantifies this specific response pattern (fast and incorrect) in a way that can be compared across educational systems and modeled directly as a predictor of achievement, extending interpretations beyond accuracy alone.
Second, at the country level, considerable variations have been identified across regions. In some regions, there were significantly higher levels of lower response times than the median on items that were answered incorrectly than in other ones. These also tended to be the regions that had lower levels of achievement on Booklet 1 of eTIMSS. In other words, where a cohort is habituated to abandoning items rapidly, the system as a whole tends to underperform. It is likely that the examinees from these regions tend to skip or put no effort into items that are either too difficult for them or outside their curriculum. This result aligns with research on rapid-guessing which found that regions with lower average performance tend to have lower response time effort indicators (Michaelides & Ivanova, 2022). However, more research is needed to link these results with curriculum coverage within regions, to determine if the content of these items was included in their curriculum, and whether these items tended to be of differential difficulty. Additional research also needs to be performed with other motivational indicators such as test fatigue or test novelty to examine whether such indicators could potentially explain the outlying performance of STM and UTM for the United States and Abu Dhabi. This is especially important since prior studies have found that mixtures of motivational variables result in different student profiles (Michaelides et al., 2019a, 2019b).
Comparing the standardized coefficients from the multilevel model suggests that UTM is more strongly related to achievement than STM, and this pattern holds at both levels of analysis. At the student level, STM was positively associated with mathematics achievement, indicating that students who answered correctly in less time than the median tended to perform better overall. However, the negative association between UTM and achievement was larger in magnitude, indicating that the decrease in performance was larger for students who frequently responded incorrectly in less time than the median. At the regional level, this distinction was clearer: only UTM showed a statistically significant association with achievement, whereas STM did not. Differences in achievement across students and regions are linked more closely to the prevalence of fast incorrect responding than to fast correct responding. This strengthens the contribution of the STM and UTM framework by showing that separating fast responses by correctness is informative: similarly speeded response behavior has different implications depending on whether it produces correct or incorrect answers. Therefore, investing in strategies that foster additional effort and sustained motivation, item revisits and self-reflection on item responses could promote improved performance.
Overall, the STM and UTM indicators could reveal beneficial or maladaptive test-taking strategies that are correlated with test outcomes. From a policy perspective, the findings suggest the need for targeted interventions to support lower achieving students, especially from lower achieving regions on how to approach test items depending on item difficulty or familiarity with the topic. For example, students could explicitly be taught evidence-based test-taking strategies, and time budgeting, to utilize their testing time efficiently along with critical thinking skills. This could be complemented by practice tests whose results and processes could be discussed with students to foster their metacognitive awareness and self-regulation skills (Papanastasiou & Stylianou-Georgiou, 2022). Collectively, such efforts could enhance test performance through improved time-management behaviors while also promoting a more valid assessment landscape by mitigating disengagement among lower-performing students.
Footnotes
Ethical Consideration
This study was based on secondary analyses of data, so there was no need to obtain ethical approval for this study.
Funding
The authors received no financial support for the research, authorship, and/or publication of this article.
Declaration of Conflicting Interests
The authors declared no potential conflicts of interest with respect to the research, authorship, and/or publication of this article.
Data Availability Statement
Appendix
Average Values of STM and UTM by Country/Region and Benchmark Level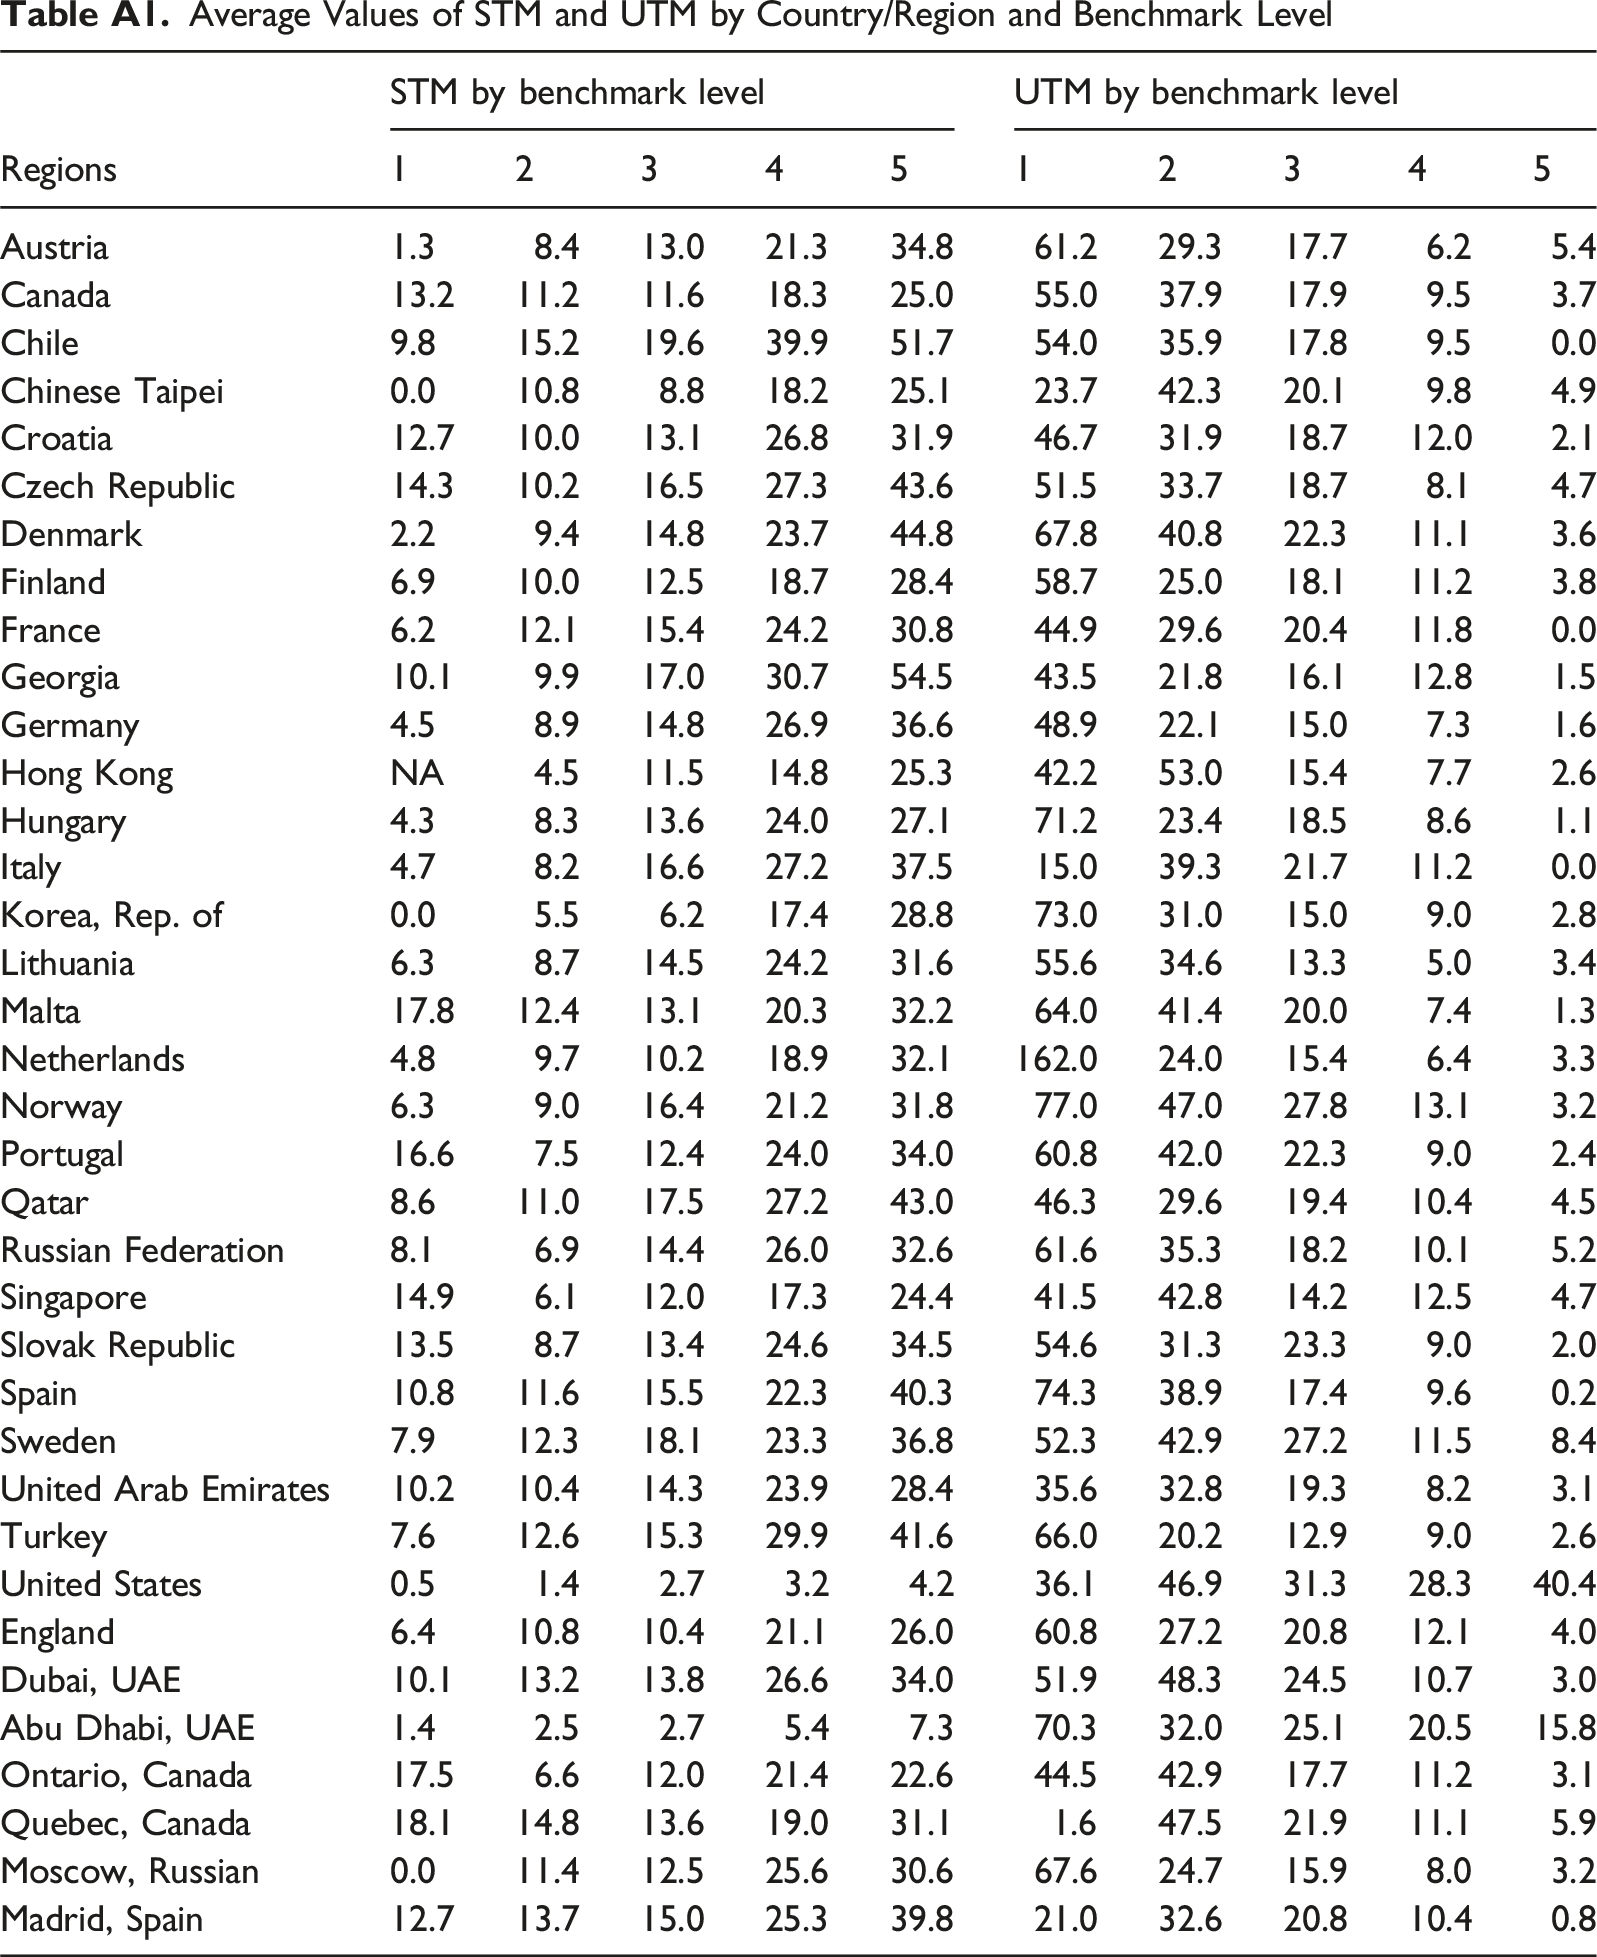
STM by benchmark level
UTM by benchmark level
Regions
1
2
3
4
5
1
2
3
4
5
Austria
1.3
8.4
13.0
21.3
34.8
61.2
29.3
17.7
6.2
5.4
Canada
13.2
11.2
11.6
18.3
25.0
55.0
37.9
17.9
9.5
3.7
Chile
9.8
15.2
19.6
39.9
51.7
54.0
35.9
17.8
9.5
0.0
Chinese Taipei
0.0
10.8
8.8
18.2
25.1
23.7
42.3
20.1
9.8
4.9
Croatia
12.7
10.0
13.1
26.8
31.9
46.7
31.9
18.7
12.0
2.1
Czech Republic
14.3
10.2
16.5
27.3
43.6
51.5
33.7
18.7
8.1
4.7
Denmark
2.2
9.4
14.8
23.7
44.8
67.8
40.8
22.3
11.1
3.6
Finland
6.9
10.0
12.5
18.7
28.4
58.7
25.0
18.1
11.2
3.8
France
6.2
12.1
15.4
24.2
30.8
44.9
29.6
20.4
11.8
0.0
Georgia
10.1
9.9
17.0
30.7
54.5
43.5
21.8
16.1
12.8
1.5
Germany
4.5
8.9
14.8
26.9
36.6
48.9
22.1
15.0
7.3
1.6
Hong Kong
NA
4.5
11.5
14.8
25.3
42.2
53.0
15.4
7.7
2.6
Hungary
4.3
8.3
13.6
24.0
27.1
71.2
23.4
18.5
8.6
1.1
Italy
4.7
8.2
16.6
27.2
37.5
15.0
39.3
21.7
11.2
0.0
Korea, Rep. of
0.0
5.5
6.2
17.4
28.8
73.0
31.0
15.0
9.0
2.8
Lithuania
6.3
8.7
14.5
24.2
31.6
55.6
34.6
13.3
5.0
3.4
Malta
17.8
12.4
13.1
20.3
32.2
64.0
41.4
20.0
7.4
1.3
Netherlands
4.8
9.7
10.2
18.9
32.1
162.0
24.0
15.4
6.4
3.3
Norway
6.3
9.0
16.4
21.2
31.8
77.0
47.0
27.8
13.1
3.2
Portugal
16.6
7.5
12.4
24.0
34.0
60.8
42.0
22.3
9.0
2.4
Qatar
8.6
11.0
17.5
27.2
43.0
46.3
29.6
19.4
10.4
4.5
Russian Federation
8.1
6.9
14.4
26.0
32.6
61.6
35.3
18.2
10.1
5.2
Singapore
14.9
6.1
12.0
17.3
24.4
41.5
42.8
14.2
12.5
4.7
Slovak Republic
13.5
8.7
13.4
24.6
34.5
54.6
31.3
23.3
9.0
2.0
Spain
10.8
11.6
15.5
22.3
40.3
74.3
38.9
17.4
9.6
0.2
Sweden
7.9
12.3
18.1
23.3
36.8
52.3
42.9
27.2
11.5
8.4
United Arab Emirates
10.2
10.4
14.3
23.9
28.4
35.6
32.8
19.3
8.2
3.1
Turkey
7.6
12.6
15.3
29.9
41.6
66.0
20.2
12.9
9.0
2.6
United States
0.5
1.4
2.7
3.2
4.2
36.1
46.9
31.3
28.3
40.4
England
6.4
10.8
10.4
21.1
26.0
60.8
27.2
20.8
12.1
4.0
Dubai, UAE
10.1
13.2
13.8
26.6
34.0
51.9
48.3
24.5
10.7
3.0
Abu Dhabi, UAE
1.4
2.5
2.7
5.4
7.3
70.3
32.0
25.1
20.5
15.8
Ontario, Canada
17.5
6.6
12.0
21.4
22.6
44.5
42.9
17.7
11.2
3.1
Quebec, Canada
18.1
14.8
13.6
19.0
31.1
1.6
47.5
21.9
11.1
5.9
Moscow, Russian
0.0
11.4
12.5
25.6
30.6
67.6
24.7
15.9
8.0
3.2
Madrid, Spain
12.7
13.7
15.0
25.3
39.8
21.0
32.6
20.8
10.4
0.8