
Abstract
The Detailed Assessment of the Speed of Handwriting-2 combines and extends previous versions of the test. This study examined the factor structure and presents the first analysis of measurement invariance across two age groups (8–16, 17–25) and sex. The normative sample comprised 762 examinees from the UK, Australia, and New Zealand who completed five tasks: Copy Best (CB), Alphabet Writing (AW), Copy Fast (CF), Free Writing (FW), and Graphic Speed (GS). As there were no significant between-country differences, confirmatory factor analysis (CFA) was performed on the combined data set. This supported the two-factor model corresponding to the test structure of four core tasks (CB, AW, CB, and FW) reflecting handwriting ability, with a separate measure of grapho-motor ability (GS). Multigroup CFA indicated full configural, metric, and scalar invariance for age groups and sex. The findings provide support for the test structure and reliability of the test across age and sex.
Introduction
Handwriting is recognized as a critical component of literacy and forms part of early school curricula across the world (e.g. in the UK (DfE, 2013) and Australia (ACARA, 2022)). Like reading and spelling, handwriting is a skill that needs to be taught, and these three components of literacy are interrelated. In order to develop their skill in writing, students must draw on their reading and spelling skills and teaching reading has been shown to enhance writing performance (Graham et al., 2018). Conversely, teaching writing has been shown to have a positive effect on competence in reading (Graham & Hebert, 2011), further emphasizing the reciprocal nature of the two skills. In particular, learning to write letters and words by hand has been found to benefit learning to spell and read (e.g. Pritchard et al., 2021; Wiley & Rapp, 2021). According to evidence from a recent meta-analysis by Araújo et al. (2022), one of the mechanisms underlying this link is that letter knowledge is enhanced by observation of the visual output of the motor act of handwriting. As students progress through education, writing demands increase and handwriting is used in a variety of ways, including to demonstrate knowledge, express ideas, and to take notes. Although other writing modes are used in classrooms, and typing in particular has become widely adopted, most class tests and the majority of formal high stakes examinations are still handwritten (Santangelo & Graham, 2016; Coombe et al., 2020). At this point in time, therefore, efficient handwriting continues to support success both within the educational system and in workplace settings that still require the ability to write legibly and fast (Bazerman et al., 2017).
Handwriting is part of the broader skill of writing, drawing on cognitive, language, perceptual, and motor skills which must be orchestrated to transform an idea into a written trace on the page. In some models of writing (e.g. Berninger & Winn, 2006), handwriting is simply viewed as a lower level ‘transcription’ skill (alongside spelling) with little detail on the processes involved. In the more focused psychomotor models of handwriting, however, Van Galen (1991) began by elaborating upon the transcription process by specifying the perceptual and motor processes involved in planning the shape and size of letter strokes. Since then, this model has been updated to acknowledge the influence of different language units (e.g. syllables) on aspects of handwriting production (Ahmed et al., 2022; Kandel et al., 2011).
The skill of learning to form letters and produce them consistently takes time. It has been suggested that achieving the point when the actions involved become ‘automatic’ in the sense that they require little focussed attention does not begin until the age of 8 years (Thibon et al., 2018). Given that different countries start to teach handwriting at different ages, however, using chronological age as a metric without taking account of years of experience might be difficult to interpret in this case. Nevertheless, regardless of the metric used, once the basic skill of forming letters is in place there are two aspects of handwriting, legibility and speed (or ‘fluency’), which continue to develop and show different developmental trajectories through childhood (Barnett et al., 2010; Gosse et al., 2021) with speed of production often being taken as a proxy for handwriting automaticity. As speed/automaticity increases, it is argued that the demands on executive functions (including working memory) are reduced and may be allocated instead to ‘higher level’ aspects of text production, resulting in higher quality text composition (e.g. Alves et al., 2016; Salas & Silvente, 2020). Consistent with these views is the idea that handwriting difficulties impede automaticity and affect higher order aspects of writing.
As handwriting relies on a variety of skills, individuals may experience difficulty for different reasons. Consequently, it is well documented that handwriting difficulties are common in children and young people with various neurodevelopmental disorders. This includes those with dyslexia (Hebert et al., 2018), Developmental Coordination Disorder (DCD; Barnett & Prunty, 2021), Attention Deficit/Hyperactivity Disorder (ADHD; Graham et al., 2016), and dysgraphia (Breaux & Munsell, 2025a; McCloskey & Rapp, 2018). Although the last term, ‘dysgraphia’, is not used in a uniform way in the literature (Chung et al., 2020), it is often associated with the DSM-5 classification of Specific Learning Disorder (with impairment in written expression, F81.81, American Psychiatric Association, 2022). In all of these groups, difficulties with legibility and speed are commonly reported but more specific differences in pen kinematics and pressure compared to peers have also been found (Gargot et al., 2020). For example, in children with dyslexia, poor spelling has been linked to slower handwriting, with excessive pauses when writing words (Sumner et al., 2014). In studies of children with DCD, Prunty and colleagues have found less accurate and less consistent letter formation (Prunty & Barnett, 2020) and more pausing during illegible words (Prunty et al., 2014) compared to age-matched peers. Brossard-Racine et al. (2015) examined handwriting difficulties in children with newly diagnosed ADHD. Although there were overall improvements with the use of stimulant medication, legibility remained persistently poor for over half of the sample.
Although there are individual differences in the nature and extent of handwriting difficulties both within and between these disorders, all can lead to poor outcomes in writing, broader literacy skills and beyond. As handwriting continues to be required for engagement in many classroom activities at all ages, difficulties in this area have been shown to have an impact on academic progress generally. For instance, faster, more automated handwriting has been linked to longer texts with greater compositional quality (Feng et al., 2019). This effect has been demonstrated even in primary-school aged children, where poor fluency was shown to impact statutory school assessment results (Medwell et al., 2009). Thus, students who can write more in a given time have the opportunity to demonstrate fuller knowledge and understanding. Assignments that are neater and easier to read also tend to be given higher marks (Graham et al., 2011). Children can be aware that they struggle to keep up with writing demands and to write legibly and this has been linked to lower perceived self-efficacy (Engel-Yeger et al., 2009). Psychological and emotional impacts of handwriting difficulties have also been found in children and adolescents (Hen-Herbst & Rosenblum, 2022; Zwicker et al., 2017).
Description of the DASH-2 tasks and scores
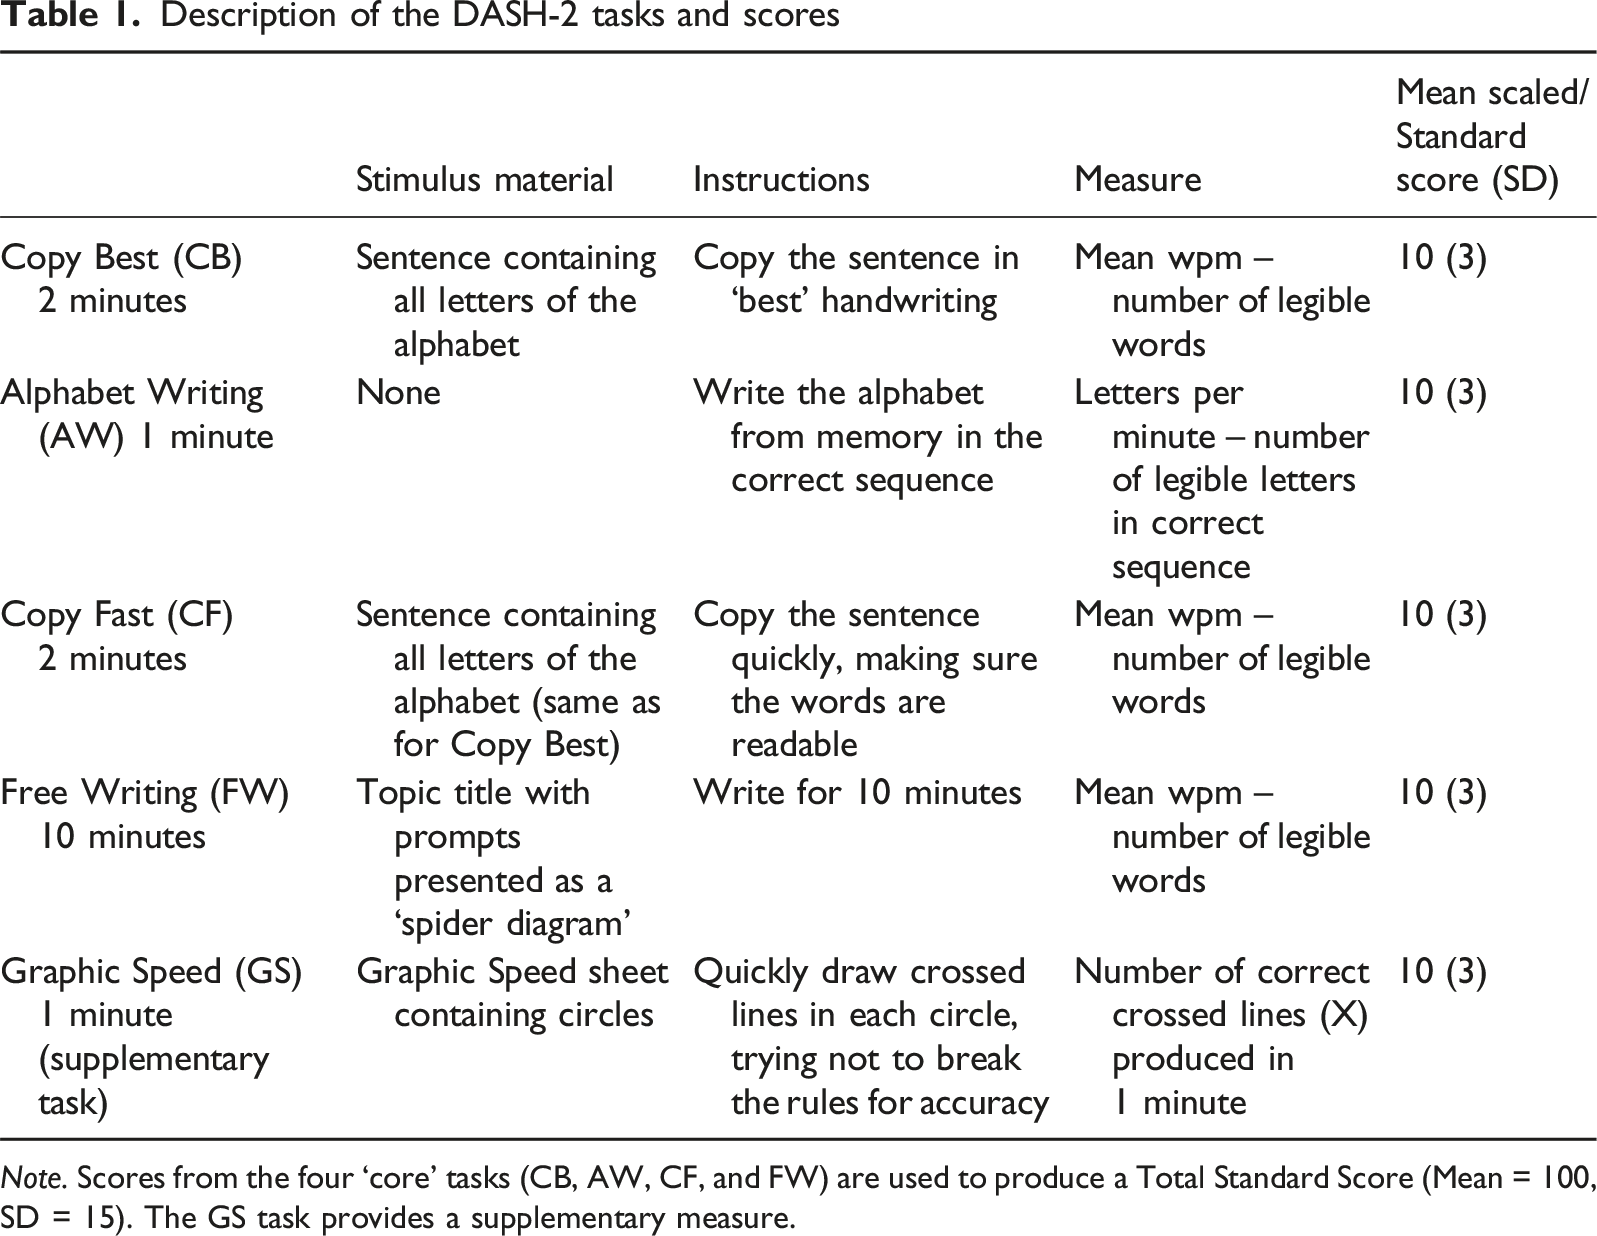
Note. Scores from the four ‘core’ tasks (CB, AW, CF, and FW) are used to produce a Total Standard Score (Mean = 100, SD = 15). The GS task provides a supplementary measure.
As part of the initial development of a scoring system for DASH, correlations between all five DASH-2 tasks were first conducted using the standardization data (as reported in the test manual, Barnett et al., 2007). While the Graphic Speed task had rather low correlations with the other tasks, the other four tasks were substantially intercorrelated. A principal component analysis was then conducted to investigate the factor structure of the test at each year (9–16 years). In each case, only one strong component emerged, explaining between 57 and 69% of the total variance. Once again, Graphic Speed stood out from the other four tasks, with factor loadings ranging from 0.32 to 0.75 with five under 0.60. Factor loadings on the other four tasks were high across all age groups (ranging from .74 to .94). These findings suggested that four of the tasks could be regarded as a closely related homogenous set which could be combined to produce a meaningful total score. The findings also led to the decision to present the Graphic Speed task as a separate supplementary measure of motor control. The original publication of DASH was therefore based on this test structure.
When the test was extended for an older age group, examination of the tasks was repeated using the standardization data for DASH17+ (as reported in the test manual, Barnett et al., 2010). Similar findings emerged supporting use of the same test structure, with four ‘core’ tasks and Graphic Speed as a separate measure. Normative data for the DASH and DASH17+ were gathered in the UK. For both editions of the test, significant developmental trends were present with only minor differences between tasks. However, beyond the age of 17, rates of change slowed, such that norms for broader age groups seemed more appropriate: 17–18, 19–21, and 22–25 years.
A recently revised and updated version of the test, the Detailed Assessment of the Speed of Handwriting – 2nd Edition (DASH-2; Barnett et al., 2024), combines the two previous versions and provides normative data on an extended age range from 8 to 25 years. Recommendations from an expert panel and feedback from DASH/DASH17+ users from different professions contributed to the test revisions. These include a downward extension from 9 to 8 years, as users had found it suitable for use with younger children. New features include new sentences, designed for younger (8–16 years) and older (17–25 years) examinees, and alternative sentences for when repeat testing is needed. An alternative topic, created to provide a more challenging option for the Free Writing task was also provided. Norms were gathered between August 2021 and February 2023 in the UK, Australia, and New Zealand. Although traditionally single-country norms have been gathered, it is now more common for pan-country norms to be produced where the countries have similar demographics, education systems, and provision for students with special/additional needs, as was the case for the three regions included in the DASH-2 standardization project.
The purpose of a test manual is to provide the user with the reliability and validity data required to have confidence in the psychometric properties of the assessment tool they have chosen to use. Providing further evidence of these properties is then an ongoing process undertaken by researchers and test users should continue to consider the accumulated literature (American Educational Research Association, American Psychological Association, & National Council on Measurement in Education, 2014). For example, the new DASH-2 manual provides information on test-retest reliability for the two age groups completing the new sets of sentences, a younger group (aged 8–16 years) and an older group (aged 17–25 years), reporting good to excellent stability over time. The standard error of measurement is also provided for each of the tasks, as well as the Total Standard Score. Adding to evidence of test validity, the DASH-2 manual also reports data from special group studies which show the clinical sensitivity of the DASH-2 to the presence of difficulties with handwriting speed in a group with dyslexia and in a group with developmental coordination disorder (DCD). In terms of the test structure, reported intercorrelations between the five component tasks reflect findings from the previous versions of the test as described above, as do the results of a confirmatory factor analysis, which once again support the structure of the test in terms of the four ‘core’ tasks representing a multi-faceted concept of handwriting speed and a separate task measuring perceptual-motor control of a writing implement. However, given the wide age range for DASH-2, along with the introduction of some new materials, it is important to inform users of the validity of the test structure for both younger and older examinees. Furthermore, separate analyses for males and females would also be informative for users. The aim of the present study was therefore to examine further the factor structure as presented in DASH-2 and measurement invariance across a younger and older age group and across male and female participants.
Methods
Participants
Distribution of sample by age and sex
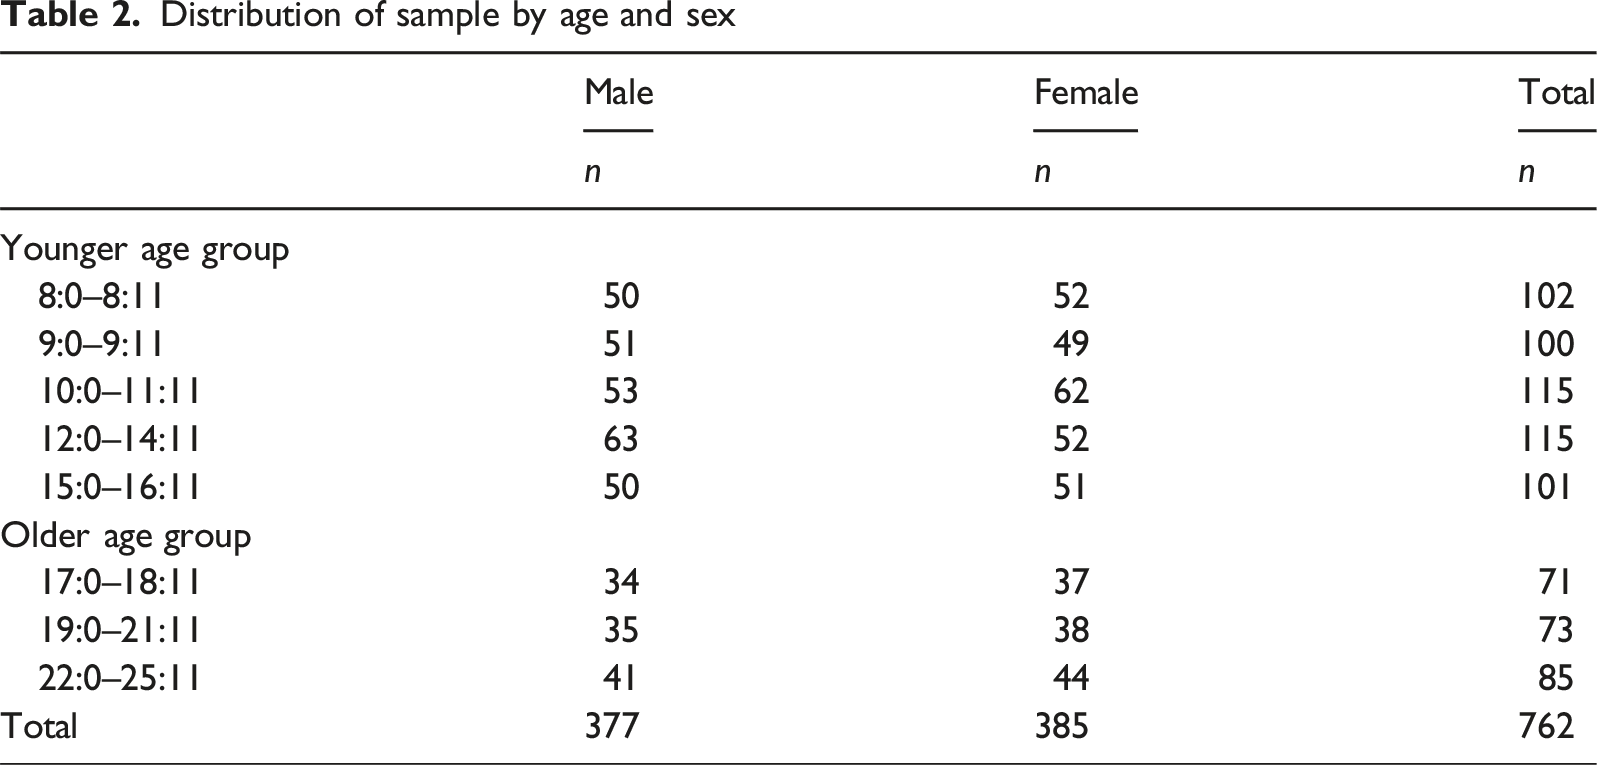
Within each country, the sampling plan involved a cell structure that identified appropriate numbers of participants for each cell, defined in terms of age, gender, geographic region, urbanicity, race/ethnic group/ancestry, and parental education. For the variable age, year groups were collapsed on the basis of analyses undertaken for previous editions of the test (see DASH-2 Administration and Scoring Manual, Barnett et al., 2024 for full demographic details).
Procedure
Ethical approval for the study was obtained from Pearson Clinical Scientific Council, Texas USA. Individuals aged 15 years or younger in the UK, and aged 17 years and younger in Australia and New Zealand, were registered for the project by a parent/carer, who gave informed consent. In Australia and New Zealand, young people aged 12–16 years were also given the option to provide their own informed consent. Those aged 16–25 years in the UK and 18–25 in Australia and New Zealand were able to provide their own informed consent.
Participants were individually tested on the five DASH-2 tasks administered in the following order: Copy Best, Alphabet Writing, Copy Fast, Graphic Speed, and Free Writing. These are briefly described in Table 1. There are separate sentences for copying for a younger (8–16 years) and older (17–25 years) age group. There is also an alternate Free Writing topic, appropriate for all ages. Within each age group, alternate versions of the sentence for copying and the Free Writing topic were administered to approximately half of the examinees. Due to the use of these different stimulus materials across participants it was not appropriate to use raw scores, so scaled scores were used in all analyses.
There were 112 examiners across all regions, who completed the assessment sessions between August 2021 and February 2023. Full details of testing are described in the DASH-2 test manual (Barnett et al., 2024). All testers were appropriately qualified, and extensive training on the administration and scoring of the test was provided to ensure consistency. Testing on DASH-2 was part of a larger project to standardize the Movement ABC-3 Test (Henderson & Barnett, 2023a) and Checklist (Henderson & Barnett, 2023b).
Data Preparation
Detailed information on the demographics for the UK and Australia/New Zealand samples taking part in the standardization of DASH-2 are presented in the test manual. Data analyses on the effect of specific demographic variables on test scores are also reported in the test manual. To justify the combination of data from the different countries for the development and analyses of test scores, two approaches were taken. First, to examine any effect of country (UK vs Australia/New Zealand) on test scores, analyses of variance were performed. A lack of significant differences along with small effect sizes on all comparisons provided evidence to support the combination of data across regions. Second, the measurement invariance between the UK and Australia/New Zealand was tested. The configural and metric invariances that were obtained supported the view that the model being tested was equivalent across countries.
Using the combined sample, developmental trends across age were examined for all five tasks (see Chapter 7 of the test manual). As in earlier editions, a steady increase in performance for all tasks was observed up to the age of 16 followed by a levelling off thereafter. These data supported the further use of age 16 as a dividing line between younger and older individuals for the production of different sentences to be copied and the subsequent measurement invariance analyses.
Of the 762 assessments conducted for the standardization project, 735 contained no missing scores. However, the 27 assessments for which a score was missing were still included in the analysis using a full information maximum likelihood estimator (Enders & Bandalos, 2001). For the Graphic Speed task, there was missing data for 2.2% of the sample. For all other tasks there was less than 1% missing data.
Results
Intercorrelations Between Task Scores
Scaled scores were used for the main data analyses. Prior to conducting factor analyses, it is important to ensure that the scores to be entered meet minimum requirements in relation to their correlations with each other. Pearson correlations were conducted between the individual task scaled scores for the DASH-2 standardization sample as a whole, for the younger and older age groups (8–16 years and 17–25 years) and for females and males separately.
Pearson intercorrelations between the task scores for the whole sample (N = 762)
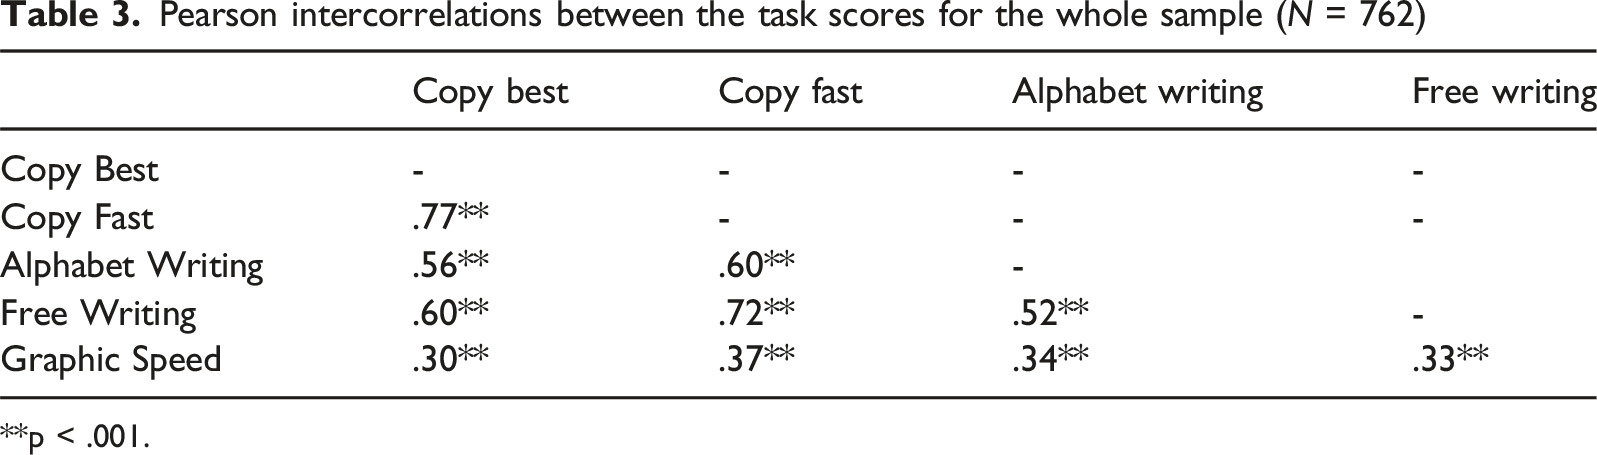
**p < .001.
Factor Structure of the DASH-2 Scores
M Plus version 8.7 (Muthén & Muthén, 2017) was used for all confirmatory factor analysis models. As the data did not present any multivariate normality issue, the maximum likelihood estimator was used. The model tested is shown in Figure 1. This comprises a writing ability factor (f1) underlying the performance on the four core tasks: Copy Best, Alphabet Writing, Copy Fast, and Free Writing. The Graphic Speed task was removed from the main factor, but is included in the model as a grapho-motor factor (f2) in order to assess the relationship with the main factor. The model also allows for covariance between the error terms for the Copy Best and Copy Fast tasks, as they both use the same sentence for copying. Diagram of the model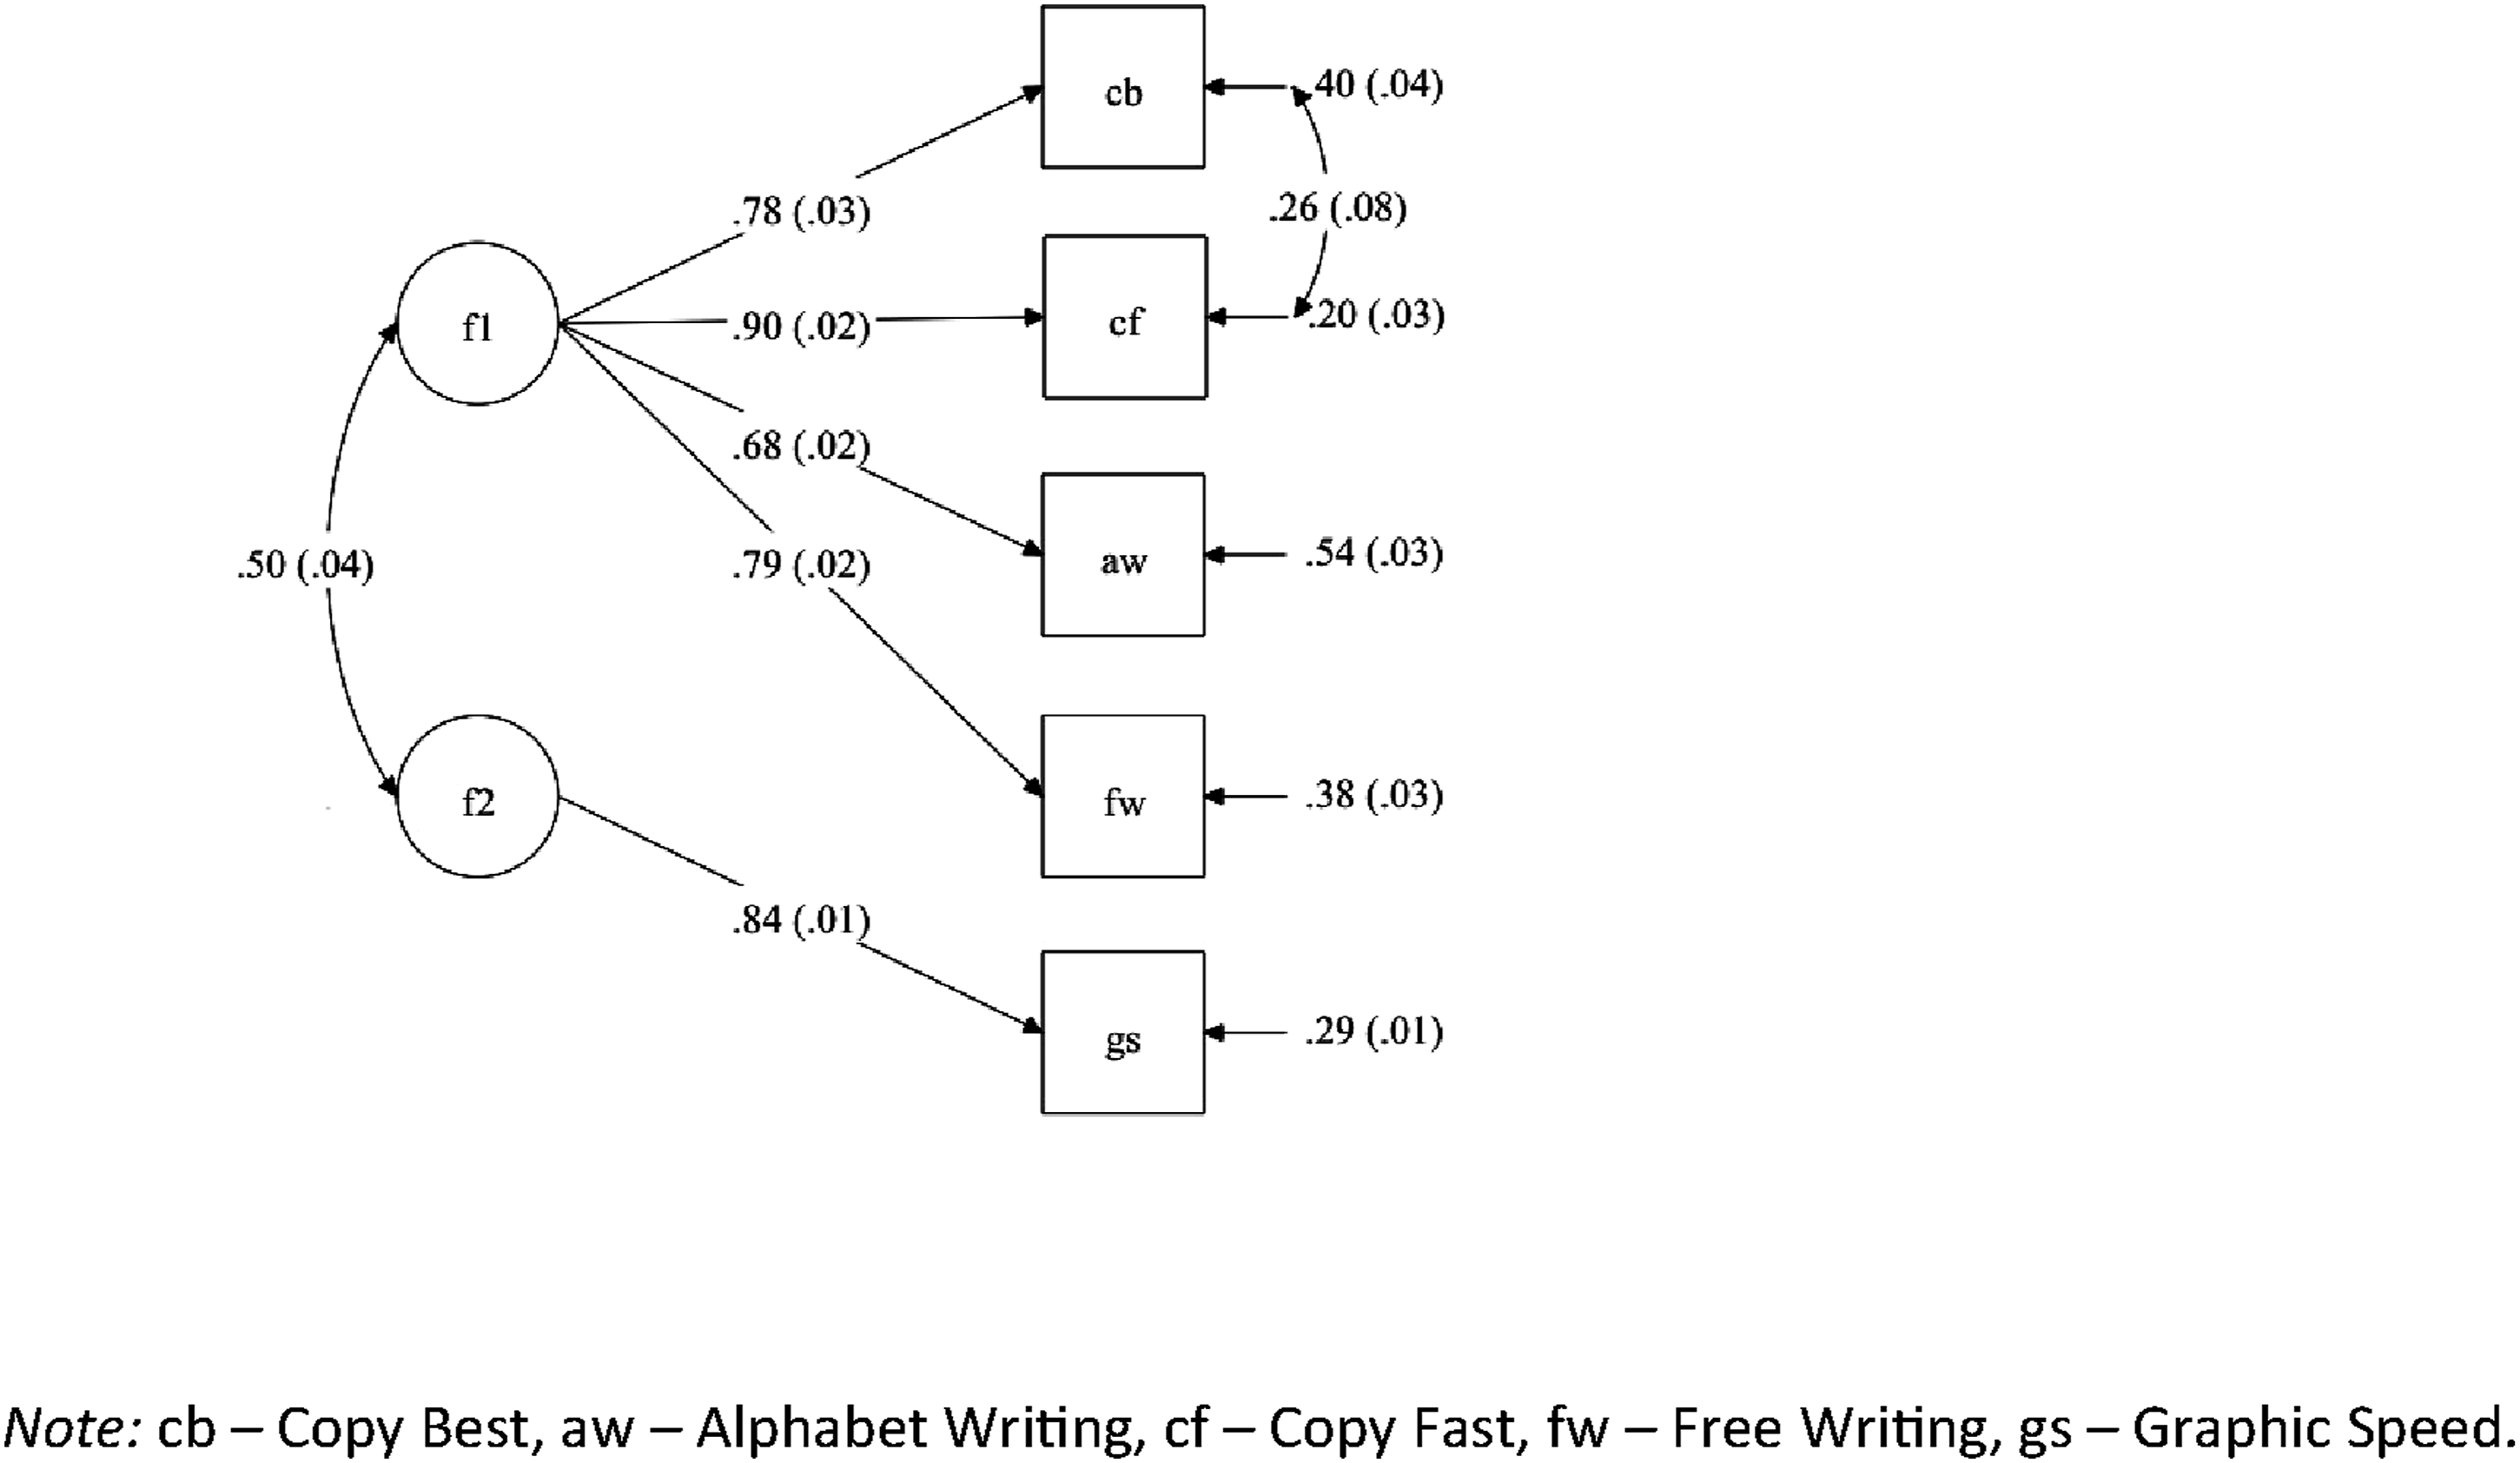
The standardized loadings are indicators of the relationship between the tasks and the factor underlying them and their squares are the percentages of variance taken into account by the factor. The residual variances are the remaining part of the score variance not taken into account by the factor (1-λ2).
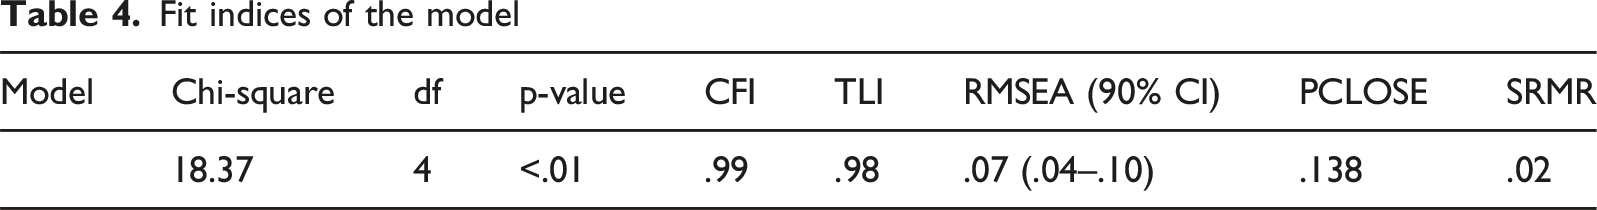
Fit indices of the model
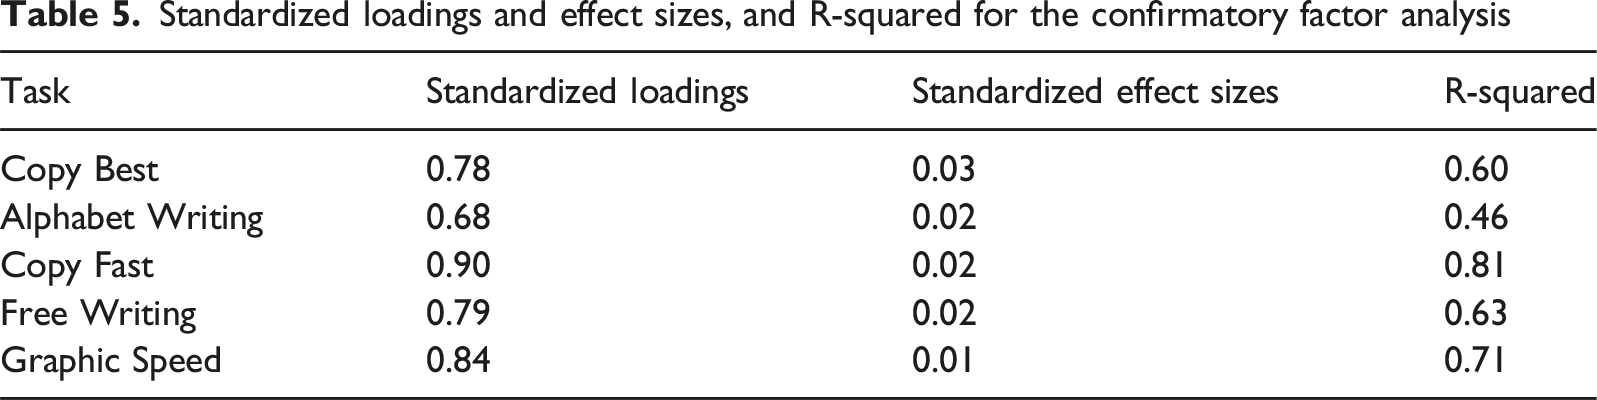
Standardized loadings and effect sizes, and R-squared for the confirmatory factor analysis
Measurement Invariance
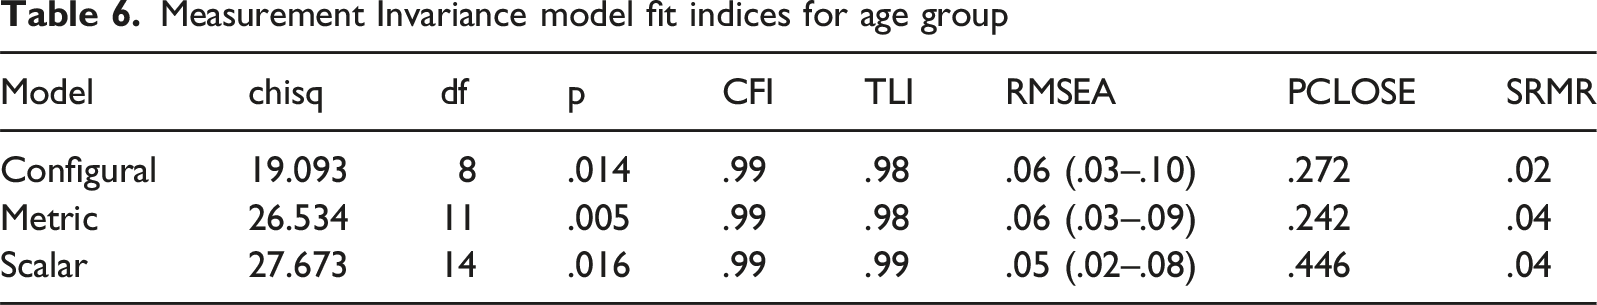
To assess the extent to which the factor structure is equivalent across two age ranges and for males and females, separately, Measurement Invariance analyses were performed using the Van de Schoot et al. (2012) procedure. This is a step-by-step procedure in which constraints on different parameters are progressively added to the model. The central idea is that by constraining these parameters to be equal across groups, the fit indices should not be significantly degraded. The three steps, Configural, Metric, and Scalar, are described below.
In the Configural invariant model, only the factor structure is identical. Factor loadings and intercepts can vary from group to group, regardless of how the groups are defined. This means that the same latent variables are measured in both groups, but the way in which they are measured may still differ. This level of invariance assesses the extent to which the same measurement model is suitable for describing the underlying structure of the two groups. If configural invariance is not found, the factor structure that underlies the scores is not the same for different groups and score configurations should therefore not be interpreted in the same way.
In the Metric invariant model, the factor structure is still identical but factor loadings are constrained to be equal between groups, in this case, age group or sex. This means that latent variables share the same scale across groups. The relationship between the latent variables and their indicators (the DASH-2 tasks) are, therefore, similar in both groups. If configural invariance is verified but metric invariance is not found, the relationship between one or several scores with their assigned factor is not the same in both groups and score configurations should therefore not be interpreted in the same way too.
In the Scalar invariant model, in addition to loadings, intercepts are also equated across groups. Intercepts are the score of indicators when the latent variable score is arbitrarily set to 0. This level of invariance makes it possible to compare the means of the latent variables between groups since the same observed score corresponds to the same level of ability. If scalar invariance is not found, any differences found between groups are not necessarily related to the latent trait, but to the measurement non-equivalence – the instrument favours a group despite an equivalent level of ability. Conversely, if scalar invariance is found, differences in latent variable means can be interpreted as reflecting true differences between groups.
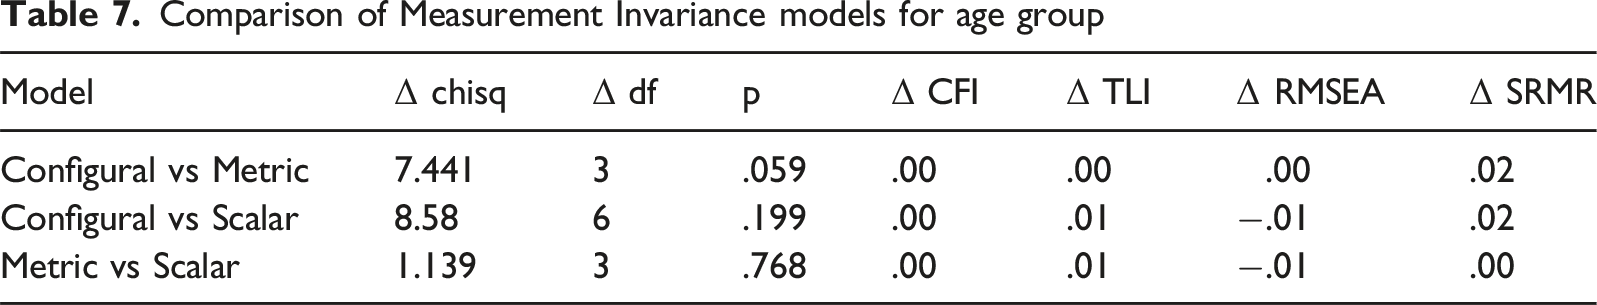
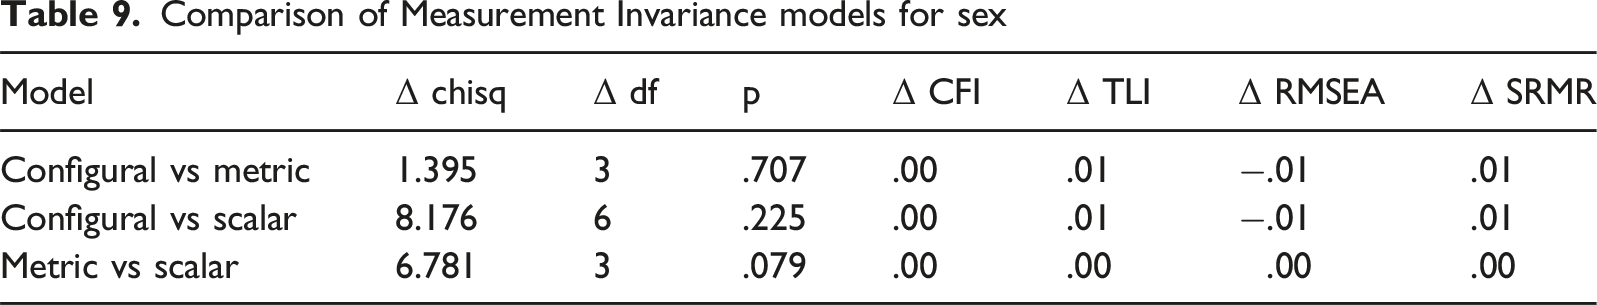
The level of measurement invariance is typically evaluated by changes in the CFI, RMSEA, and SRMR. Measurement invariance is supported if the change in the CFI (ΔCFI) of two models is 0.01 or less (Chen, 2007; Cheung & Rensvold, 2002) and the changes in the SRMR (ΔSRMR) less than 0.03 or RMSEA (ΔRMSEA) less than 0.015 (Chen, 2007).
Measurement Invariance model fit indices for age group
Comparison of Measurement Invariance models for age group
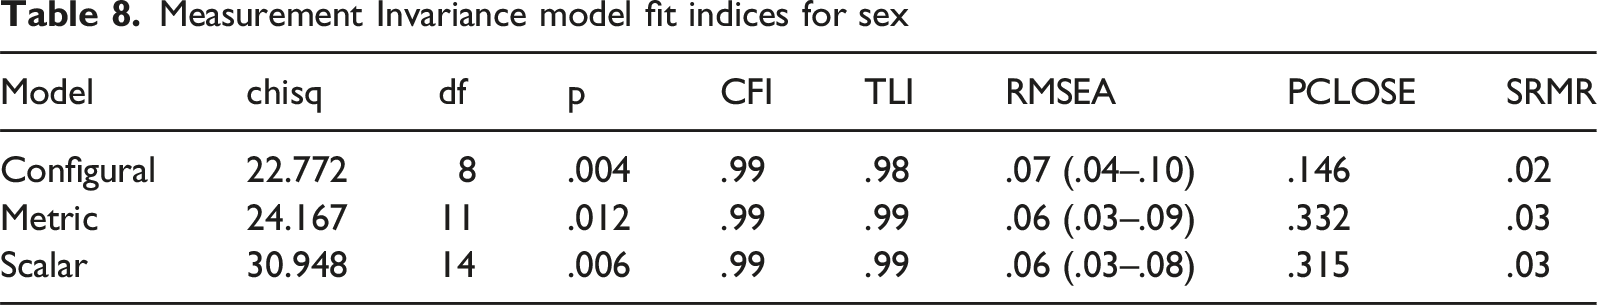
Measurement Invariance model fit indices for sex
Comparison of Measurement Invariance models for sex
Discussion
As an important component of literacy, handwriting continues be part of the school curriculum in many countries and contributes to learning and attainment throughout education. Without support and appropriate accommodations, students with handwriting difficulties may struggle to keep up with writing demands and to demonstrate their knowledge and understanding. As a result, they may under-perform in class activities and written examinations (Graham, 2022).
Since first being developed, the DASH and DASH17+ have been widely used in clinics, schools, and further/higher education settings to help identify those with handwriting difficulties, plan appropriate support, and to use as evidence in applying for accommodations and/or additional resources. Their contribution to the assessment process has also been recognized through various professional bodies including the Specific Learning Difficulties (SpLD) Assessment Standards Committee (SASC, 2024) in the UK and the Western Australian Occupational Therapy Association (DOT(WA), 2019). Both editions of the test have also been used in research studies to examine handwriting in various neurodevelopmental disorders including dysgraphia (Breaux & Munsell, 2025a; Richards et al., 2015), developmental coordination disorder (DCD) (Prunty & Barnett, 2020), and dyslexia (Sumner et al., 2013).
The DASH-2 can be used in different ways, depending on the purpose of assessment. In some situations, it is appropriate to use the DASH-2 in isolation. For example it can be used in a group setting to screen for handwriting difficulties on school entry; in this case the main focus may be just on the Total Standard Score. In contrast, when used in an individual setting, a range of information can be gathered to help understand the nature of a handwriting difficulty and help plan an intervention programme. All three editions of DASH differ from other handwriting tests in that they offer a multi-faceted measure of the speed of handwriting derived from four separate but related tasks. These differ in length and in the task demands, reflecting the complex processes involved in handwriting and writing. When inspected separately, as a profile, or a total score, they not only help a tester make decisions about diagnosis or service provision, they also help to pinpoint specific challenges the student is encountering. For example, Breaux and Munsell (2025a) draw particular attention to the value of comparing the Copy Best and Copy Fast tasks when differentiating different types of dysgraphia. Although described in the test manual as a supplementary score, the standard score for Graphic Speed, reflecting the ability to control a writing implement, is an important feature of the test. Performance on this task can lead assessors to better understand the possible contribution of motor difficulties to handwriting performance and consider the possibility of a broader motor difficulty in some students. In addition to the quantitative scores, a range of qualitative information can be gathered from observation of the student writing and later, through close inspection of the script. It can also be useful to administer other assessments alongside DASH-2 as part of a broader writing assessment. This may include measures of handwriting legibility, spelling, and written expression (Barnett & Prunty, 2021).
The latest edition, DASH-2, provides extended norms from 8 to 25 years. Data from the UK, Australia, and New Zealand are comparable, indicating that the norms can be used with confidence across these three regions. Furthermore, Breaux and Munsell (2025b) report a study comparing mean performance on the DASH-2 between a sample in the United States of America (USA) and a matched control group from the DASH-2 normative sample. There was no significant group difference for the individual tasks or for the total scores, suggesting that the test is also suitable for use in the USA.
Analyses of the normative data for DASH and subsequent editions have supported the calculation of a total standard score from the four core tasks: Copy Best, Alphabet Writing, Copy Fast, and Free Writing as a reliable global measure of handwriting speed across different writing tasks and under different conditions. The Graphic Speed task then acts as a valuable supplementary measure of grapho-motor ability, independent of a language element. In the current test manual, Confirmatory Factor Analysis (CFA) supporting this structure is reported. Two models were initially tested using CFA. The first included all five tasks in a common factor model and the second excluded Graphic Speed. Although the indices showed a good fit for both models, as previously reported for DASH and DASH17+, Graphic Speed had a smaller loading on the common factor than the other tasks (0.40 versus 0.66 to 0.93) and further supported presenting the DASH-2 scores as comprising two components, one focussing on tasks which come under the umbrella of the broader concept of writing, the other providing a measure of the physical ability to control a writing instrument.
The present study included further investigation of the structure of the test using CFA, this time taking account of the fact that the stimulus material for two of the tasks, Copy Best and Copy Fast is identical. The introduction of these correlated residuals improved the model significantly. The analyses were also extended to investigate measurement invariance across age group and sex nested within the broader target population. This is an important aspect of construct validation, as it considers whether the test’s factor structure, factor loadings, and intercepts are equivalent across different groups when subjected to increasingly restrictive parameter constraints.
As before, the CFA replicated the previous finding revealing one main factor comprising the four core tasks, with factor loadings on the main writing factor, ranging from the highest at .90 for Copy Fast to the lowest at .68 for Alphabet Writing and a second grapho-motor factor, comprising only the Graphic Speed task which has a substantial loading of 0.84. In addition, however, a significant correlation between the main writing factor and the grapho-motor speed factor suggested they are not entirely independent of each other. While we consider that the fit indices for the model tested in this study strongly support the current presentation of the test, this does not preclude the possibility that alternate models could be tested. The model of DASH-2 presented in the CFA was used to investigate measurement invariance (MI) across age groups and sex to determine whether the test scores can be confidently interpreted across groups in the same way. This is the first study to scrutinize the DASH-2 (or previous versions of the test) in this way and is important because without evidence of measurement invariance (MI) across different demographic groups, the extent to which the instrument may be susceptible to measurement error is not known. Three levels of MI were investigated: configural, metric, and scalar. Configural invariance determines whether the pattern of the factor loadings is the same across groups. Metric invariance considers both the factor structure and the factor loadings, indicating whether the importance of each task in relation to the factors is the same across groups. Finally, scalar invariance considers whether the way the test measures the level of ability is the same across groups. The validation of these three invariance models confirmed that the factor model of the DASH-2 maintained strong measurement invariance across the two age groups and across males and females. These findings indicate that test users can be confident that the scores obtained on DASH-2 are not influenced by measurement error due to age or sex and that the structure of the test is reliable. With regard to interpretation, therefore, the findings also mean that users can be confident that differences in scaled scores actually do reflect differences in the construct being measured rather than any differences in the way the test functions across these groups.
Conclusion and Implications for Practice
The findings of this study add substantially to the evidence of construct validity presented for DASH-2 to date and have important implications for test users. DASH-2 is unique in that it offers a multi-faceted measure of speed of handwriting. The new data reported in this study, demonstrating invariance across age group and sex, means that clinicians and educators can interpret group differences as reflecting actual differences in handwriting speed rather than measurement error. Most importantly, this supports the fairness of using DASH-2 scores to make diagnostic or accommodation decisions across different age levels and across males and females.
In addition to the main scores examined in this study, DASH-2 provides a range of quantitative and qualitative information useful for the practitioner. This includes a profile of performance across the five tasks plus a measure of the difference between the two copying tasks (reflecting the ability to speed up on instruction). DASH-2 also provides an opportunity to record the process of writing through qualitative observations made during task performance (e.g. posture and how letters are formed). Close inspection of the final product in all tasks can also provide detailed information useful for intervention planning. When taken together with the standard test scores, DASH-2 therefore allows testers from many different professions to produce a comprehensive picture of an individual’s handwriting competence.
Footnotes
Ethical Consideration
Ethical approval was granted from Pearson Clinical Scientific Council, Texas USA.
Consent to Participate
Informed consent was provided by participants and/or their parent/caregiver.
Funding
The authors disclosed receipt of the following financial support for the research, authorship, and/or publication of this article: The project was funded by Pearson Clinical.
Declaration of Conflicting Interests
The authors declared the following potential conflicts of interest with respect to the research, authorship, and/or publication of this article: ALB, BS, and SEH receive royalties from the sales of DASH-2. LCV is employed by Pearson Clinical.
Data Availability Statement
The data are not made available.