
Abstract
This study examines the psychometric properties of the Short-Form of the State Self-Esteem Scale (SSES-S) among Turkish adolescents. A total of 422 adolescents (60.64% girls) aged 14–18 years (M = 15.78, SD = 1.01) participated across three studies, which included exploratory factor analysis (EFA), confirmatory factor analysis (CFA), and additional validation analyses. Findings support the reliability and validity of the SSES-S scores, validating its three-factor structure—academic performance, physical appearance, and social success—with acceptable internal consistency and measurement invariance across sex. Multi-group item response theory (MGIRT) results indicated variability in item discrimination and difficulty across sex. For example, Item 11 demonstrated high discrimination (3.69), while Item 8 showed low discrimination (0.56), particularly among boys. Additionally, boys had lower difficulty thresholds for academic performance items, whereas girls showed lower thresholds for social success and physical appearance. Differential item functioning (DIF) was identified in two items–one at a moderate level and one at a large level–suggesting potential bias and the need for item-level refinement. While the SSES-S shows generally acceptable psychometric properties, these item-level findings warrant caution when making comparisons across sex. Continued research is recommended to address identified limitations and explore sociocultural influences on item functioning.
Keywords
Introduction
Adolescence is a critical developmental period characterized by rapid psychological, emotional, and social changes (Livingstone & Isaacowitz, 2018). During this time, individuals form increasingly complex self-concepts and become highly sensitive to feedback from peers, parents, and individuals within academic environments. Among the many psychological constructs relevant to adolescent development, self-esteem—one’s evaluative perception of self-worth—has been shown to play a central role in emotional well-being, social functioning, and academic adjustment (Orth & Robins, 2014; Tsang & Yip, 2006). Low self-esteem in adolescence is linked to a range of adverse outcomes, including depression, anxiety, and poor interpersonal relationships (Harring, 2024; Kurnaz et al., 2020). Given the importance of self-esteem for adolescent mental health and development, it is essential to use psychometrically sound tools to assess it. This study therefore aims to evaluate the psychometric properties of the Short-Form State Self-Esteem Scale (SSES-S) among Turkish adolescents.
Self-Esteem and Adolescent Development
Self-esteem is a crucial psychological construct that begins forming in early childhood and continues to evolve through adolescence into adulthood, shaped by a range of social and environmental influences (Burger & Mortimer, 2024). It is one of the most widely studied self-referential variables in adolescent development (Supervía et al., 2022). Adolescents with higher self-esteem tend to exhibit better psychological functioning (Rey et al., 2011) and experience greater mental well-being later in life (Boden et al., 2008). In contrast, low self-esteem has been associated with a wide range of negative outcomes, including poor academic attitudes (Barragán Martín et al., 2021), loneliness (Lyyra et al., 2021), depressive symptoms (Gu et al., 2024), emotional and behavioral difficulties (Pandey et al., 2025), eating disorders such as loss-of-control eating (Beckers et al., 2025), and anxiety (Han et al., 2025).
Self-esteem is a multifaceted construct with significant implications in personality, social, and clinical psychology. It encompasses beliefs and emotions such as pride, shame, achievement, and hopelessness, reflecting an individual’s overall self-worth and personal development (Giri, 2020; Hepper, 2016). According to sociometer theory, self-esteem functions as a monitor of social acceptance, suggesting that it regulates behavior in response to social inclusion or exclusion cues (Bale & Archer, 2013; Wu et al., 2017). Given that adolescents are highly sensitive to peer evaluation, state self-esteem may play a particularly important role in their social and emotional well-being (Sakız et al., 2021; Steinsbekk et al., 2020).
Trait vs. State Self-Esteem
Self-esteem is typically conceptualized as either a trait or a state (McCain et al., 2015). Trait self-esteem refers to an individual’s overall and enduring evaluation of their self-worth, which tends to remain relatively stable over time (Hank & Baltes-Götz, 2019; Salice, 2020; Westfall, 2020). In contrast, state self-esteem refers to momentary fluctuations in self-worth that occur in response to immediate experiences or situational factors (Brito et al., 2023; McCain et al., 2015). These two forms are conceptually distinct yet theoretically related: individuals with high trait self-esteem may experience smaller or more regulated fluctuations in state self-esteem, whereas those with low trait self-esteem may exhibit more volatility in their self-worth across contexts (DeHart & Pelham, 2007; Hank & Baltes-Götz, 2019). Adolescents are particularly vulnerable to these fluctuations, as their self-perceptions are shaped by ongoing changes in academic performance, peer feedback, and social media exposure.
Understanding state self-esteem is therefore crucial in adolescence, as it captures the dynamic and situational aspects of self-worth that may not be reflected in trait-level assessments. Given the developmental sensitivity of this period, research focusing on state self-esteem provides valuable insights into adolescents’ daily psychological experiences and the contextual factors that influence them (Maldonado et al., 2013; Mertens et al., 2022).
The Short-Form State Self-Esteem Scale (SSES-S)
The Short-Form State Self-Esteem Scale (SSES-S) reflects a sociometer-based conceptualization of self-esteem, which views self-worth as a dynamic, situation-sensitive gauge of perceived social inclusion and evaluation (Leary & Baumeister, 2000). Unlike trait-oriented measures such as the Rosenberg Self-Esteem Scale (RSE), which assess global and relatively stable self-evaluations, the SSES-S is designed to capture moment-to-moment fluctuations in state self-esteem across three domains: academic performance, physical appearance, and social success (Brito et al., 2023). Each domain corresponds to a core developmental task in adolescence: performing in school, managing body image concerns, and navigating peer relationships.
This multidimensional and reactive structure distinguishes the SSES-S from traditional unidimensional trait-based scales by offering greater ecological validity—particularly in adolescence, a period marked by identity exploration and social sensitivity. The SSES-S is especially relevant for use in Turkey, where academic achievement is emphasized socially and institutionally, beauty norms are influenced by both traditional values and modern media, and collectivist social expectations shape interpersonal dynamics. These cultural factors may amplify domain-specific self-esteem fluctuations, underscoring the need for a flexible, context responsive tool such as the SSES-S in both research and practice.
Sex and State Self-Esteem
Prior studies have reported sex-based differences in state self-esteem (Aftab & Aslam, 2014; Vitolo, 2022). Girls often report lower self-esteem in appearance and social domains, whereas boys may be more affected by challenges in academic or performance-related settings. These differences may be explained by sex socialization theory, which posits that cultural norms and expectations influence how boys and girls value different aspects of the self (Eccles, 1994). In the Turkish context, girls may experience greater pressure to conform to appearance ideals and relational expectations, while boys may be expected to demonstrate competence and success. These culturally shaped values can result in domain-specific vulnerabilities and fluctuations in state self-esteem, reinforcing the need to assess the scale’s measurement invariance across sex.
Current Study
The SSES was developed by Heatherton and Polivy (1991) to assess domain-specific fluctuations in state self-esteem and originally included three factors: social, performance, and appearance. Brito et al. (2023) later developed the SSES-S, a 12-item version that retained the original factor structure but adapted the dimensions to academic performance, physical appearance, and social success. The SSES-S scores demonstrate good reliability and validity across multiple samples, including adolescents and university students in both Western (Escrivá-Martínez et al., 2025) and non-Western (e.g., Ugwu et al., 2023) contexts.
In Turkey, research on self-esteem has largely relied on trait-based measures, particularly the RSE (Rosenberg, 1965), which was adapted by Çuhadaroğlu (1986). While useful, trait measures may not capture the moment-to-moment fluctuations in self-esteem that adolescents often experience in response to social, academic, and appearance-related stressors. This is especially relevant in the Turkish context, where strong academic expectations, deeply rooted sex norms, and collectivist cultural values may shape how adolescents perceive themselves in different domains.
Although a Turkish adaptation of the SSES-S has been developed for adults (Kurnaz & Koçtürk, 2025), no version has yet been validated for adolescents— a critical oversight given adolescence is a developmental period marked by high emotional reactivity and identity formation. Understanding how state self-esteem operates within this population and cultural setting can support more accurate assessment and inform culturally responsive interventions.
Given this gap, the primary aim of this study was to examine the psychometric properties of the SSES-S among Turkish adolescents. This included an evaluation of its factor structure, reliability, and validity, along with an investigation of measurement invariance across sex to ensure that the scale functions equivalently for boys and girls. Furthermore, a multi-group item response theory (IRT) analysis was conducted to examine the discriminatory power of the SSES-S items and to explore how item parameters differ by sex. IRT offers a more precise and item-level analysis than classical test theory, providing deeper insights into the scale’s functioning across subgroups. By developing and validating a culturally sensitive, psychometrically robust tool for assessing state self-esteem in Turkish adolescents, this study aims to enhance both research and applied practice in adolescent mental health.
Study 1: Exploratory Factor Analysis of SSES-S
Method
Participants
The study initially recruited 212 adolescents; however, two participants were excluded due to 100% missing data on the SSES-S items. The final sample consisted of 210 adolescents (58.57% girls, n = 123), aged 14–18 years (M = 15.67, SD = 1.07). Participants were in grades 9 through 12 (M = 10.43, SD = 1.05); specifically, 24.29% (n = 51) were in 9th grade, 26.19% (n = 55) in 10th grade, 31.43% (n = 66) in 11th grade, and 18.10% (n = 38) in 12th grade. All participants were of Turkish ethnicity and fluent in Turkish, which was their primary language. Regarding socioeconomic status (SES), 92.38% (n = 194) of the participants were from a middle SES, 4.76% (n = 10) were from a high SES, and 2.86% (n = 6) were from a low SES. A sample size of 210 was deemed adequate for conducting exploratory factor analysis (EFA) of the 12-item SSES-S. While traditional guidelines often suggest 5 to 10 participants per item (Fabrigar et al., 1999), more recent and robust recommendations emphasize the importance of absolute sample size and factor-to-item ratios. For instance, Comrey and Lee (1992) classified a sample of 200 as “fair” and 300 as “good” for factor analysis. Additionally, Costello and Osborne (2005) recommended a minimum of 100 participants per factor, which would require at least 300 participants for a three-factor model. Although our EFA sample falls slightly below that stricter threshold, it meets the commonly accepted standards for item-to-participant ratios and exceeds the minimum of 200 often cited as sufficient for stable factor extraction (MacCallum et al., 1999). Therefore, the sample size used in this phase is considered adequate for the intended analysis.
Instruments
Short-Form of State Self-Esteem Scale (SSES-S)
The SSES-S, originally developed as a short form of the SSES (Heatherton & Polivy, 1991) by Brito et al. (2023), was adapted into Turkish by Kurnaz and Koçtürk (2025). During the adaptation process, Kurnaz and Koçtürk (2025) conducted a backward translation procedure and implemented a two-phase adaptation process with Turkish adult participants. The Turkish version of the SSES-S demonstrated measurement invariance across sex in adult samples. The scale consists of 12 items across three factors–academic performance, physical appearance, and social success–with four items per factor. The original version demonstrated high internal consistency in adult samples (ω = .87; α = .80; λ6 = .89). Additionally, confirmatory factor analysis (CFA) indicated that the goodness-of-fit indices were within acceptable ranges in adult populations χ2 (32) = 81.58 p <. 001; CFI = .96; GFI = .93; TLI = .94; RMSEA = .08, (90% CI: .07 to .11); SRMR = .08. Because the current study examined the scale’s psychometric properties in adolescents, the internal consistency of the SSES-S in this sample was assessed separately. The Cronbach’s α, McDonald’s ω, and Guttman’s λ2 values were computed to ensure scale reliability in this population (see Results section).
Procedures
Ethical approval for this study was obtained from the Necmettin Erbakan University Social and Humanities Scientific Research Ethics Committee (Report No: 23066/33). Data were collected from adolescents through high school counselors using a paper-and-pencil administration of the Short-Form State Self-Esteem Scale (SSES-S). The school counselors, who received standardized training in the administration procedures, facilitated the data collection process by obtaining written parental consent and informed assent from the adolescents. Participants and their parents were informed that counseling services would be available if needed through the counseling center affiliated with the institution where the first author is employed.
Results
Preliminary Analyses
To handle missing data, Little’s (1988) Missing Completely at Random (MCAR) test was conducted using SPSS (version 27). The results indicated that data were missing completely at random (χ2 = 58.08, df = 59, p = .51). As the percentage of missing data was low (<5%), missing values were imputed using the Expectation-Maximization (EM) algorithm. The assumption of normality was assessed by examining skewness and kurtosis values using JASP (version 0.19.3). All skewness values were below 3, and kurtosis values were below 8, confirming that the data followed a normal distribution (Kline, 2016).
Exploratory Factor Analysis (EFA)
Principal axis factoring (PAF) was used to examine the factor structure of the SSES-S for adolescents. EFA was conducted using JASP (version 0.19.3). Firstly, PAF was conducted without rotation, and Bartlett’s sphericity test and Kaiser-Meyer-Olkin (KMO) test were performed to determine whether the data were suitable for EFA. Bartlett’s sphericity test was significant (χ2 = 53.11; df = 33, p = .015), indicating that the correlation matrix was factorable. Additionally, the overall KMO value was .813, with individual item values ranging from .742 to .943, suggesting that the sample was well-suited for factor analysis (Hair et al., 2009; Tabachnick & Fidell, 2014).
PAF was used to extract latent factors, as it is preferable for potential correlated psychological constructs (Costello & Osborne, 2005). The PAF results suggested a three-factor structure, with eigenvalues greater than 1 (Netemeyer et al., 2003). To confirm this structure, a parallel analysis was conducted. The first three factors had real eigenvalues exceeding those from randomly generated datasets.: Factor 1 –– real data = 3.78, simulated = 0.64; Factor 2 –– real data = 1.14, simulated = 0.35; and Factor 3 –– real data = 0.37, simulated = 0.27. However, the fourth factor’s real eigenvalue (0.11) was lower than simulated eigenvalue (0.17), indicating that only the first three factors should be retained. These results were further supported by the scree plot (Figure 1), which showed a distinct inflection point after the third factor. Because the factors were expected to be correlated, oblimin rotation (an oblique rotation method) was applied (Costello & Osborne, 2005). Parallel Analysis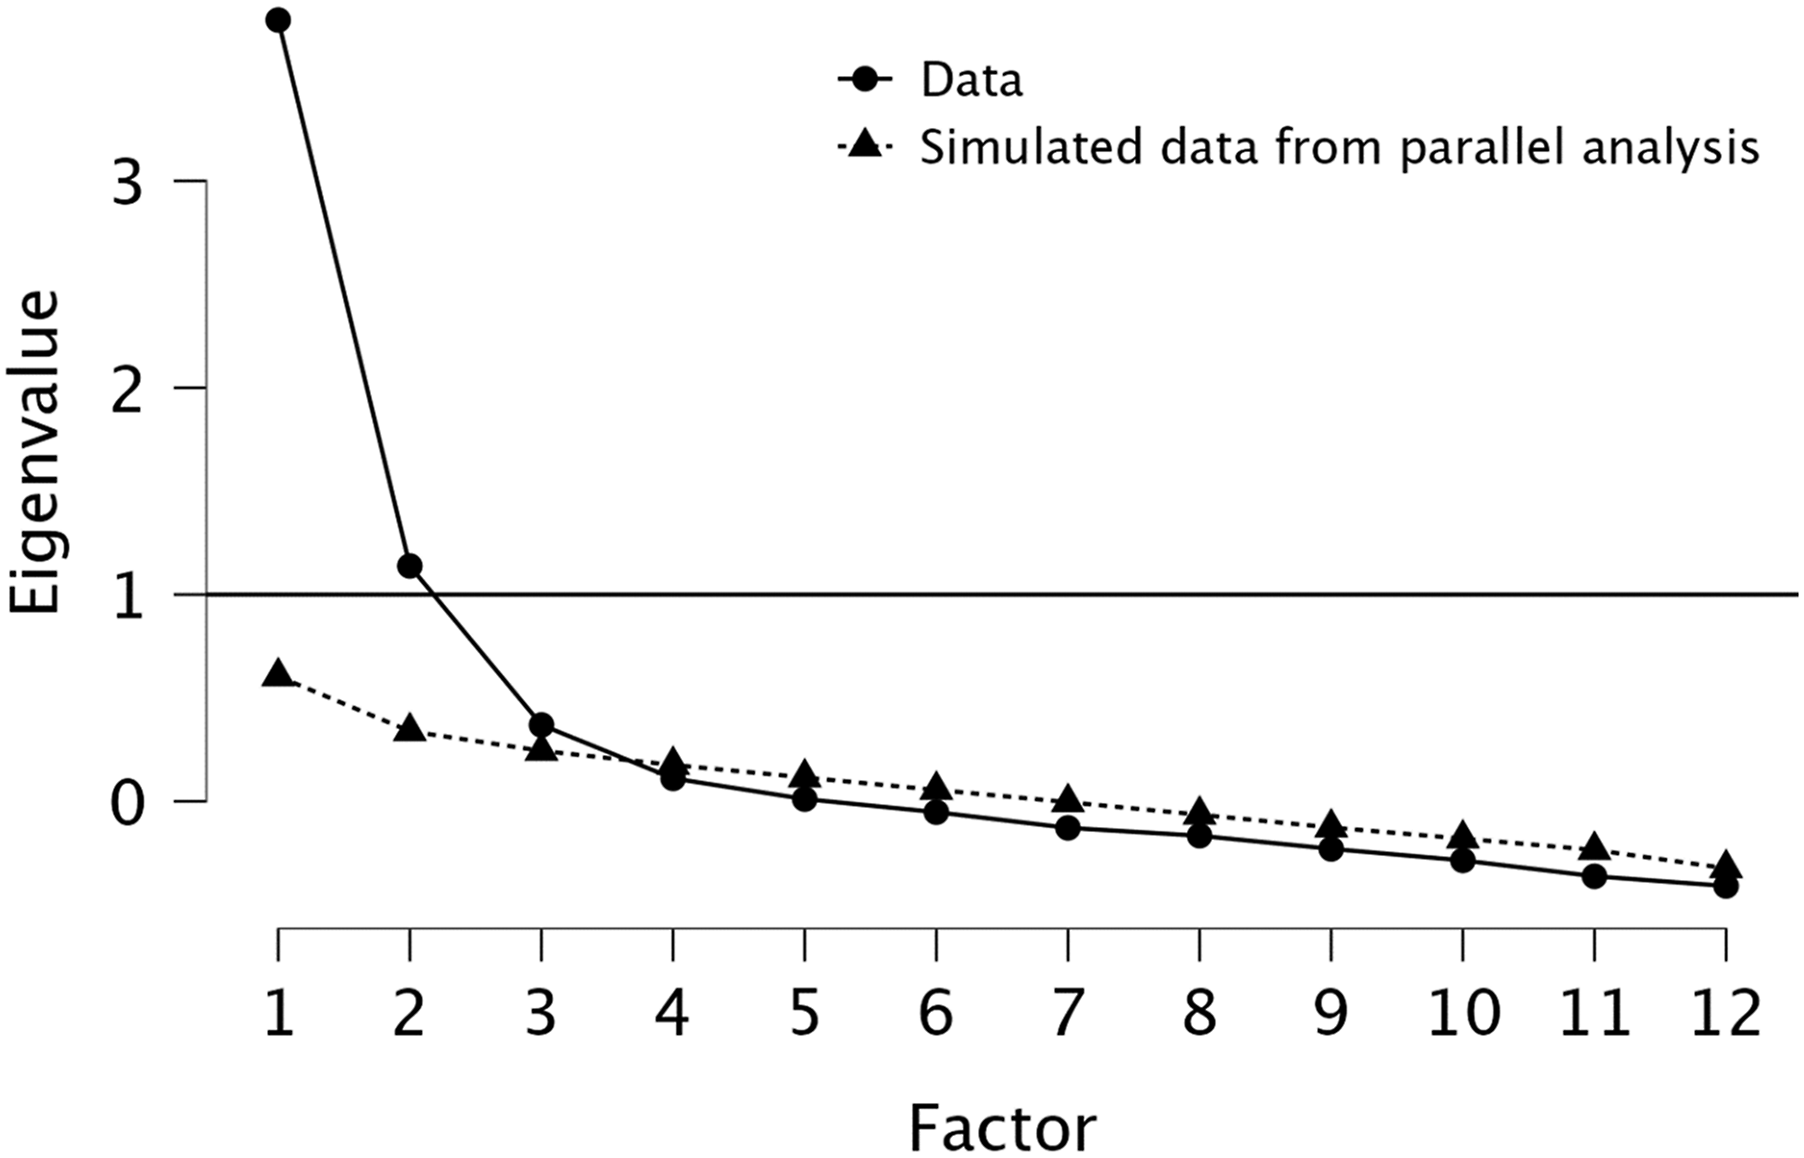
EFA and CFA Results for the SSES-S
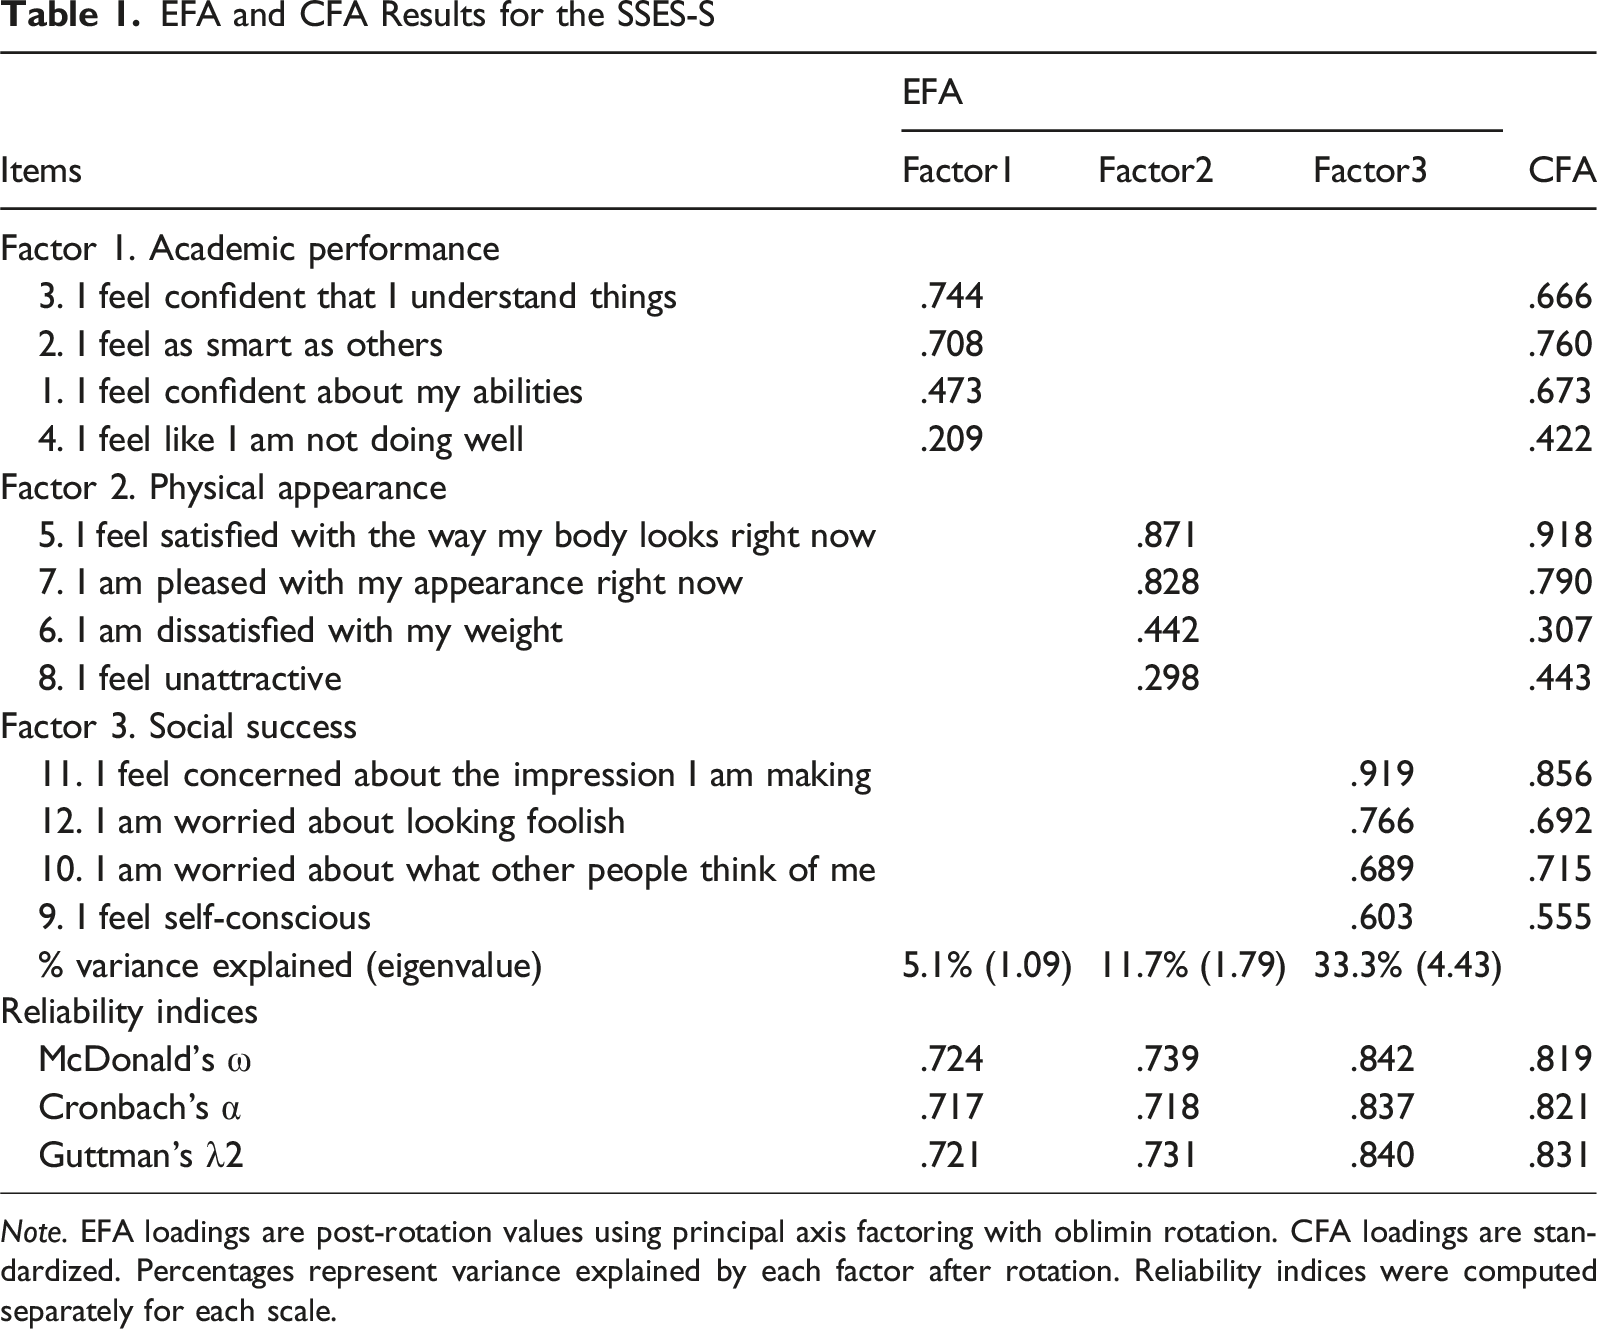
Note. EFA loadings are post-rotation values using principal axis factoring with oblimin rotation. CFA loadings are standardized. Percentages represent variance explained by each factor after rotation. Reliability indices were computed separately for each scale.
Study 2: Confirmatory Factor Analysis of SSES-S
Method
Participants
The initial sample consisted of 220 adolescents; however, eight participants were excluded due to 100% missing data, resulting in a final sample of 212 adolescents (62.74% girls, n = 133), aged 14 to 18 years (M = 15.87, SD = 0.94). Participants were in grades 9 through 12 (M = 10.34, SD = 0.99), with 22.64% (n = 48) were in 9th grade, 35.38% (n = 75) in 10th grade, 27.36% (n = 58) in 11th grade, and 14.62% (n = 31) in 12th grade. All participants were of Turkish ethnicity and fluent in Turkish, which was their primary language. In terms of socioeconomic status (SES), the majority of participants (83.96%, n = 178) were from a middle-income background, while 11.79% (n = 25) were from a high-income background, and 2.86% (n = 6) were from a low-income background. To ensure an adequate sample size for CFA, we followed recommendations suggesting a minimum of 5–10 participants per item (Kline, 2016). Given that the SSES-S has 12 items, the sample size of 212 participants met these criteria.
Instruments
Rosenberg Self-Esteem Scale (RSE)
The RSE (Rosenberg, 1965) was adapted into Turkish by Çuhadaroğlu (1986). The scale consists of 10 items (5 positive, 5 negative), with lower scores indicating higher self-esteem. The original Turkish adaptation reported acceptable internal consistency (α = .74). In the present study, the RSE demonstrated strong internal consistency (α = .88; ω = .88; λ2 = .88).
Procedures
To validate the factor structure of the SSES-S identified in Study 1, a CFA was conducted with a new sample of high school students. Data collection followed the same procedures as in Study 1, using the paper-and-pencil method through the school counselor. Parental consent and informed assent were obtained prior to participation. Adolescents and their parents were informed that counseling services were available through the counseling center affiliated with the institution where the first author works.
Results
Preliminary Analyses
To assess the impact of missing data, Little’s (1988) MCAR test was conducted. The results indicated that missing data were completely at random (χ2 = 84.31, df = 79, p = .32) and were subsequently imputed using the EM algorithm. Skewness and kurtosis values were examined to assess normality. All skewness values were below 3, and kurtosis values were below 8, indicating that the data followed a normal distribution.
Confirmatory Factor Analysis (CFA)
A CFA was conducted using JASP (version 0.19.3) with robust maximum likelihood estimation method to evaluate three-factor structure (academic performance, physical appearance, and social success) identified in Study 1. Model fit was assessed using widely accepted criteria: CFI and TLI values ≥.90 indicate acceptable fit, RMSEA values ≤.08 reflect reasonable error of approximation, and SRMR values ≤.08 are considered acceptable (Hu & Bentler, 1999; Kline, 2016). The results indicated an acceptable model fit for Turkish adolescents χ2 (51) = 95.93; p < .001; χ2/df = 1.88; CFI = .943; GFI = .931; TLI = .927; RMSEA = .064, (90% CI: .044 to .084); SRMR = .066. Factor loadings for all items were above .40, except for Item 6, which had a low factor loading (see Figure 2). Despite this, the item was retained due to theoretical significance. Future research may explore whether modifications to Item 6 could improve its alignment with the underlying construct. CFA Results of SSES-S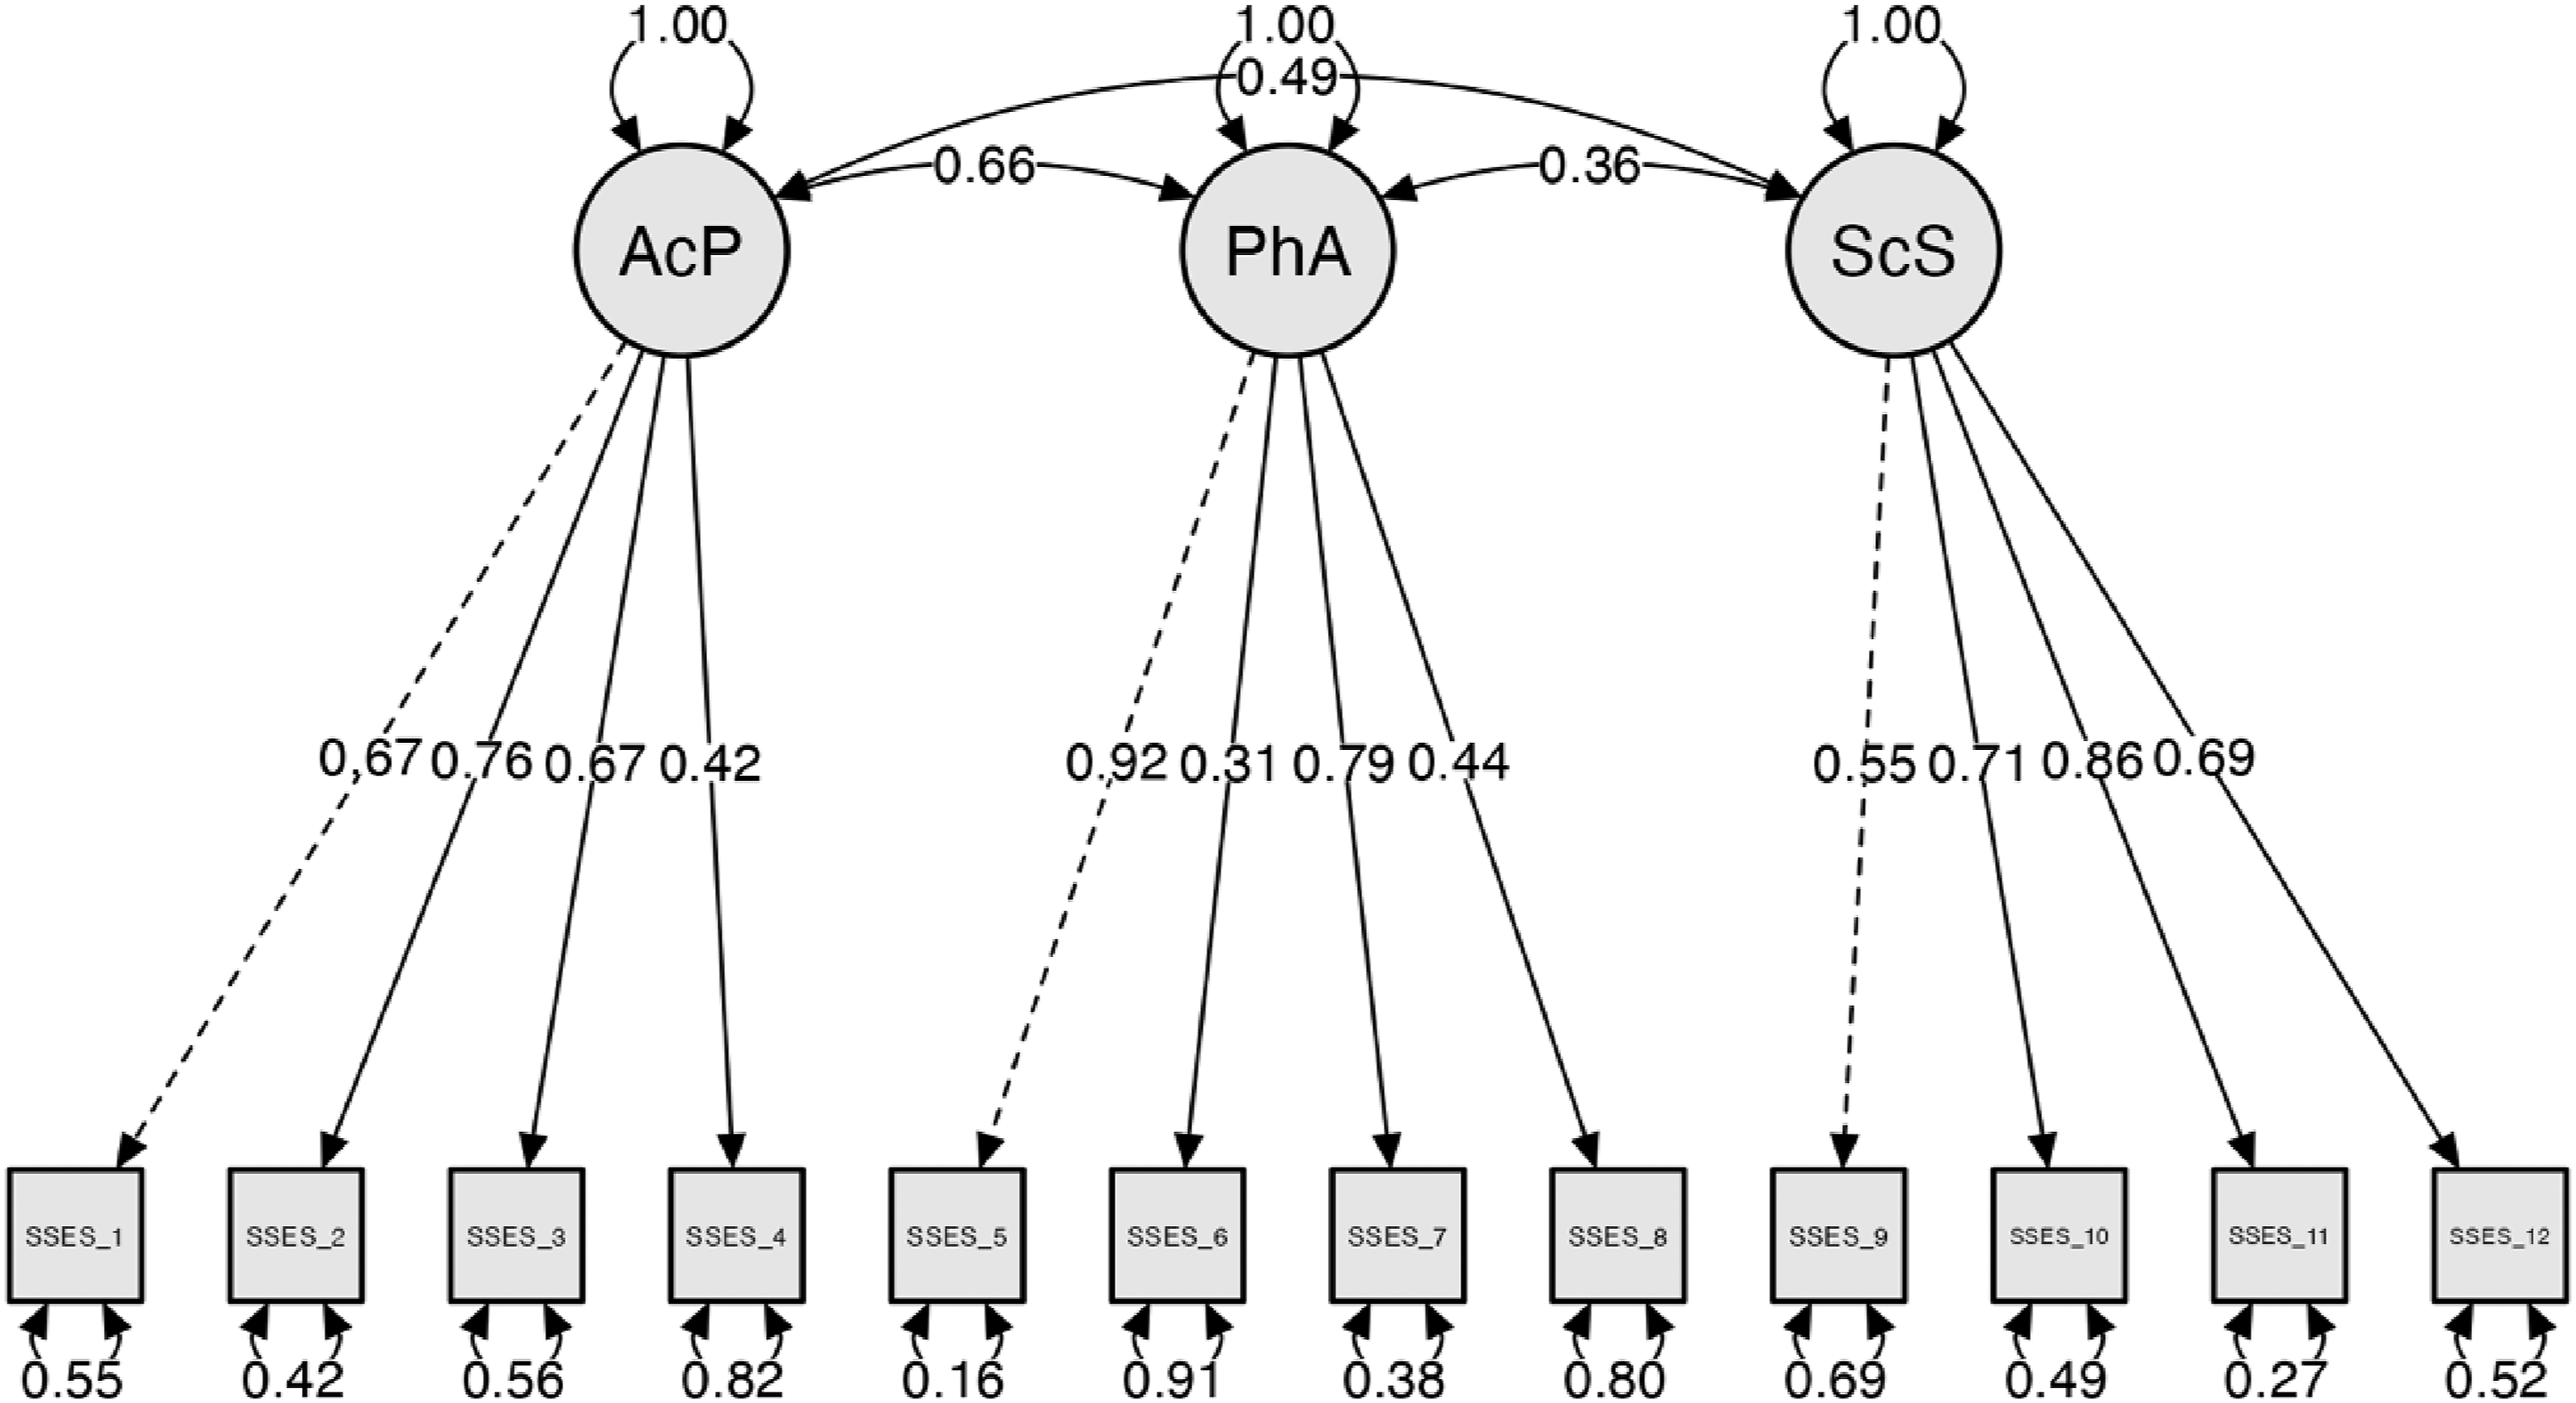
Internal Consistency and Evidence Based on Relations to Other Variables
The internal consistency of the SSES-S′ factors was evaluated using Cronbach’s α, McDonald’s ω, and Guttman λ2. The reliability estimates were acceptable for all three factors: academic performance (α = .712, ω = .728, λ2 = .722), physical appearance (α = .688, ω = .697, λ2 = .699), and social success (α = .793, ω = .798, λ2 = .796). Although some coefficients were in the high .60s, such values are considered acceptable in the context of cross-cultural or group-specific validation studies, particularly within psychological and educational research (Nunnally & Bernstein, 1994).
To provide evidence based on relations to other variables, SSES-S factor scores were correlated with the RSE scores. These bivariate correlation analyses were conducted using JASP (version 0.19.3). The correlations were statistically significant and negative, consistent with theoretical expectations that momentary fluctuations in self-esteem (state self-esteem) may inversely relate to more stable self-appraisals (Heatherton & Polivy, 1991): academic performance (r = −.55, p < .001), physical appearance (r = −.52, p < .001), and social success (r = −.61, p < .001). According to Cohen’s (1988) guidelines, correlations of approximately .10 are considered small, around .30 are moderate, and .50 or higher are large in magnitude. Thus, the observed correlations represent large effect sizes, providing strong validity evidence for the SSES-S scores. The SSES-S is conceptualized as a three-factor structure, consistent with the original model proposed by Brito et al. (2023).
Study 3: Multi-Group CFA, Item Response Theory, and Differential Item Functioning Analysis of the SSES-S
Method
Participants
The final sample consisted of 422 adolescents, of whom 256 (60.64%) were girls, with ages ranging from 14 to 18 years (M = 15.78, SD = 1.01). In terms of socioeconomic status, the majority of participants (88.15%, n = 372) were from a middle-income background, while 8.29% (n = 35) were from a high-income background, and 3.32% (n = 14) were from a low-income background.
Procedures
To further evaluate the psychometric properties of the SSES-S, data from Study 1 and Study 2 were combined, resulting in a total sample of 422 adolescents. Three types of analyses were conducted to provide a comprehensive assessment of the scale. First, a multi-group CFA was performed to examine whether the factor structure of the SSES-S was invariant across sex. This analysis was conducted using JASP (version 0.19.3). Second, a multi-group IRT analysis was conducted to estimate the discrimination and difficulty parameters of each SSES-S item using the graded response model (GRM). This analysis was performed in R (version 4.4.2; R Core Team, 2024) using the mirt package (Chalmers, 2012) and the psych package (Revelle, 2024). Lastly, a differential item functioning (DIF) analysis was conducted using the lordif package (Choi et al., 2011), applying both the Mantel–Haenszel (MH) and logistic regression (LR) methods to evaluate potential item bias across sex.
Results
Multi-Group Confirmatory Factor Analysis (MG-CFA)
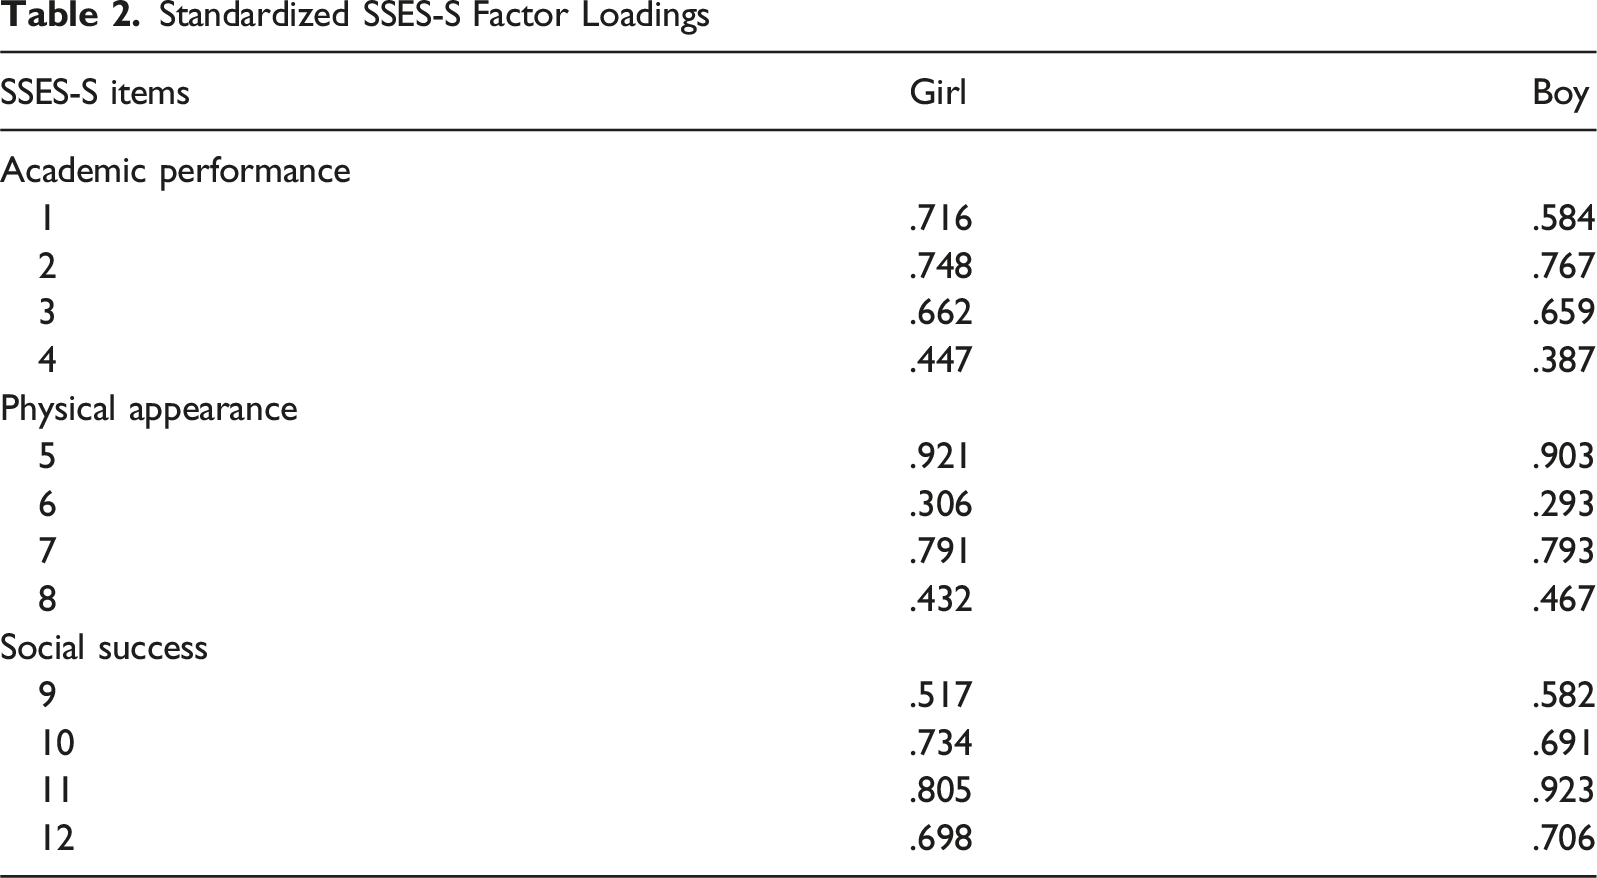
Standardized SSES-S Factor Loadings
Measurement Invariance Results from Multigroup CFA by Sex
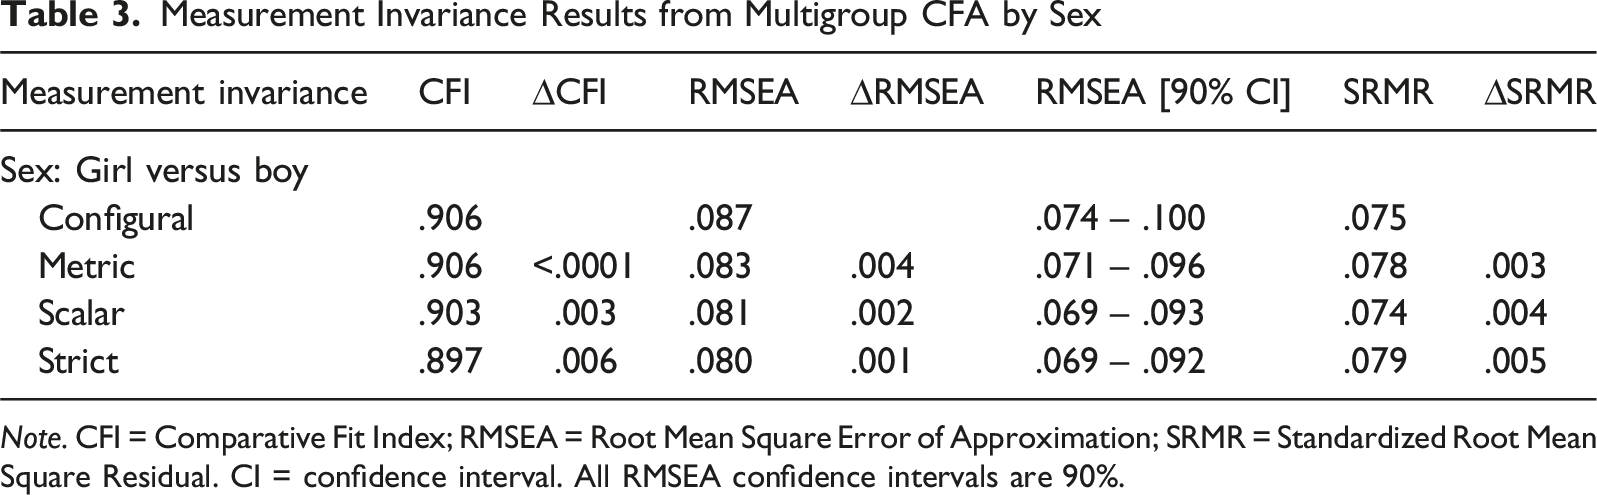
Note. CFI = Comparative Fit Index; RMSEA = Root Mean Square Error of Approximation; SRMR = Standardized Root Mean Square Residual. CI = confidence interval. All RMSEA confidence intervals are 90%.
Multi-Group Item Response Theory (MGIRT)
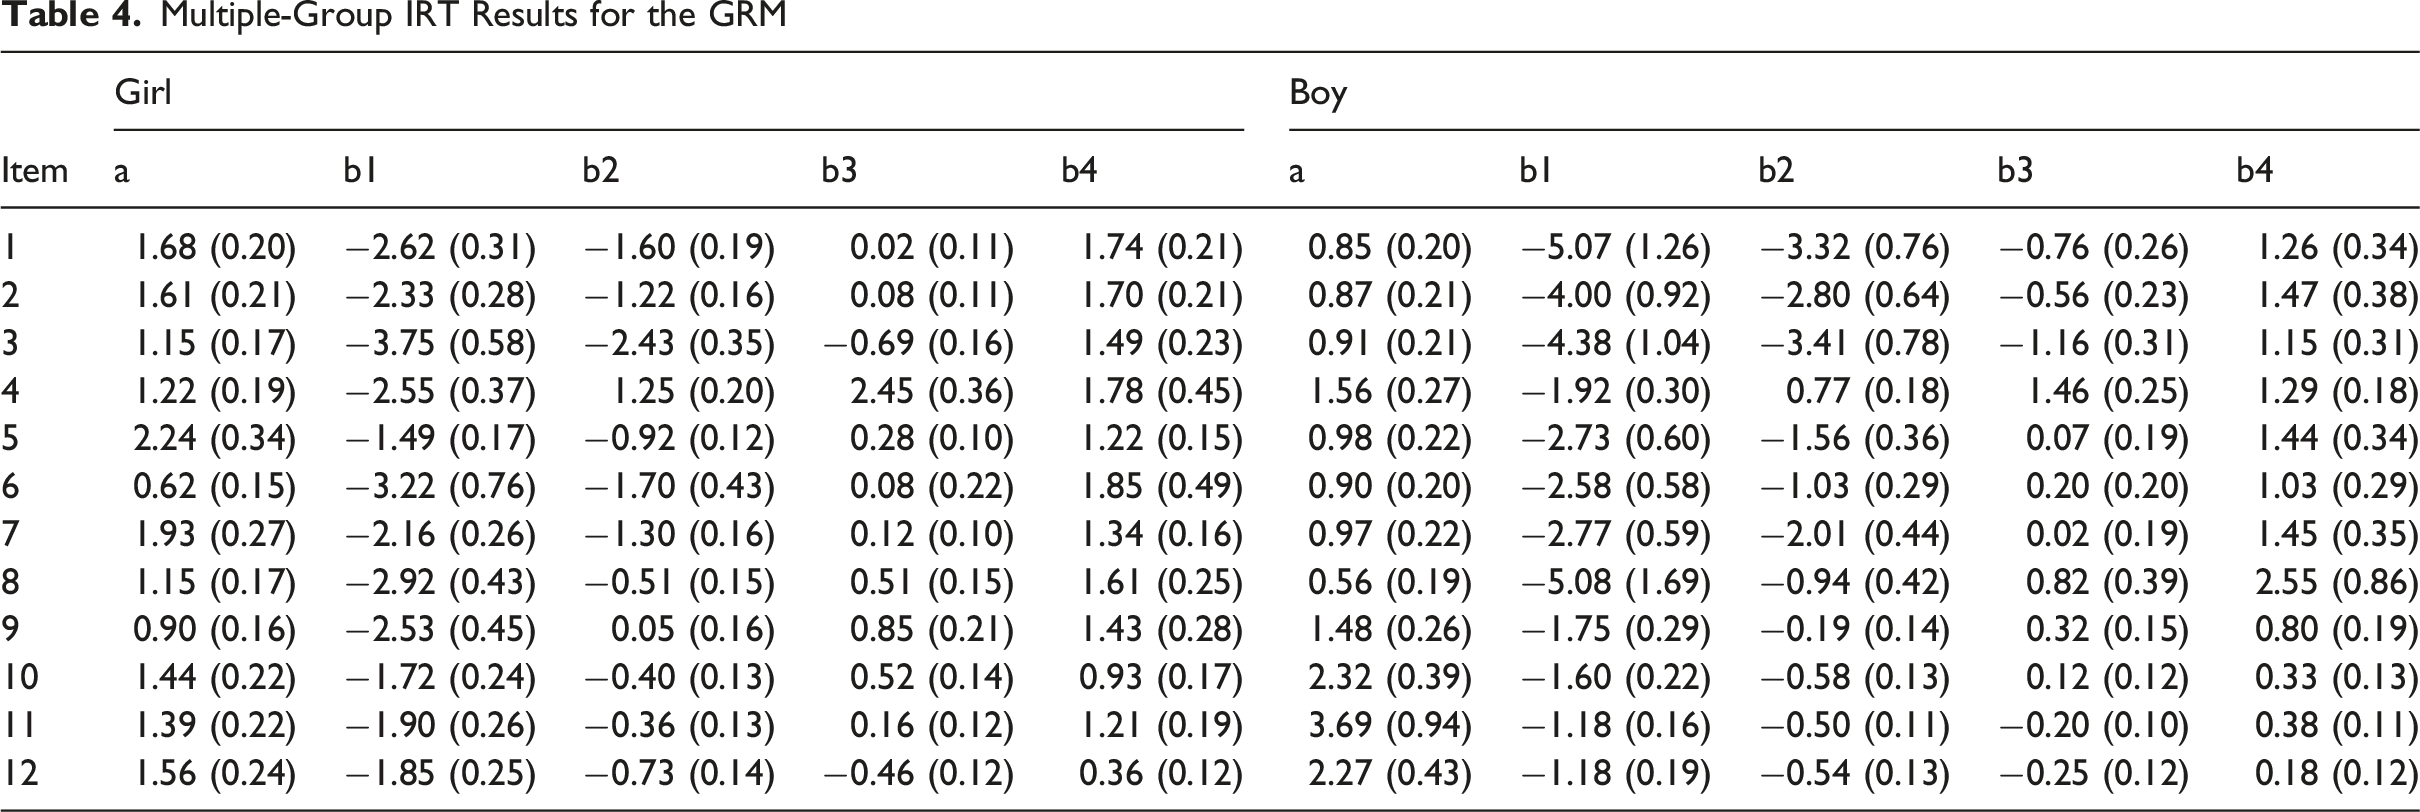
Multiple-Group IRT Results for the GRM
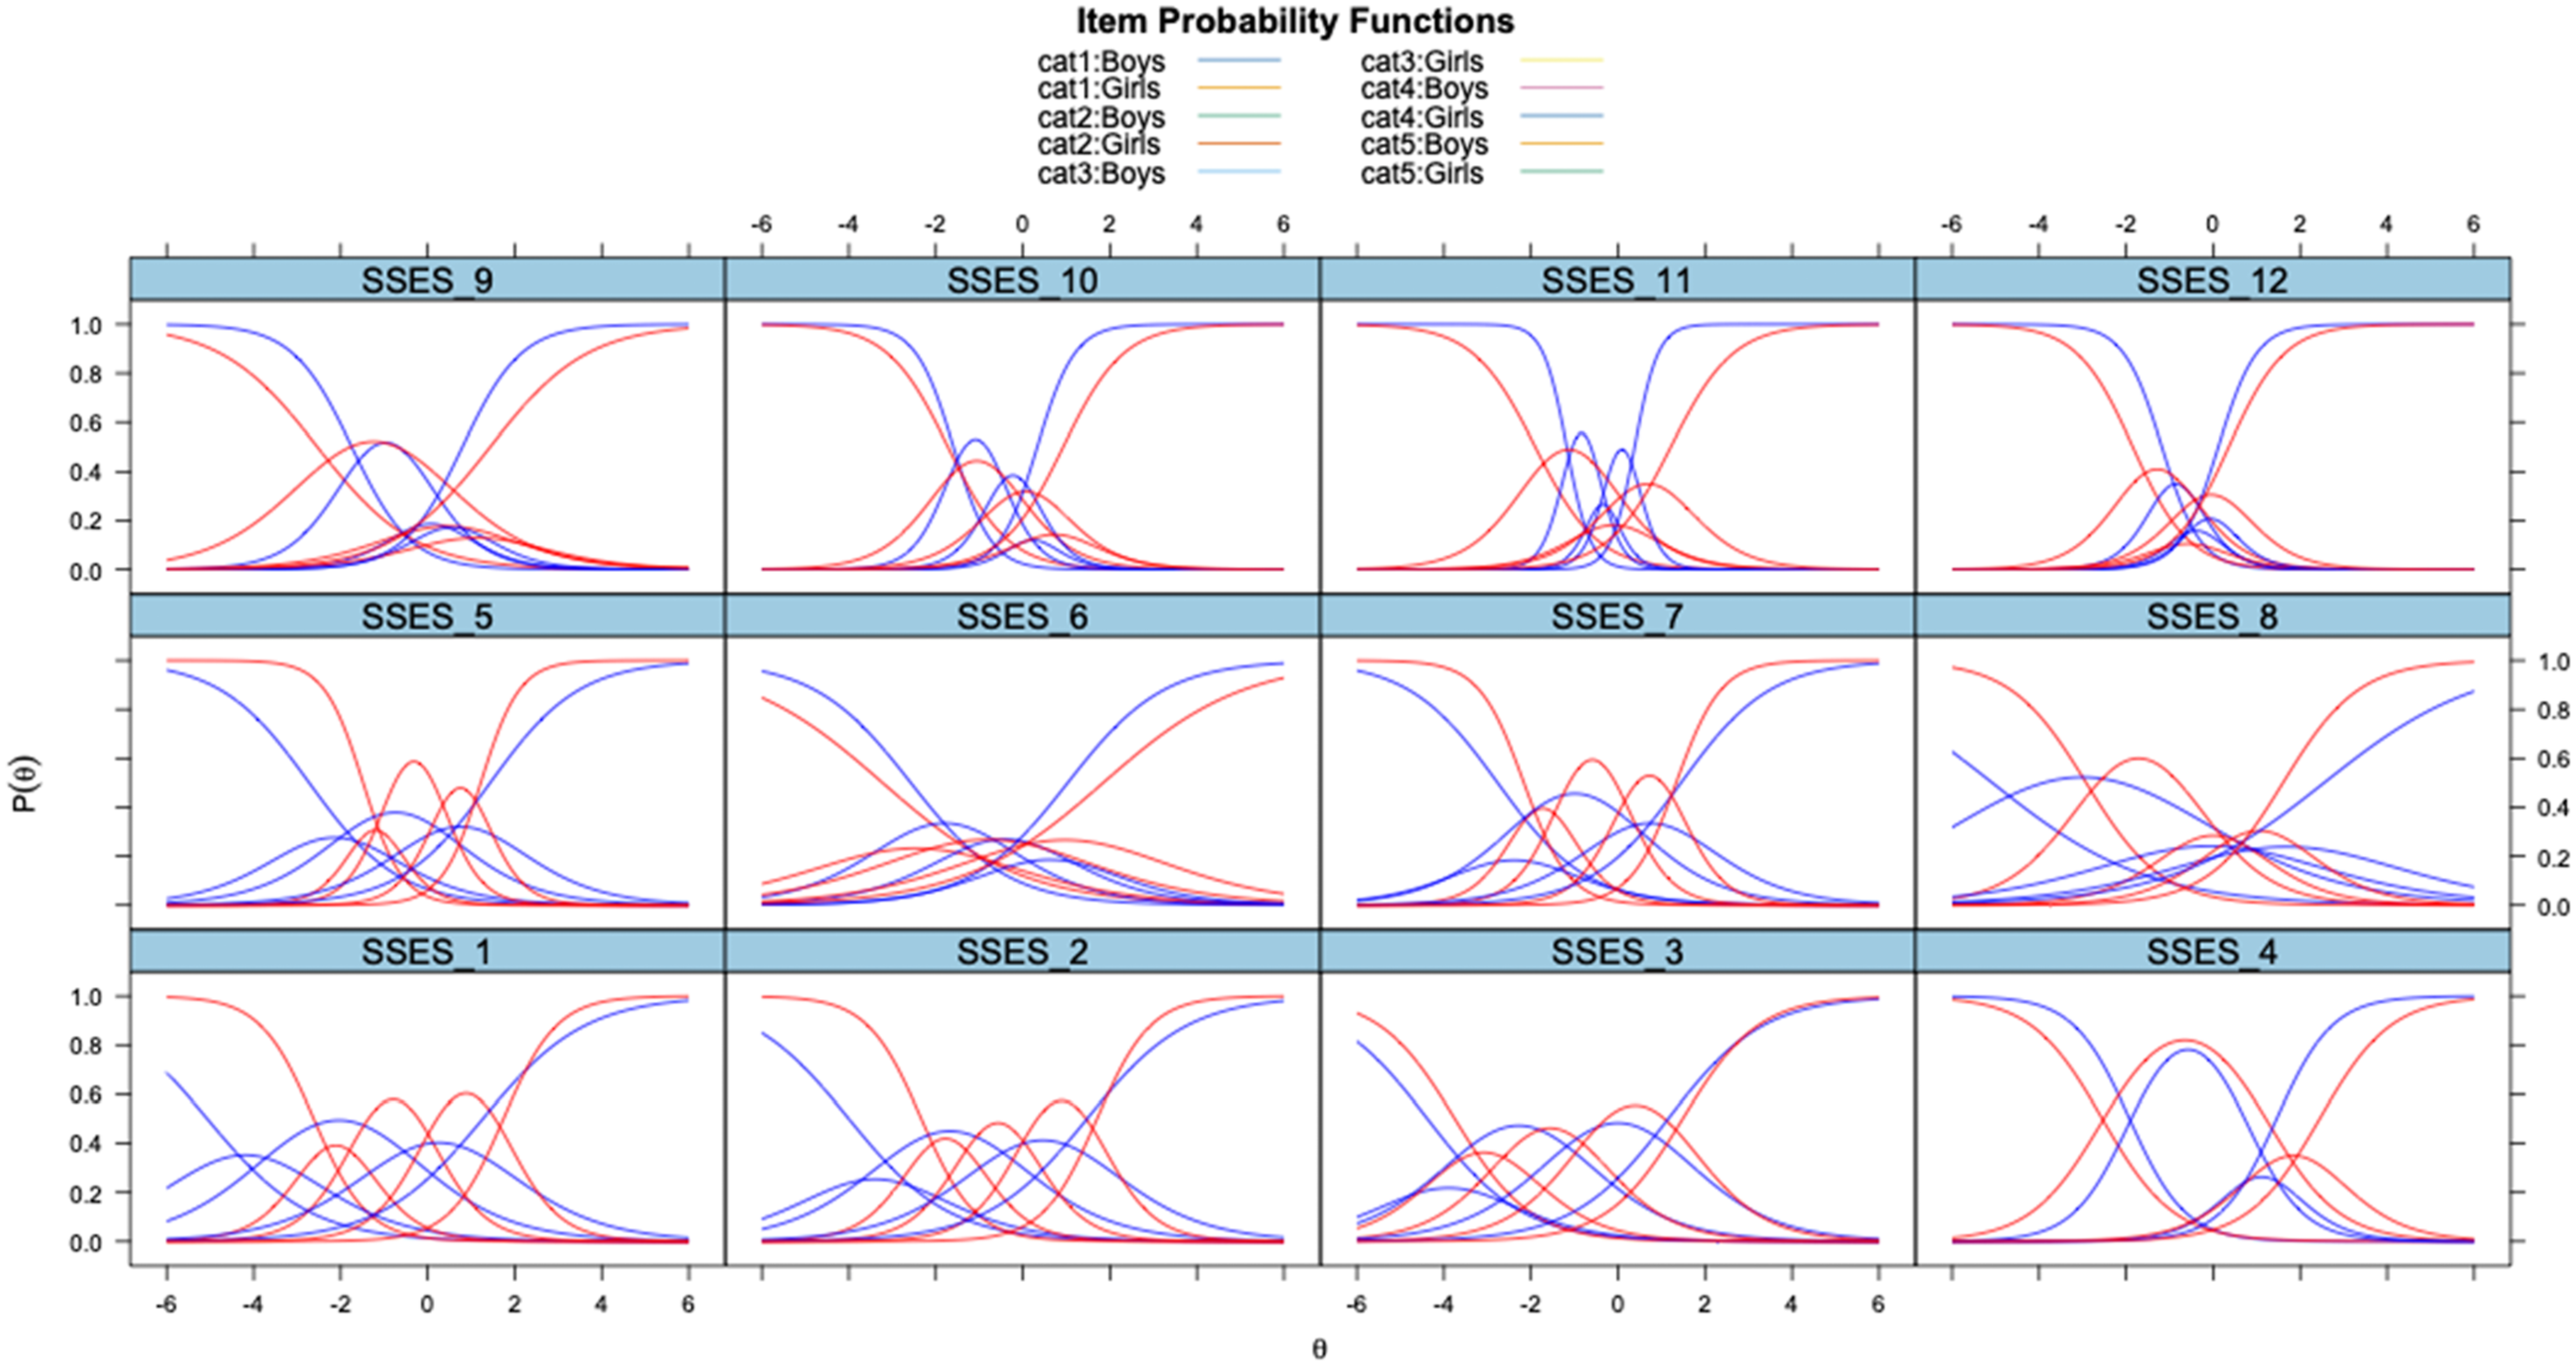
Gender-Based Item Probability Functions. Note. The Red Curves Represent the boys’ Group, while the blue Curves Correspond to the Girls’ Group
The difficulty parameters (b1–b4) of the SSES-S items were also examined. These parameters represent the level of self-esteem required to have a 50% probability of selecting a higher response category. They reflect the relative difficulty of endorsing each successive category and are essential for understanding item functioning in polytomous IRT models (Embretson & Reise, 2013; Samejima, 1969). The results indicated sex differences in item difficulty. For example, items related to academic performance (Items 1, 2, and 3) had lower difficulty parameters for boys, suggesting that boys required a lower level of self-esteem in this domain to endorse higher response categories than girls. In contrast, items related to social success and physical appearance (Items 4, 10, and 11) had lower b1 values among girls compared to boys, whereas items related to physical dissatisfaction (Items 6 and 12) had lower b4 values among boys. These findings indicate that the perception of self-esteem domains varies between sex, potentially influencing the way adolescents respond to self-esteem items.
Differential Item Functioning (DIF)
IRT DIF Probability of Mantel-Haenszel (MH) and Logistic Regression
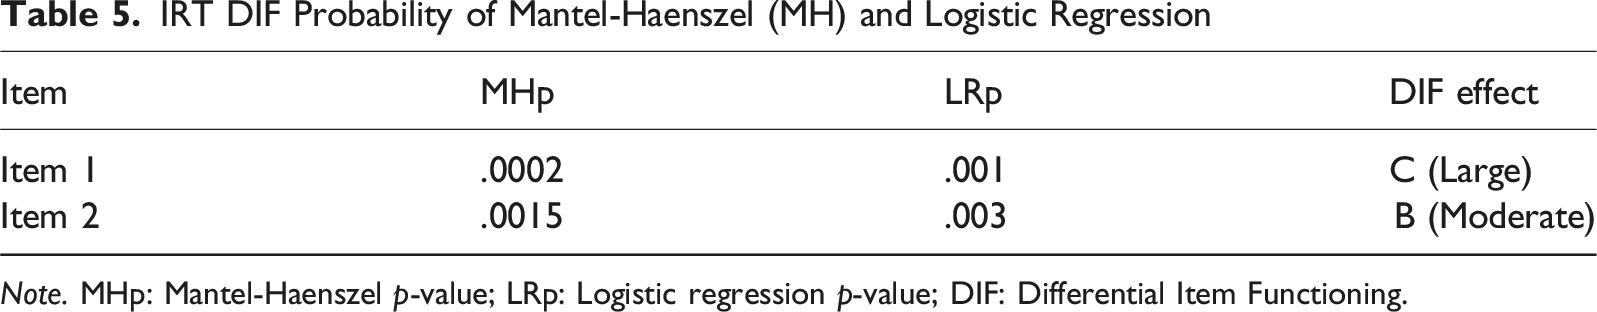
Note. MHp: Mantel-Haenszel p-value; LRp: Logistic regression p-value; DIF: Differential Item Functioning.
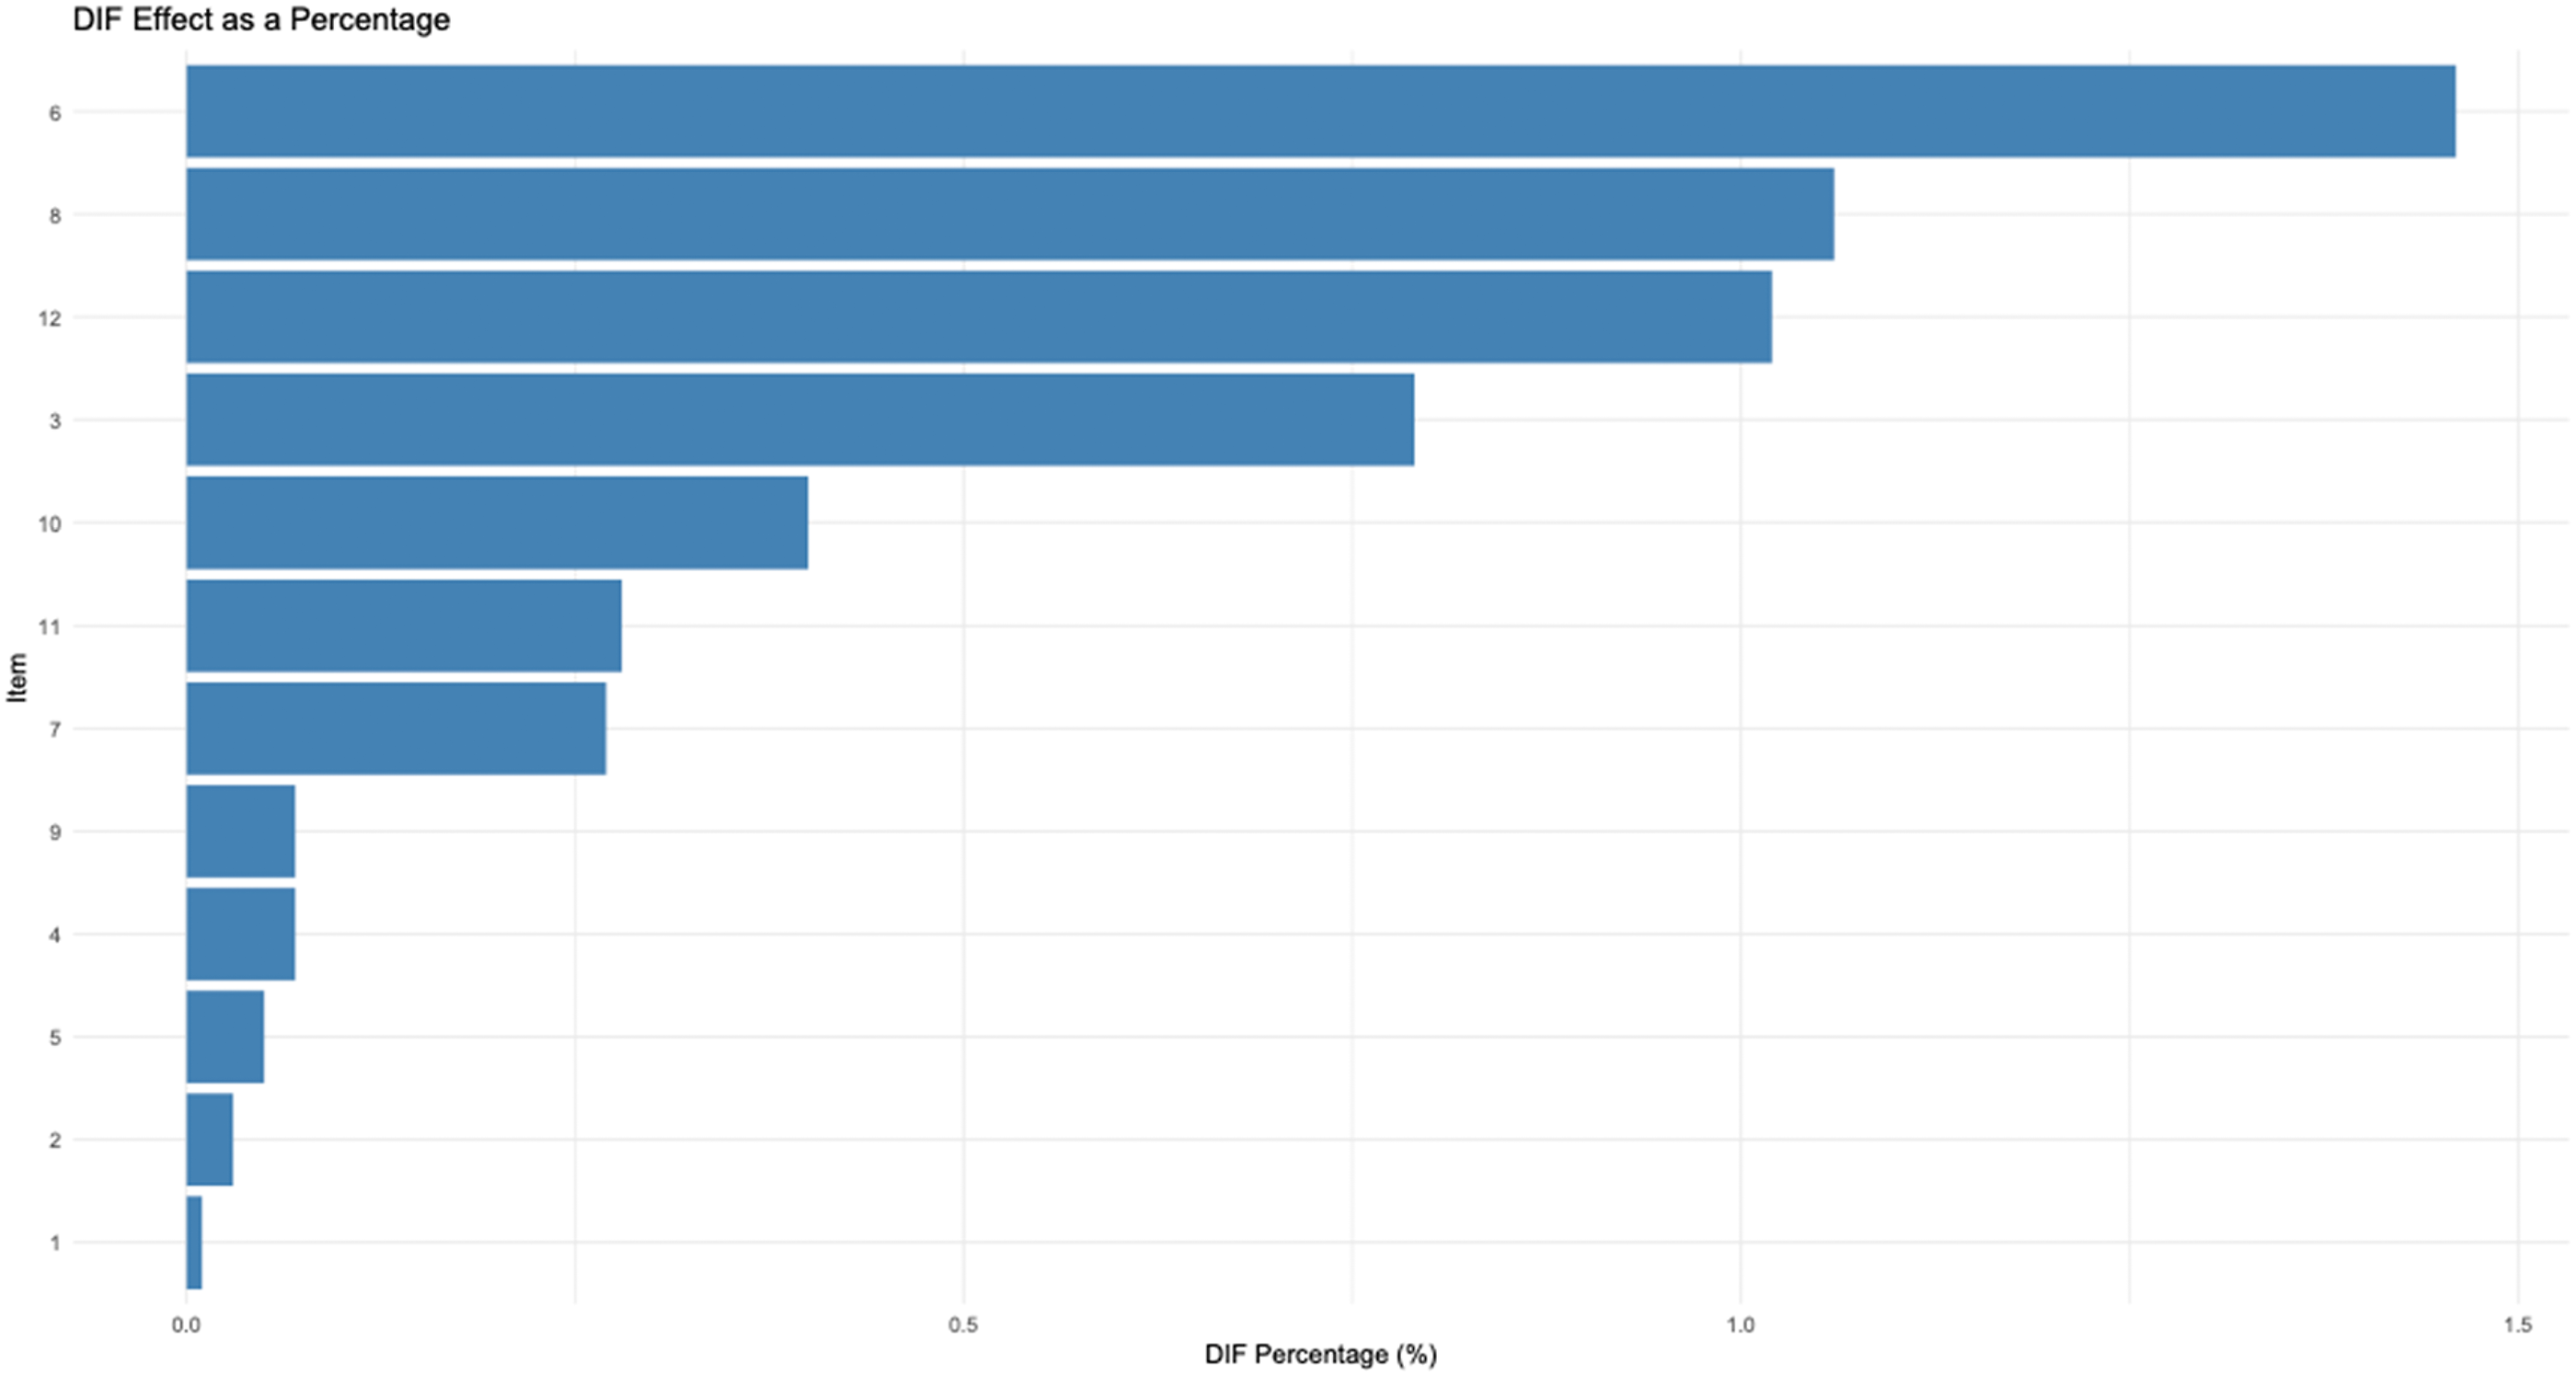
DIF Effect as a Percentage
Discussion
This study examined the psychometric properties of the SSES-S among Turkish adolescents. The three-factor structure—academic performance, physical appearance, and social success—identified through EFA was validated by CFA, replicating the structure reported by Brito et al. (2023) in their original validation of the SSES-S. This structural consistency supports the cross-cultural robustness of the scale. All three scales showed acceptable internal consistency, and multi-group CFA indicated configural, metric, scalar, and strict invariance across sex, suggesting that boys and girls interpret the scale similarly at the latent construct level.
However, item-level analyses provided important qualifications to these findings. MGIRT results indicated variability in item discrimination and difficulty parameters across sex, and DIF was identified in two items (Items 1 and 2). Although the overall model supported measurement invariance, the presence of nonuniform DIF suggests that certain items may be interpreted differently by boys and girls, potentially compromising the fairness of cross-group comparisons. It is possible for a measure to show structural invariance while still containing items that function unequally across groups—particularly when DIF-affected items contribute meaningfully to scale scores. As such, while the SSES-S shows generally acceptable psychometric properties at the scale level, researchers should interpret sex-based comparisons with caution and consider item-level functioning in future applications and revisions.
One particularly notable case was Item 6 (“I am dissatisfied with my weight”), which loaded adequately on the physical appearance factor in CFA but exhibited lower discrimination among girls in the MGIRT analysis. This suggests that body dissatisfaction, especially related to weight, may not be uniformly experienced or interpreted across sex. While Turkish girls typically show heightened sensitivity to physical appearance—likely due to sociocultural beauty standards (Avci & Keven Akliman, 2018)—their responses to weight dissatisfaction may be influenced by more complex psychosocial processes. Self-objectification theory (Fredrickson & Roberts, 1997) posits that girls internalize appearance-based expectations, but in the Turkish context, these pressures may manifest in culturally specific ways, such as balancing Western thinness ideals with local norms that value curvier figures. For boys, weight dissatisfaction may reflect concerns with muscularity or physical strength (Grogan, 2017), thus altering the meaning of the item. These results suggest that Item 6 may benefit from sex-sensitive rewording—for example, distinguishing between dissatisfaction related to thinness versus muscularity—or from being split into multiple items to better capture these divergent meanings. However, we acknowledge that item splitting alone may not fully eliminate DIF if underlying interpretations remain group-specific. Therefore, any revised or newly developed items should undergo follow-up validation, including cognitive interviewing and reanalysis of DIF, to assess whether measurement equivalence is improved.
Similarly, the social success factor exhibited greater item discrimination among boys than girls, suggesting that boys may experience or evaluate their social success in more differentiated ways. This aligns with sex role socialization in Turkish society, where boys are encouraged to value independence, assertiveness, and individual accomplishments (Tekke et al., 2020). For girls, social success may be more relational and context-specific, shaped by harmony and peer approval rather than status. These divergent social expectations likely influence how boys and girls interpret the same items. Though the overall factor structure held across sex, these within-factor differences in item functioning underscore the need for culturally and sex-sensitive refinement of the scale.
Beyond individual item interpretation, the presence of DIF in Items 1 and 2—related to academic performance—raises critical concerns for cross-sex comparability. Item 1 showed a large DIF effect (C-level) and Item 2 demonstrated moderate DIF (B-level). Given that these items make up one-sixth of the 12-item scale, this is a nontrivial concern. Although DIF does not necessarily imply item bias (Zumbo, 1999), and further procedures (e.g., expert review, cognitive interviews) are needed to establish bias, the observed nonuniform DIF may challenge the comparability of scale scores across sex. To address these concerns, future versions of the SSES-S might revise or replace these items using sex-neutral language or include parallel items tailored to both boys’ and girls’ academic self-concepts. Pilot testing these modifications through cognitive interviews could help ensure equivalent interpretation across groups.
While state self-esteem is inherently more variable than trait self-esteem, it also offers a window into how adolescents respond to immediate social and environmental contexts. The Turkish context adds important layers to this construct. In a society where academic performance is highly emphasized, sex roles remain influential, and social comparison is prevalent—particularly through digital media—state self-esteem may fluctuate in patterned ways. Over time, repeated experiences of success, failure, or social reinforcement in these culturally salient domains may contribute to the development of more stable trait-level self-esteem. Thus, longitudinal research is warranted to examine how state self-esteem fluctuations in Turkish adolescents may solidify into enduring self-views across development.
Limitations and Future Directions
While this study provides valuable insights into the psychometric properties of the SSES-S, several limitations should be noted. First, although the paper-and-pencil data collection method allowed for greater ecological validity compared to online surveys, it limited the diversity of the sample, particularly in terms of socioeconomic representation. Future research should examine the measurement invariance of the SSES-S across different socioeconomic groups, ensuring that the scale remains applicable to adolescents from various backgrounds. Second, two of the 12 items (16.66%) displayed nonuniform DIF across sex. While DIF alone does not confirm bias, the presence of nonuniform DIF—especially in a brief measure—may compromise the fairness and comparability of scores across sex. This limitation warrants further investigation through mixed-methods approaches to better understand group-specific interpretations of items. Third, the SSES-S does not establish a critical threshold for classifying different levels of self-esteem. Future studies could employ Rasch modeling or latent class analysis to establish empirically derived cut-off scores that would allow for more precise interpretations of state self-esteem levels. Additionally, since state self-esteem is inherently dynamic, longitudinal research should investigate how self-esteem fluctuates over time in response to academic, social, and cultural experiences. Lastly, measurement invariance across developmental stages should be tested to determine whether the SSES-S remains valid across early adolescence, late adolescence, and young adulthood.
Conclusions
The findings of this study provide preliminary but encouraging evidence for the validity and reliability of the SSES-S scores among Turkish adolescents. The scale’s three-factor structure (academic performance, physical appearance, and social success) was supported, and its scores demonstrated adequate internal consistency and measurement invariance across sex. However, the presence of nonuniform DIF in two items–constituting one-sixth of the scale–raises important concerns about cross-sex comparability. These findings suggest that some items may not function equivalently for boys and girls and warrant refinement in future versions.
From a practical standpoint, the SSES-S shows promise as a brief and flexible tool for capturing momentary fluctuations in adolescents’ self-esteem in educational, psychological, and clinical contexts. Its state-based design allows researchers and practitioners to assess self-esteem in real time, making it potentially useful for monitoring emotional well-being, identifying students in need of support, and evaluating intervention outcomes. Moreover, the observed sex-related differences, particularly in the physical appearance and social success domains, may inform the development of sex-sensitive practices in school-based mental health programs. Continued research is needed to further enhance the cultural and psychometric robustness of the instrument.
Footnotes
Ethical Consideration
We obtained ethical approval from the Necmettin Erbakan University Social and Humanities Scientific Research Ethics Committee (Report Number: [23066/33]).
CRediT Author Contributions
Funding
The author(s) received no financial support for the research, authorship, and/or publication of this article.
Declaration of Conflicting Interests
The author(s) declared no potential conflicts of interest with respect to the research, authorship, and/or publication of this article.
Data Availability Statement
Data will be made available on request.