
Abstract
A short form of the 60-item computer-based orthographic processing assessment (long-form COPA or COPA-LF) was developed. The COPA-LF consists of five skills, including rapid perception, access, differentiation, correction, and arrangement. Thirty items from the COPA-LF were selected for the short-form COPA (COPA-SF) based on cognitive diagnostic modeling (CDM) analyses. Both parametric and nonparametric CDM and correlational analyses were conducted with the responses of 74 U.S. second-grade students on the COPA-SF. Results supported five skills of orthographic processing represented on the COPA-SF. Concurrent and convergent validity evidence was found for the COPA-SF. Overall, the findings suggest that the COPA-SF is a time-efficient, reliable, multidimensional measure of orthographic processing.
Keywords
Introduction
Orthographic processing, “the ability to form, store, and access orthographic representations” (Stanovich & West, 1989, p. 404), is a foundational skill for later word reading and spelling acquisition (Ehri, 2014; Seidenberg & McClelland, 1989; Share, 1995; Stanovich & West, 1989). A series of studies have consistently demonstrated that orthographic processing skills account for the variance of word reading and spelling in monolingual (Chen et al., 2021; Conrad & Deacon, 2016; Cunningham, 2006; Zarić et al., 2021) and bilingual school-age children (Chung et al., 2018; Deacon et al., 2013; Sun-Alperin & Wang, 2011), even after controlling phonological, general verbal and nonverbal abilities. Orthographic processing is critical for word reading and spelling, not only because it accounts for the additional variance in word reading and spelling but also because it affects how learners process word information while learning to read and spell (Chen et al., 2021).
While orthographic processing is an independent and necessary component of word reading and spelling (Apel et al., 2011; Berninger et al., 1991), students’ orthographic processing ability is not often considered by teachers when facilitating students’ word learning. This may be because of the lack of assessments of this skill and because teachers may have limited knowledge about the concept of orthographic processing and how it links to learning to read, since it has been less studied than other areas of reading. Another reason may be due to the time constraints of the school day, limiting teachers’ ability to administer an individualized assessment of orthographic processing. Thus, it is a necessary to develop a short form of an orthographic processing assessment that can be group administered and provides teachers with a quick yet comprehensive measure of students’ orthographic processing. Moreover, an orthographic processing assessment could benefit psychologists by helping them to efficiently obtain rich and timely diagnostic information about a student’s development. Thus, this study aims to create a short-form version of a computer-based orthographic processing assessment (COPA; Chen et al., 2020) and evaluate the psychometric properties of the short form of COPA (COPA-SF) to determine if it demonstrates similar psychometric properties as the long-form COPA (COPA-LF) by using cognitive diagnostic modeling (CDM).
An Overview COPA: Design, Items, and Psychometric Properties
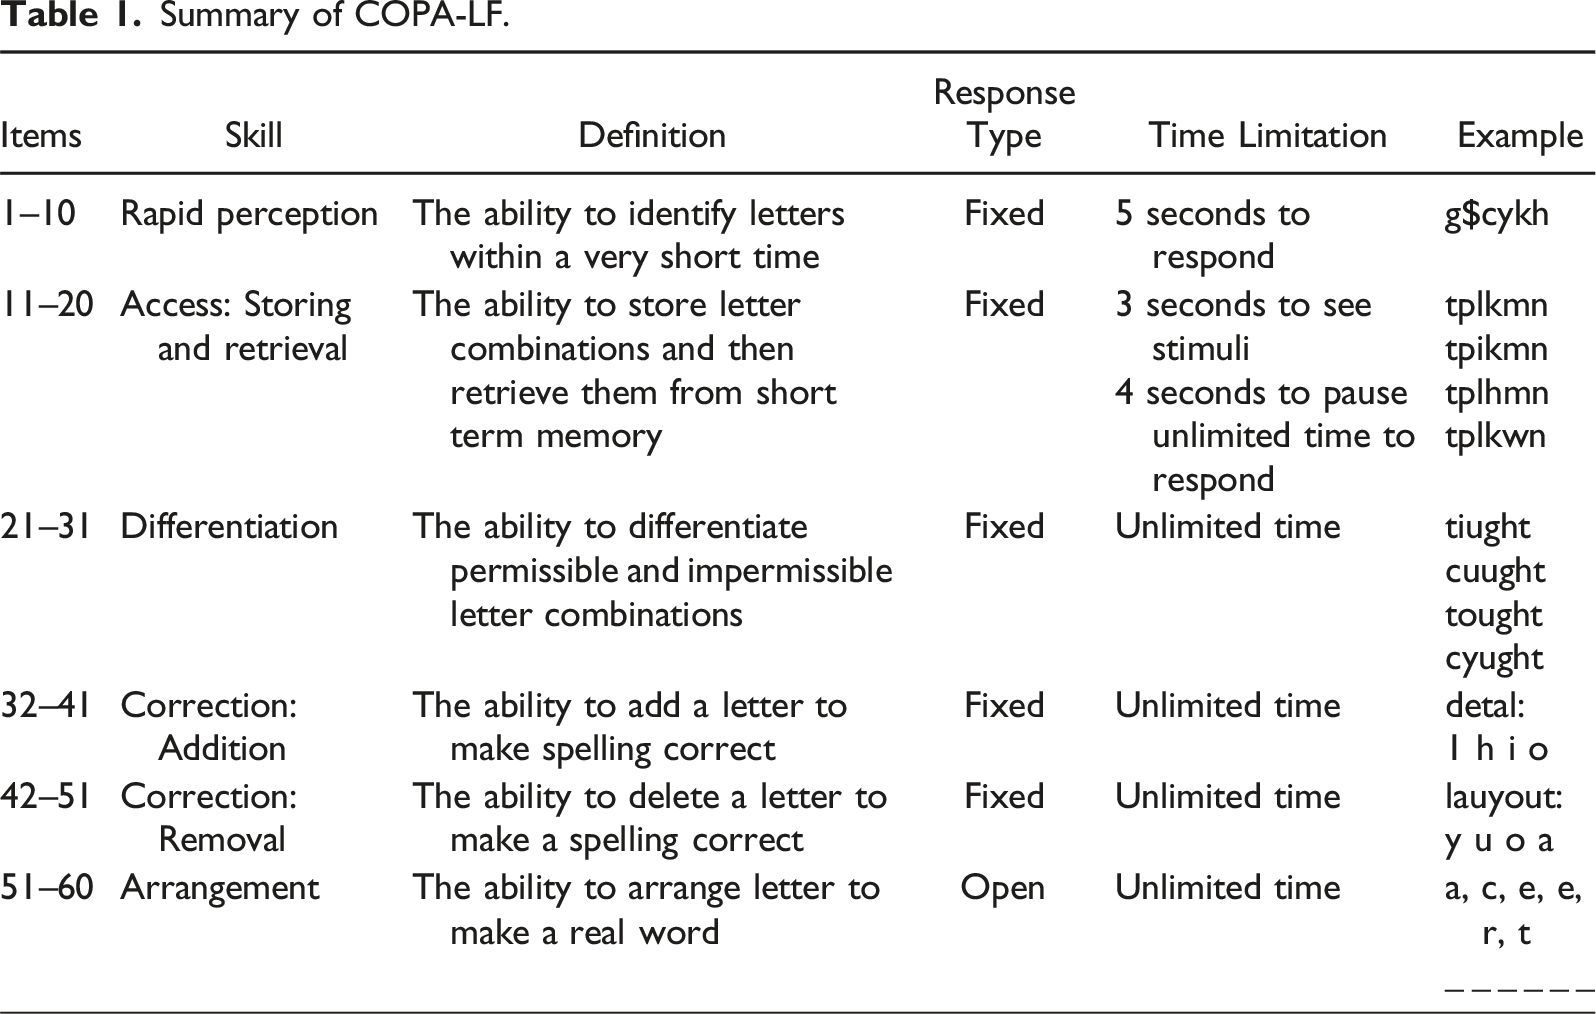
The COPA-SF was built from the COPA-LF, so we will first review how the COPA-LF was developed and validated. The COPA-LF was designed to measure students’ ability to perceive, access, differentiate, correct, and arrange English letters and spelling patterns (Chen et al., 2020, 2021). The framework of the COPA-LF was based on Stanovich and West’s (1989) conceptualization of orthographic processing and Cassar and Treiman’s (1997) word list. Cummings’s (1988) American English spelling system was used for item design principles. Previous assessments of orthographic knowledge processing have been confounded by word recognition and/or spelling ability (Apel, 2011; Burt, 2006; Castles & Nation, 2006, for review; Chen et al., 2020). In an effort to address this and assess pure orthographic processing, the COPA-LF was developed based on three principles: (a) measure the ability to process single letters, letter combinations, and spelling patterns, (b) include multiple processing skills, and (c) segregate orthographic processing from word recognition or spelling ability (Chen et al., 2020).
The COPA-LF was designed with a simple structure: each of its 60 items was intended to measure only one skill. The psychometric properties of the COPA-LF were examined using a cognitive diagnostic modeling (CDM) approach (Chen et al., 2022). This analysis revealed several key findings. The COPA-LF reflected five dimensions: rapid perception, access, differentiation, correction, and removal. It demonstrated a linear learning sequence: access → differentiation → correction → arrangement. Notably, rapid perception was not included in this sequence based on the CDM analysis. The classification accuracy of learning profiles for both the whole group and individuals exceeded .91. The COPA-LF showed strong correlations with assessments of word recognition, pseudoword reading, and spelling. However, each dimension of the COPA-LF had relatively lower correlations with sound blending and oral language tasks. The analysis also identified eleven out of 60 items with low item quality, suggesting areas for potential refinement.
A Review of Short-form Development and Validation
From a practical perspective, a long-form assessment can be a challenge to administer in classroom settings and clinical practices. Thus, it is helpful, when possible, to develop a short form measure to reduce response burden and increase a response rate for both academic and research settings (Austin et al., 2018; Lowe, 2021). Common psychometric theories to develop a short-form measure often use confirmatory factor analysis (CFA) and item-response theory (IRT). CFA is typically used to validate a hypothesized factor structure of a short-form measure while IRT is used to validate a factor structure and assess the quality of items (Allen et al., 2015; Sturm et al., 2017). Both CFA and IRT provide continuous scores of a latent ability for individuals. To assess convergent and discriminant validity of a short-form measure, researchers generally examine correlations between latent scores in a short-form measure and relevant external measures.
Like CFA and IRT, CDM can be applied to develop a short-form measure by assessing a factor structure and the quality of items. Furthermore, CDM provides two distinct advantages that do not exist in CFA and IRT: (1) CDM can provide a set of fine-grained discrete skills to describe students’ abilities, and (2) CDM can offer detailed information on hierarchical learning sequences (Hsu et al., 2023; Leighton et al., 2004). These two distinct features of CDM offer important information to practitioners because detailed diagnostic information can help them tailor reading instruction and intervention. Surprisingly, despite the distinct advantages that it provides, few studies have used CDM to develop a short-form assessment. However, this approach was best suited for our goal of developing both a short form of the COPA and providing teachers with meaningful, actionable results from that measure.
Cognitive Diagnostic Modeling: the Deterministic Inputs, Noisy “and” Gate (DINA) Model
There are several models that can be used with CDM (Rupp et al., 2010). The COPA-LF was previously validated using the deterministic inputs, noisy and gate (DINA) model (Chen et al., 2022). The COPA-LF comprises items that theoretically measure a single attribute, which is the “simple structure” of the Q-matrix in the CDM framework. The simple structure indicates that when individuals master one attribute of an item, they can answer an item successfully, which is appropriate for the DINA model. Because the COPA-SF has the same structure, we decided to use the DINA model again and to allow for a parallel comparison between both forms. Additionally, it can provide better classification rates, especially when the sample size is small —a common condition in a school context (de la Torre et al., 2015).
In the DINA model, latent response (η
ij
) to item j for student i is a binary indicator where 1 represents mastery and zero non-mastery and is defined deterministically by
In addition to these two item parameters in the DINA model, de la Torre (2009) suggests an item discrimination index (IDI; δ j ) that considers both the slipping and guessing parameters, which is δ j = 1 – s j – g j . The discrimination index is maximized as the slipping and guessing parameters approach zero and can be used as an index of item quality. The higher IDI value the item has, the better quality that item possesses.
Nonparametric Cognitive Diagnostic Modeling
To deal with a small sample size under the CDM framework, a nonparametric classification approach is a promising solution because it demonstrates a highly accurate classification rate in a small sample size (Chiu & Douglas, 2013; Chiu et al., 2018). A nonparametric classification approach does not require any assumption of a model, and it does not have a procedure to estimate item parameters of any CDM models to classify individuals. Instead, it classifies individuals directly by minimizing the distance between observed item-response vectors and the ideal item-response vectors derived from each possible proficiency profile. For example, suppose there are three skills of orthographic processing that yield eight possible proficiency profiles (23). In a nonparametric approach, the distance between an individual item-response vector and each of the ideal item-response vector from the eight possible proficiency profiles will be calculated. When the smallest distance for a proficiency profile is determined, an individual will be assigned to this proficiency profile.
To calculate the distance between an individual item-response vector and an ideal item-response vector, a Hamming distance method was utilized in this study (Chiu & Douglas, 2013). For example, if an individual item-response vector for three items is (0,1,1) and an ideal item-response vector is (0,0,1), then the distance is |0–0|+|1–0|+|1–1| = 1. The value of 1, therefore, represents the distance between an individual item-response vector and an ideal item-response vector for a proficiency profile. If an individual has more than one proficiency profile with the same smallest distance, one of the proficiency profiles will be randomly assigned to an individual (Zheng & Chiu, 2019). More details about the distance calculation can be found in the Analysis section of this paper.
The Present Study
In the current study, we created and provided initial evidence of validity of a short form, 30-item COPA (COPA-SF) that can be quickly administered by teachers and psychologists in less than 10 minutes. Our research questions were: 1. What is the dimensionality of the COPA-SF and does it represent the same five skills as the COPA-LF? 2. What are the learning sequence and mastery probabilities of the COPA-SF and are they similar to the COPA-LF? 3. What are the correlations between mastery probabilities of skills (i.e., rapid perception, access, differentiation, correction, and arrangement) and external measures of word recognition, pseudoword reading, phonological processing, spelling ability, orthographic knowledge, and oral language? 4. Does the COPA-SF maintain the high classification accuracy and consistency of the COPA-LF?
Method
Participants
Participants were 74 second-grade students (51% boys) from two schools in one suburban city and one urban city located in northern California. The mean age in years at the time of data collection was 8.03 years (SD = .33), and the majority of the students were White, non-Hispanic (68%). The remaining participants were Asian (15%), African American (6%), Hispanic/Latino (4%), or multiracial (3%), with 4% unreported. All participants completed the COPA-LF, and all but three participants completed the assessments for orthographic knowledge, oral vocabulary, word recognition, pseudoword reading, spelling, and phonological awareness. The participants’ performances on these assessments are summarized in Table S1 (see Supplemental Materials). The study was approved by the IRB at the first authors’ affiliation. Three weeks before data collection, parent consent was obtained and a child participant’s verbal consent was obtained prior to testing.
Measures
Orthographic Processing
The COPA-LF (Chen et al., 2020) was used to assess students’ orthographic processing ability. The computer-based assessment includes 60 test items and 10 practice items. The first 51 items require a fixed response, while the last nine items are open-ended.
Summary of COPA-LF.
Orthographic Knowledge
To measure students’ orthographic knowledge, the non-normed Orthographic Choice Task (Olson et al., 1985) was used. This task included 23 items and was designed to assess children’s ability to pick the correct spelling between two homophones (e.g., rain vs. rane) in English. Students were asked to circle the correct spelling on paper. Responses were scored as either correct or incorrect. The Cronbach’s alpha is .83. However, it should be noted that orthographic knowledge is different but related to orthographic processing. Orthographic processing represents procedural operations, whereas orthographic knowledge is declarative knowledge processing (Burt, 2006; Castles & Nation, 2006; Chen et al., 2020).
Oral Receptive Vocabulary
The Peabody Picture Vocabulary Test-Fourth Edition (PPVT; Dunn & Dunn, 2012) was used to assess students’ receptive oral vocabulary. Students were asked to point to the picture that best described an orally provided vocabulary word. The test developers report test–retest reliabilities ranged from .92 to .96, and the split-half reliability ranged from .89 to .97.
Word Recognition
The Letter and Word Identification subtest of the Woodcock-Johnson III (WJ-III; Woodcock et al., 2007) was used to measure students’ word recognition ability. The median reliability of this test is .94 (McGrew et al., 2007).
Pseudoword Reading
This was assessed with the Word Attack subset of the WJ-III Test of Achievement. This subtest assesses children’s ability to read aloud pseudowords, such as gusy or sluke. The median reliability of the test is .87 (McGrew et al., 2007).
Spelling
The spelling subtest of the WJ-III was used to measure students’ spelling ability. This paper-and-pencil subtest was designed to assess children’s ability to spell orally presented words used in a sentence. The median reliability of the test is .90 (McGrew et al., 2007).
Phonological Awareness
The Elision and Blending subtests of the Comprehensive Test of Phonological Processing (CTOPP; Wagner et al., 1999) were used to assess participants’ phonological awareness. The Elision reliability ranged from .89 to .91. The Blending reliability ranged from .79 to .87 (Wagner et al., 1999).
Statistical Analyses
Test Development
To select items for the short-form COPA (COPA-SF), the DINA model and the simple six-skill Q-matrix (i.e., an item requires only one skill) were used to obtain IDI values as an index of item quality. A six-skill Q-matrix was used because the original development of the 60-item COPA included six subtests, including rapid perception, access, differentiation, addition correction, removal correction, and arrangement subtests. Five items with the highest IDI values in each subtest were selected for the COPA-SF. The minimum IDI for item selection was .20 (Chen et al., 2019; Lee et al., 2012).
Dimensionality Models
After constructing the 30-item COPA-SF (i.e., 5 items for each of the 6 skills), three models were analyzed: one-skill, five-skill, and six-skill models. We choose these models because they were validated with the COPA-LF (Chen et al., 2022). A one-skill model assumes that only one general orthographic processing skill measures students’ performance across all test items. In the Q-matrix, the one-skill model assumes one skill is measured by all 30 test items. The five-skill model comprises five skills, including rapid perception (items 1–5), access (items 6–10), differentiation (items 11–15), correction (items 16–25), and arrangement (items 26–30). The six-skill model was constructed to test if the correction skill is best measured by two subcategories: addition and removal.
Linear Attribute Hierarchy Models
After confirming the best-fitting dimensionality model, four linear skill hierarchy models (H1-H4) were further explored and compared with the non-hierarchical model (H0). Hierarchical models were used to assume the various learning sequences of skills in this study. Hierarchical model 1 (H1) assumes the correction skill is a prerequisite of the arrangement skill (A4→A5). Hierarchical model 2 (H2) adds an assumption to H1, that is, differentiation is a prerequisite of correction (A3→A4→A5). Hierarchical model 3 (H3) adds one more assumption to H2, that is, access is a prerequisite of differentiation (A2→A3→A4→A5). Hierarchical model 4 (H4) adds one more assumption to H3, that is, rapid perception is a prerequisite of access (A1→A2→A3→A4→A5). These models were considered based on the information processing theory: more sophisticated skills (e.g., arrangement) must rely on mastery of the foundational skills (e.g., correction) (Chen et al., 2020). As a result, it was assumed these skills were developed based on a specific sequence: rapid perception, access, differentiation, correction, and arrangement.
CDM Analyses and Evaluation Criteria
In this study, the dimensionality of the COPA-SF was examined first, followed by linear attribute hierarchy model comparisons. After obtaining the best-fitting model of dimensionality along with a linear hierarchy model, the final CDM analysis was conducted for skill diagnostic information for individuals and the whole group. All CDM analyses were conducted using parametric DINA and nonparametric DINA models.
All parametric CDM analyses with the DINA model were implemented by the “CDM” R package (Robitzsch et al., 2020) using marginal maximum likelihood. To investigate model fit, Akaike’s information criterion (AIC; Akaike, 1987), Bayesian information criterion (BIC; Schwarz, 1978), MAX (χ2) (Robitzsch et al., 2020), and the root mean square error approximation (RMSEA) were used to choose the best-fitting model. Additionally, the likelihood ratio (LR) test was used for model comparison.
Lower values of AIC or BIC indicate a better model fit. MAX (χ2) is an absolute fit index that can be tested for statistical significance. A significant p-value indicates that the statistical independence of the item pair is violated, and thus the model does not fit the data well (Hu et al., 2016). RMSEA values below .05 indicate good fit, values below .10 indicate moderate fit, and values above .10 indicate poor fit (Kunina-Habenicht et al., 2009). The likelihood ratio (LR) test was used for model comparison. A significant p-value of the LR test favors a more complex model, whereas a non-significant p-value favors a simpler model, based on the parsimonious rule. For example, when comparing the non-hierarchical model (H0) and the hierarchical model 1 (H1: correction skill→arrangement), the non-hierarchical model is a more complex model because it has more estimated parameters compared to hierarchical model.
Due to the small sample size (N = 74) of this study, we applied a nonparametric cognitive diagnosis method to provide further evidence for choosing the best-fitting attribute hierarchical model by calculating the average loss function values, an approach that is not affected by small sample size. The nonparametric analyses were conducted using the “NPCD” R package (Zheng & Chiu, 2019) and Hamming distance estimation. The average value of a loss matrix across all individuals with the smallest loss function values from the NPCD package was computed for each attribute hierarchical model and compared to select the best-fitting model. The loss matrix provides the values of the distance between the observed and ideal item-response vectors using the Hamming distance estimation. In the loss matrix, rows represent candidate attribute profiles, and columns represent individuals (Zheng & Chiu, 2019). The values in a matrix represent the distances between the observed and ideal item-response vectors with a weight assigned to guessing and a weight for slipping. Using the Hamming distance estimation, weights for guessing and slipping parameters were 1s (Zheng & Chiu, 2019). To compute the average loss function value for each attribute hierarchical model, we followed these steps: (1) we calculated the distances between the observed and ideal item-response vectors for all candidate attribute profiles across all individuals, (2) for each individual, we assigned the candidate attribute profile with the smallest loss function value as their attribute profile (Zheng & Chiu, 2019), and (3) we then calculated the average of these smallest values across all individuals for each attribute hierarchy. The attribute hierarchical model with the smallest average loss value was considered the best-fitting model. This is because the smallest average loss value indicates the least prediction error between the observed data and the hypothesized model, suggesting a good fit between the data and the model.
For linear attribute hierarchy model comparisons, we revised the AlphaNP function in the NPCD package because the original function is not designed for the DINA model with a linear hierarchical structure. We modified it by revising the number of attribute profiles based on the feature of the hierarchal structure. The R code is available upon request.
For the final analysis with the best-fitting hierarchical model, a Bayesian maximum a posteriori estimation with the parametric DINA model was used to obtain all diagnostic information, including individuals’ skill patterns and profiles, skill mastery probabilities, and proportions of skill patterns. Classification accuracy and consistency based on estimators of Johnson and Sinharay (2018) and simulation-based estimation (Robitzsch et al., 2020) were computed. The best-fitting hierarchical model was also used to obtain the diagnostic information with nonparametric CDM approaches. The diagnostic information from parametric and nonparametric CDM models was compared by computing the profile agreement rate and the attribute agreement rate (Chiu & Douglas, 2013). The profile agreement rate represents the agreement of all skills as a whole, and the attribute agreement rate denotes the agreement of individual skills within a diagnostic profile. The high agreement rate indicates the valid diagnostic information from the parametric DINA model with a small sample.
Correlation Analyses
Pearson product-moment correlations were computed between each attribute mastery probability and each external measure (i.e., orthographic knowledge, oral receptive vocabulary, letter and word recognition, pseudoword reading, spelling, and phonological awareness) to examine criterion-related validity.
Results
The Dimensionality of the COPA-SF
Fit Statistics for One-Skill, Five-Skill, and Six-Skill Non-Hierarchical Models.
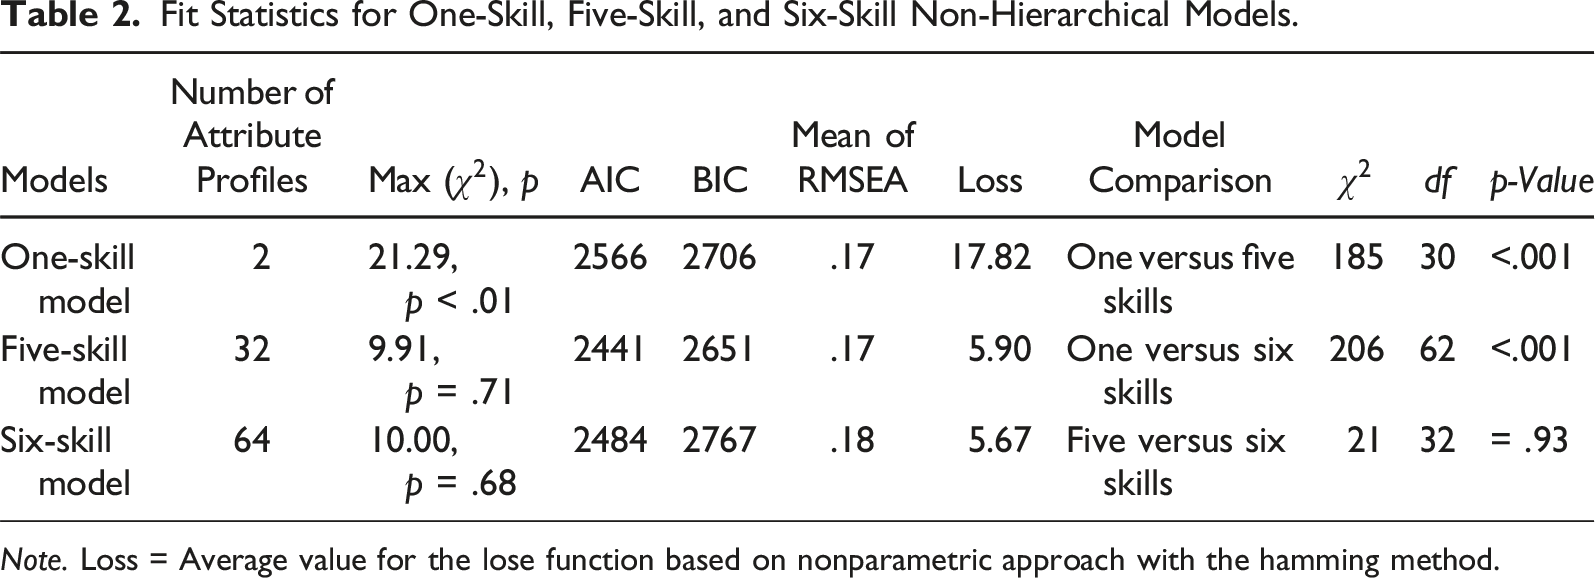
Note. Loss = Average value for the lose function based on nonparametric approach with the hamming method.
Comparing models, the LR test demonstrated that the five-skill and six-skill models fit significantly better than the one-skill model, χ2 (30) = 185, p < .001 and χ2 (62) = 206, p < .001, respectively. However, comparing the five-skill model and the six-skill model, the result was not statistically significant (χ2 (32) = 21.21, p = .93), suggesting the simpler model (i.e., the five-skill model) was the best-fitting model. Although the six-skill model showed the smallest average loss value (Loss = 5.67), the difference between the average loss values of the five-skill and six-skill models were very small. As most results of model fit favored the five-skill model, we decided the five-skill model as the final model to examine its hierarchical structure.
Hierarchical Models: Learning Sequences of Five Attributes
Fit Statistics for Five-Skill Non-Hierarchical and Five-Skill Hierarchical Models.
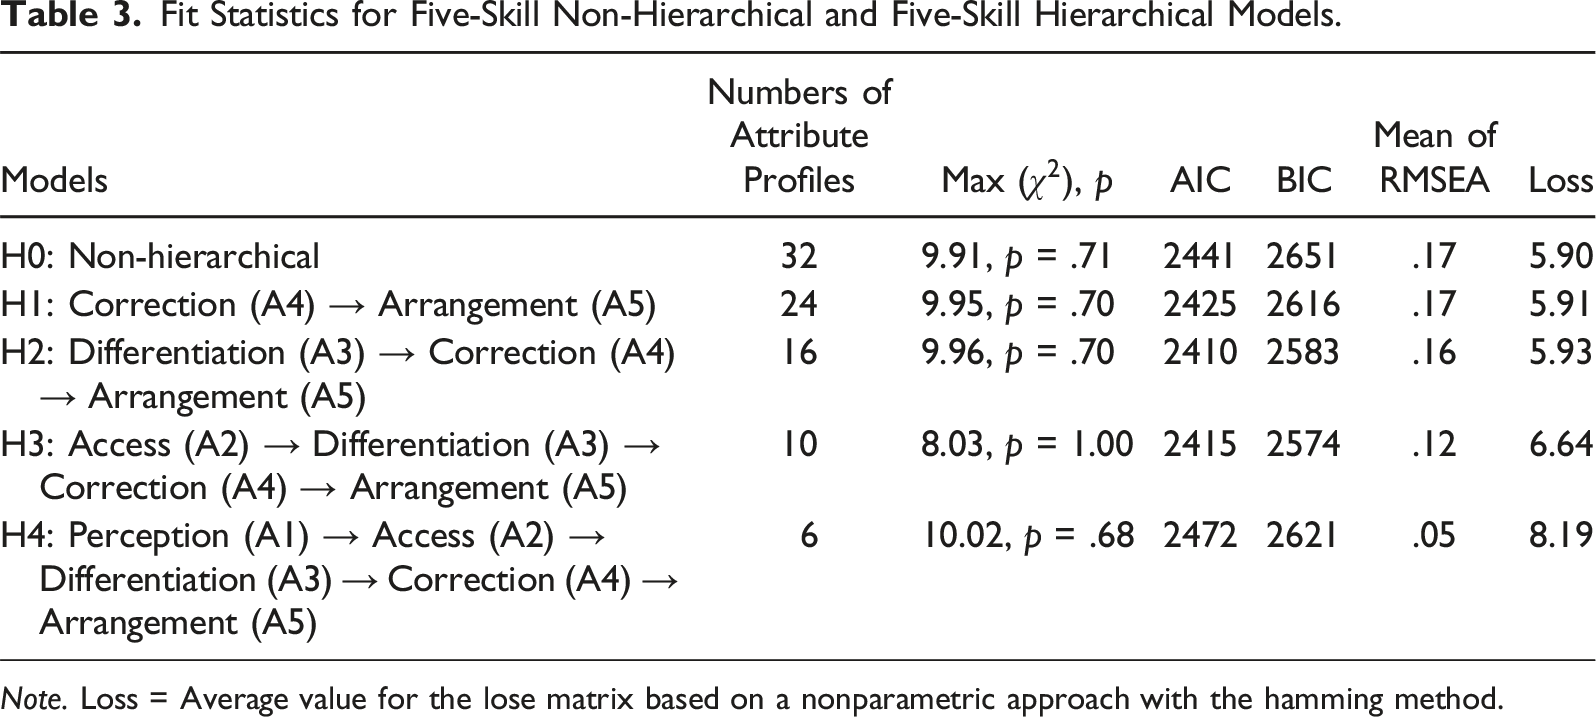
Note. Loss = Average value for the lose matrix based on a nonparametric approach with the hamming method.
Model Comparisons Among the Non-Hierarchical and Hierarchical Models.
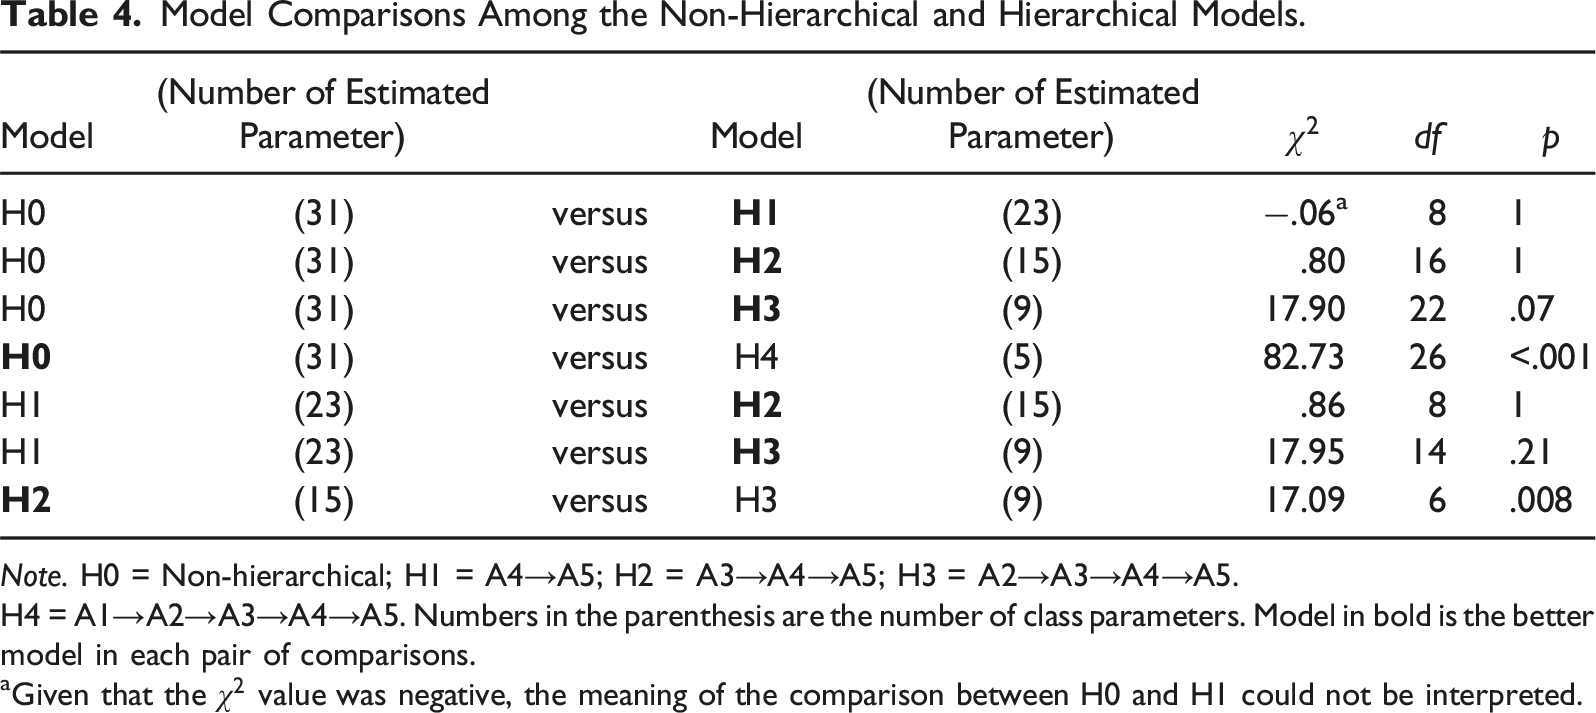
Note. H0 = Non-hierarchical; H1 = A4→A5; H2 = A3→A4→A5; H3 = A2→A3→A4→A5.
H4 = A1→A2→A3→A4→A5. Numbers in the parenthesis are the number of class parameters. Model in bold is the better model in each pair of comparisons.
aGiven that the
As the model comparison between H0 and H1 could not be interpreted, we further compared H2 and H3 with H1. The LR tests showed statistically non-significant results when comparing H1 and H2 and H1 and H3 models. This suggests that the H2 and H3 models fit the data better than H1. Lastly, we compared H2 and H3 models to decide on the final model. The results were statistically significant (χ2 (6) = 17.09, p < .05), suggesting the H2 model was better.
Because of inconsistent findings based on various fit indices and small difference between the average of the loss value between H2 and H3, we took classification consistency and classification accuracy of the H2 and H3 models into consideration. The H2 model yielded classification accuracy of .88 using the estimator of Johnson and Sinharay (2018) and .87 based on simulated data and classification consistency of .80 and .77, respectively. In contrast, the H3 model had higher levels of classification accuracy (e.g., .90 and .91) and classification consistency (e.g., .86 and .84). Given the better classification accuracy and consistency of H3 compared to H2, H3 (access (A2)→differentiation (A3)→correction (A4)→arrangement (A5)) appears to be the best model for the COPA-SF.
Estimated Item Parameters and Item Statistics in the Five-Skill Model with the Hierarchical Structure
Estimated Item Parameters and Item Statistics in the Five-Skill Model With the Hierarchal Structure.
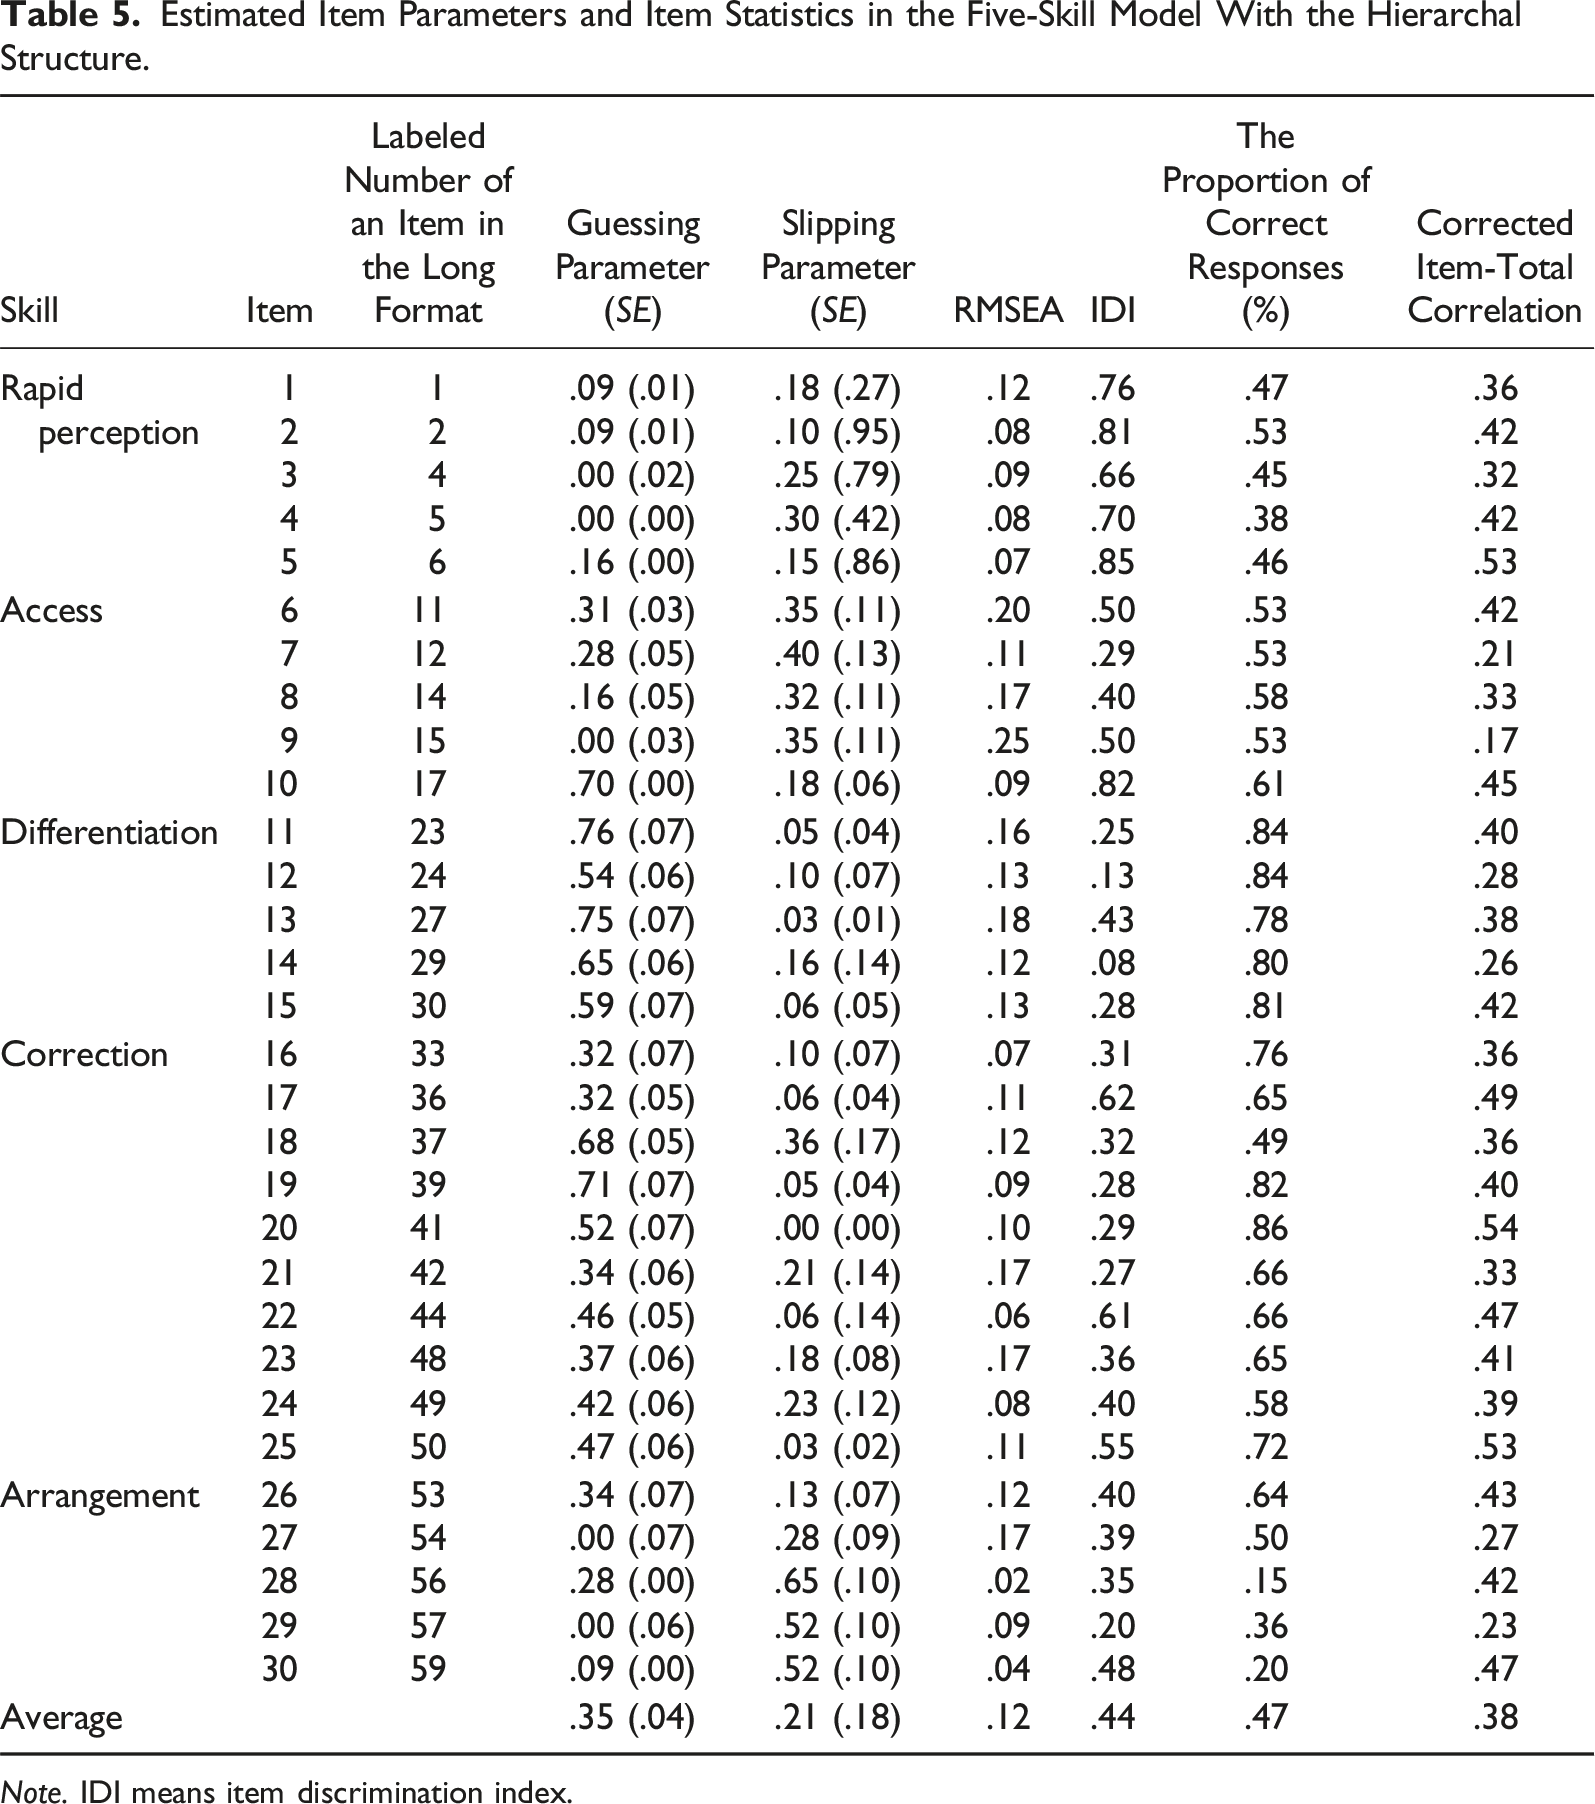
Note. IDI means item discrimination index.
Mastery Probabilities and Classification Accuracy and Consistency
The five-skill model with the H3 hierarchy model was used to obtain all diagnostic information. Based on Bayesian maximum a posteriori estimation, the proportions of mastery of the five COPA-SF skills (i.e., rapid perception, access, differentiation, correction, and arrangement) were .54, .74, .56, .53, and .42, respectively, which showed a decreasing pattern. This result also supported the H3 hierarchical model (A2→A3→A4→A5). As mentioned earlier, with two estimators (i.e., Johnson & Sinharay, 2018 and simulated data), classification accuracy rates were above .90 and classification consistency rates were around .85. For the five individual skills, classification accuracy rates were .95 or higher, and classification consistency rates were .93 or higher. Regarding classification consistency between the DINA and nonparametric DINA models, there were 56% of the profile agreement rate and 97% of the attribute agreement rate.
Correlations with External Measures
Correlations Between the Five Skills of the COPA-SF With External Measures in the Lower Triangular and Correlations Between the Five Skills of the COPA-LF With External Measures in the Upper Triangular.
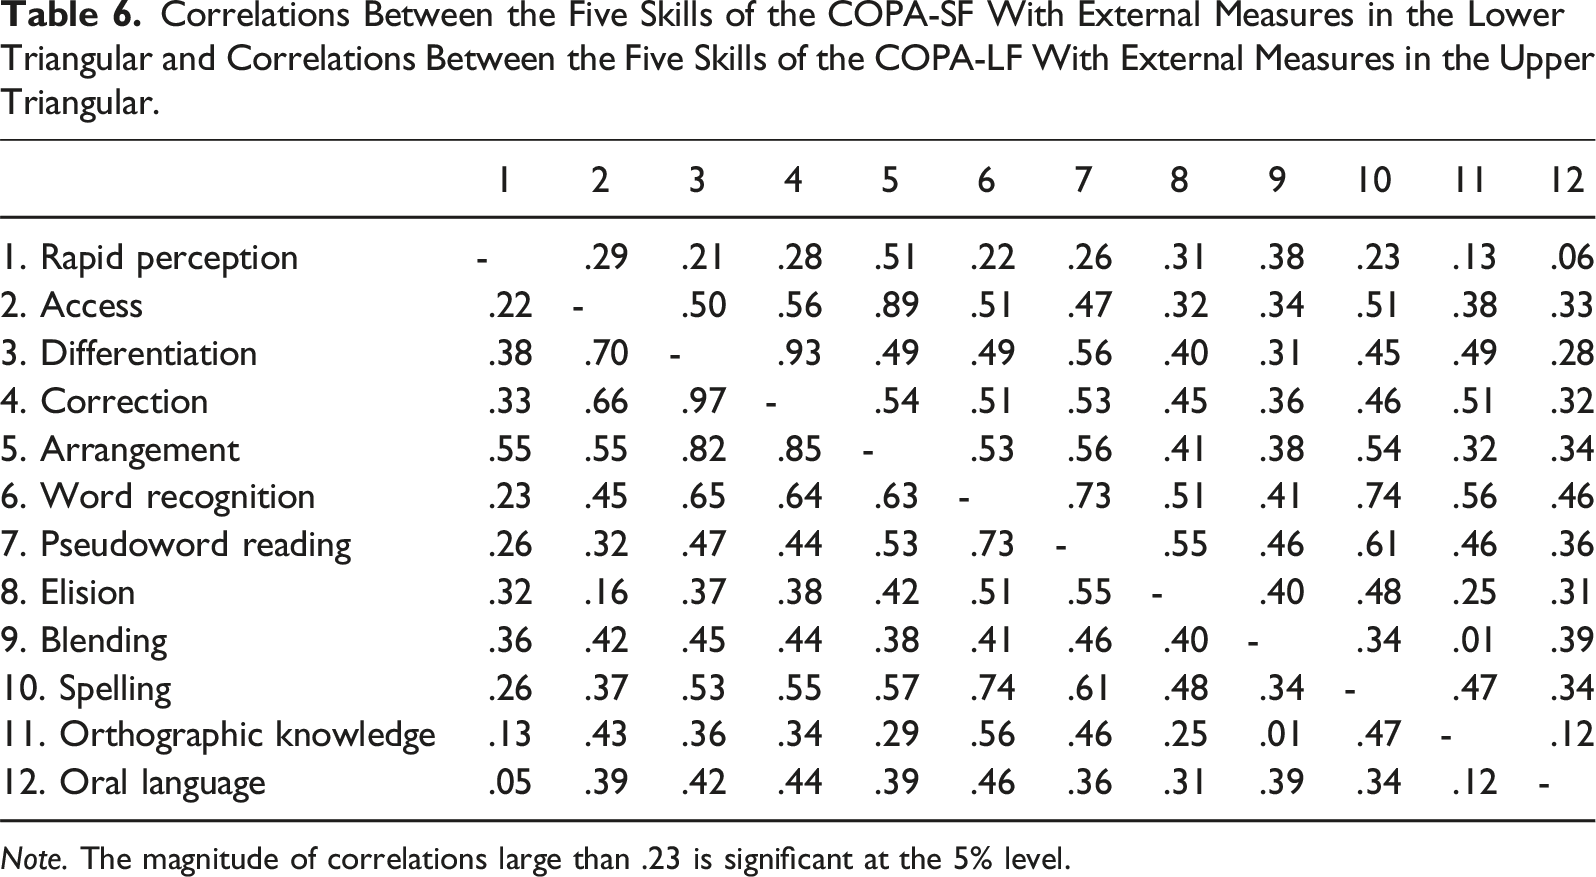
Note. The magnitude of correlations large than .23 is significant at the 5% level.
Discussion
The results of the current study found that the five-skill model with the H3 hierarchy (access → differentiation → correction → arrangement) had the best model fit for the COPA-SF. This finding is similar to the results found in Chen et al. (2022) study with the 60-item COPA-LF. Consistent with COPA-LF, COPA-SF reflected five dimensions, including rapid perception, access, differentiation, correction, and arrangement.
The mastery probabilities and learning sequence found in COPA-SF are consistent with those found in COPA-LF. The mastery probabilities of the five attributes in the COPA-SF, are .54, .74, .56, .53, and .42. These estimates are consistent with the mastery probabilities of the five attributes in COPA-LF, which are .55, .87, .77, .77, and .51. Both COPA-SF and COPA-LF reflect a learning progression among four attributes, that is, access → differentiation → correction → arrangement. The learning sequence is slightly different from the sequence proposed by Chen et al. (2020), that is, rapid perception → access → differentiation → correction → arrangement. The discrepancy between the proposed learning sequence in Chen et al. (2020, 2022) and this study could be due to imposing a five-second time-out rule on the rapid perception items. The speeded nature of the perception items made the rapid perception items more difficult for second-grade students than expected. Nevertheless, the COPA-SF successfully demonstrated the identical learning progression discovered in the COPA-LF (Chen et al., 2022).
As we purposely selected the items with the highest IDI values for each subtest to form the COPA-SF, most items in the COPA-SF have above .20 IDI values with an average of .44, suggesting all items have high quality. Only Items 12 and 14 (Items 24 and 29 in the original COPA-LF) and item 14 (Item 29 in the COPA-LF) showed the IDI values were below .20. However, the IDI values for these two items were .32 and .34 in the COPA-LF, respectively (Chen et al., 2022). The lower IDI values of Items 12 and 14 in the COPA-SF might be associated with the substantial reduction of the number of items.
In Chen et al. (2022) study, the COPA-LF has classification accuracy rates of .91 using the estimator by Johnson and Sinharay (2018) and at .97 using simulated data randomly drawn from 5000 observations from the sample. The COPA-LF has classification consistency rates of .90 using the estimator by Johnson and Sinharay (2018) and of .91 using simulated data. For five individual skills, accuracy rates were .93 or higher, and classification consistency rates were .91 or higher. With half of the items, the COPA-SF has the capacity to demonstrate comparable accuracy and consistency as the COPA-LF. This finding signifies the utility of the COPA-SF since it requires half of the time of the COPA-LF while maintaining consistency and accuracy when determining second-grade students’ mastery status of orthographic processing skills.
Previous research demonstrated that the COPA-LF has small to moderate correlations with word recognition, pseudoword reading, phonological processing, spelling ability, orthographic knowledge, and oral language (Chen et al., 2020, 2022). In the COPA-LF, Chen et al. (2022) found that the correlations between the COPA-LF and these external variables ranged from .06 to .56. The present study showed that the COPA-SF has a similar degree of correlation with these external variables, ranging from .05 to .65. Moreover, because orthographic processing is a critical skill for word recognition (Cunningham, 2006; Stanovich & West, 1989) and spelling (Chen et al., 2021; Zarić et al., 2021), the COPA-LF was expected to more strongly correlated with external measures involving processing letters and print (Chen et al., 2020), which it did. Similarly, an essential piece of evidence for validating the COPA-SF was that it should have a stronger correlation with spelling, word recognition, pseudoword reading, and orthographic knowledge than oral language, which it did, providing another piece of concurrent validity evidence.
The average correlation between the COPA-SF and orthographic knowledge (average r = .31) was unexpected. As the assessment of the non-normed Orthographic Choice Task (Olson et al., 1985) measures students’ ability to choose the correct spelling among two options (e.g., rain vs. rane), we expected the correlation between the COPA-SF and orthographic knowledge would be close to the correlation between the COPA-SF and spelling (average r = .42), but it was noticeably lower. One possible explanation for this unexpected finding is that Olson et al.’s (1985) orthographic choice task might not tap the spelling recognition ability for which it was originally designed. This potential explanation is further supported by the difference in the degree of correlation between spelling and word recognition (r = .74) and between spelling and orthographic knowledge (r = .47).
The correlations among the five skills ranged from moderate to high. Specifically, the correlation between the differentiation and correction subscales was exceptionally high (r = .97). This pattern was also observed in the COPA-LF, where the correlation was .93 (as shown in Table 6). In response to these results, we conducted additional analyses by fitting the data to a four-skill model and comparing it with the original five-skill model. The results indicated that the four-skill model fit the data better than the five-skill model (see Table S2 in Supplemental Materials). However, from a pedagogical perspective, differentiation and correction skills should be considered as separate skills, as they measure different aspects of ability. The differentiation skill assesses the ability to distinguish between permissible and impermissible combinations, while the correction skill evaluates the ability to produce correct spelling. These two skills provide distinct diagnostic information to researchers and practitioners, especially when teaching young children to read and spell (Chen et al., 2020), so we opted to keep both subscales in the measure.
However, this high correlation prompted us to formulate a new hypothesis about the development of differentiation and correction skills. The strong correlation implies that young children likely develop these two skills simultaneously. Although these skills are distinct in their pedagogical application, analyzing only the correctness of the answers may not reveal their differences. To test this hypothesis, future studies should employ methods like eye-tracking, response time, or brain imaging to examine the differences and similarities between these skills.
In this study, we used the DINA model with parametric (i.e., maximum likelihood (ML) estimation) and nonparametric approaches to examine the dimensionality and the hierarchical structure of the COPA-SF. The RMSEA has been widely used in parametric approaches with the ML estimation to assess item fit and select the best-fitting model, particularly for larger samples (N >200) (Kunina-Habenicht et al., 2009; Liu et al., 2016). However, our analysis revealed that most RMSEA values exceeded .10 when examining the dimensionality and hierarchical models for our data. This outcome may be attributed to the small sample size in our study. To our knowledge, no research has comprehensively evaluated the performance of fit indices for assessing model and item fit in small samples. Given that sample sizes below 100 are common in educational settings, future research should investigate the effectiveness of fit indices under small sample conditions.
In the nonparametric cognitive diagnosis approach, the average loss value index clearly demonstrated that the H4 hierarchical model (Perception (A1) → Access (A2) → Differentiation (A3) → Correction (A4) → Arrangement (A5)) had the highest average loss value, suggesting this model did not fit the data well. However, the average loss values did not show large differences for the rest of the models. The findings were in line with previous studies that found that model-fit indices (e.g., RMSEA under the ML estimation and the posterior predictive probability under the Bayesian estimation) showed slight differences in different attribute hierarchical models using ML and Bayesian estimations (Hsu et al., 2023; Liu, 2018). As model-fit indices have not been systematically examined for selecting the best-fitting attribute hierarchical model, more studies are warranted.
Limitation and Future Study
There are several limitations associated with the present study that may lead to future research. First, we only focused on second-grade students, which might limit the generalizability of the findings of the current study. Future studies should seek to validate the COPA-SF with participants in additional grade levels. Second, this study did not examine whether the COPA-SF has biased items. For example, we did not analyze if there was an impact of home language or cultural differences on performance. Thus, future research could focus on conducting measurement invariance and differential item functioning analysis on the COPA-SF. Third, this study thoughtfully selected the CDM framework to validate the COPA-SF, leveraging its unique strengths in assessing fine-grained cognitive skills. However, future research could complement our CDM-based findings by incorporating IRT and CFA approaches (e.g., Chen et al., 2023), potentially enhancing the comprehensive understanding of the COPA-SF’ psychometric properties and further expanding its utility in various practical contexts. Lastly, a computerized adaptive version of the COPA-SF might have the potential to reduce response time and cover a broader range of difficulty levels in a shorter amount of time than the shortened version presented here. Thus, developing a computerized adaptive test of the COPA-SF could be a beneficial avenue for future research.
Conclusion
The COPA-SF is an innovative, time-efficient, multidimensional measure of orthographic processing. The COPA-SF was found to have similarly promising psychometric properties as the COPA-LF. Both the COPA-LF and the COPA-SF measure five skills and reflect a linear progression among four skills (i.e., access → differentiation → correction → arrangement). The COPA-SF has equivalent consistency and accuracy when determining participants’ mastery of orthographic processing skills. The COPA-SF has better quality items than the COPA-LF. Thus, the COPA-SF is a reliable and effective tool for that can be used by researchers and practitioners to measure students’ orthographic processing skills in classroom settings and clinical practices.
Supplemental Material
Supplemental Material - Development and Initial Validation of the Computer-Based Orthographic Processing Assessment Short Form: An Application of Cognitive Diagnostic Modeling
Supplemental Material for Development and Initial Validation of the Computer-Based Orthographic Processing Assessment Short Form: An Application of Cognitive Diagnostic Modeling by Yi-Jui I. Chen, Yi-Jhen Wu, Yi-Hsin Chen, and Robin Irey in Journal of Psychoeducational Assessment.
Footnotes
Declaration of Conflicting Interests
The author(s) declared no potential conflicts of interest with respect to the research, authorship, and/or publication of this article.
Funding
The author(s) received no financial support for the research, authorship, and/or publication of this article.
Supplemental Material
Supplemental material for this article is available online.
References
Supplementary Material
Please find the following supplemental material available below.
For Open Access articles published under a Creative Commons License, all supplemental material carries the same license as the article it is associated with.
For non-Open Access articles published, all supplemental material carries a non-exclusive license, and permission requests for re-use of supplemental material or any part of supplemental material shall be sent directly to the copyright owner as specified in the copyright notice associated with the article.