
Abstract
Perfectionism measures developed in English-speaking populations have become frequently used in many non-English contexts, including in Italy. Establishing structural and measurement equivalence of instruments between Canadian and Italian samples is therefore important in establishing the validity of these concepts and instruments in Italian contexts, and to allow for direct cross-cultural comparisons. The current study investigated the measurement equivalence between a Canadian and an Italian sample for the commonly used measures of perfectionism constructs based on the Comprehensive Model of Perfectionistic Behavior. The Hewitt & Flett Multidimensional Perfectionism Scale, the Perfectionistic Self-Presentation Scale, and the Perfectionism Cognitions Inventory were examined for configural, metric, and scalar invariance via equivalence testing of multigroup confirmatory factor analysis models. The results showed some evidence for configural and metric equivalence for the three measures, thus facilitating cross-cultural interpretation of pattern of associations. However, there was no consistent evidence for scalar invariance, thus suggesting that direct comparisons of perfectionism levels between the two contexts cannot be meaningfully interpreted. This highlights the need for research in both Canadian and Italian contexts to understand cross-cultural differences and similarities in perfectionism.
Perfectionism is conceptualized as a broad, pervasive, and multifaceted personality construct which has been well-demonstrated over decades of research as a transdiagnostic vulnerability factor for a myriad of adverse mental and physical health outcomes, including depression, anxiety, eating disorders, personality disorders, schizotypy, suicidality, and early death (e.g., see Cheli et al., 2023; Sassaroli et al., 2008; Shafran & Mansell, 2001; Sherry et al., 2007; Smith et al., 2018). Perfectionism as a personality trait is characterized by the imposition of excessively high standards and the incessant pursuit of perfection and is accompanied by a general negative sense of self-worth and overly harsh evaluations of behaviors (Flett & Hewitt, 2002). This topic is particularly important given a steady increase in the levels of trait perfectionism dimensions among young adults over the past three decades (Curran & Hill, 2019), and its role in impeding effective treatment for psychological difficulties (e.g., (Hewitt et al., 2020; Miller et al., 2017). The majority of perfectionism research has been conducted in English-speaking (Canadian and America) populations. In recent years, perfectionism research has become more prevalent in a wide range of languages and cultures, as researchers in other countries have found the conceptualization and instruments useful for understanding personality and mental health in their respective contexts.
However, transplanting concepts and instruments created in one particular cultural/language context to a different cultural/language context requires conceptual and psychometric evaluation of the cross-cultural equivalence. Individuals from different cultural backgrounds may interpret and respond to inventory items differently due to variability in cultural norms and values, response biases, and language idiosyncrasies (Chen, 2008). Therefore, any meaningful analysis and interpretation using scales developed in a different cultural and linguistic context, and in particular cross-cultural studies examining differences and similarities between cultures, require evaluation of the instruments used both for conceptual (van de Vijver & Leung, 2021) and measurement equivalence (Milfont & Fischer, 2010).
The current study seeks to examine the equivalence of Italian and English versions of the component measures of the Comprehensive Model of Perfectionistic Behavior (CMPB; Hewitt et al., 2017), including the Multidimensional Perfectionism Scale (MPS; Hewitt & Flett, 1991), the Perfectionistic Self-Presentation Scale (PSPS; Hewitt et al., 2003), and the Perfectionistic Cognitions Inventory (PCI; Flett et al., 1998). The MPS is a measure that examines perfectionistic tendencies at the trait level in three subscales: self-oriented perfectionism (SOP; expecting perfection from oneself), other-oriented perfectionism (OOP; expecting perfection of others), and socially prescribed perfectionism (SPP; perceiving one is expected to be perfect by others). The PSPS is a measure that examines behaviors aimed at appearing perfect to others in three subscales: perfectionistic self-promotion (SP; showing off one’s perceived positive qualities), non-disclosure of imperfections (NDC; not talking about one’s perceived flaws), and non-display of imperfections (NDP; not showing one’s perceived flaws). The PCI is a measure that examines automatic thoughts and beliefs related to that perfection should be attained, in a single factor. Please see Appendix for a more thorough review of the nature of these perfectionism constructs. Cross-cultural validation of these widely employed research instruments would be helpful for expanding the instruments available to investigate perfectionism and its correlates in Italian samples, for interpretations of findings in Italian samples within the context of the existing literature in English samples, and for examining the impact of culture on perfectionism via cross-cultural comparisons between Italian and English samples. Cross-cultural validation of these instruments would also facilitate transportation of the theoretical underpinnings of the CMPB, such as the role of attachment asynchrony and social disconnection (Hewitt et al., 2017), in understanding the development, maintenance, and consequences of perfectionism in the Italian context.
Even though both Italy and Canada are Western developed countries, their cultures differ on several fronts. Italy has lower immigration rates and higher cultural homogeneity compared to Canada (Berry, 2013; WorldData.info, 2024). While Italians emphasize social interdependence, particularly within the family, North Americans tend to prioritize individual autonomy (Fernández Sedano et al., 2005). Compared to Italian culture, objectivity holds greater sway in Canadian culture and emotional detachment is more valued (Borchiellini, 2012; Mesquita & Frijda, 1992). These differences in interpersonal and social norms may be particularly salient given the CMPB and its associated theoretical underpinnings that emphasize the relational nature of perfectionism (Hewitt et al., 2017). With regard to response patterns on questionnaires, a study comparing response biases across 15 countries spanning the globe, Italians demonstrated higher than mean levels of socially desirable responding, whereas Canadians demonstrated lower than mean levels of socially desirable responding (Tellis & Chandrasekaran, 2010). Italians demonstrated higher tendencies to endorse extreme responses as they scored high on both yea-saying and nay-saying, while Canadians scored high on nay-saying but ranked mid-way on yea-saying. Italian and English languages may also present challenges to cross-cultural comparability of translated instruments at the linguistic level (Clivio & Danesi, 2000). For instance, Italian, compared to English, is typically characterized by longer and more complex sentences, a more intricate verb conjugation system, and greater conveyance of nuances through pronoun usage and intonation. These types of differences may thus present challenges to both conceptual and measurement equivalence of perfectionism instruments in Canadian and Italian populations.
Studies in Italian samples have demonstrated that, like in North American English-speaking samples, perfectionism is associated with a wide range of mental health outcomes (e.g., Casale et al., 2020; Cheli et al., 2023; Costa et al., 2016; Dimaggio et al., 2018; Ghisi et al., 2010; Spagnoli et al., 2020; Vacca et al., 2021). Previous comparisons of factoral structures of perfectionism instruments among adults in Italian samples have found some evidence of conceptual equivalence compared to Canadian and American samples (e.g., Borroni et al., 2016; Cavalletti, Balbo, et al., 2021; Cavalletti, Floridi, et al., 2021; Cavalletti, Saini, et al., 2021; Cheli et al., 2021; Lombardo et al., 2022; Rice et al., 2020; Vecchione & Vacca, 2021). Investigations in university student samples for scalar invariance of these instruments, necessary for direct cross-cultural mean comparisons between Italian and Canadian samples, have not been conclusive and have only found evidence of partial equivalence (e.g., Rice et al., 2020; Vecchione & Vacca, 2021).
Therefore, the current study examined the MPS, PSPS, and PCI, in an Italian and a Canadian sample for configural, metric, and scalar equivalence using multigroup confirmatory factor analysis (CFA) with equivalence testing (Counsell et al., 2020; Yuan & Chan, 2016). Demonstrating configural equivalence is needed to establish that instrument (sub)scales have the same relationship between populations, to allow for comparisons of associations between perfectionism measures and other variables (e.g., psychopathology symptoms). Demonstrating metric and scalar equivalence is needed to establish that (sub)scales have the same units and intercepts between populations, to allow for comparisons of levels of perfectionism between cultures. Given previous findings in this area (e.g., Rice et al., 2020), we expected to find evidence for structural and configural equivalence, while findings would likely be more equivocal for metric and scalar equivalence.
Methods
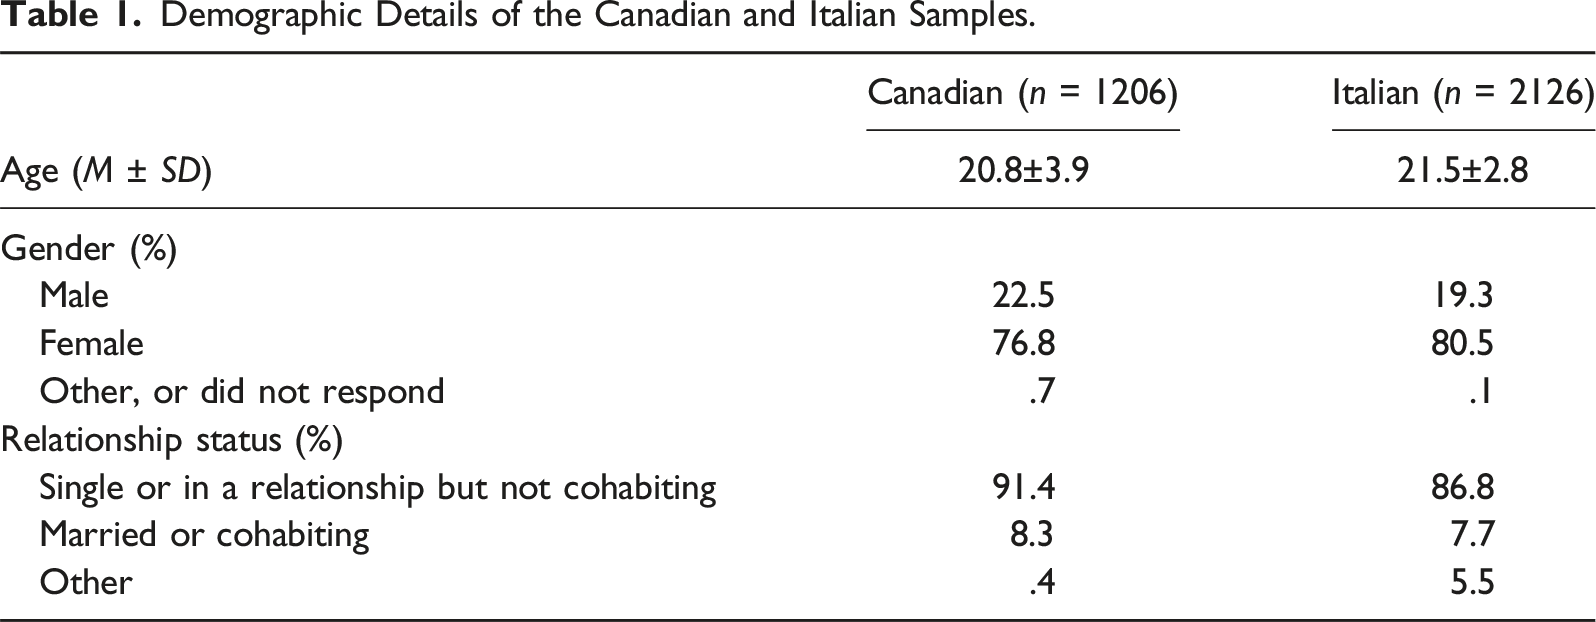
Participants and Procedures
Demographic Details of the Canadian and Italian Samples.
Measures
The Multidimensional Perfectionism Scale (MPS; Hewitt & Flett, 1991) was used to assess three trait dimensions of overall perfectionism: self-oriented perfectionism (SOP, unrealistic expectations for oneself), other-oriented perfectionism (OOP, unrealistic expectations for others), and socially prescribed perfectionism (SOP, perception that other people expect oneself to be perfect). The MPS consists of 45 items in three subscales corresponding to each dimension assessed: SOP (15 items; e.g., “When I am working on something, I cannot relax until it is perfect”), OOP (15 items; e.g., “I can’t be bothered with people who won’t strive to better themselves”), and SPP (15 items; e.g., “The people around me expect me to succeed at everything I do”). Participants rated their endorsement of each statement describing a perfectionistic trait on a 7-point scale. Subscale scores range from 15 to 105, with higher subscale scores indicating higher levels of perfectionistic personality style in the corresponding dimensions. The Italian translation of the MPS has been previously reported as having acceptable internal consistency in a young adult sample (Cavalletti, Floridi, et al., 2021).
The Perfectionistic Self-Presentation Scale (PSPS; Hewitt et al., 2003) was used to assess three types of perfectionistic interpersonal behavior: perfectionism self-promotion (SP, the need to promote oneself as perfect to others), non-display of imperfection (NDP, concerns over being seen publicly as behaving in a less-than-perfect manner by others), and non-disclosure of imperfection (NDC, nonadmission of shortcomings). The PSPS consists of 27 items in three subscales corresponding to each dimension assessed: SP (10 items; e.g., “I must always appear to be perfect”), NDP (10 items; e.g., “it would be awful if I made a fool of myself in front of others”), and NDC (7 items; e.g., “I should solve my own problems rather than admit them to others”). Participants rated their endorsement of each statement describing a perfectionistic behavior as it relates to self-presentation on a 7-point scale. Subscale scores for SP and NDP range from 10 to 70 and subscale scores for NDC range from 7 to 49, with higher subscale scores indicating higher levels of greater expression of perfectionistic behaviors in interpersonal contexts in the corresponding type. The Italian translation of the PSPS has previously been reported to have acceptable internal consistency in a non-clinical adult sample (Borroni et al., 2016).
The Perfectionistic Cognitions Inventory (PCI; Flett et al., 1998) was used to assess perfectionistic cognitions. The PCI focuses on the frequency of thoughts about the need to be perfect and an individual’s own awareness of their imperfections. Sample items on the PCI include “I should be perfect,” “I should never make the same mistake twice,” “I must be efficient at all times,” “No matter how much I do, it’s never enough.” The PCI consists of 25 items. Participants rated the frequency of occurrence of each perfectionistic cognition on a 5-point scale, with the total score ranging from 0 to 100. The Italian translation of the PCI has previously been reported to have good internal consistency in a young adult sample (Cavalletti, Saini, et al., 2021).
Data Analysis
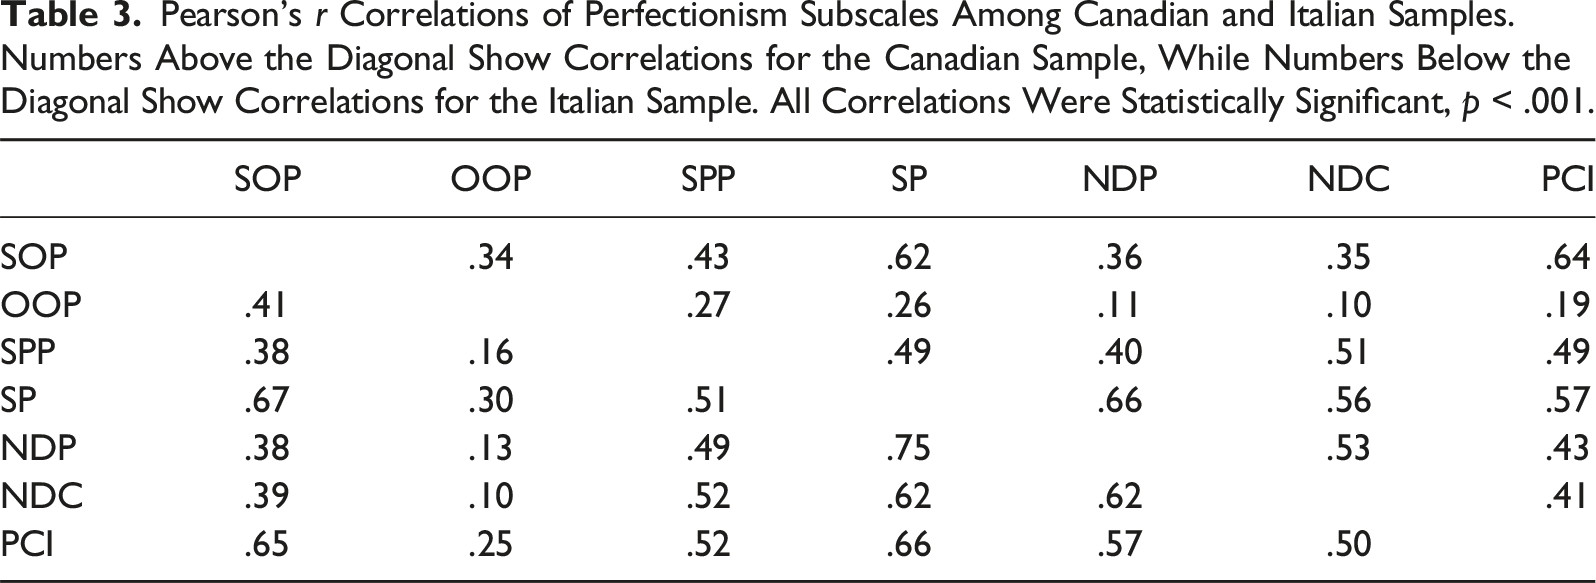
Pearson’s r correlations were calculated to examine zero-order associations between the MPS and PSPS subscale scores, and PCI total scores, for each of the Canadian and Italian sample. Measurement invariance was examined using multigroup CFA (Milfont & Fischer, 2015) equivalence testing (citations). Three-factor models were examined for the MPS and for the PSPS, and a one-factor model for the PCI, wherein (sub)scale scores were entered as latent variables and item scores were entered as manifest variables. First, the models were examined for configural invariance by combining both samples and calculating model fit when imposing the same model structure in each group. Second, the models were examined for metric invariance when constraining factor loadings to be equal in both groups. Third, the models were examined for scalar invariance when constraining factor loadings and item intercepts to be equal between groups. For scaling of each model, the residual variance of latent factors was restricted to one. Model fit was determined via comparative fit index (CFI) > .90, root mean square error of approximation (RMSEA) < .05, and standardized root mean square residual (SRMR) ≤ .08 (Byrne, 1994). Equivalence testing was used to examine configural invariance using the first model and to examine metric and scalar invariance by comparing the second and third models to the prior less-constrained model (Counsell et al., 2020; Yuan & Chan, 2016). For interpreting minimum tolerable size of misspecification and model equivalence, as recommended by Counsell et al., MacCallum et al.’s (2006) RMSEA guidelines of .01, .05, .08, and .10 for differentiating between “excellent,” “close,” “fair,” “mediocre,” and “poor” fitting models, respectively, were used without the adjustment proposed by Yuan and Chan. Change in fit indices (specifically, ΔCFI and ΔRMSEA) between the second and third models with their respective less-constrained models were also reported, and cutoffs of ΔCFI > −.005 and ΔRMSEA < .010 were used to indicated model invariance (Chen, 2007). CFAs were conducted in the lavaan package 0.5–12 (Rosseel, 2012) for R (R Foundation for Statistical Computing).
Results
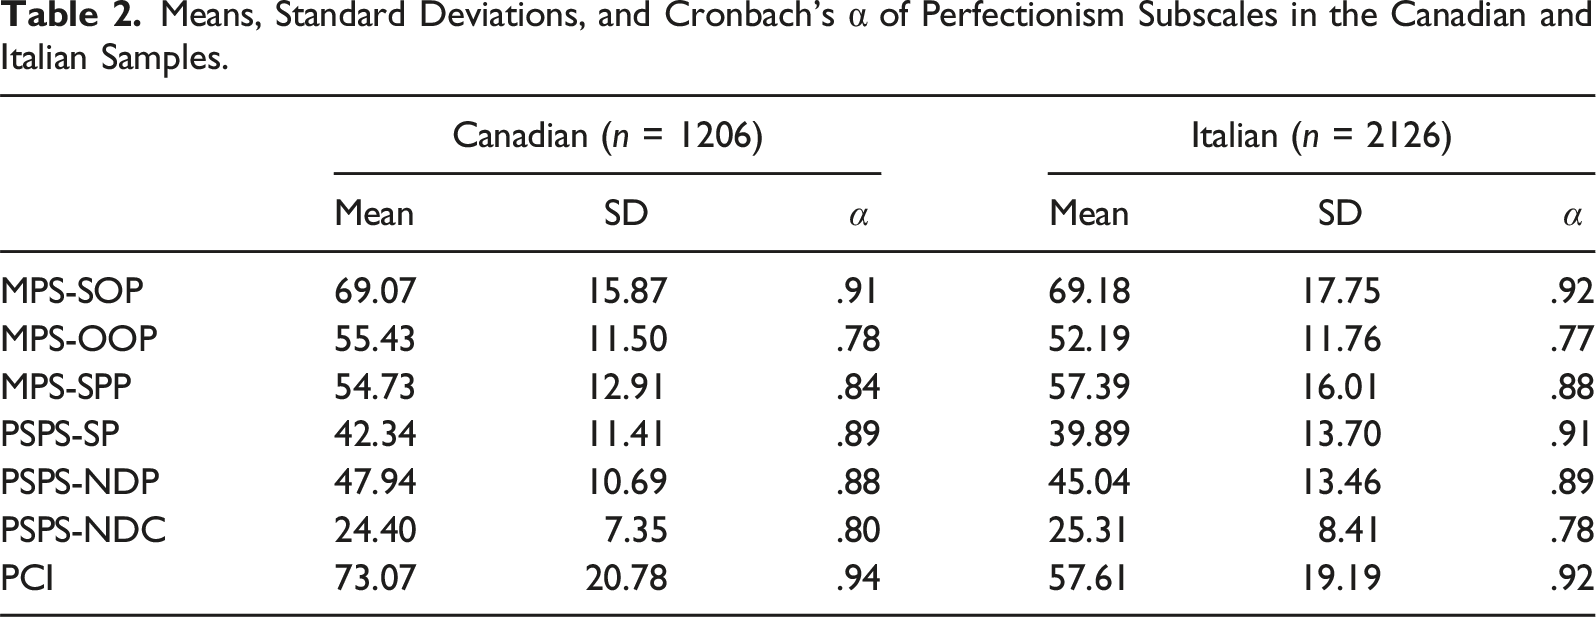
Descriptive Analyses
Means, Standard Deviations, and Cronbach’s α of Perfectionism Subscales in the Canadian and Italian Samples.
Pearson’s r Correlations of Perfectionism Subscales Among Canadian and Italian Samples. Numbers Above the Diagonal Show Correlations for the Canadian Sample, While Numbers Below the Diagonal Show Correlations for the Italian Sample. All Correlations Were Statistically Significant, p < .001.
Confirmatory Factor Analysis
For the MPS, when both groups were constrained to have the same model structure, the model showed good fit via the SRMR only (χ2(1884) = 16952.70, p < .001; CFI = .726; RMSEA = .069; SRMR = .079); equivalence testing showed a close model fit (ε0 = 4.650, RMSEA0 = .050). When both groups were constrained to have the same factor loadings, the model showed good fit via the SRMR only (χ2(1926) = 17392.68, p < .001; CFI = .719; RMSEA = .070; SRMR = .083). Equivalence testing compared to the first model showed a fair model fit (Δχ2(42) = 439.98, ε0 = .070, RMSEA0 = .058); ΔRMSEA (.001), but not ΔCFI (−.007), met the cutoff for change in fit indices. The model did not show good fit when both groups were constrained to have the same item intercepts (χ2(1968) = 23098.05, p < .001; CFI = .616; RMSEA = .080; SRMR = .095). Equivalence testing compared to the second model showed a poor model fit (Δχ2(42) = 5705.37, ε0 = .888, RMSEA0 = .206); neither ΔCFI (−.103) nor ΔRMSEA (.010) met the cutoff for change in fit indices. This provides some evidence of configural and metric equivalence, but not for scalar equivalence, of the MPS between the two groups.
For the PSPS, when both groups were constrained to have the same model structure, the model showed good fit via SRMR only (χ2(642) = 7883.68, p < .001; CFI = .843; RMSEA = .082; SRMR = .067); equivalence testing showed a fair model fit (ε0 = 2.261, RMSEA0 = .059). When both groups were constrained to have the same factor loadings, the model showed good fit via SRMR only (χ2(666) = 8065.50, p < .001; CFI = .840; RMSEA = .082; SRMR = .070). Equivalence testing compared to the first model showed a fair model fit (Δχ2(24) = 181.82, ε0 = .031, RMSEA0 = .051); both ΔCFI (−.003) and ΔRMSEA (.000) met the cutoff for change in fit indices. When both groups were constrained to have the same item intercepts, the model showed good fit via SRMR only (χ2(690) = 9503.30, p < .001; CFI = .809; RMSEA = .088; SRMR = .076). Equivalence testing compared to the second model showed a poor model fit (Δχ2(24) = 1437.80, ε0 = .231, RMSEA0 = .139); ΔRMSEA (.006), but not ΔCFI (−.031), met the cutoff for change in fit indices. This provides some evidence of configural and metric equivalence, but not of scalar equivalence, of the PSPS between the two groups.
For the PCI, in phase 1, when both groups were constrained to have the same model structure, the model showed good fit via SRMR only (χ2(550) = 10872.72, p < .001; CFI = .748; RMSEA = .107; SRMR = .070); equivalence testing showed a fair model fit (ε0 = 3.202, RMSEA0 = .076). In phase 2, when both groups were constrained to have the same factor loadings, the model did not show good fit (χ2(574) = 11184.32, p < .001; CFI = .741; RMSEA = .106; SRMR = .083). Equivalence testing compared to the first model showed a fair model fit (Δχ2(24) = 311.60, ε0 = .052, RMSEA0 = .066); ΔRMSEA (−.001), but not ΔCFI (−.007), met the cutoff for change in fit indices. In phase 3, when both groups were constrained to have the same item intercepts, the model did not show good fit (χ2(598) = 13439.53, p < .001; CFI = .687; RMSEA = .114; SRMR = .096). Equivalence testing compared to the second model showed a fair model fit (Δχ2(24) = 2255.21, ε0 = .359, RMSEA0 = .173); ΔRMSEA (.008), but not ΔCFI (−.054), met the cutoff for change in fit indices. This provides some evidence of configural and metric equivalence, but not scalar equivalence, for the PCI between the two groups.
Discussion
The present study examined the factorial and measurement equivalence of the Italian versions of the MPS, PSPS, and PCI in an Italian sample with the English versions of the MPS, PSPS, and PCI in a Canadian sample, to help understand the cross-cultural validity of the constructs of perfectionism traits, self-presentation behaviors, and associated cognitions. Consistent with expectations, we found some evidence for configural equivalence for the MPS, PSPS, and PCI. These were generally consistent with past findings in this area; for example, Cavalletti et al.’s (2021b) and Lombardo et al.’s (2022) findings on the factorial structure and concurrent validity of the MPS in Italian university and patient samples. There was also some evidence of metric equivalence for all three instruments via equivalence testing on the models where factor loadings were also constrained. This provides some support for shared conceptual interpretation of the MPS, PSPS, and PCI between Canadian and Italian samples, and meaningful comparisons between populations of the association between scores on the perfectionism measures and other variables (e.g., psychopathology symptoms) between the two populations. However, it should be noted that equivalence testing generally only identified “fair” model fit at this level, with only MPS configural equivalence showing “close” model fit and no models showing “excellent” fit. This may indicate that there continues to be substantial potential challenges to cross-cultural configural and metric equivalence in these instruments between these two samples, and potentially between Canadian and Italian populations.
None of the three scales showed evidence of scalar invariance on either alternative fit index. Therefore, comparisons of levels of scores on these measures between the Italian and Canadian groups cannot be meaningfully interpreted. These findings dovetail with the previous work of Rice et al. (2020) on a short form of the MPS in an Italian and an American sample, which also did not find conclusive evidence of cross-cultural scalar invariance in that instrument. These findings may reflect cultural, educational, and economic differences between Canada and Italy. It may also be due to differences in patterns/biases in responding to questionnaires or in the subjective evaluation of one’s own level of perfectionism traits, cognitions, and self-presentation behaviors. Further research is needed to better understand how these differences may impact on assessment of perfectionism. Researchers interested in examining differences in levels of perfectionism between Canada and Italy may benefit in particular from further work into developing perfectionism instruments with comparable means or norm scores.
Notably, in the multigroup CFA where only the model structure was constrained, only one fit index (SRMR) showed good model fit for configural equivalence across all three instruments. This may be similar to Borroni et al. (2016), which found good fit for a three-factor model in the PSPS using some methods but not others. This suggests that interpretations relying on perfectionism to represent the exact same concept or set of constructs, or relationship between constructs, in Canadian and Italian language and cultural contexts should be made with some caution. Differences may exist at the levels of instrument translation but may also be indicative of key cultural differences in traits, behaviors, and cognitions associated with perfectionism. Both the Canadian and Italian samples seem to have deviated somewhat from the expected model, which may suggest differences in how perfectionism manifests may differ also across time (including potential changes between the original conceptualization of the instrument and construct in Hewitt et al. (1991) compared to the present day).
There were additional limitations to the generalizability of the findings. The two samples are potentially only representative of young adults and were heavily skewed in gender toward women and were not stratified by region, education, and socioeconomic status. The findings may also not be applicable to clinical populations of interest. The Italian sample was also nearly double the size of the Canadian one, which may have influenced the results. Unfortunately, the current study was not able to identify which specific elements of the Italian and Canadian contexts or samples would have contributed to challenges to conceptual or measurement invariance. Further research using both quantitative and qualitative methods within Italy, as well as using cross-cultural methods, would be useful for elucidating the specific factors that may have contributed to the current pattern, as well as identify how of the observed differences is the result of measurement/translation issues versus “genuine” cultural differences in the construct of perfectionism.
Conclusion
The insights gained from the research on perfectionism have profound implications for understanding personality and mental health. Perfectionism, especially when characterized by high levels of socially prescribed perfectionism, is linked to various negative outcomes such as depression, anxiety, and even suicidal behavior. Understanding the cognitive processes underlying perfectionism, as revealed by scales like the PCI, provides valuable insights into the mechanisms driving these negative outcomes. By recognizing the role of automatic perfectionistic thoughts in perpetuating perfectionism, interventions can be tailored to address cognitive biases and maladaptive thought patterns associated with perfectionism. This not only contributes to scholarly understanding but also offers practical implications for therapeutic interventions aimed at alleviating the distress experienced by perfectionists.
These current findings have important implications for cross-cultural research in perfectionism, and personality and mental health in general. It provides some evidence that perfectionism traits, perfectionism self-presentation behavior, and perfectionistic cognitions may be conceptually similar between Canadian and Italian cultures, and that it can be meaningful to interpret cross-cultural associations between different aspects of perfectionism and potentially with other measures (e.g., depression and personality traits). However, caution is needed as differences may still exist in how translated questionnaires and perfectionism in general are interpreted and experienced across cultures. Validation of direct comparisons between mean scores on perfectionism measures between Canadian and Italian samples remains challenging. These findings further highlight the complexity of translating instruments developed in one culture into another, even in two industrialized, “Western” countries. Further research, particularly collaboration by Canadian and Italian researchers using multi-method approaches, would be useful for elucidating the similarities and differences between these two cultures in how perfectionism manifests, how participants respond on perfectionism questionnaires, and the implications of such for understanding psychological difficulties and their treatment.
Supplemental Material
Supplemental Material - Examination of Measures of Perfectionism for Structural and Measurement Invariance in an Italian and a Canadian Sample
Supplemental Material for Examination of Measures of Perfectionism for Structural and Measurement Invariance in an Italian and a Canadian Sample by Nicolle F. Cai, Silvain S. Dang, Simone Cheli, Veronica Cavalletti, Gordon L. Flett, and Paul L. Hewit in Journal of Psychoeducational Assessment
Footnotes
Declaration of Conflicting Interests
The author(s) declared no potential conflicts of interest with respect to the research, authorship, and/or publication of this article.
Funding
The author(s) disclosed receipt of the following financial support for the research, authorship, and/or publication of this article: This work was supported by the Social Sciences and Humanities Research Council (4352015-0412).
Supplemental Material
Supplemental material for this article is available online.
References
Supplementary Material
Please find the following supplemental material available below.
For Open Access articles published under a Creative Commons License, all supplemental material carries the same license as the article it is associated with.
For non-Open Access articles published, all supplemental material carries a non-exclusive license, and permission requests for re-use of supplemental material or any part of supplemental material shall be sent directly to the copyright owner as specified in the copyright notice associated with the article.