
Abstract
Research self-efficacy is a key component of college students’ career development. This study’s purpose was to develop and begin to construct a validity argument for scores from the Sources of Research Self-Efficacy (SRSE) scale in college students. We explored validity evidence for SRSE scores from 719 undergraduate and graduate students based on test content, response processes, internal structure, relations to related variables, and consequences of testing. We present evidence from our development process for test content and response processes. Our statistical analyses suggest that a 20-item four-factor model is appropriate, with subscales representing Mastery Experiences, Vicarious Experiences, Social Persuasion, and Negative Emotional States. Subscale scores showed good internal consistency and correlated with both global research self-efficacy and research outcome expectancy scores. The SRSE shows promise as a measure of the various learning experiences that lead to students’ research self-efficacy in university settings.
Keywords
Development and Validation of the Sources of Research Self-Efficacy Scale
Research self-efficacy beliefs play an important role in the development of college students’ academic and career trajectories. Defined as the belief in one’s ability to successfully complete research tasks, research self-efficacy directly influences research productivity (Bieschke, 2006). Greater research self-efficacy may increase the extent to which students participate in research activities, pursue graduate degrees, and choose research-oriented careers (Bieschke et al., 1996; Tate et al., 2015). As students with high research self-efficacy beliefs are more likely to exhibit positive outcome expectations for research involvement, research self-efficacy is a key precursor to graduate degree completion, scholarly productivity, and future academic career success (Jones et al., 2022; Litson et al., 2021). As such, the measurement of research self-efficacy beliefs is an important key to understanding and tracking college students’ career development (Lent et al., 2002).
Measuring Research Self-efficacy
Several scales are currently available that measure college students’ research self-efficacy (Bieschke et al., 1996; O’Brien et al., 1998; Phillips & Russell, 1994). Research self-efficacy scales have typically been validated for use with graduate student populations since graduate students tend to participate in more research experiences than undergraduate students. These scales also tend to be mastery-oriented; items focus on student confidence in completing specific research tasks such as analyzing data, conducting literature reviews, designing research experiments, following ethical guidelines, and presenting research results. As global measures of research self-efficacy, these scales may provide useful information about students’ feelings about their ability to perform core research tasks (Forester et al., 2004).
Although a focus on task mastery aligns with general recommendations for self-efficacy measurement (Bandura, 2006), current research self-efficacy scales may not completely capture the interaction between self-efficacy and different types of learning experiences (Bandura, 1986, 1997). Within Social Cognitive Career Theory (SCCT, Lent et al., 1994), self-efficacy is influenced by the evolving and reciprocal relationship among oneself, one’s academic and vocational behavior, and the different domains one occupies (Bandura, 1986). Self-efficacy beliefs themselves are shaped by mastery experiences, vicarious experiences, social persuasion, and emotional affect. Mastery experiences greatly contribute to a person’s belief that they can successfully complete similar, related research tasks in the future (Bandura, 1997). Of all learning experiences, mastery experiences are the chief source of self-efficacy (Capa-Aydin et al., 2018; Usher & Pajares, 2008).
However, other experiences also contribute to the development of one’s self-efficacy beliefs, especially at the beginning of an individual’s path to mastery (Brown & Lent, 2020). Vicarious experiences, occurring when a student observes an individual (e.g., faculty, mentor, and peer) of similar or better research skill level successfully completing a difficult task, may lead to a greater perception of their ability to successfully complete the same research task. Similarly, social or verbal persuasion, which occurs when a student receives verbal or nonverbal support or encouragement from others skilled at the research task they are performing, also strengthens these beliefs. Finally, affective or physiological states such as the emotional or biological response (e.g., excitement and anxiousness) a student experiences when engaging in a research task can increase or reduce a student’s self-efficacy beliefs. More specifically, positive affect tends to increase self-efficacy beliefs, and negative affectual experiences tend to diminish these beliefs (Lent et al., 2017). Together with mastery experiences, the presence or absence of learning experiences from these sources works to shape a student’s beliefs about their ability to conduct research.
Several scales are available that measure the sources of self-efficacy as theorized by Social Cognitive Theory (Bandura 1986) in academic disciplines, many of which have been evaluated for validity evidence. For example, Usher and Pajares (2008) developed a four-source mathematics self-efficacy scale for middle school students with scores showing strong content validity, internal consistency, and criterion validity. Lent et al. (2017) developed a five-factor sources of self-efficacy in career exploration scale with separate positive and negative emotional affect, with college students’ scores showing strong internal consistency and reliability. In such multidimensional scales, the subscale scores for the sources of self-efficacy tend to be highly correlated. However, the measurement quality of scores from source-oriented scales has been suggested to be related to the degree to which they are theoretically aligned with Social Cognitive Theory (Usher & Pajares, 2008).
Study Purpose
A scale that specifically measures the four sources of research self-efficacy may facilitate a clearer understanding of how such beliefs develop in college students (Usher & Pajares, 2008). A sources-oriented scale may also better situate research experiences within the framework of SCCT (Lent et al., 2002). Exploring learning experiences beyond mastery may also enable researchers to focus on students early in their research careers, such as during undergraduate work. The purpose of this study is to provide initial validity evidence for scores from a new Sources of Research Self-Efficacy (SRSE) instrument aligned with Social Cognitive Theory and designed to measure the four sources of research self-efficacy in college students.
In this paper, we describe the development and validation process using two samples of undergraduate and graduate students at a large urban research university in the United States: a primary sample of 514 students and a cross-validation sample of 205 students. Following current standards of measurement practice (American Educational Research Association et al., 2014), we begin to craft a validity argument as well as use interpretation statements for the SRSE scale. Specifically, our argument is supported by documenting data-based evidence regarding (a) the internal structure of the scale, (b) the internal consistency of the scores, and (c) the relationship of SRSE scores to other conceptually related constructs. We also document the development process as it relates to (d) content validity and discuss the (e) consequence of using the instrument when measuring the research self-efficacy of undergraduate and graduate college students.
Method
Scale Development
The development of the Sources of Research Self-efficacy Scale (SRSE) began with a review of the research self-efficacy literature, as well as a review of the literature surrounding the measurement of the sources of self-efficacy. Specifically, we focused on the four sources of self-efficacy as conceptualized by Bandura (2006) and Lent et al. (1994) in our review of source-oriented instruments that measured self-efficacy across a wide range of content areas such as mathematics (Britner & Pajares, 2006; Usher & Pajares 2008), career exploration (Lent et al., 2017), and music (Zelenak, 2015). To develop an initial item bank aligned to theory, we adapted items from these scales, after obtaining author permission, for use with research self-efficacy and categorized them into four categories: (1) items measuring research mastery experiences, (2) items measuring research vicarious experiences, (3) items measuring social persuasion for research, and (4) items measuring emotional affect and physiological states in research. The initial item bank included 58 items with an average of 14 items per source.
We refined the item bank through an iterative process in which we obtained feedback from graduate students currently engaged in research, experts in the field of educational psychology who were university faculty with published research on self-efficacy, and undergraduate students engaged in early research experiences. First, two educational doctoral students reviewed the initial item bank for wording and appropriateness. We then submitted the items to two faculty experts in the field of educational psychology with a research background spanning over a decade in self-efficacy and psychometrics. Based on the combined feedback of experts and students, we removed 18 items and revised item wording on several additional items to better align with theory.
Next, we conducted five cognitive interviews with undergraduate students enrolled in research methods courses and evaluated the items based on the cognitive processes of the interviewees. Cognitive interviews followed a “think aloud” procedure. First, one member of the research team modeled the think aloud process. Next, participants were asked to respond to the items while verbally describing their thoughts. Following the “think aloud,” a second member of the research team asked follow-up questions focused on ambiguous terms and students’ interpretation of item meaning. The student feedback led to revising several items again for wording. For example, the item “I have had positive experiences participating in research collection” was revised to “I have had positive experiences with collecting research participant data,” since students interpreted the original item as them being a research participant rather than as them conducting research. The final item bank included 40 items, with 10 items per source.
Participants
The population for this study consisted of enrolled undergraduate and graduate students at a public research university in the Southern United States during the 2021–2022 and 2022–2023 school years. As part of a purposeful convenience sampling strategy, participants were solicited as either (a) part of a research pool in undergraduate introductory educational psychology courses, or an email list generated by the university Office of Institutional Research that contained (a) undergraduate students who had completed four semesters of coursework in a social science program that required a research course (to ensure that the students had time to participate in some aspect of research) and (b) graduate students enrolled in a research course. These criteria were chosen to survey students across a variety of research experiences and at various stages of their academic career to evaluate how the SRSE functions as it might be used in a typical university setting. Students in the educational psychology course received credit toward their course’s research participation requirement All participants could elect to enter a $20 gift card drawing.
Participants in the primary sample consisted of 514 students, both undergraduate (n = 388) and graduate (n = 126). A variety of disciplines were observed, with most students enrolled in education programs (42.6%), followed by social science (23.7%), health science (18.5%), humanities (6.0%), business (5.4%), STEM (2.3%), and undecided (1.4%). Eighty-two percent of students identified as female, 15.4% identified as male, and 2.2% identified as non-binary. The mean participant age was 21.86 years (SD = 5.95) for undergraduate students and 29.69 (SD = 10.19) for graduate students. Just under half of the participants reported being first-generation students (45.5%), which is slightly higher than the university average of 31%. Most participants identified as White (52.2%) or Black (32.6%), with fewer identifying as Latino (6.6%), Asian (5.2%), or another race (3.4%), which is mostly representative of the university’s student population. When reporting research experiences, the majority of students reported completing an in-class research project (66.5%) or working on a research paper (54.3%), with fewer students reporting experience working on a research team (16.0%), working in a research lab (12.6%), working as a research assistant to faculty (11.1%), submitting or publishing an article (9.7%), working on grant-funded research (8.2%), or presenting at a conference (8.8%). Some students reported no applied research experience whatsoever (9.5%).
Participants in the cross-validation sample consisted of 205 students (171 undergraduate and 34 graduate). Demographic characteristics closely paralleled the primary sample. Most participants identified as female (81.0%). Participants also primarily identified as White (49.3%) or Black (34.6%), with fewer identifying as Latino (8.3%), Asian (4.9%), or another race (2.9%). Slightly fewer than half of students reported being first-generation (48.8%). Chi-square tests suggested no significant differences based on demographics, with the exception of graduate status. The cross-validation sample included a smaller percentage of graduate students (16.6%) than the primary sample (24.5%), χ2 (719) = 5.32, p = .021.
Instruments
The survey consisted of 40 SRSE items, the Self-efficacy in Research Measure (SERM; Phillips & Russell, 1994), the Research Outcome Expectations Questionnaire (ROEQ; Bieschke, 2000), items about their current and prior research experiences, and demographic items covering age, gender, major, and first-generation status. The scales are described in the paragraphs below.
Sources of Research Self-Efficacy Scale
The Sources of Research Self-Efficacy Scale (SRSE) was piloted with 40 items, with 10 items measuring each of the 4 sources of self-efficacy. The scale measures an individual’s perceived capability of academic research from the perspective of self-efficacy sources. All items are rated on a 5-point Likert scale where respondents indicate the degree to which the item describes them, with anchor points of “Does not describe me,” “Describes me slightly well,” “Describes me moderately well,” “Describes me very well,” and “Describes me extremely well.” In the following paragraphs, we describe the subscales and how items were adapted to measure research self-efficacy. Internal consistency estimates and final subscale structure are reported in the results.
The Mastery Experiences subscale initially consisted of 10 items corresponding to past experiences of academic research. These items describe previous performance within certain areas of research and describe each respondent’s perception of their capability with those tasks. Examples included success when planning and enacting research (e.g., “I have always been successful when planning out research”), success with specific research tasks (e.g., “I have had positive experiences writing a research paper”), and general positive experiences when conducting research (“I receive good grades in classes that require me to engage in research”). Items were adapted by replacing content-specific words such as “science” and replacing them with “research.” For example, we modified “I have had positive experiences performing music in the past” (Zelenak, 2015) to “I have had positive experiences conducting research in the past.”
The Vicarious Experiences subscale initially included 10 items that describe vicarious experiences that relate to research. Specifically, this source pertains to the interaction and observation of others, and how that may have improved a respondents perceived self-capability for research. In this subscale, we do not differentiate between vicarious experiences from peers and vicarious experiences from adults; instead, this subscale measures vicarious research experiences from others generally (e.g., “Seeing others do well in research pushes me to do better in research”). Items were adapted by adjusting wording to reflect research activities. For example, “When I see how another student solves a math problem, I can picture myself solving the problem in the same way” (Usher & Pajares, 2008) became “When I see how another researcher conducts research, I can see myself conducting research in the same way.”
The Verbal and Social Persuasion subscale initially included 10 items that relate to the participant’s receipt of positive feedback or encouragement regarding research. Items in this subscale include statements that explore general encouragement (e.g., “People have told me I have a talent for research”) and statements that specifically focus on peer encouragement (e.g., “My peers admire me for my research ability”), teacher support (e.g., “My teachers have encouraged me by saying I’m good at research”), and feedback from research evaluations. As with the other subscales, we adapted items by replacing content-specific words such as “math” and “music” with research-specific words.
The Emotional and Physiological States subscale initially included 10 items that evaluate an individual’s source of affect in regarding to research. These items explored both positive and negative feelings and physiological responses that may arise when conducting research. Specifically, items inquired about positive and negative affect such as the stress research assignments may induce, whether research is considered enjoyable by the respondent, and if research tasks have made the respondent feel negative emotions, such as confusion or stress. Similar to Bike (2013) and Lent et al. (2017), we included both negative- and positive-affect items and included models that items split the affect scale into two distinct subscales. The six negative affect items were reverse coded prior to analysis.
Research Outcome Expectations Questions
The Research Outcome Expectations Questionnaire (ROEQ) consists of eight items that measure a single factor of research outcome expectancy (Bieschke, 2000). The items measure students’ perception of research outcome expectations, including outcomes related to career (e.g., “Involvement in research will enhance my job/career opportunities”), personal enrichment (e.g., “Research involvement will lead to a sense of satisfaction”), and the research field (e.g., “My involvement in research will lead to meaningful contributions to the field”). The ROEQ utilizes a five-point Likert scale, with anchors ranging from “Strongly Disagree” to “Strongly Agree.” The internal consistency of the ROEQ as used in our study was excellent (ω = .94).
The Self-Efficacy in Research Measure
The Self-Efficacy in Research Measure (SERM; Phillips & Russell, 1994) consists of 33 items that measure self-efficacy in specific research tasks. Items are measured on a 10-point scale. Respondents are asked to indicate their degree of confidence in their ability to successfully complete a task, ranging from “no confidence” (a score of “0”) to “complete confidence” (a score of “9”). The scale was conceptualized to measure four subscales of research tasks: (a) research design skills (8 items; e.g., “Selecting a suitable topic for study”), (b) quantitative computing skills (8 items; e.g., “Using simple statistics e.g., t test, ANOVA, correlation, etc.”), (c) writing skills (9 items; e.g., “Writing a research presentation for a conference”), and (d) practical research skills (8 items; e.g., “Making time for research”). Total scale reliability as used in our study was excellent (ω = .96), as was subscale reliability (.84 ≤ ω ≤ .93).
Analysis
To address evidence for internal structure, we applied confirmatory factor analysis (CFA) using Mplus Version 8.0 (Muthén & Muthén, 1998-2017). We selected CFA over exploratory factor analysis (EFA) because our main purpose was to test the theorized structure of source-based items that had previously been used in other settings and adapted to the domain of research. For all models, we used weighted-least squares multivariate (WLSMV) estimation, treating the SRSE items as categorical. Model fit was evaluated by the root-mean square error of approximation (RMSEA), comparative fit index (CFI), Tucker–Lewis Index (TLI), and weighted-root mean square residual (WRMR), according to standard SEM practice (Hu & Bentler, 1999; Steiger, 2007).
Using the primary sample, we estimated a 1-factor 40-item unidimensional model (Model 1) for baseline comparison and then fit a 4-factor 40-item theoretical model (Model 2) with items grouped according to the four sources of self-efficacy. Lastly, we fit a 5-factor 40-item theoretical model (Model 3), splitting the Emotional States construct to distinguish between positive and negative emotional states, similar to Bike (2013) and Lent et al. (2017). We evaluated the item factor loadings and R2 values, sequentially removing items with low loadings (λ < .40). We then reviewed the items for theoretical uniqueness, removing those with theoretical redundancy (e.g., “My teachers believe I conduct research well” was theoretically similar to “My teachers have encouraged me by saying I’m good at research”) and items with theoretical connections relate to other sources (e.g., “I have tried to improve my research skills whenever possible” could theoretically relate to vicarious experiences as well as mastery experiences.). Finally, we removed some items until the scale had twenty-four items with four or five items per source. Following the revision, we then fit two confirmatory factor analysis models (Figure 1) to the revised SRSE: a 4-factor 20-item model (Model 4) with positive and negative affect items combined into a single Emotional States construct and a 5-factor theoretical 24-item model (Model 5) with separate latent constructs for positive and negative Emotional States items. Using the cross-validation sample, we again estimated Models 4 and 5 to assess which model structure should be adopted for scoring purposes. Conceptual representation of (a) the four-factor model with combined emotional states factor and (b) the five-factor model with separate positive and negative emotional states factors.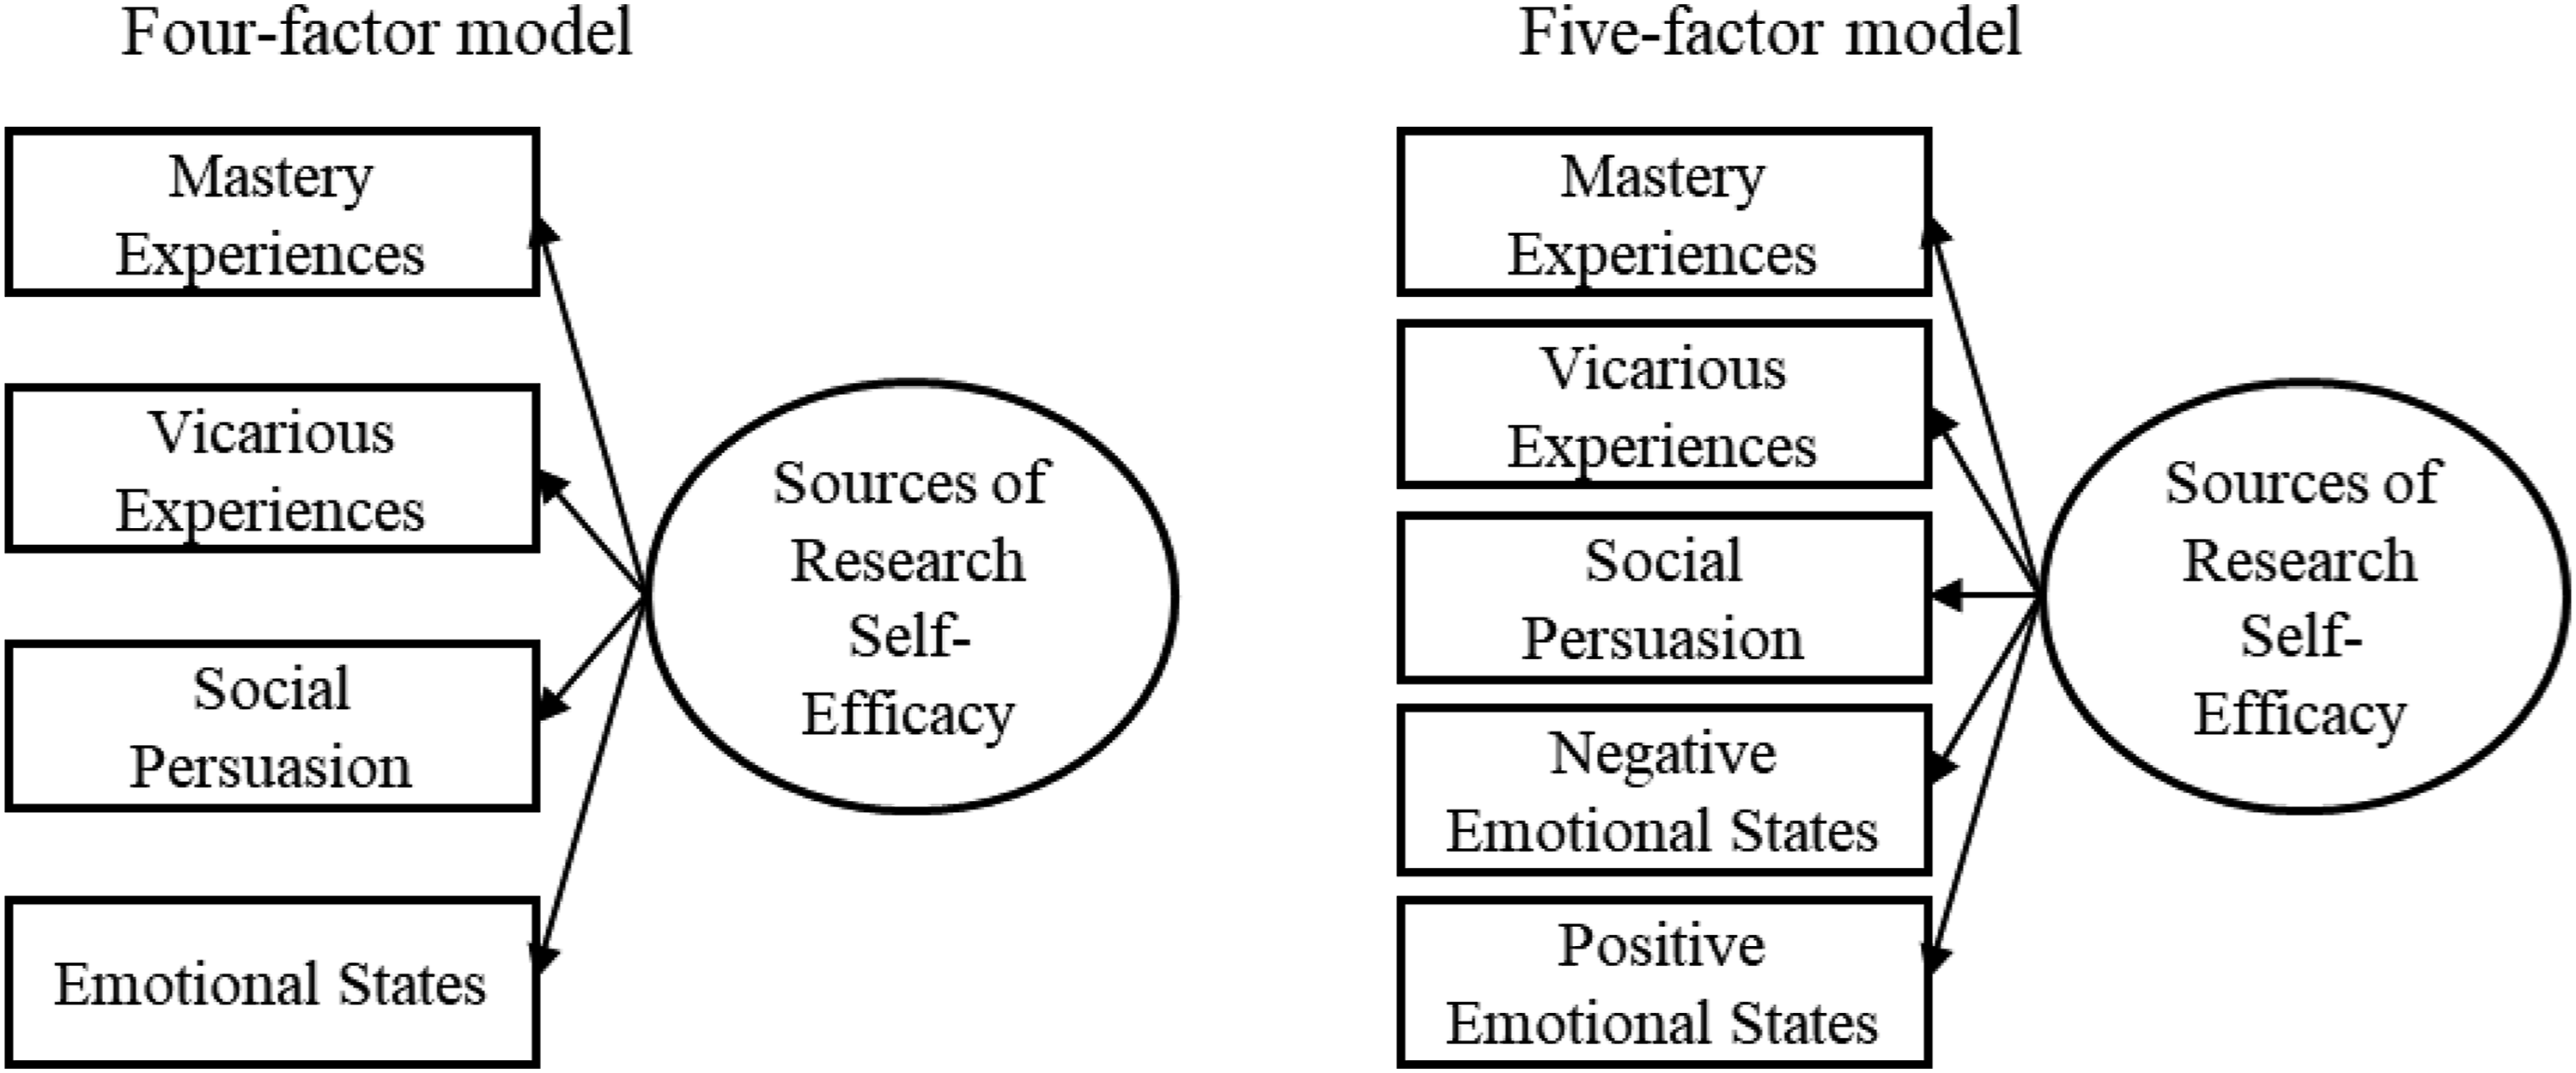
Finally, to better explore the multidimensional structure of the scale, we applied a bifactor model with a general sources factor to the 24-item scale. To address evidence for reliability of scores, we calculated McDonald’s ω (Dunn et al., 2014) estimates to assess internal consistency for the full scale as well as each individual subscale. We then calculated the model-based reliability indices of omega, omega hierarchical (omegaH; McDonald, 1999), and omega for each subscale (omegaS). In particular, omegaH indicates the percent of variance of the unit-weighted total scores can be attributed to the general factor. When omegaH values are large (>.80), a unidimensional interpretation of the scale may be most appropriate (Reise et al., 2023). To address evidence for relationship with other variables, we calculated Pearson correlations among the SRSE, the SERM (including its subscales), and the ROEQ.
Results
Missing Data Analyses
Of the 568 participants who began the SRSE, we removed the 29 respondents who exited the survey prior to completing the SRSE. For the 40-item SRSE survey (Models 1–3), a missing value analysis indicated that 37 of the 538 completed surveys included missing responses, which was .02% of the SRSE data as a whole. Of these participants, 31 were missing a single-item response across subscales (Emotional States: 7; Mastery Experiences: 11; Social Persuasion: 6; Vicarious Experiences: 7), three (<1%) were missing two item responses (from Mastery Experiences and Vicarious Experiences), and two (<1%) were missing three item responses (from Vicarious Experiences, Emotional States, and Mastery Experiences). Little’s missing completely at random test suggested that the data were not missing completely at random (χ2(1239), p = .001). For the 24-item SRSE survey (Models 4–5), this was also the case for both the primary (χ2(492), p < .001) and cross-validation samples (χ2(129), p < .001). As the missing responses comprised less than 1% of the item-level data for both samples, we used a pairwise present approach, the default missing data procedure for WLSMV in MPlus, to use all possible available data in model estimation. This resulted in a sample size of 502 for the 40-item CFA models and 514 for the 24-item CFA models using the primary sample, and 205 for 24-item CFA models using the cross-validation sample.
For the correlational analysis, we removed 24 participants from the primary sample who were missing more than 50% of the ROEQ or the SERM scales. Of the remaining 514 participants, 11 (2.14%) were missing one item on the SERM while 8 (1.56%) were missing one item on the ROEQ, which was .09% of the SERM and ROEQ data as a whole. As the missing responses comprised less than 1% of the data, we used prorated mean scale scores for those 11 participants by averaging the available items.
Evidence for Internal Structure
Goodness of Fit Indices for SRSE Models.
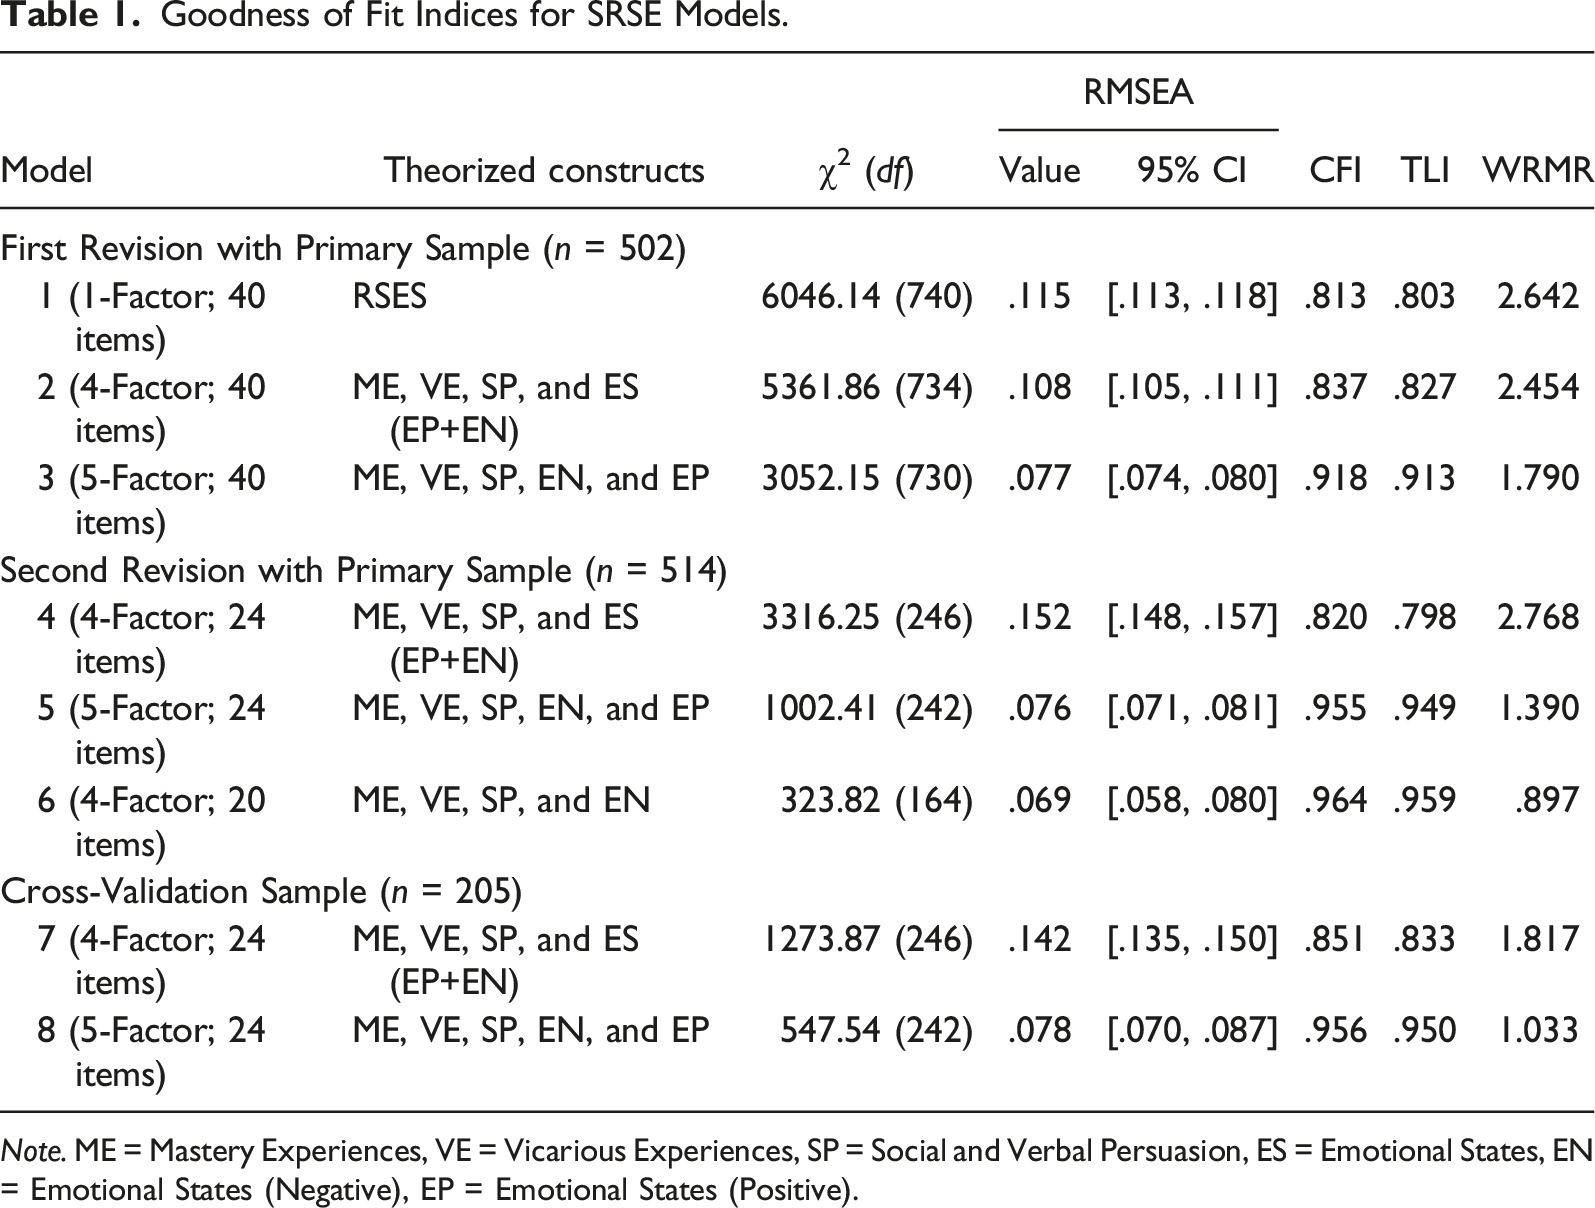
Note. ME = Mastery Experiences, VE = Vicarious Experiences, SP = Social and Verbal Persuasion, ES = Emotional States, EN = Emotional States (Negative), EP = Emotional States (Positive).
Across all models, two items (ES7: “I worry about making major mistakes while working on research” and V2: “My family members are good resources for me when I have a question about research”) had poor loadings (λ < .40). After removing these problematic items, fit improved slightly for all models but was still below optimal. To achieve balance in the subscales, we then evaluated items in the other three scales and removed redundant items or items with ambiguous theoretical alignment across subscales. Specifically, four items from the Mastery scale, four items from the Vicarious Experiences scale, five items from the Social Persuasion scale, and one item from the Emotional States scale were removed resulting in a 24-item SRSE (Mastery Experiences: 5 items; Vicarious Experiences: 5 items; Social Persuasion: 5 items; Negative Emotional States: 5-items; Positive Emotional States: 4-items).
SRSE Standardized Factor Loadings for Model 5 (24-Item) for Primary (n = 514) and Cross-Validation Samples (n = 205).
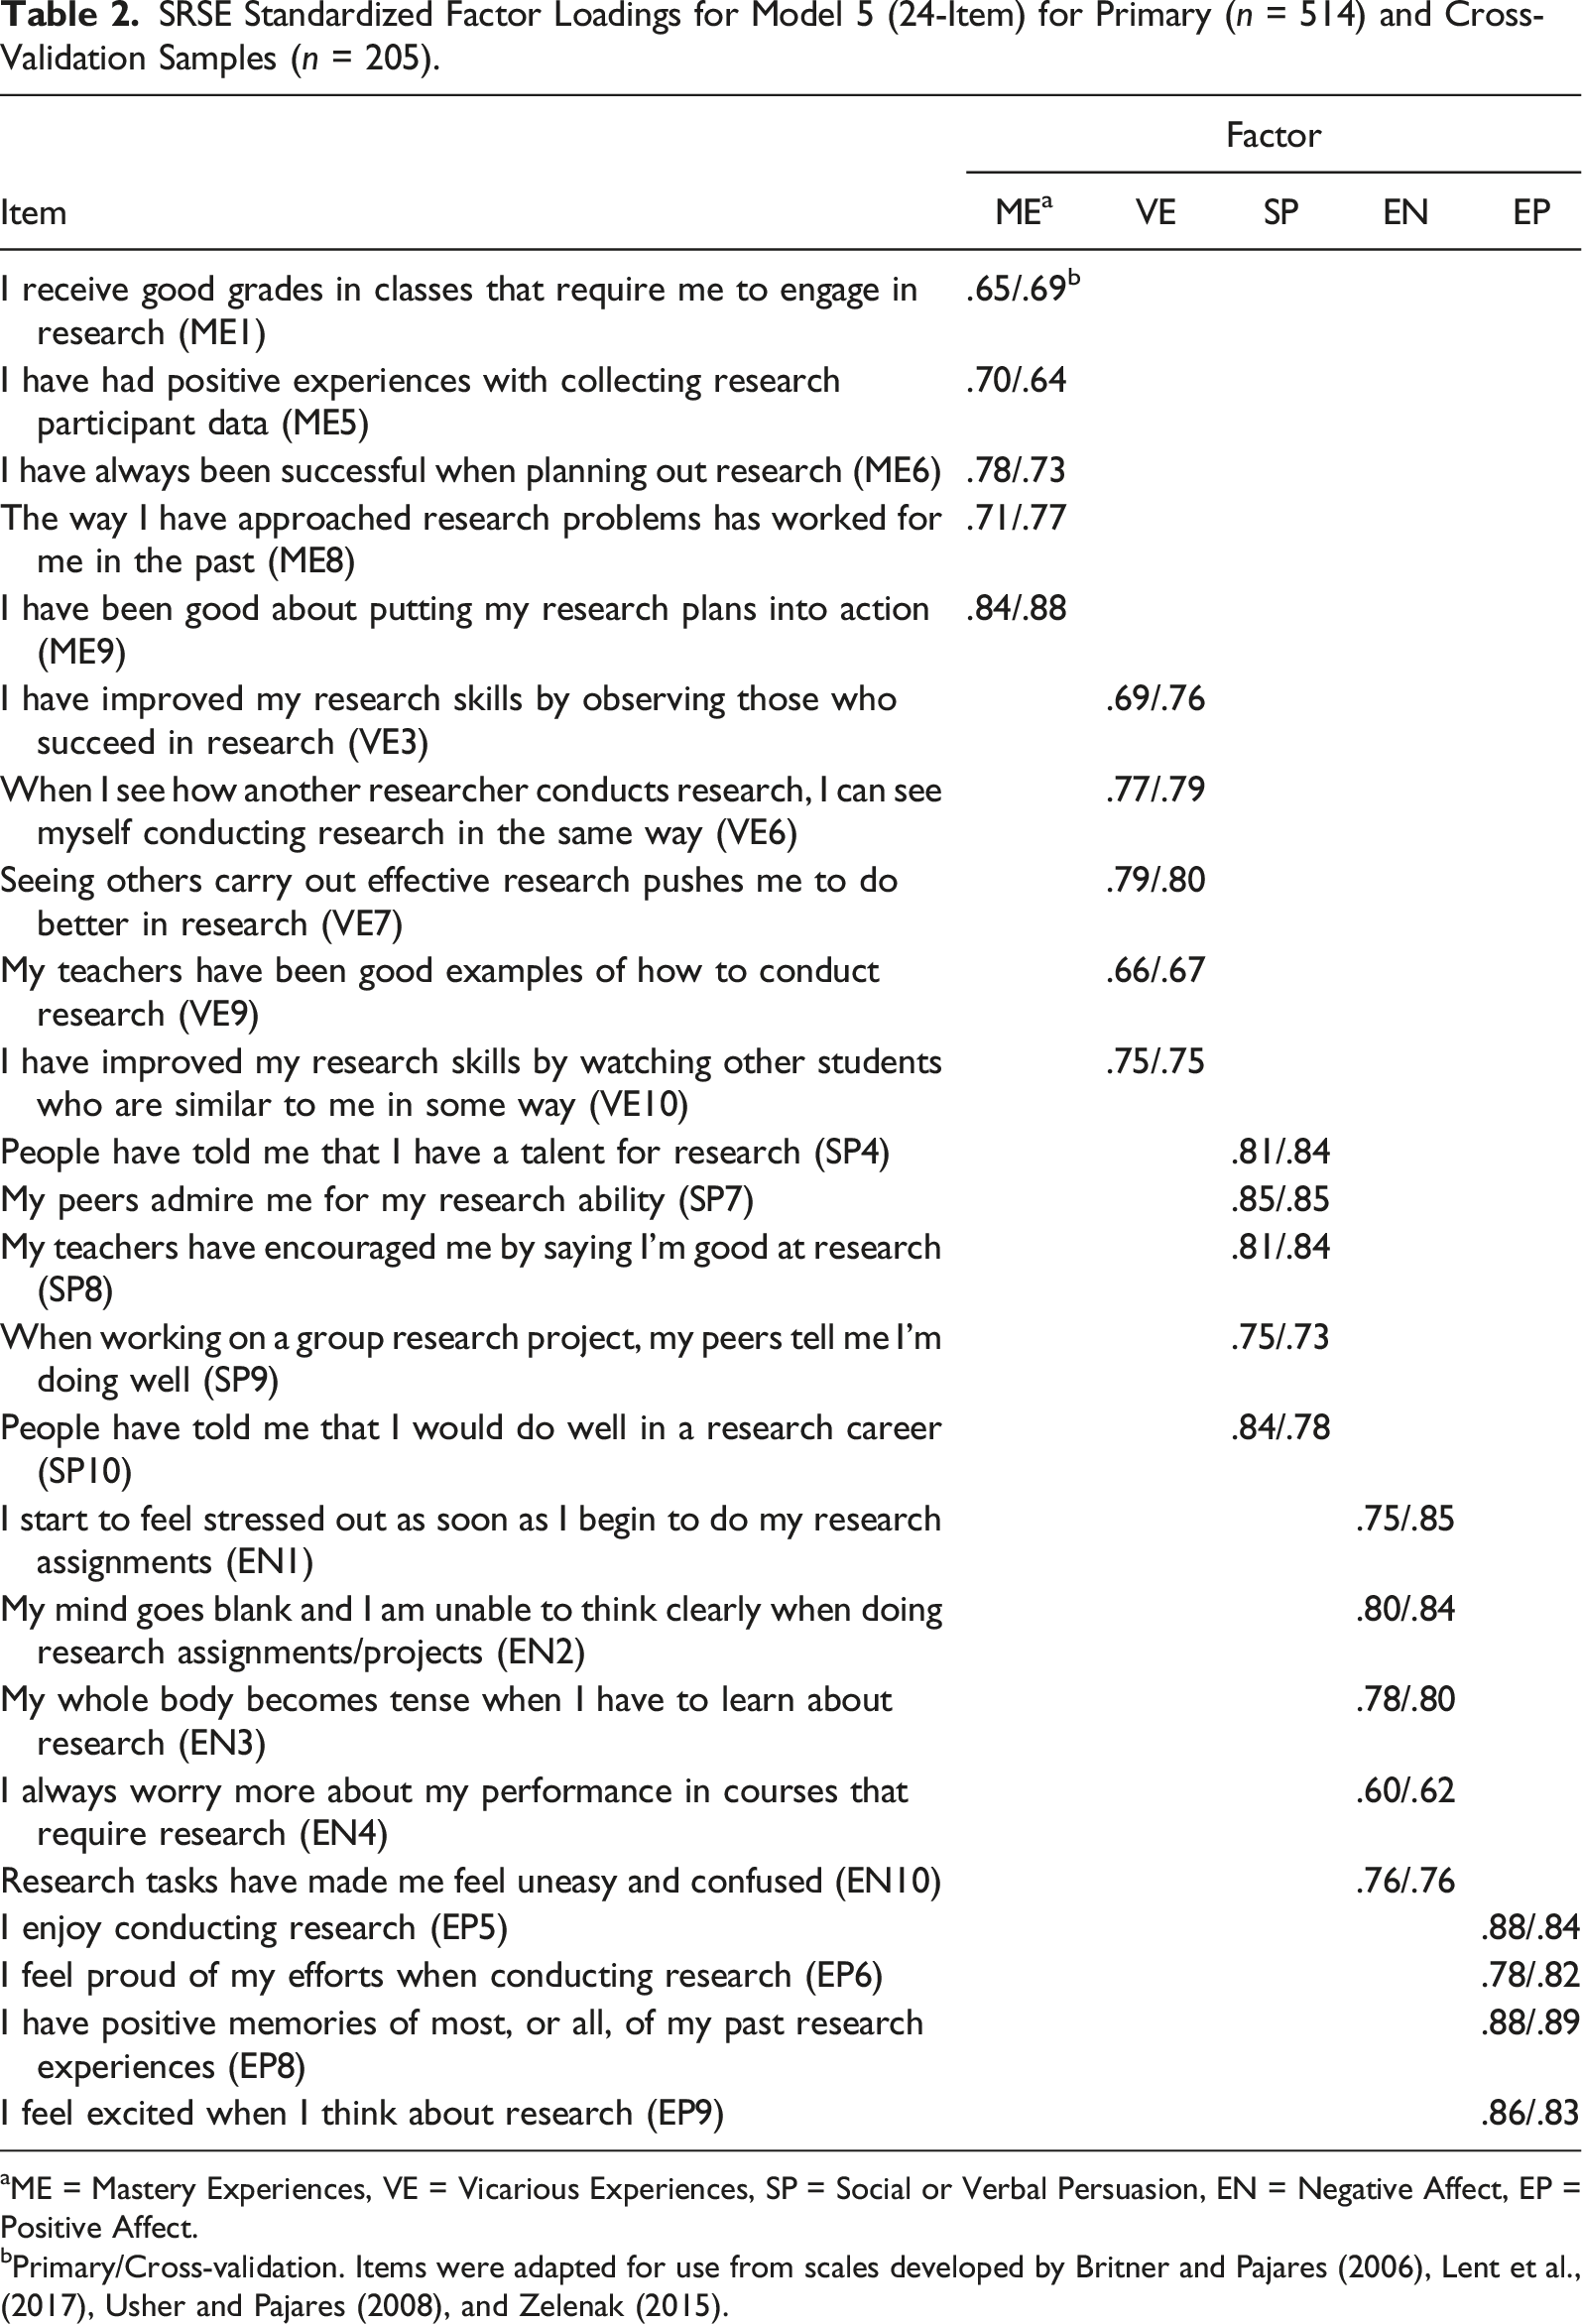
aME = Mastery Experiences, VE = Vicarious Experiences, SP = Social or Verbal Persuasion, EN = Negative Affect, EP = Positive Affect.
bPrimary/Cross-validation. Items were adapted for use from scales developed by Britner and Pajares (2006), Lent et al., (2017), Usher and Pajares (2008), and Zelenak (2015).
The bifactor model showed a good fit (χ2(218) = 382.60; RMSEA = .06; CI95: .05, .07; CFI = .976; TLI = .970; WRMR = .074). The omegaH for the general factor was low (omegaH = .32), indicating that only 35% of the variance in the total scores was attributed to the general factor. The omegaH values for the subscales were .10 (Mastery Experiences and Positive Emotional States), .11 (Vicarious Experiences), .14 (Negative Emotional States), and .16 (Social Persuasion), suggesting that subscales accounted for between 10% and 16% of the variance in the total score each, for 65% of the total variance combined. Taken together, these estimates do not support the interpretation of the SRSE as a unidimensional construct.
SRSE Standardized Factor Loadings for Model 6 (20-Item) for Primary (n = 514) and Cross-Validation Samples (n = 205).
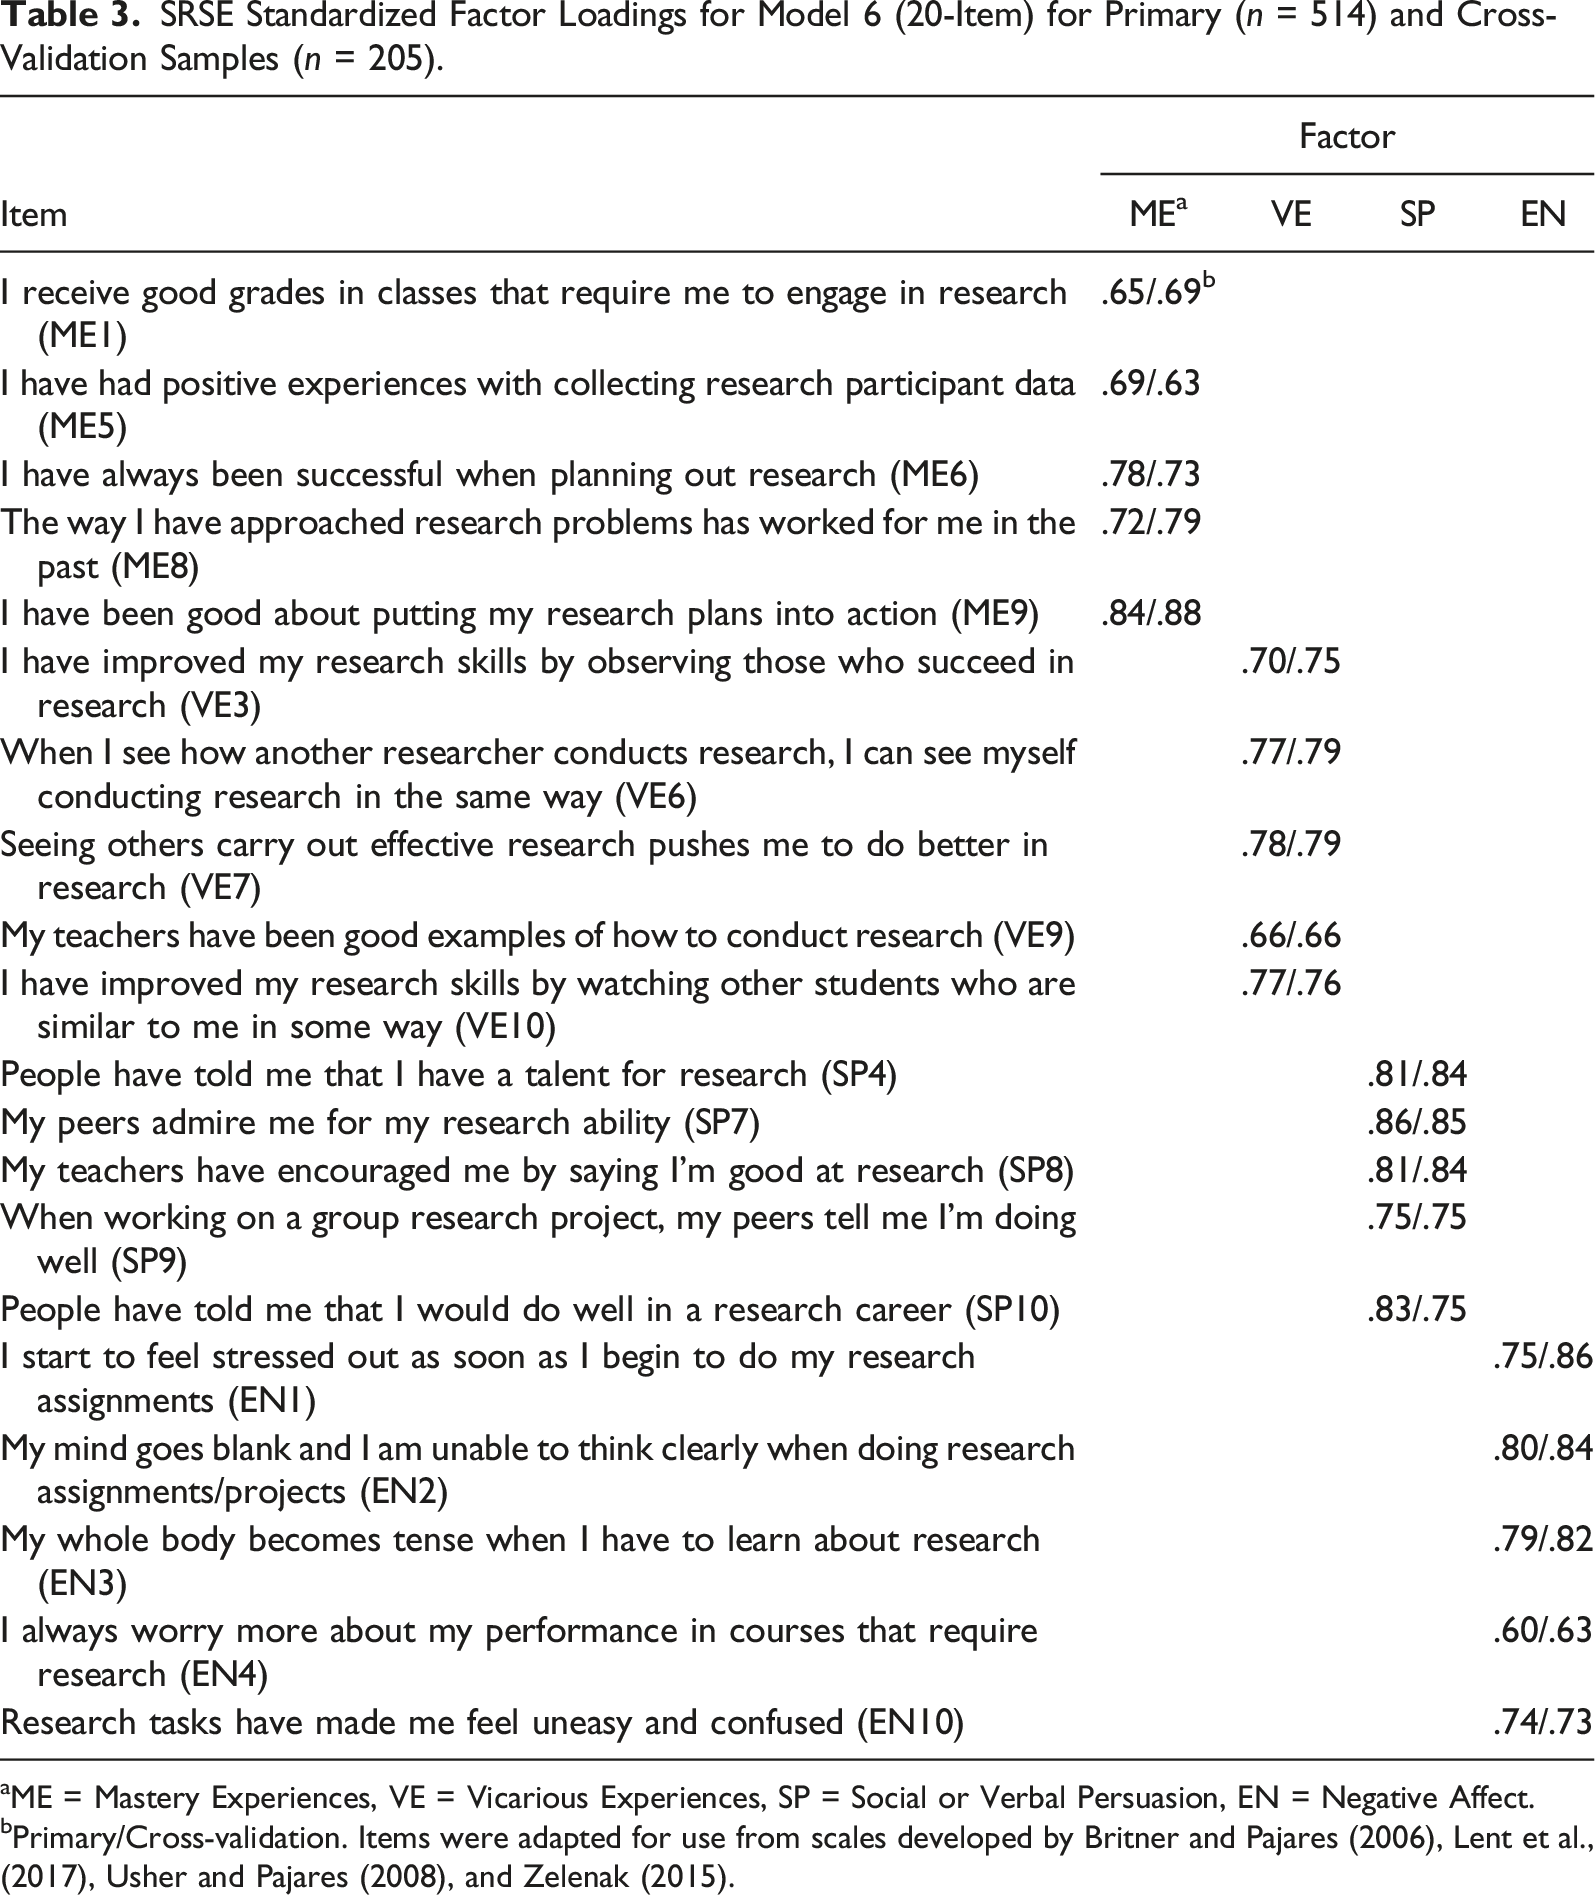
aME = Mastery Experiences, VE = Vicarious Experiences, SP = Social or Verbal Persuasion, EN = Negative Affect.
bPrimary/Cross-validation. Items were adapted for use from scales developed by Britner and Pajares (2006), Lent et al., (2017), Usher and Pajares (2008), and Zelenak (2015).
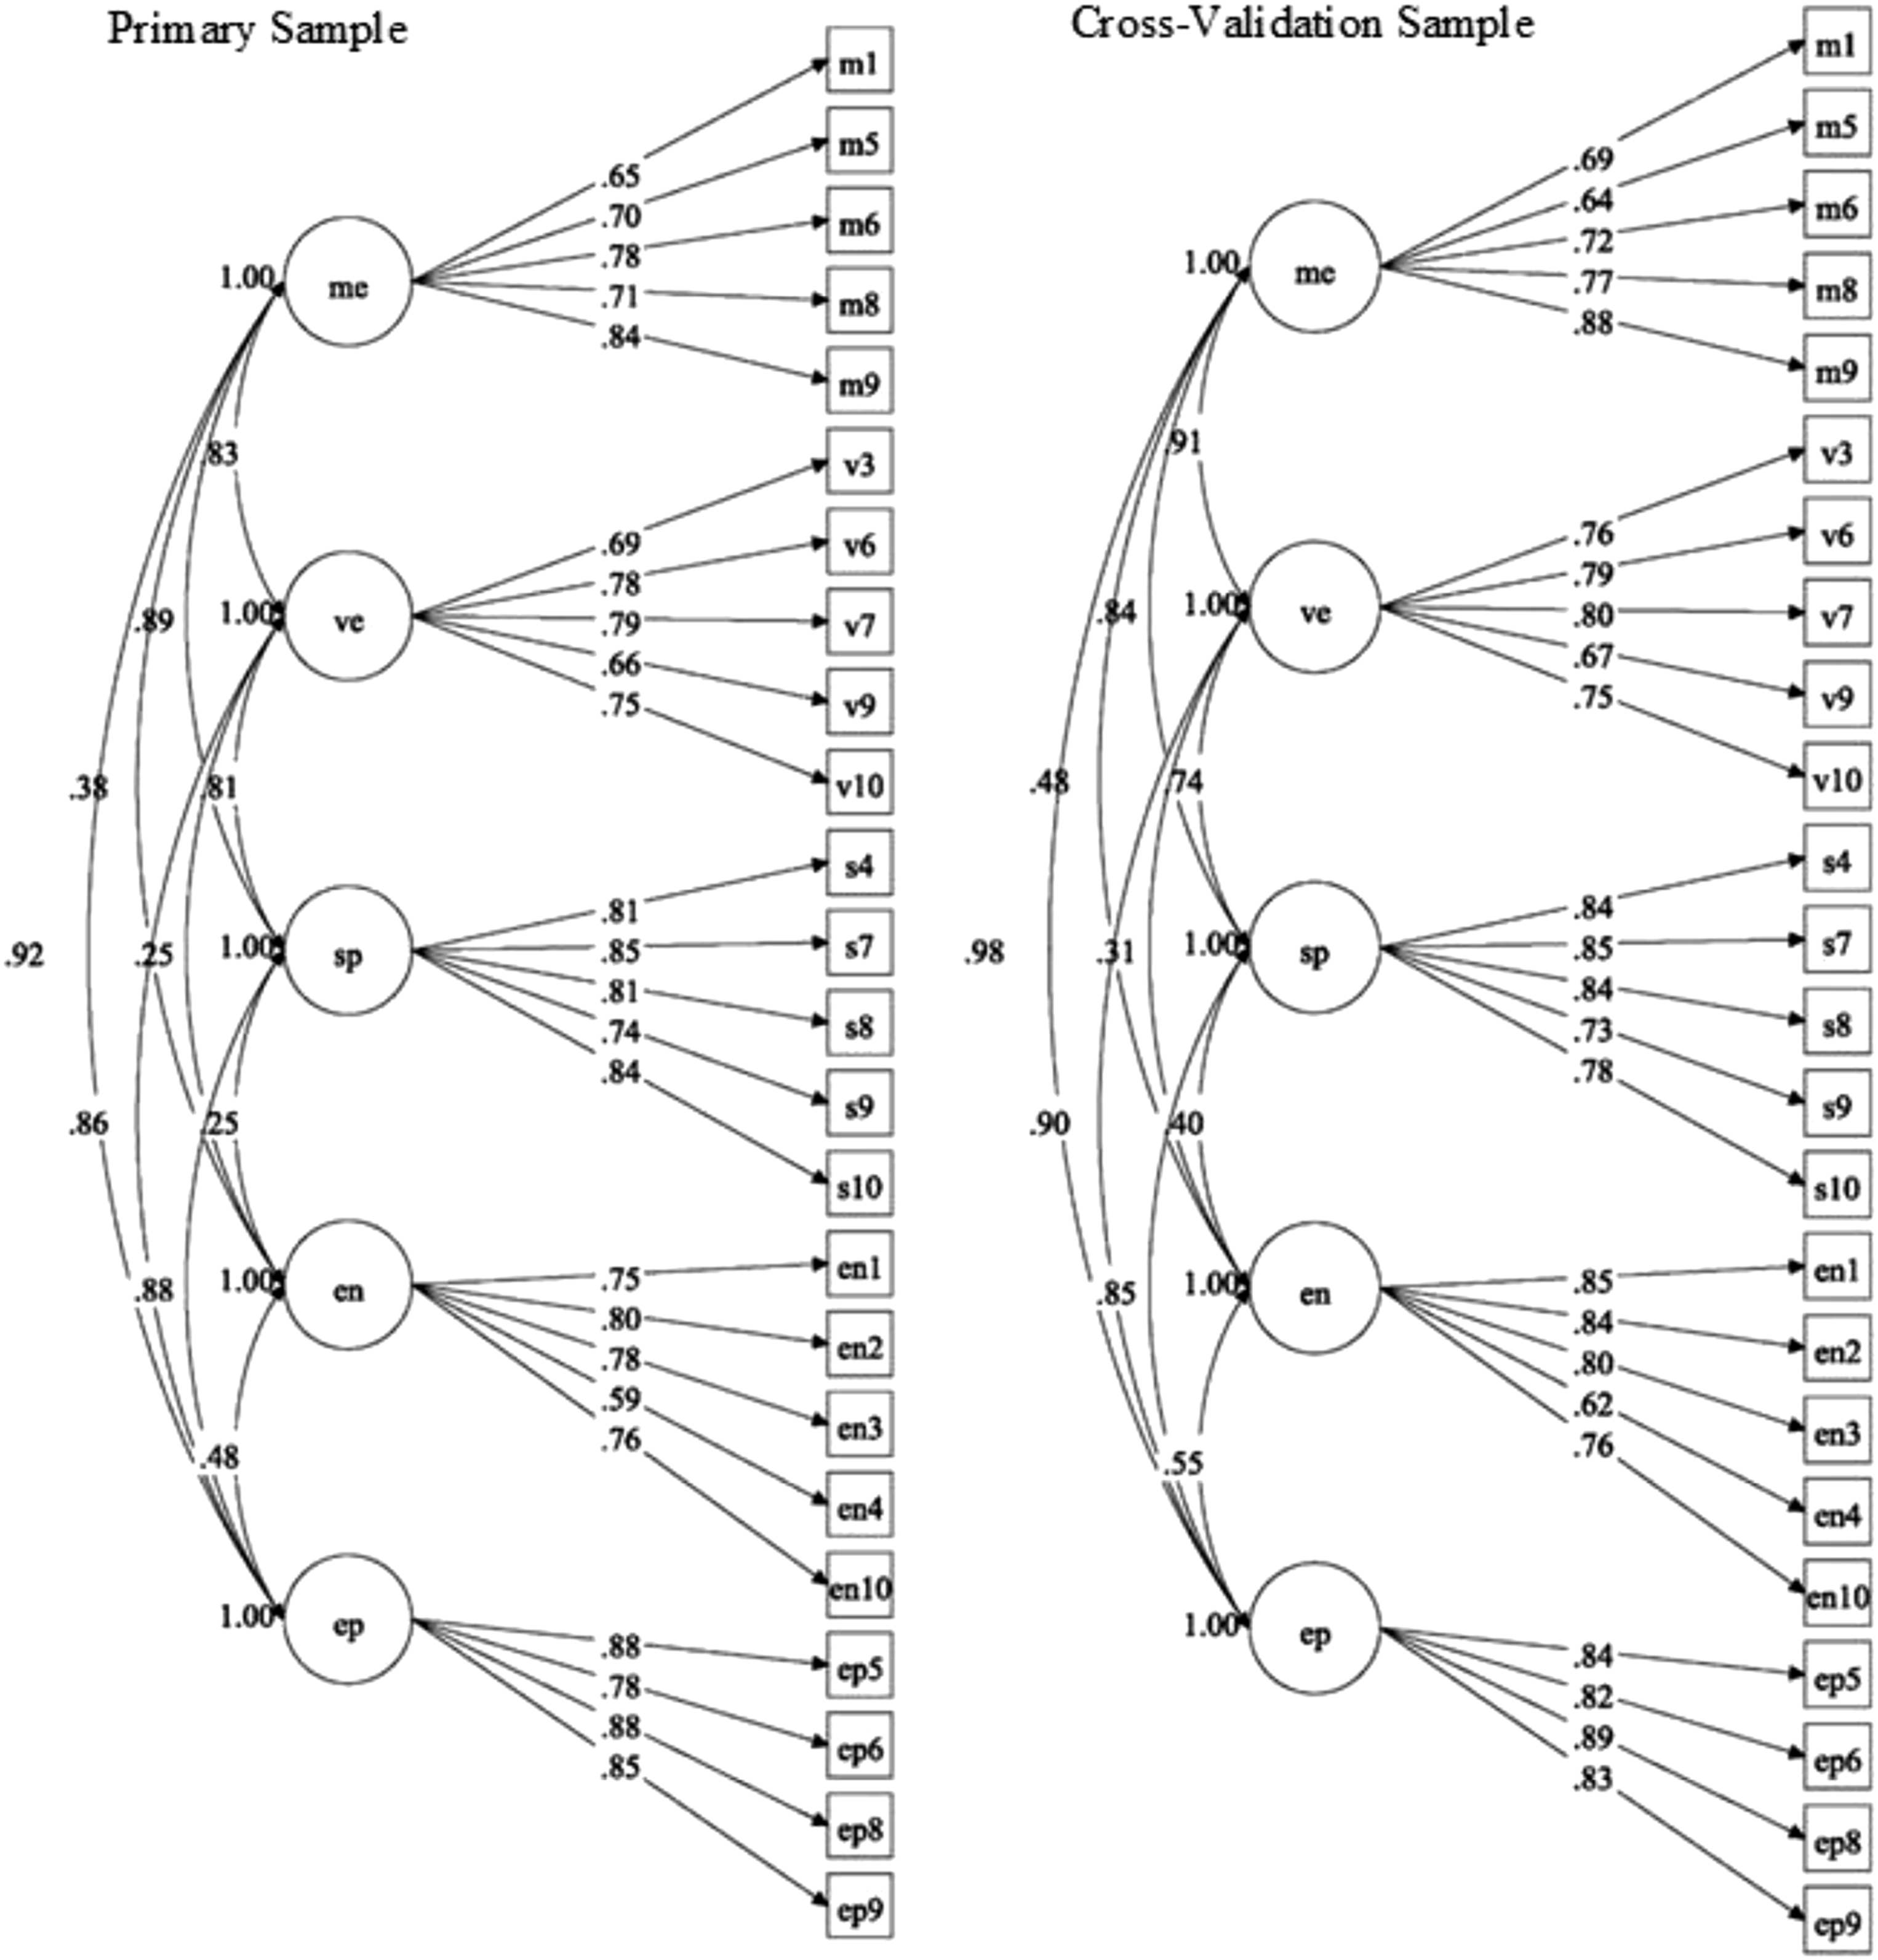
Standardized structural model of 24-item SRSE (Model 5) for primary and cross-validation samples. (a) Primary Sample. (b) Cross-Validation Sample.
Evidence for Reliability
Internal consistency for the total score for the 24-item scale was good in the primary sample (ω = .93). Similarly, internal consistency estimates for scores from the Mastery Experiences (ω = .83), Vicarious Experiences (ω = .83), Social Persuasion (ω = .87), Negative Emotional States (ω = .82), and Positive Emotional States (ω = .87) subscales were also good. When accounting for the variance of the general factor, omegaS values were .70 for Mastery Experiences subscale scores, .70 for Vicarious Experiences subscale scores, .86 for Social Persuasion subscale scores, and .87 for Negative Emotional States subscale scores, suggesting acceptable reliability.
Evidence for Relationship with Other Variables
Pearson Bivariate Correlations Among 5-Factor Mean SRSE Subscale Scores (Model 5), SERM Subscale Scores, and ROEQ Scores for the Primary Sample (N = 514).
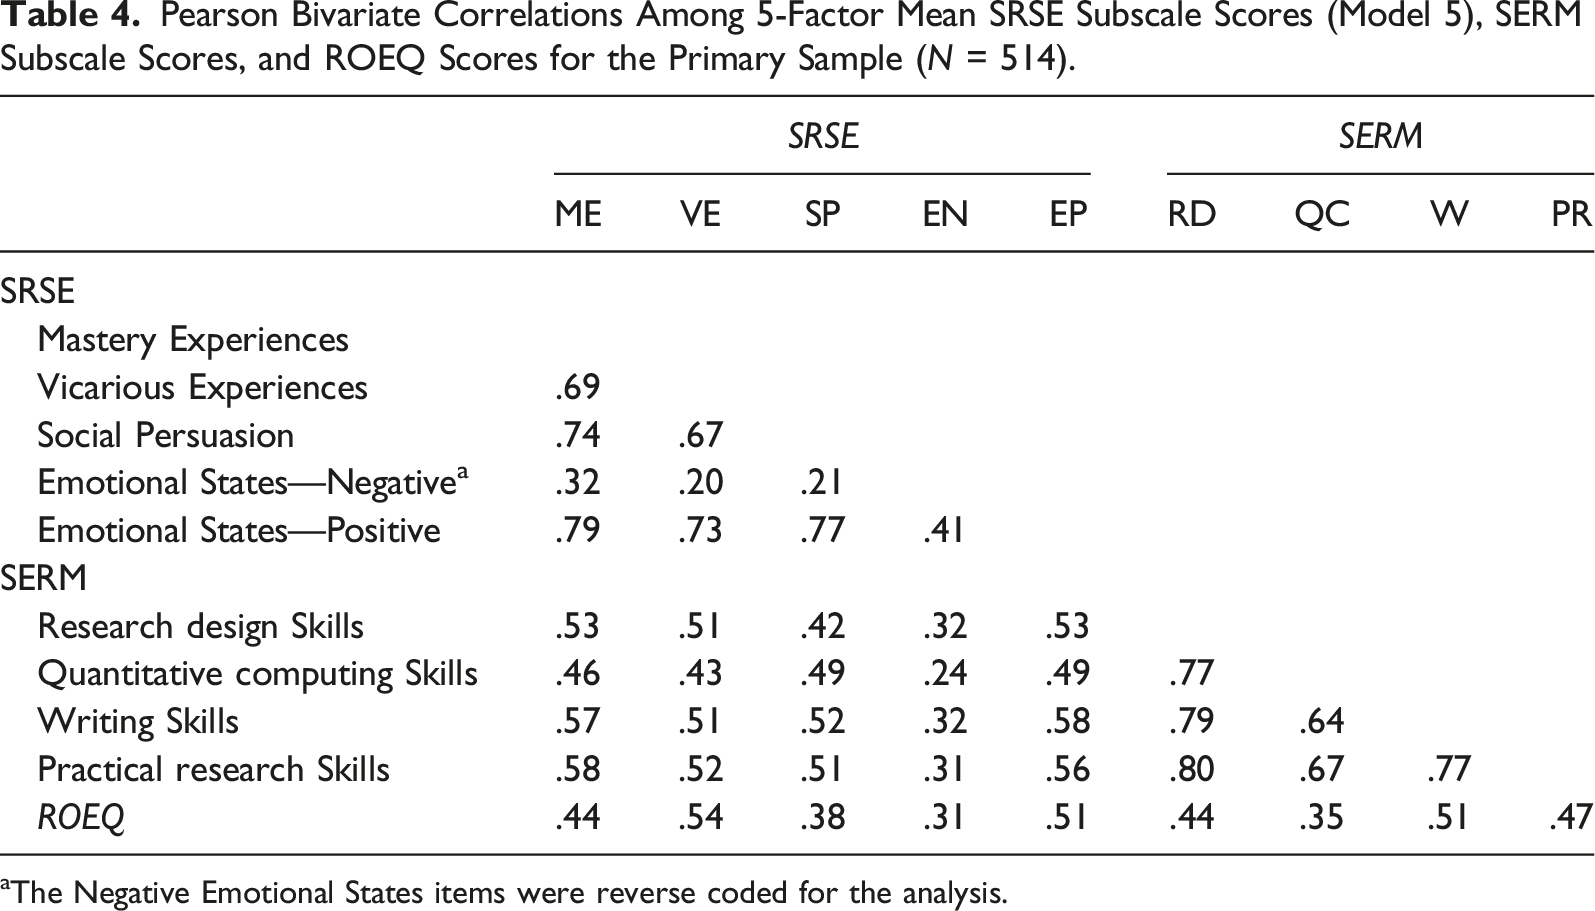
aThe Negative Emotional States items were reverse coded for the analysis.
Discussion
Summary of Findings
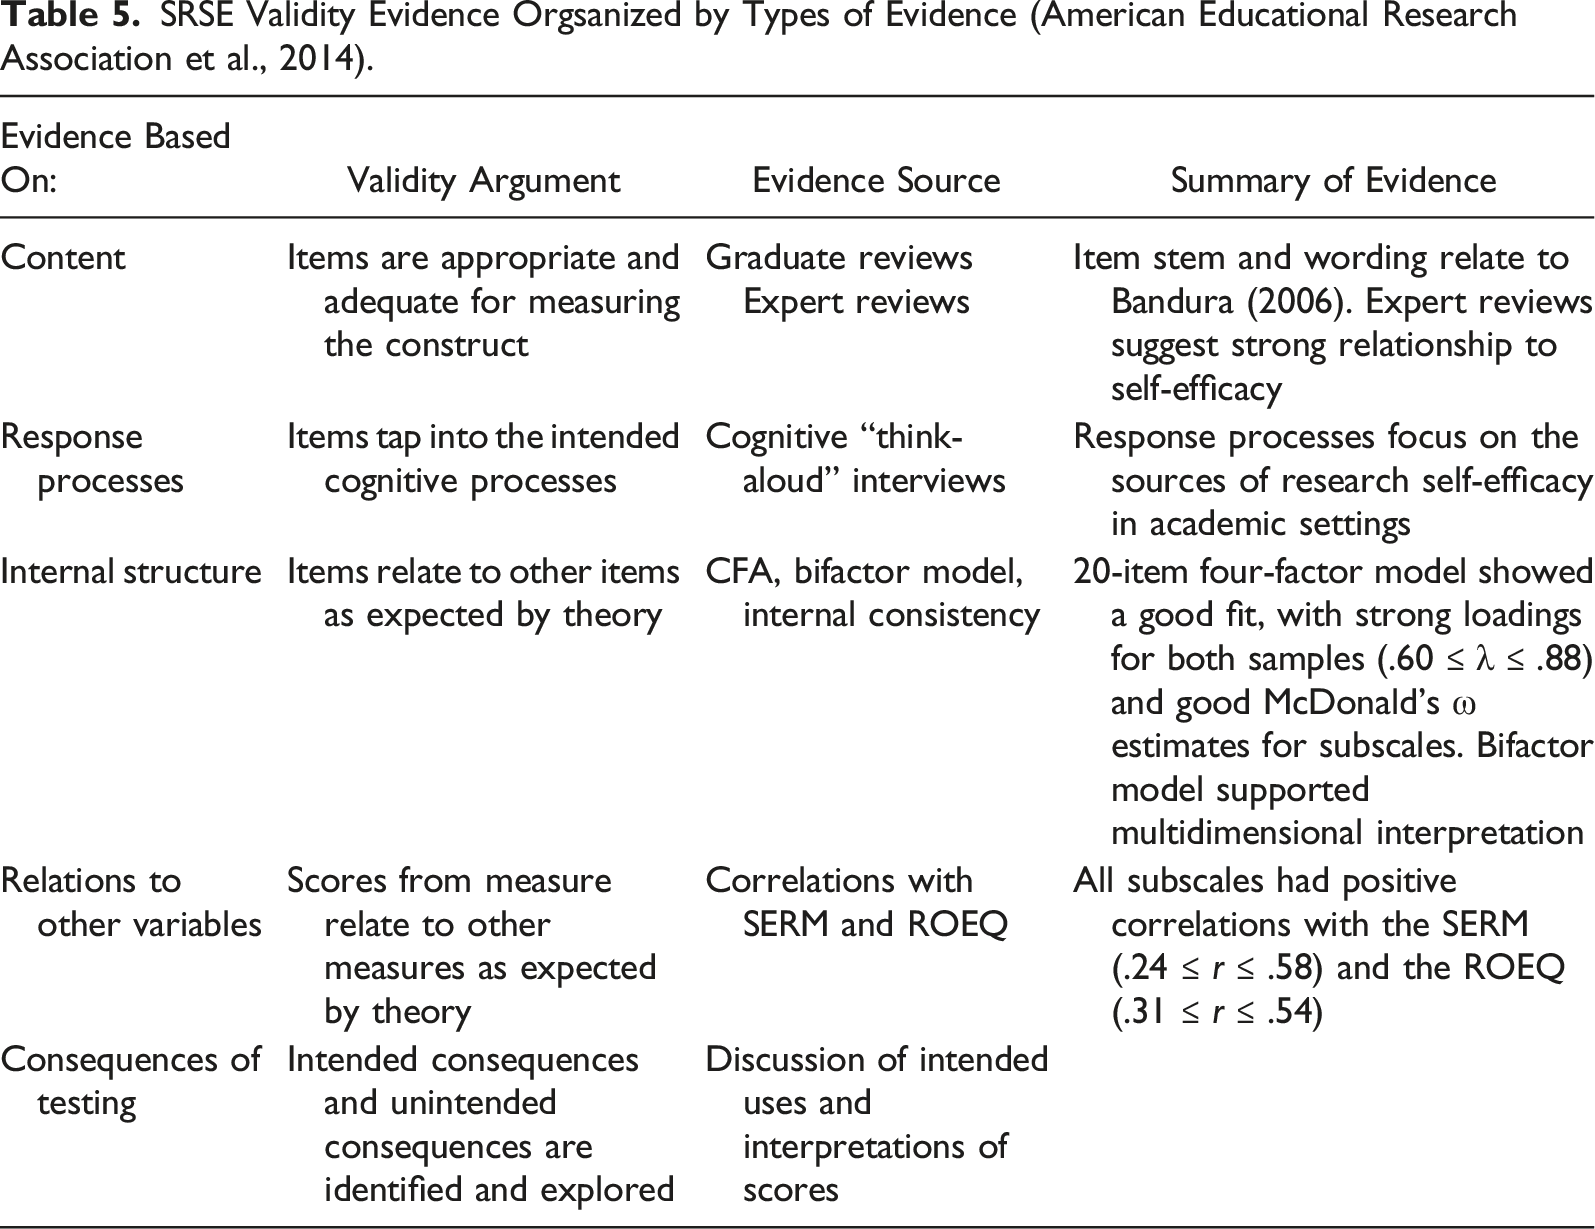
SRSE Validity Evidence Orgsanized by Types of Evidence (American Educational Research Association et al., 2014).
The SRSE subscale scores also show strong association between global research self-efficacy scores (as measured by previous research self-efficacy scales) and research outcome expectancy scores, which aligns with the findings of previous studies (Johnson, 2005; Jones et al., 2022; Litson et al., 2021). The more learning experiences students report as experiencing from the distinct sources (the less exposure for negative affect), the higher their research self-efficacy for specific research tasks and research outcome expectancy is likely to be (Usher & Pajares, 2008). This relationship suggests that the SRSE may be useful for researchers to follow SCCT theory more precisely in their work. As suggested by SCCT, the SRSE supports the assertion that the sources of self-efficacy directly influence not only a person’s self-efficacy but also their outcome expectancy (Lent et al., 2002). Our results suggest that the SRSE may provide a good quality measure of these learning experiences.
Measurement Implications
Sources of Research Self-Efficacy scores are intended to be used at the subscale level. The Mastery Experiences subscale captures a range of research-related tasks performed across undergraduate and graduate studies. The Vicarious Experiences subscale reflects modeled research experiences through which students can gauge their self-perceived ability. The Social Persuasion subscale measures a student’s perception of verbal encouragement or lack thereof regarding research endeavors. Finally, the Negative emotional states subscale reflects a student’s negative emotions regarding research activities. Hence, the subscale scores may offer a complementary view of the origins of a student’s research self-efficacy when compared with existing research self-efficacy measures. As such, the SRSE subscales serve as an important measure of the learning experiences that have influenced a student as they progress on the academic journey.
The SRSE instrument also serves as a step toward better understanding the sources of self-efficacy in the academic research context. Our findings support the measurement of self-efficacy sources as theorized by Bandura (1977) and as measured in other contexts such as mathematics (Usher & Pajares, 2008) and career exploration (Lent et al., 2017).
Limitations
Although we employed a purposeful sampling plan to reach targeted students who likely already had some research experiences at their university, participation was voluntary. It is possible that the nature of the convenience sample encouraged self-selection bias, in that students with the most interest or with mostly positive experiences with research might have participated. Conversely, our results may also have been affected due to the survey counting toward fulfillment of a course requirement for some students. Additionally, the study was conducted in a university with a sizable first-generation undergraduate population with several programs available to support these students, which might have impacted the type of support the students in our sample experienced in finding and participating in research-related activities at the university.
Future Research
Additional research is needed to explore how the SRSE functions across different student populations, including first-generation students and other students traditionally underserved in research fields. Additionally, as the current study was conducted at a public, urban research university and specifically targeted undergraduate students in social science programs with research requirements, the instrument should also be examined with undergraduate students attending teaching-oriented schools. The validity argument surrounding the consequences of testing and fairness would be bolstered by exploration of differential item analysis across student type and context such as first-generation versus continuing generation students, students in social science versus STEM majors, undergraduate versus graduate students, student gender, and teaching-oriented institutions versus research institutions (Joët et al., 2011; Usher & Pajares, 2008).
Conclusion
In summary, the body of evidence presented in this paper begins to form a validity argument supporting the use of the SRSE in university settings. The SRSE provides a good quality measure of the sources of research self-efficacy, with subscales representing Mastery Experiences, Vicarious Experiences, Social Persuasion, and Negative Affect. Given the focus of multiple learning experiences of the SRSE in comparison to research self-efficacy instruments that focus solely on mastery experiences, the SRSE could uniquely contribute to the literature based on research self-efficacy. The SRSE could also provide universities a tool to better understand students’ development as they participate in research activities. With its alignment with SCCT, the SRSE may also afford a clearer picture of college students’ research development across their career trajectory.
Supplemental Material
Supplemental Material - Development and Validation of the Sources of Research Self-Efficacy Scale
Supplemental Material for Examining the Development and Validation of the Sources of Research Self-Efficacy Scale by Eli A. Jones, Justine Piontek, Luke C. Walden, and Leigh M. Harrell-Williams in Journal of Psychoeducational Assessment.
Footnotes
Declaration of Conflicting Interests
The author(s) declared no potential conflicts of interest with respect to the research, authorship, and/or publication of this article.
Funding
The author(s) disclosed receipt of the following financial support for the research, authorship, and/or publication of this article: This work was supported in full or in part by a grant from The University of Memphis College of Education Faculty Research Grant Fund.
Supplemental Material
Supplemental material for this article is available online.
References
Supplementary Material
Please find the following supplemental material available below.
For Open Access articles published under a Creative Commons License, all supplemental material carries the same license as the article it is associated with.
For non-Open Access articles published, all supplemental material carries a non-exclusive license, and permission requests for re-use of supplemental material or any part of supplemental material shall be sent directly to the copyright owner as specified in the copyright notice associated with the article.