
Abstract
A better understanding of how distractor features influence the plausibility of distractors is essential for an efficient multiple-choice (MC) item construction in educational assessment. The plausibility of distractors has a major influence on the psychometric characteristics of MC items. Our analysis utilizes the nominal categories model to investigate German fourth graders' (N = 924) selection of response options in a German MC Vocabulary test. We used principles from cognitive psychology to identify relevant option features capturing the option’s potential to distract students from the correct answer. The results show that only a few option characteristics explain option choice behavior to a large extent. Options with distracting features (i.e., semantic relatedness and orthographic similarity) increase the item difficulty and discrimination, whereas distractors that are less synonym than the attractor decrease item discrimination. Implications for test score interpretations and item construction guidelines are highlighted.
Multiple-choice (MC) items are most effective when they have plausible but incorrect options (Gierl et al., 2017; Haladyna, 2004). However, the construction of plausible but incorrect options is often a great challenge due to the lack of a systematic method (Shin et al., 2019) and an evidence-based task model that incorporate the cognitive principles underlying the verification and falsification of options (e.g., Gorin, 2005). Embretson and Gorin (2001) emphasize how principles from cognitive psychology can improve construct definitions, test score interpretations, and item generation. Several studies developed task models based on cognitive theory that allow a systematic generation of options and items. For example, in abstract reasoning (e.g., Embretson, 1999), analogical reasoning (Stevenson et al., 2013), quantitative domains (Deane et al., 2005), or reading comprehension (Gorin, 2005). However, there are few studies on the cognitive principles underlying MC synonym vocabulary tests.
First language (L1) vocabulary knowledge is part of large-scale educational assessments (e.g., in German: Ludewig et al., 2022c), essential for language-related research (e.g., Kigel et al., 2015; Ludewig et al., 2022b), and part of frequently used intelligence batteries (e.g., German: Heller & Perleth, 2000; English: Wechsler, 2011). Two critical aspects of vocabulary knowledge are vocabulary breadth, that is, the number of words known; and vocabulary depth, that is, how much knowledge about a word’s semantic, orthographic, and phonological aspects is available (Li & Kirby, 2015). Among these three aspects of vocabulary depth, semantic knowledge has the strongest association with reading comprehension (Richter et al., 2013). In a semantic vocabulary knowledge test, students demonstrate their knowledge by meaningfully relating a tested word to a word or picture. For instance, students could be asked to select an antonym (e.g., “[bright] is the opposite of… [dark]”), classification (e.g., “[apples] are … [fruits]”) or synonym (e.g., “[curved] is another word for…. [round]”: Murphy, 2003). Synonymy is most commonly used in large-scale educational assessments, language-related research, and intelligence batteries.
Multiple-choice tasks are most commonly used to test vocabulary knowledge in large-scale applications because of their efficiency. However, constructing plausible but incorrect distractors can be particularly challenging because meaning relationships can take many forms and are gradual rather than discrete. For example, suppose students are asked to find the best synonym for “king” and the options contain the words “monarch” and “crown”. Based on its literal meaning, “monarch” is the best synonym. However, “crown” frequently means king in a sentence like “this is property of the crown.” Therefore, in item development, it is difficult to judge whether “crown” is a good distractor. Distractors are good if highly able students unanimously choose “monarch”. However, this item’s ability to discriminate between higher and lower ability students will be compromised if some highly able students choose “crown” due to its frequent use in a different way than its literal definition. Finding distractors that are plausible but never selected by highly able students is a challenge for item developers. The plausibility and correctness of options are gradual and potentially influenced by many factors. We apply cognitive principles to investigate what option features influence the plausibility of options and what combinations of features make options plausible but incorrect.
Multiple-Choice Synonym Task
Synonym-based vocabulary tests consist of MC items with an item stem word and multiple options (Figure 1). Test takers are asked to choose the option that has the most similar meaning to the item stem. English Translation of an Example Item From the German Synonym-Based Vocabulary Knowledge Test. Note. The test was administered in German. The exact items cannot be published due to copyright restrictions.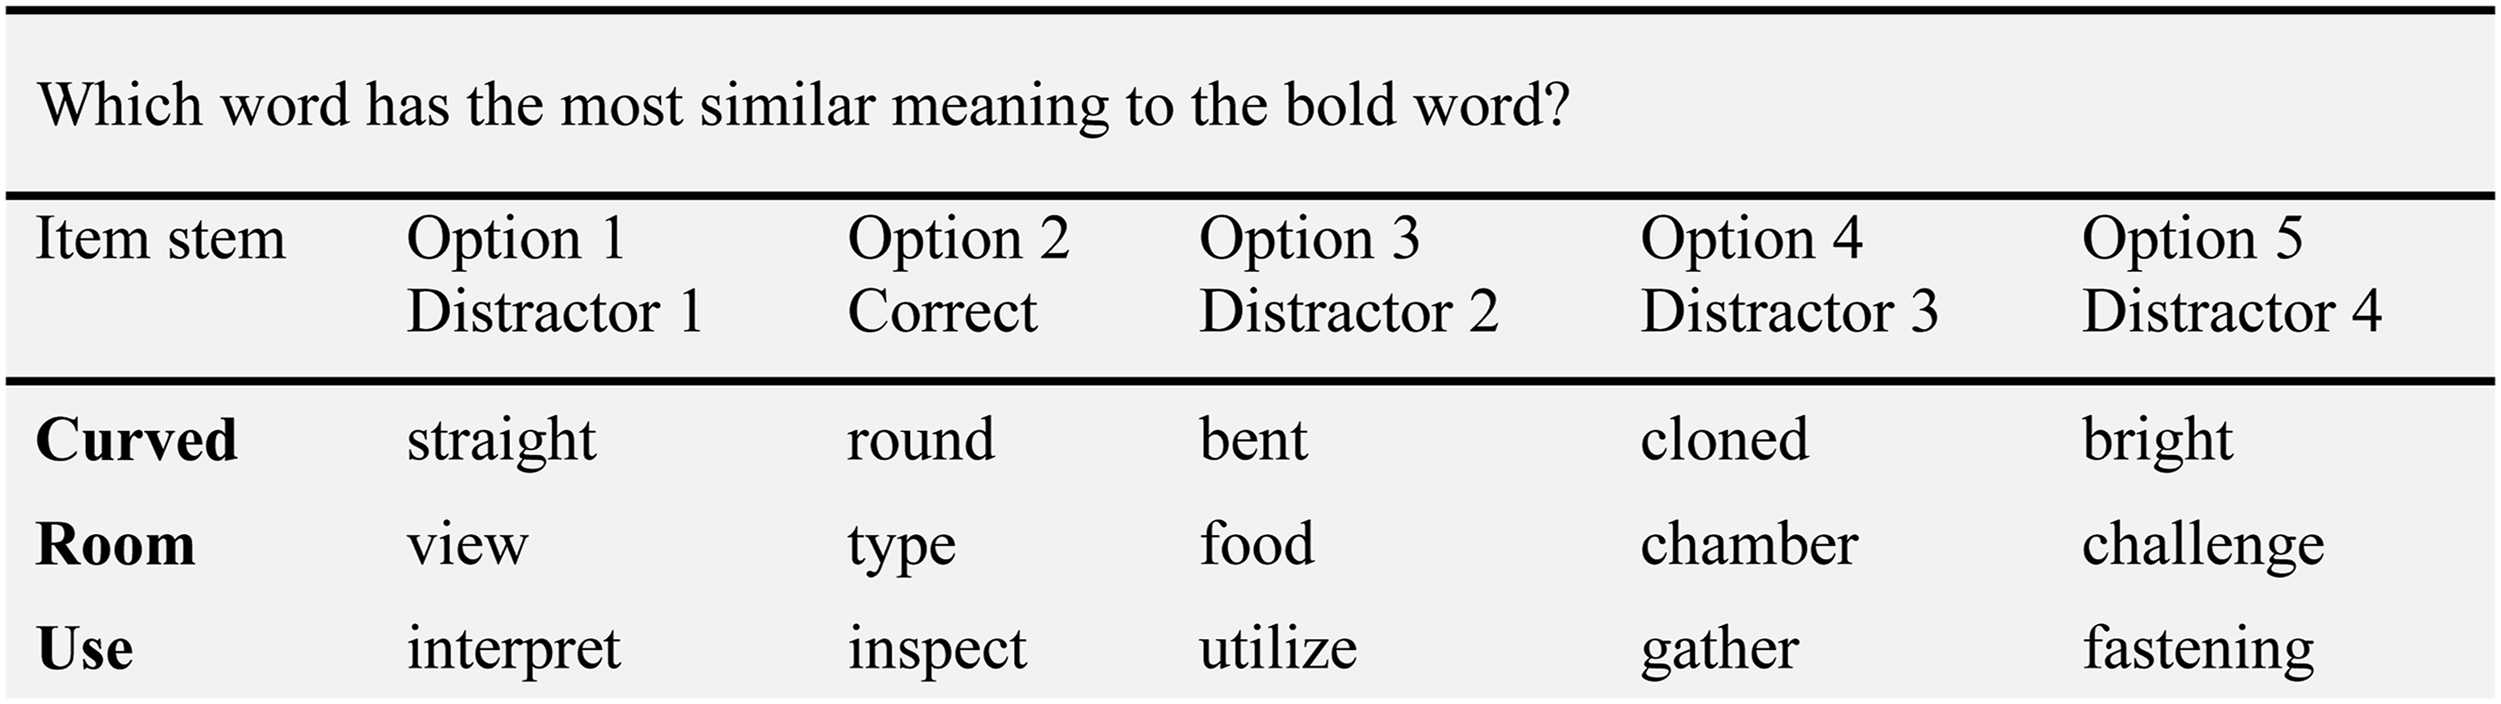
The most synonym option, that is, most similar in meaning, to the item stem, is correct. The purpose of the alternative options is to “distract” test takers with relatively low abilities from the correct option; hence, these options are called distractors. In MC tests, distractors have an immense influence on the item characteristics (e.g., Freedle & Kostin, 1993). Therefore, crucial aspect is the plausibility of the distractors (Gierl et al., 2017). A distractor is plausible if it can be falsified only by means relevant to the construct (e.g., Gorin, 2005) and if it represents a common misconception (e.g., Shin et al., 2019). Thus, basic psychological principles should explain which distractors are difficult to falsify and which may elicit misconceptions.
Summary Table of Features, Definitions, Suggested Theoretical Interpretation, and Values.
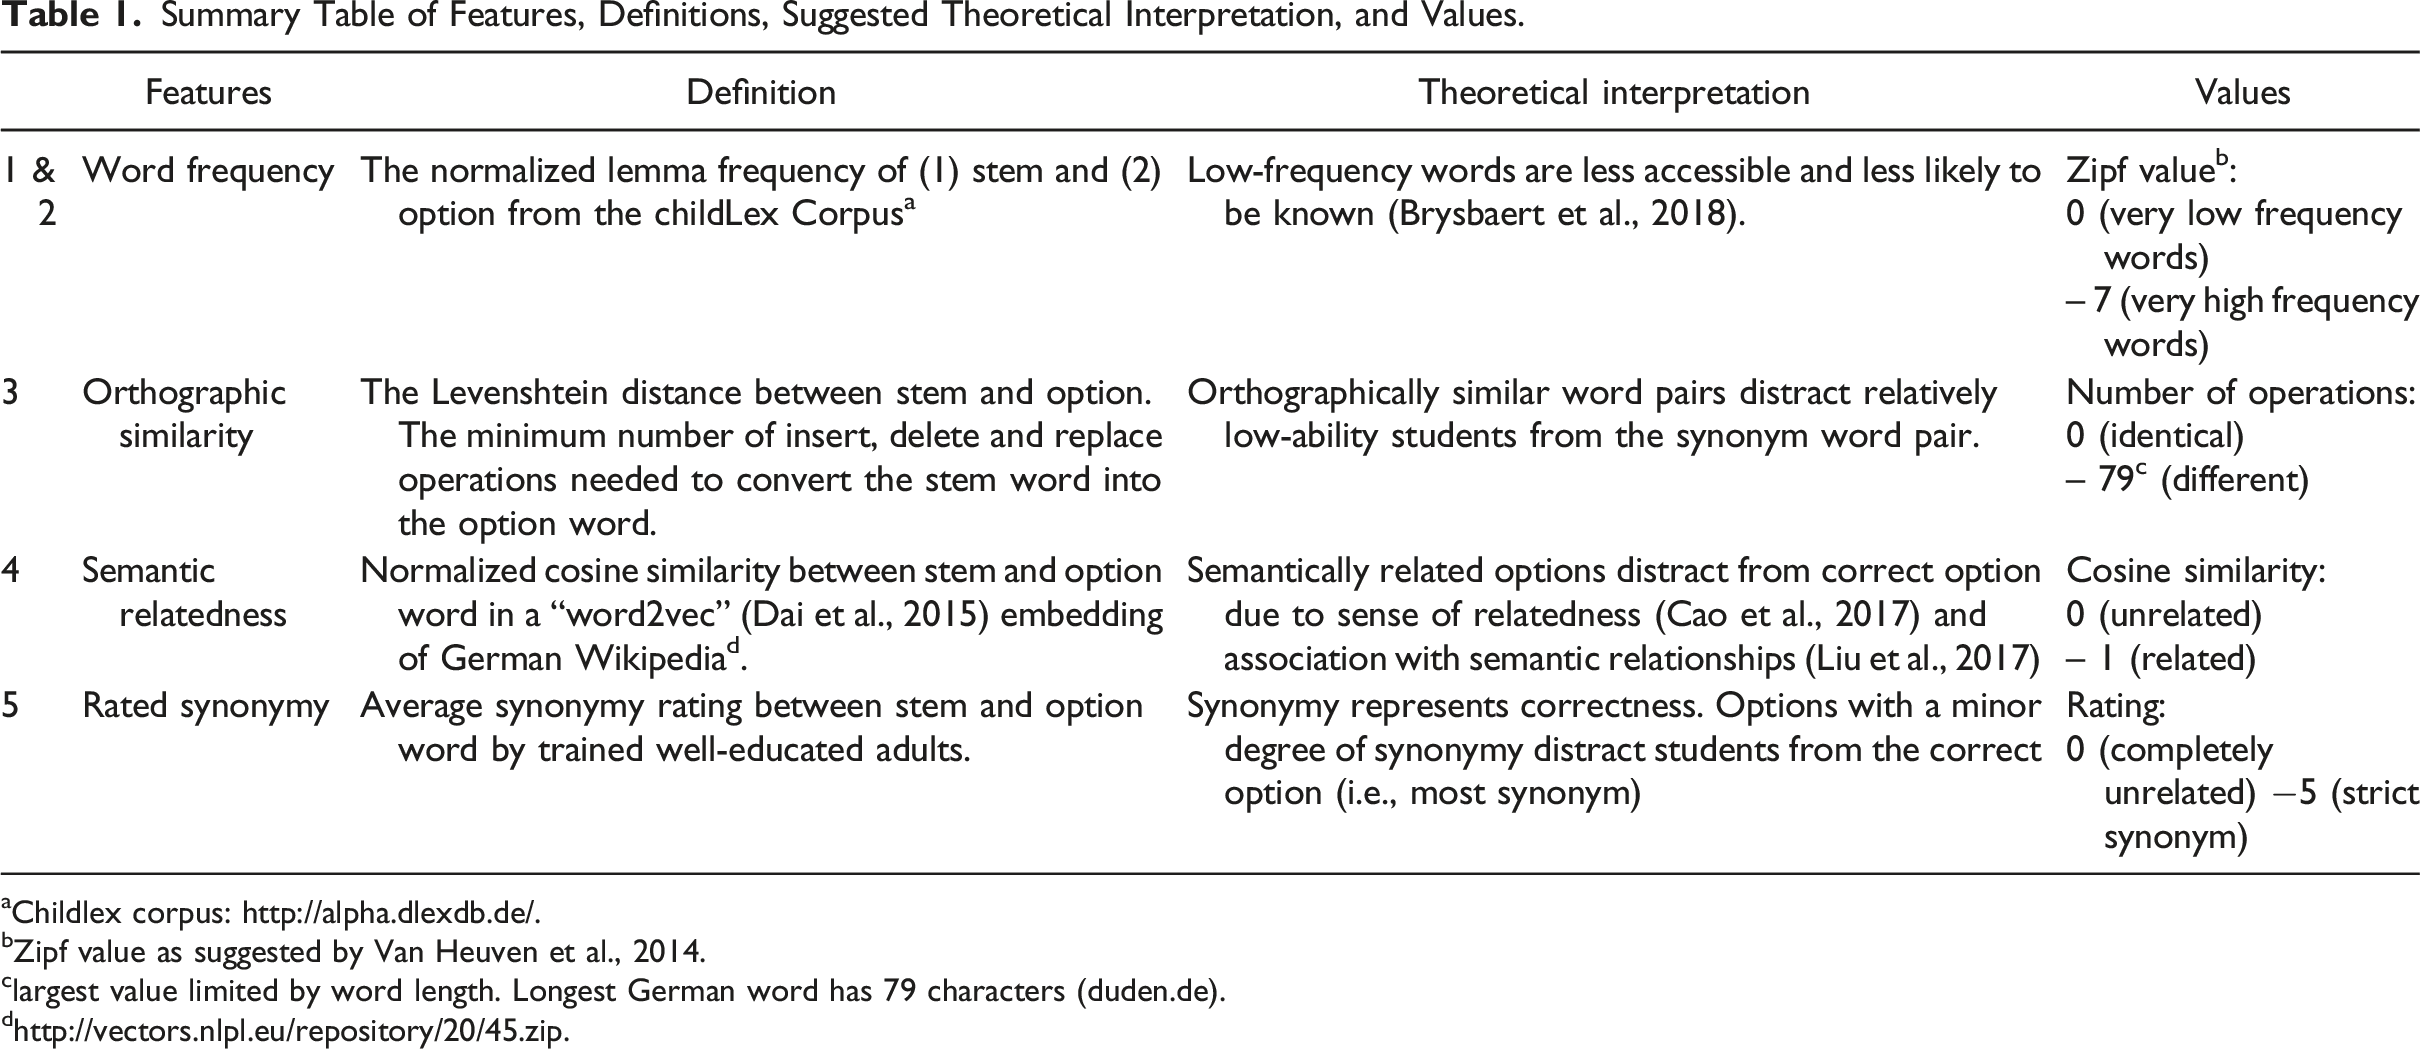
aChildlex corpus: http://alpha.dlexdb.de/.
bZipf value as suggested by Van Heuven et al., 2014.
clargest value limited by word length. Longest German word has 79 characters (duden.de).
dhttp://vectors.nlpl.eu/repository/20/45.zip
Option Features in Synonym Tasks
Word Recognition and Frequency
Word recognition is the association between an entry in the mental lexicon and written words. Recognition is achieved either through phonological recoding processes, which assign a phonetic (phonological) representation to a grapheme sequence or through orthographic comparison processes. The spelling of a word is directly compared with its orthographic representation in the mental lexicon (Cunningham & Stanovich, 1990). Finally, the word recognition process involves activation of the word’s meaning. Word recognition is slower and more likely to be incorrect when words are infrequently used in the language students are exposed to (Brysbaert et al., 2018). Word frequency and item difficulty in word recognition tests are highly correlated (r = −.74; Trautwein & Schroeder, 2018) and other language relates tasks (Ludewig et al., 2022a). Word frequency is also associated with accuracy and latency in semantic classification tasks (i.e., deciding whether the stimulus represents something alive or not; Taikh et al., 2015). Therefore, word frequency should be one important feature that influences the choice of an option in synonym-based vocabulary knowledge tests.
Relatedness Evaluation
After students recognize the different word pairs, they ultimately need to evaluate which word pair might be the most synonym. During this evaluation, they must be resistant to distracting features that may be confused with synonymy. Students need to (1) distinguish between similar forms and similar meanings, and (2) distinguish between semantic relatedness and synonymy
Form, Meaning, and Orthographic Similarity
One of the essential tasks of word acquisition is mapping lexical forms to meanings (Perfetti, 2007). “A lexical representation has high quality to the extent that it has a fully specified orthographic representation (a spelling) […] and the confusions about the word meaning as well as the word form is minimized by high-quality representations” (p.190, Perfetti, 2007). Word pairs might have similar grapheme sequences (e.g., [to] “talk” and “task”) but different meanings, or different grapheme sequences yet similar meanings (e.g., “almost” and “nearly”). Students with low lexical quality might be distracted by words with very similar grapheme sequences.
Semantic Relationship, Meaning, and Semantic Relatedness
The next challenge is to distinguish between semantically related word pairs and synonym word pairs. Interestingly, the mere co-occurrence of word pairs within a given context seems to indicate semantic relationships (Liu et al., 2017). This contextual co-occurrence gives participants a sense of relatedness (Cao et al., 2017). Thus, synonym words tend to be contextually related, but contextually related word pairs are not necessary synonym (Scheible & Im Walde, 2014).
Perfetti (2007) summarizes that students with high lexical quality have a “less context-bound [and a] […] fuller range of meaning dimensions to discriminate among words in the same semantic field” (p. 360). Therefore, students who chose semantically related words instead of completely unrelated words might already associate meaning and semantic relationship to the word pair. However, students who choose semantically related instead of synonym word pairs might not associate the full range of meaning dimensions necessary to discriminate between an unspecific semantic relationship and synonymy.
Correctness: Degree of Synonymy
Finally, students must determine the best synonym out of all answer options. Synonymy is a semantic relationship between words that can be described as “interchangeability”. Two words are said to be synonyms if one can be used in a statement in place of the other without changing the statement’s meaning (Miller & Charles, 1991). Two words that are strictly synonym mean exactly the same thing in every possible context. Word pairs with a minor degree of synonymy mean something similar in some contexts. To discriminate between different degrees of synonymy, students must evaluate the level of overlap of meaning in different dimensions of the semantic field (Perfetti, 2007). High-ability students may effectively distinguish between different degrees of synonymy.
Research Questions
An evidence-based task model incorporating cognitive psychological principles should help us constructing of plausible but incorrect options in MC tests. Research has found that word usage frequency influences students’ likelihood of recognizing words and the degree to which they associate meaning to words. When students judge the synonymy of word pairs, lower-ability students may be distracted by words with similar form (i.e., orthographically similar) or words that are semantically related but not synonyms. Additionally, discriminating between degrees of synonymy might require high ability. The influence of these features on response behavior in synonym-based multiple-choice items in large-scale assessments has never before been investigated. Therefore, we are the first to investigate the following:
RQ1: Which features explain the choice of options?
RQ2: How are the option features related to option choices?
Method
Participants
Students participated at the beginning of the second half of the 2016–2017 school year in a research project evaluating the promotion of students’ language and reading competencies funded by the German Ministry of Education. All participating schools were general education public schools with German as the primary language of instruction. Students are usually enrolled in their district’s elementary school during the year they turn six before a particular cutoff date, so most students turn ten by fourth grade. We analyzed data from Ni = 924 fourth graders from Nc = 64 classes and Ns = 35 schools. About half of the participants were female, 52.05%. The average age was M = 10.28, SD = 0.52. The study involved students from six different federal states in Germany. All students had at least four years of instruction in German. However, only 64.91% of the students reported speaking German exclusively at home. Since the study involved a language support program, schools with students from heterogeneous language backgrounds were more likely to participate. We excluded 25 (1.03%) participants from the original N = 949 with valid informed consent forms included in the data set because they answered fewer than 50% of the vocabulary test items.
Material
Students’ German vocabulary knowledge was assessed with the synonym-based for vocabulary knowledge test, KFT 4-12 +R V1 (Heller & Perleth, 2000). The paper-pencil test included 25 items presented in a fixed order and administered under low time pressure.
Word Frequency
The word frequencies for the vocabulary knowledge test were derived from the childLex corpus. The childLex corpus includes 500 books classified as appropriate for children 6–12 years of age (Schroeder et al., 2015). The corpus includes 9.9 million words in running text and about 200,000 different words. The childLex corpus allows various word statistics to be queried. We used the normalized lemma frequencies (Kearns & Hiebert, 2022). A lemma is a word’s root without morphological changes. The lemma frequency indicates how often a word root is used. For instance, the lemma frequency of “Baum [tree]” would count all occasions of “Baum” [tree], “Bäume” [trees], “Bäumen” [of trees], and “eines Baumes” [of a tree]. The count ignores capitalization and the variable was log-transformed to normalize the distribution. All words from the vocabulary test except one were found in the childLex corpus (M = 3.99, SD = 0.56, range from 2.30 to 6.65). The word frequency not included in the childLex corpus was interpolated using Laplace approximations (Diependaele et al., 2013). Based on the interpolated normalized lemma frequencies, so-called Zipf values were computed (Van Heuven et al., 2014). This scale is logarithmic and scaled so that a value of 3 corresponds to the frequency of a word that occurs once in a million words, a value of 4 ten times per million words, a value of 5100 times per million words, etc.
Orthographic Similarity
Orthographic similarity was assessed based on the Levenshtein distance (Yarkoni et al., 2008). The Levenshtein distance between two words is the minimum number of single-character edits (insertions, deletions, or substitutions) required to change one word into the other. The Levenshtein distance between each option word and its stem word was determined with the R function adist, which is part of the base R environment (R Core Team, 2021).
Semantic Relatedness
Semantic relatedness was assessed with the normalized cosine similarity of the stem and option word based on a word2vec of the German Wikipedia corpus (http://vectors.nlpl.eu/repository/20/45.zip). Word2vec is a combination of models used to represent distributed representations of words within a corpus. A word is represented in a 100-dimensional vector space. Words with a higher cosine similarity are semantically related (For a more detailed description of the method, please see, e.g., Dai et al., 2015).
Synonymy Rating
The degree of synonymy was rated by 21 independent, trained adults recruited in a university context. The raters were 66.66% female, with an average age of M = 28.95, and SD = 5.62. All raters were native speakers of German. Five had a doctoral degree, twelve a master’s degree, three a bachelor’s degree, and two were undergraduate students with a university entrance qualification. All raters work in the fields of education, psychology, or related sciences. The raters were given a definition of synonymy and examples of high and low synonymy. They then rated the 125 synonym pairs (25 items x 5 answer options) in random order. Raters responded to a six-point Likert scale labeled with “completely unrelated = 0”, “1”, “2”, “3”, “4”, and “strict synonym = 5”. The mean correlation among raters was high, r = .68 (z = 7.54, p < .001). Even though Likert scale ratings should be considered ordinal, we used the mean synonymy ratings across raters for the analysis because means and medians are empirically similar and means are easier to use than medians.
Procedure
The study was conducted in the morning hours in all classes and administered in paper-pencil format. Test administration began with a text comprehension test (30 minutes: “Aspects of the learning situation and learning development”; Lehmann et al., 2002), followed by a five-minute break and a decoding speed test “WLLP + R” (5 minutes; German: “Würzburger Leise Leseprobe - Revision” [English: “Würzburger silent reading test - revised”]; Schneider, 2011), a word analogy test (6 minutes; KFT 4-12 +R V3), and the vocabulary knowledge test KFT 4-12 +R V1 (6 minutes). All tests were administered in accordance with their test manuals.
Analysis
To answer the research questions, we first estimated the option parameters from option trace curves that represented the options' attractiveness and ability to discriminate between lower versus higher ability students. Hence, to address RQ1, we reported what features were selected in the stepwise selection approach and how much variance in the option parameters they explained. Second, we determined the features of each word pair. Subsequently, to address RQ2, we interpreted the results of the regression models with different option feature arrangements.
Option Trace Curves
We modeled the probability of choosing an option given students' ability using the nominal categories model (NCM; Bock, 1972). The NCM is a general item response theory (IRT) model for polytomous responses. The NCM is specifically designed to analyze the empirical order in which students choose options relative to the latent trait being measured (θ). The NCM was originally proposed for multiple-choice items measuring vocabulary with synonymy judgments (Bock, 1972). The model Equation (1) describes the curve tracing the probability (T) that the item response u with the option k as a function of the latent variable θ with the vector parameters a and c. The parameter a
k
can be termed the slope and c
k
the intercept. Note that the probability of choosing an option relative to θ is based on the option parameters a
k
and ck, as well as the sum of all other option parameters of the same item i. The intercept parameter represents the relative attractiveness of a particular response option. An option has a low intercept if it is attractive to students with low ability and a high intercept if it is attractive to students with high ability. A higher slope suggests that the option is good at discriminating between students with low versus high abilities.
A more detailed description of the model can be found in Bock (1972). The item parameters were estimated in RStudio (R Core Team, 2021) using the nominal method from the mirt package (Chalmers, 2012). Omitted and not-reached responses were entirely ignored; thus, the estimation utilizes non-missing responses to estimate person and option parameters.
Option Types
We distinguish between four different option types that describe the curves efficiently. (i) Strong attractors were options chosen by students with a relatively high vocabulary. More precisely, we defined these as options that were chosen with a probability higher than 75% by the 1% of students with the highest ability. The key in a well-constructed item is a strong attractor. Strong attractors have a high intercept and slope. (ii) Weak attractors are options that are chosen with a probability of more than 25% but less than 75% by the top 1% of students. Items with weak attractors have two or more options that attract high-ability students. Therefore, weak attractors have a high intercept and a low slope. (iii) Strong distractors are options that some students choose with a probability of more than 25% (i.e., 5% more than the theoretical guessing rate with 5 options) but have a selection probability below 25% among the top 1% of students. Strong distractors keep low- and intermediate-ability students from guessing the correct answer and therefore have a low intercept and slope. (iv) Weak distractors are never chosen with a probability higher than 25%. Weak distractors are obviously incorrect to all students and have a low intercept and a high slope. We used this classification to describe the option trace curves and the results of the analysis.
RQ1: Option Feature Analysis
The unit of analysis is the options, and each of the 25 items has five options. Therefore, our dataset has 150 item-option pairs. Each item-option pair has a k and c k parameters as well as the five options features: (i) word frequency of option and (ii) stem, (iii) orthographic similarity, (iv) semantic relatedness, and (v) synonymy (Table 1). The intercept and slope are examined as separate dependent variables, and the optional features as independent variables in two linear regression models. In addition to the main terms, we consider all interactions between the five features, resulting in 5! = 120 predictors. To prevent overfitting, we use the Akaike Information Criterion (AIC) stepwise approach combining forward and backward variable selection (Hebbali, 2020). The AIC is an indicator of a model’s goodness of fit that prevents overfitting by including a penalty term for the number of variables in the model. Additionally, AIC stepwise selection does not involve tests for significance. Therefore, multiple testing or the high number of predictors is not an issue for AIC model selection (Burnham et al., 2011). Lastly, we assess the explanatory value of an option feature via difference in adjusted R 2 between a model with and without the option feature.
RQ2: Relationship Between Option Trace Curves and Option Features
The relationships between options trace curves and option features are challenging to interpret because option trace curves are constructed from all options for an item. Therefore, we illustrate the results from the best model with different feature arrangements.
Descriptive Statistics for Option Features and Option Parameters.
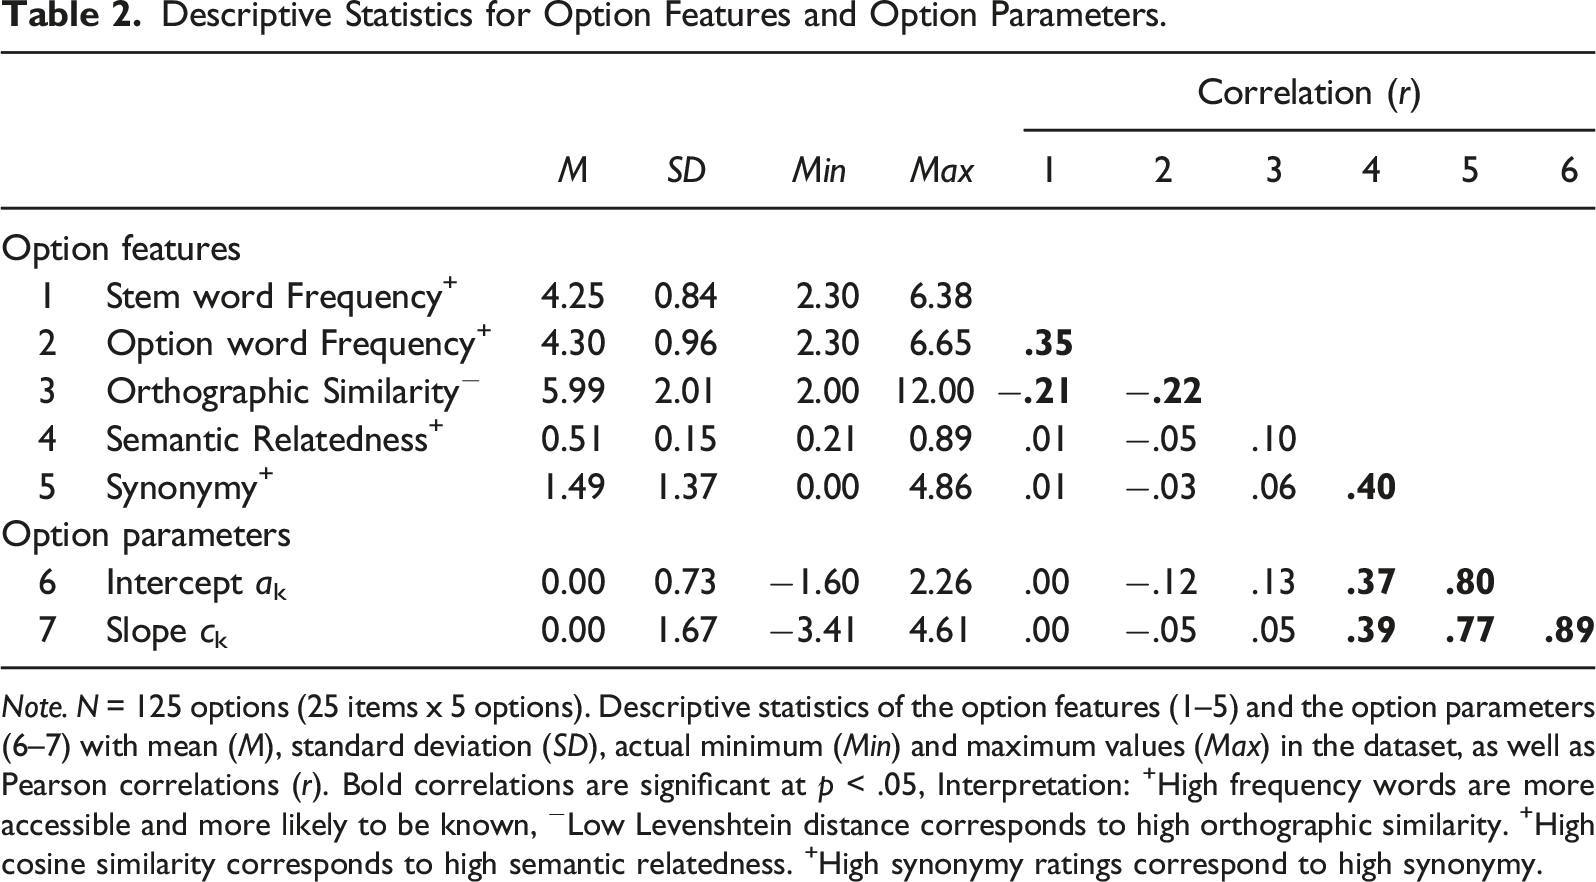
Note. N = 125 options (25 items x 5 options). Descriptive statistics of the option features (1–5) and the option parameters (6–7) with mean (M), standard deviation (SD), actual minimum (Min) and maximum values (Max) in the dataset, as well as Pearson correlations (r). Bold correlations are significant at p < .05, Interpretation: +High frequency words are more accessible and more likely to be known, −Low Levenshtein distance corresponds to high orthographic similarity. +High cosine similarity corresponds to high semantic relatedness. +High synonymy ratings correspond to high synonymy.
Results
Descriptive Results
Option Trace Curves
The weighted likelihood estimate (WLE; Warm, 1989), which provides an unbiased ability estimate, was sufficient (Relwle = .79) for the ability estimates from the nominal category model. Figure 2 shows the trace curves for all 25 items on the vocabulary test. The colors and line formats indicate the option types: strong attractor, weak attractor, strong distractor, and weak distractors. Interestingly, item 3, 13, 14, 18, 19, 20, and 24 have no strong attractor, that is, even high-ability students did not clearly prefer one of the options as the best synonym. Items without a strong attractor have relatively low item discrimination. Item 3, 13, 14, 18, and 19 failed to have a strong attractor and only had two weak attractors, that is, one option in addition to the key that (even) high-ability students have a modest probability of choosing. Item 24 has only one weak attractor, and Item 20 seems to have a weak attractor because it does not discriminate between students. The trace curves display items that vary in difficulty and discrimination. Thus, the next question to be considered concerns how option features influence difficulty and discrimination. Trace Curves in the Nominal Categories Model. Note. The y-axis represents each option’s probability of being chosen. The x-axis represents a student’s vocabulary knowledge (θ).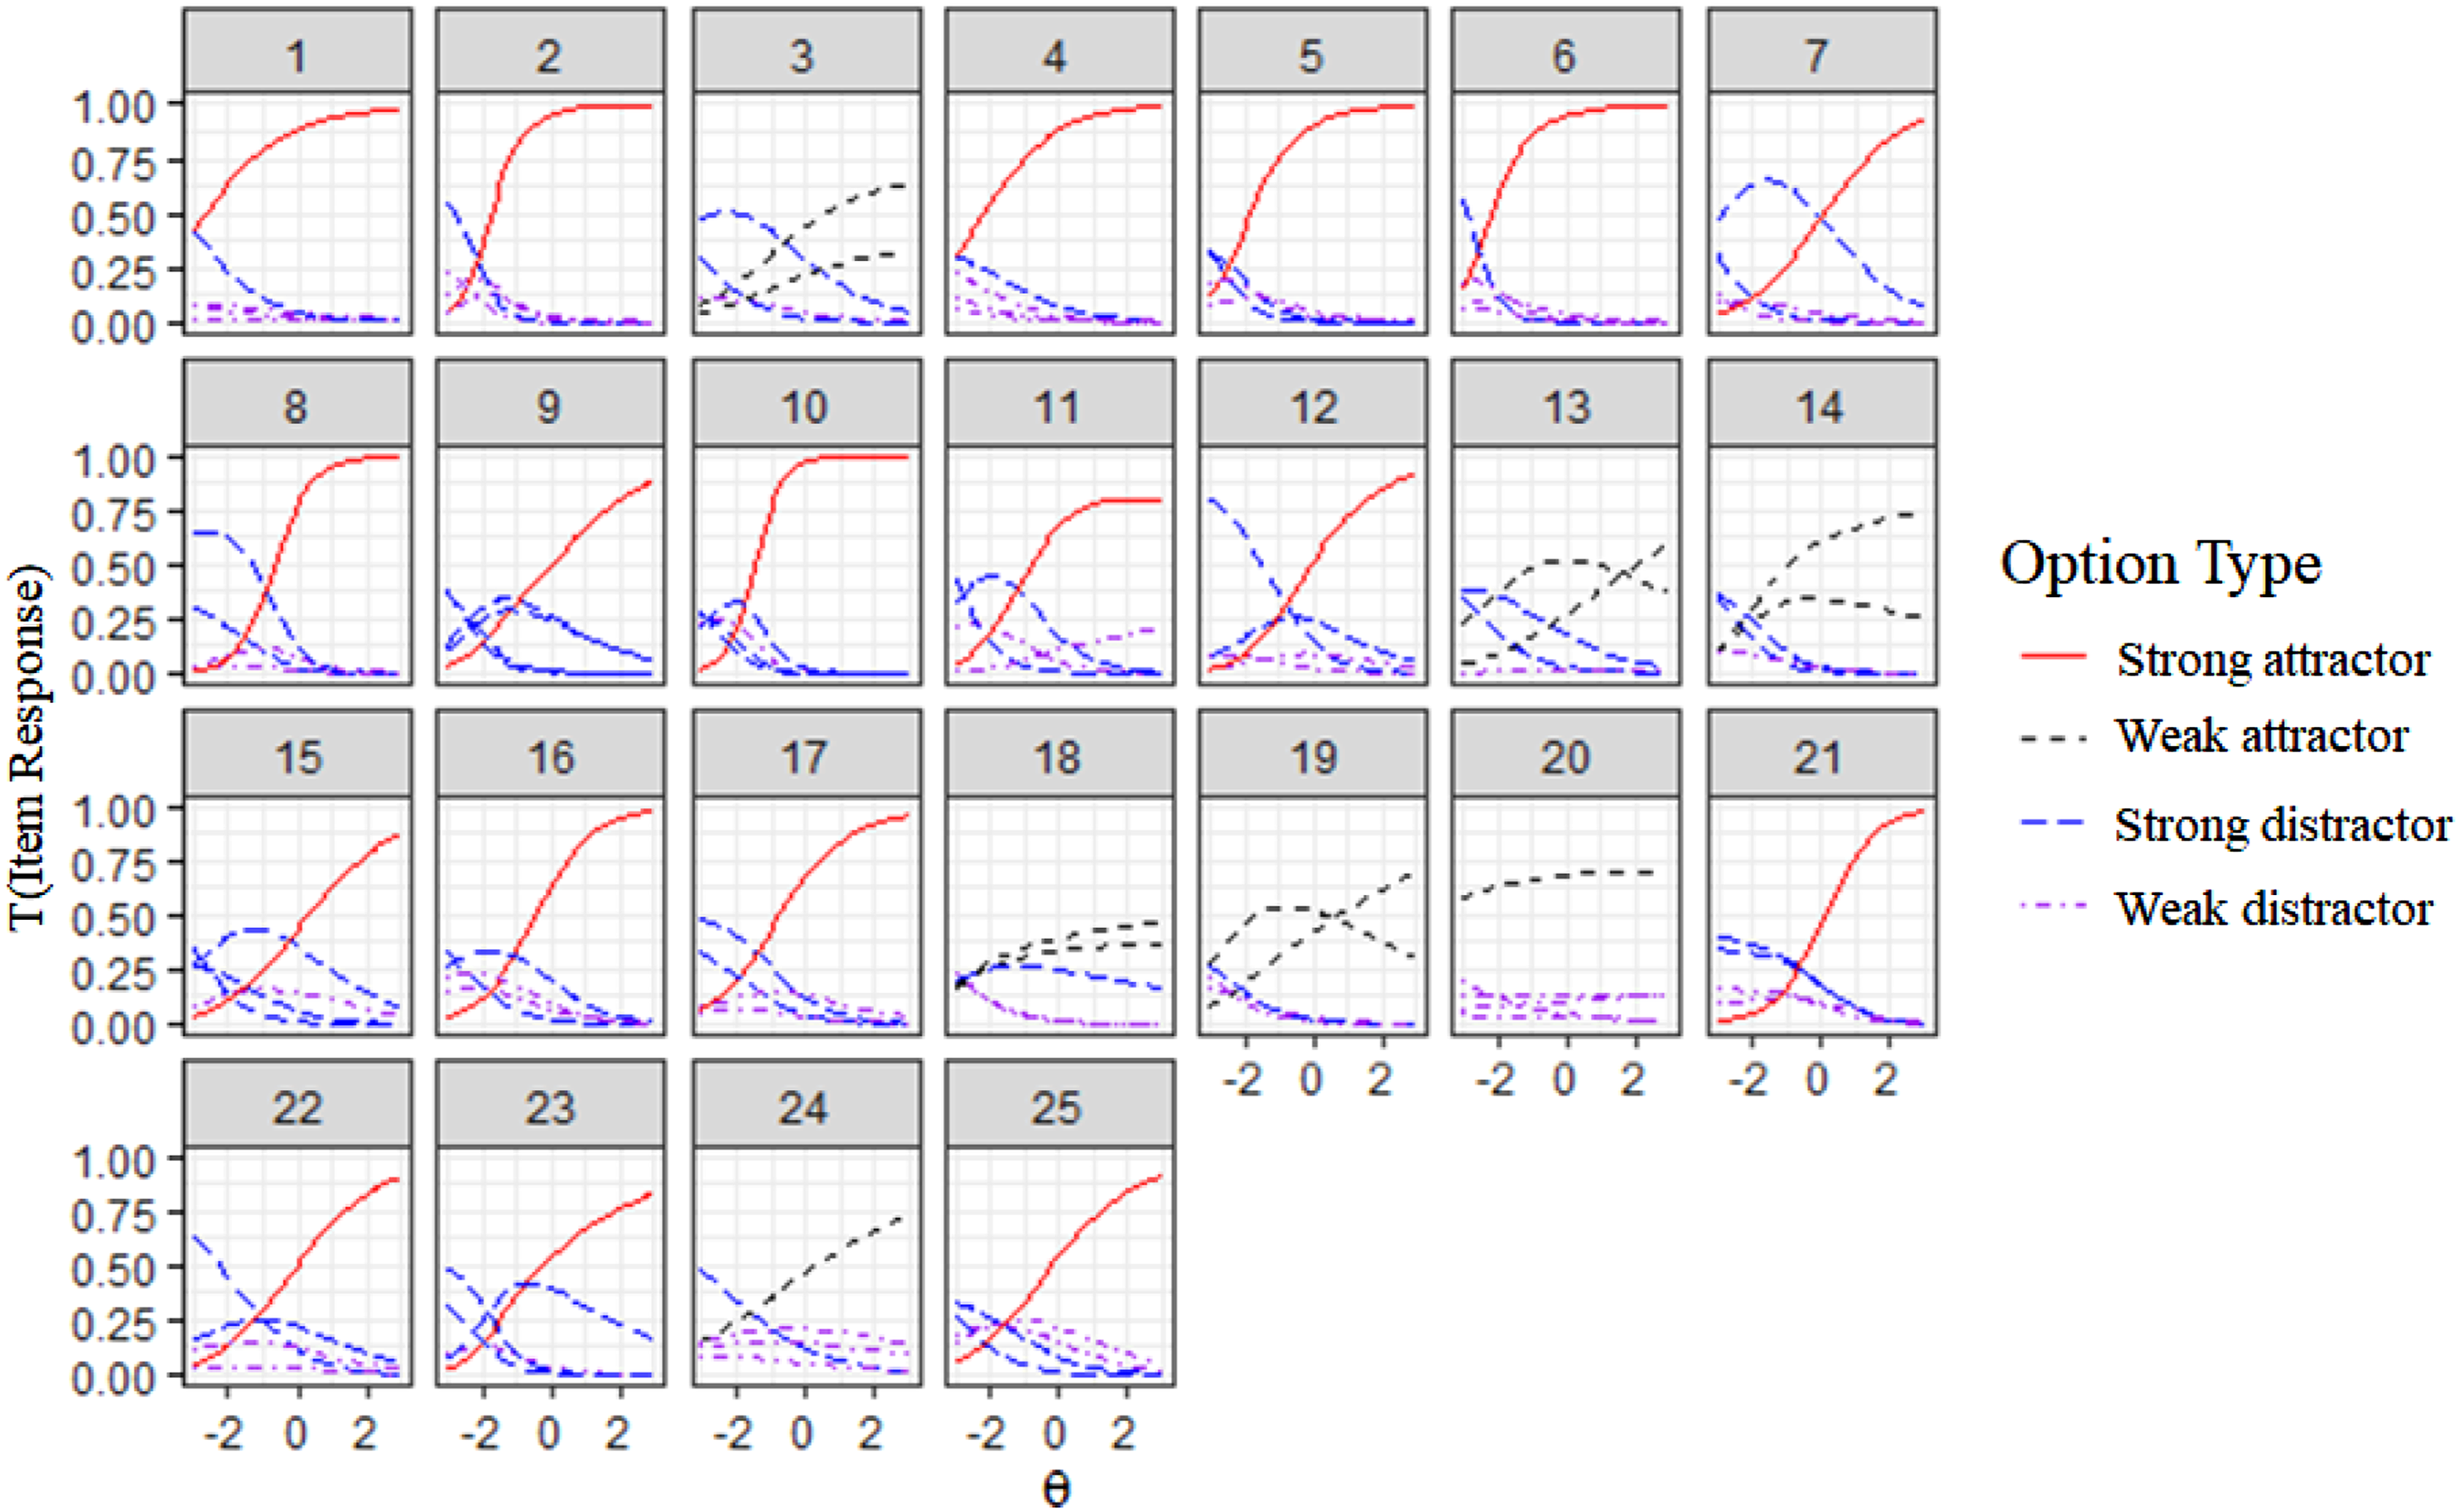
Generally, the probability of choosing an option depends on the values of the slopes and intercept parameters of all options relative to each other for the respective item. Figure 3 displays the option parameters for each option type. Slope and intercept were highly correlated (r = .89, Table 2). Nonetheless, the option types can be clustered according to their intercept and slope parameters. Unattractive distractors have slopes near zero. Strong distractors tend to have either negative slopes and negative intercepts or slopes close to zero and low positive intercepts. Strong attractors have a high positive slope and intercept. Weak attractors tend to have lower slopes and intercepts than strong attractors. Relationship Between Intercept and Slope and Option Types. Note. The option types are characterized by their intercept (x-axis) and slope (y-axis).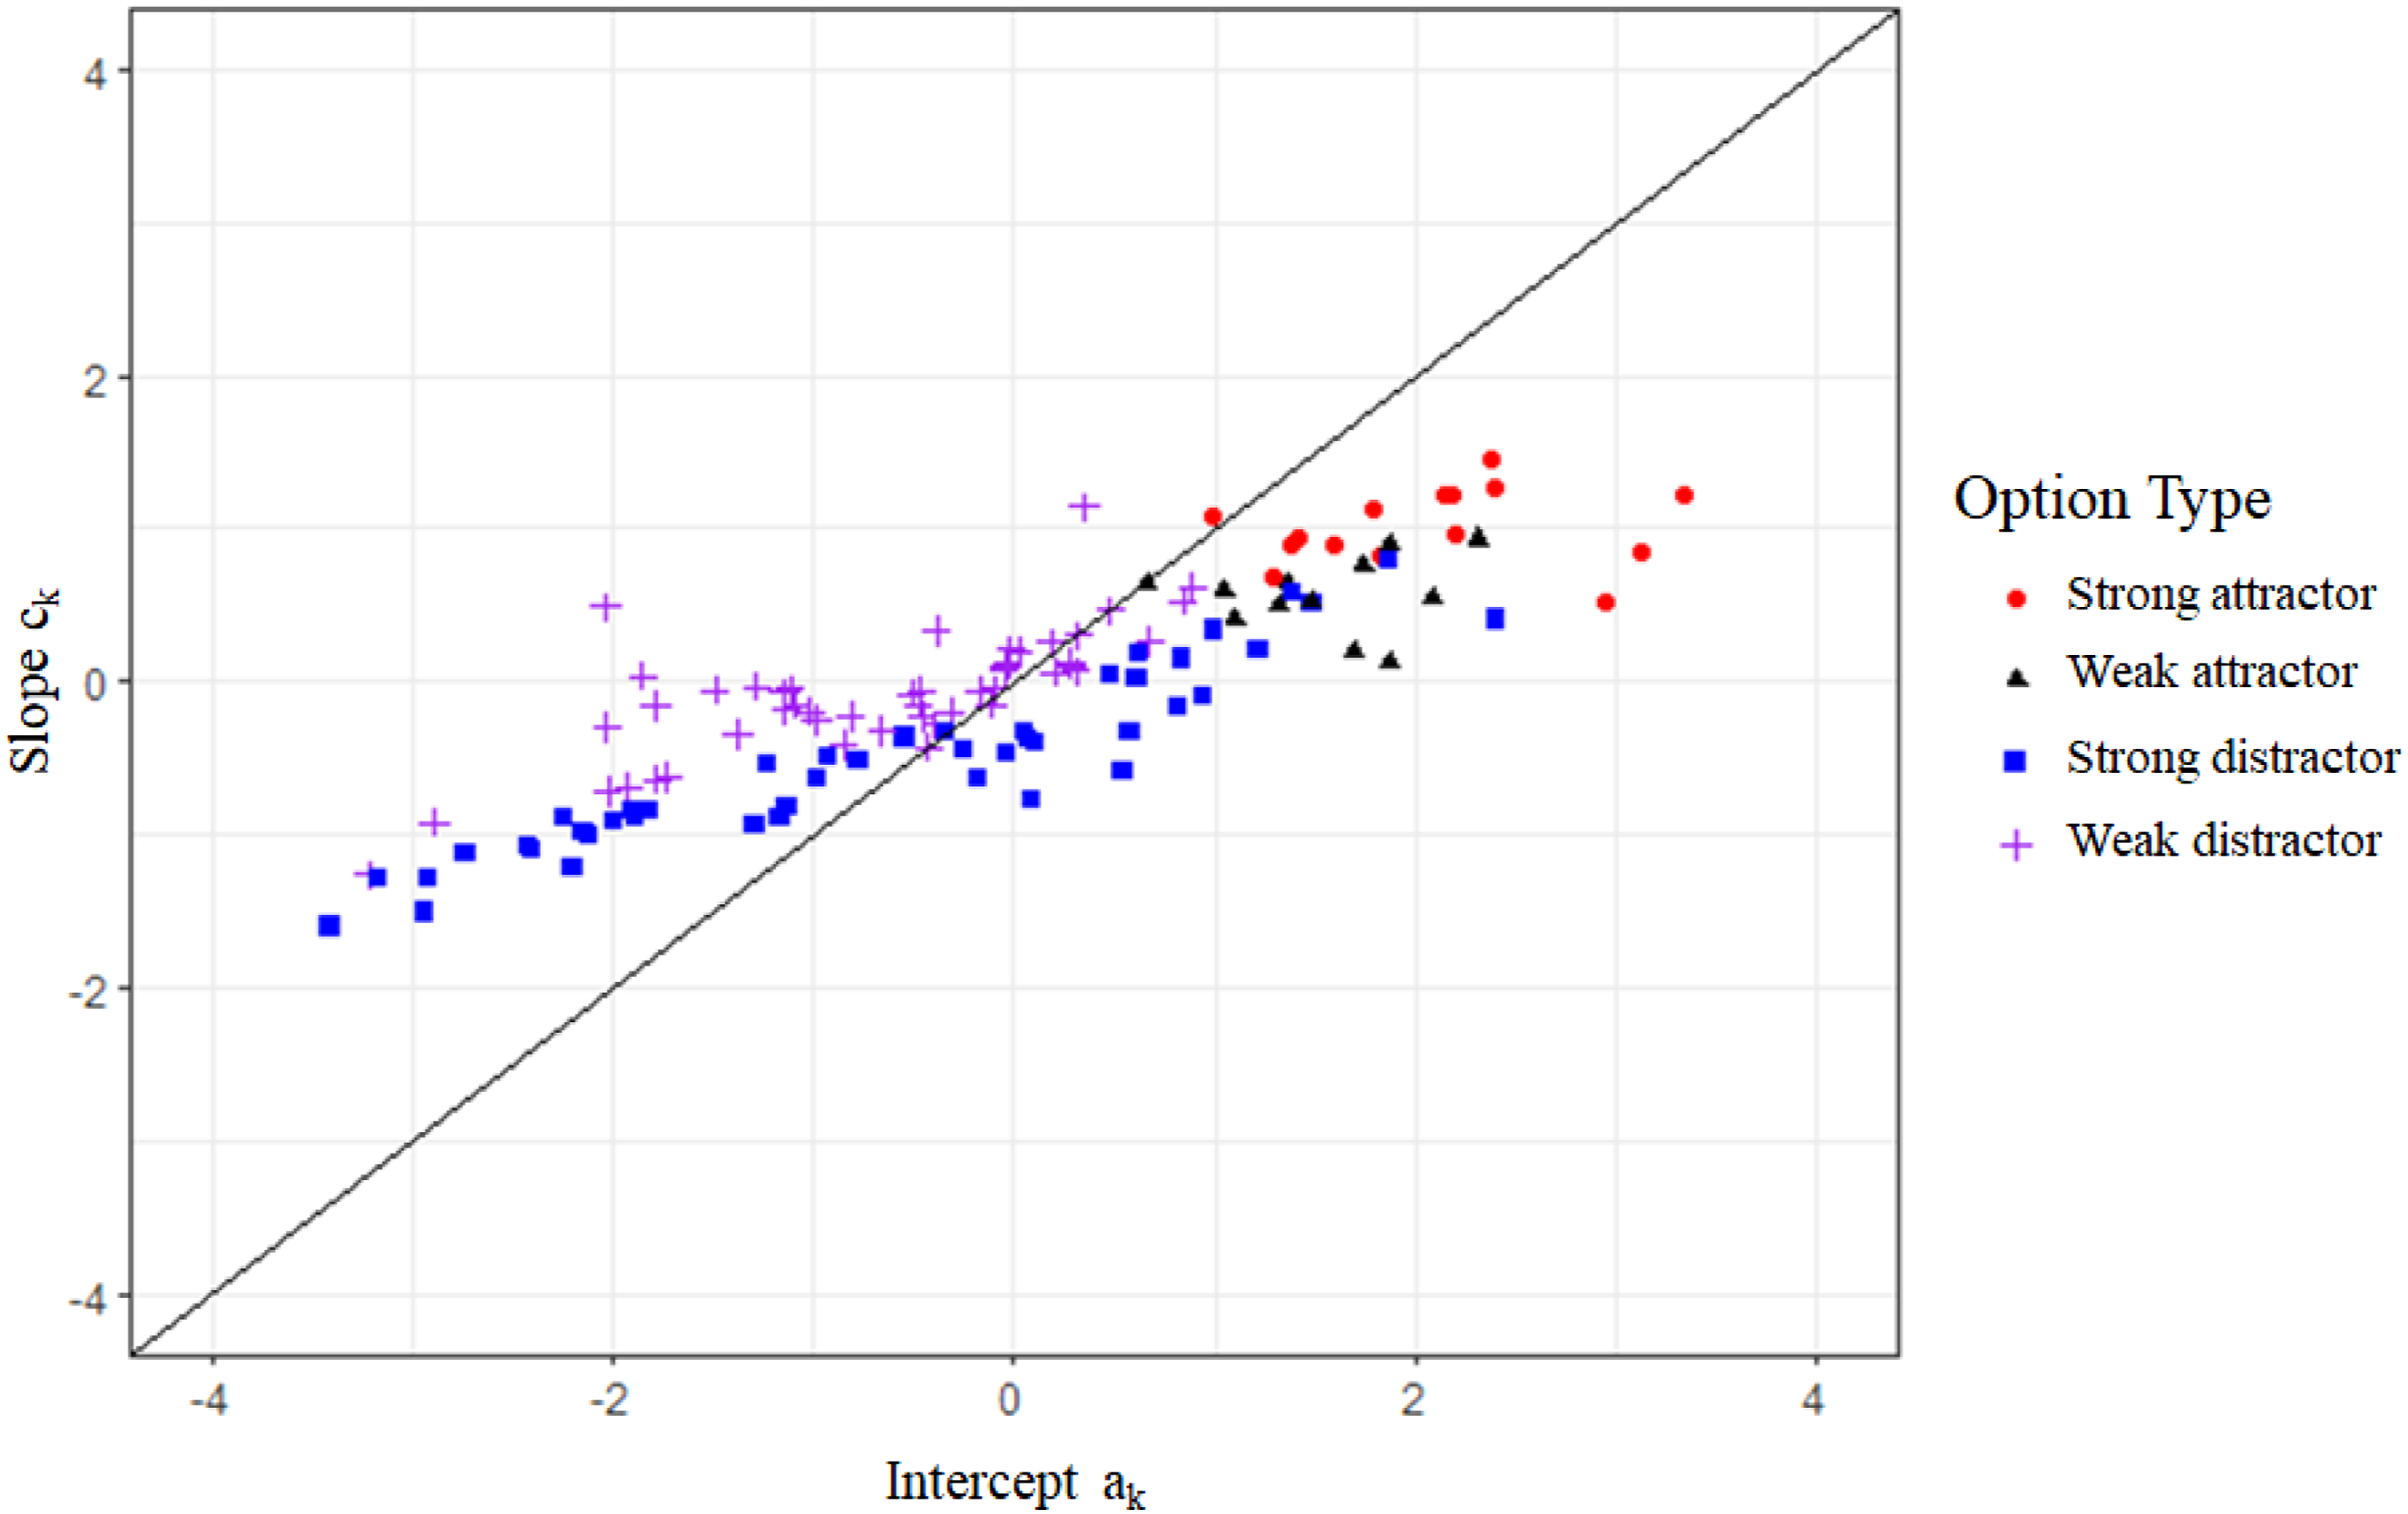
Option Features
We used the option features to explain the option parameters in our analysis. Table 2 summarizes the features of the 125 options (5 options x 25 items). A mean word frequency of 4 means that the word is used 10 times in a million words. An orthographic similarity of 6 means that it took, on average, 6 operations (i.e., deletion, exchange, insertion) to mutate the stem into the option. The mean semantic relatedness is .5 because it is a normally distributed min-max normalized variable. On average, across all options, the rated synonymy is 1.49 and, therefore, relatively low because most distractors have only a low degree of synonymy.
The directions and size of the feature correlations showed no unexpected pattern (Table 2). Semantic relatedness and synonymy were positively correlated, r(123) = .40, p < .001. The word frequencies of stem and option were positively correlated, r(123) = .35, p < .001, which means that rare stem words were presented with rare options. Additionally, word pairs with high orthographic similarity (i.e., low Levenshtein distance) tended to be more frequent words (stem: r(123) = −.21, p = .017, option: r(123) = −.22, p = .016). The option parameters were significantly correlated with the option features’ semantic relatedness and synonymy. Unsurprisingly, synonymy had the highest correlation with the option parameters. Options with high degrees of synonymy were the most attractive.
RQ1: Which Features Explain the Choice of Options?
Model Summaries With Slope and Intercept as Dependent Variable.
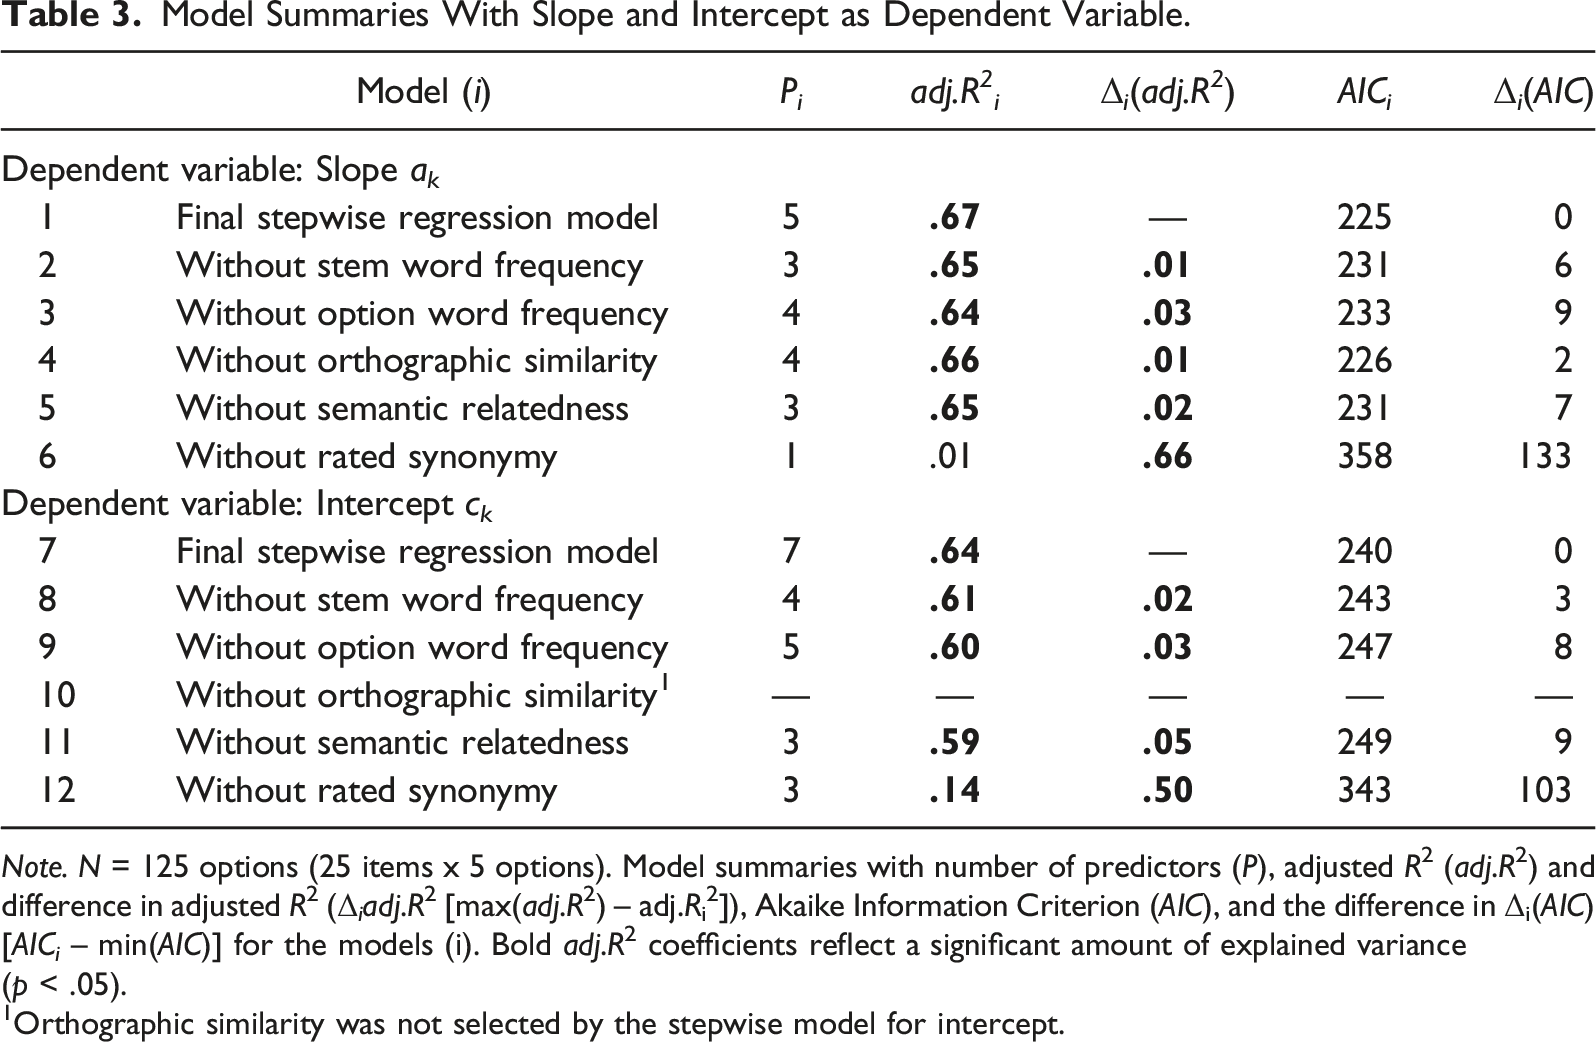
Note. N = 125 options (25 items x 5 options). Model summaries with number of predictors (P), adjusted R2 (adj.R2) and difference in adjusted R2 (Δ i adj.R2 [max(adj.R2) – adj.Ri2]), Akaike Information Criterion (AIC), and the difference in Δi(AIC) [AICi – min(AIC)] for the models (i). Bold adj.R2 coefficients reflect a significant amount of explained variance (p < .05).
1Orthographic similarity was not selected by the stepwise model for intercept.
Slope
For the slope parameter, the best model of the stepwise approach includes all six features and explains 67% of the variance (Table 3). The model included main effects for (1) synonymy and (2) orthographic similarity and interaction effects of (3) stem word frequency x synonymy, (4) stem word frequency x semantic relatedness x synonymy, and (5) option word frequency x semantic relatedness x synonymy.
The adjusted R2 drops significantly when one of the individual features (i.e., the feature and all of its interactions) is removed from the model. Unsurprisingly, synonymy makes the largest contribution to the explained variance, Δ6-1adj.R 2 = .66, f(4) = 62.74, p < .001. Apart from synonymy, option word frequency and semantic relatedness make the largest contributions to the explained variance, Δ3-1adj.R 2 = .03, f(1) = 10.86, p = .001 and Δ5-1adj.R 2 = .02, f(2) = 5.51, p = .005, respectively.
Intercept
For the intercept parameter, the best model of the stepwise approach includes five features, excluding orthographic similarity, and explains 64% of variance (Table 3). The model includes the main effects of (1) stem word frequency, (2) semantic relatedness, and (3) synonymy, as well as interactions of (4) stem word frequency x semantic relatedness, (5) option word frequency x synonymy, (6) stem word frequency x semantic relatedness x synonymy, and (7) option word frequency x semantic relatedness x synonymy. The four variables stem word frequency, option frequency, semantic relatedness, and synonymy each made individual contributions to the explained variance. Apart from synonymy, semantic relatedness made the largest contribution to the explained variance, of about 5 percentage points.
In sum, each feature explains some variance in the option parameter that determines the trace curves. For both parameters, synonymy is by far the most important variable because it represents correctness (Table 3). However, the degree to which features other than synonymy exert an influence differs between the intercept and slope parameters. First, orthographic similarity only influences the slope parameter. Second, the intercept parameter is more influenced by features other than synonymy, particularly semantic relatedness, and option word frequency. However, the results need to be applied to combinations of option features within items to better understand how they affect the trace curves.
RQ 2: How do the Option Features Influence the Choice of Options?
Stepwise Regression Results Explaining the Option Parameters.
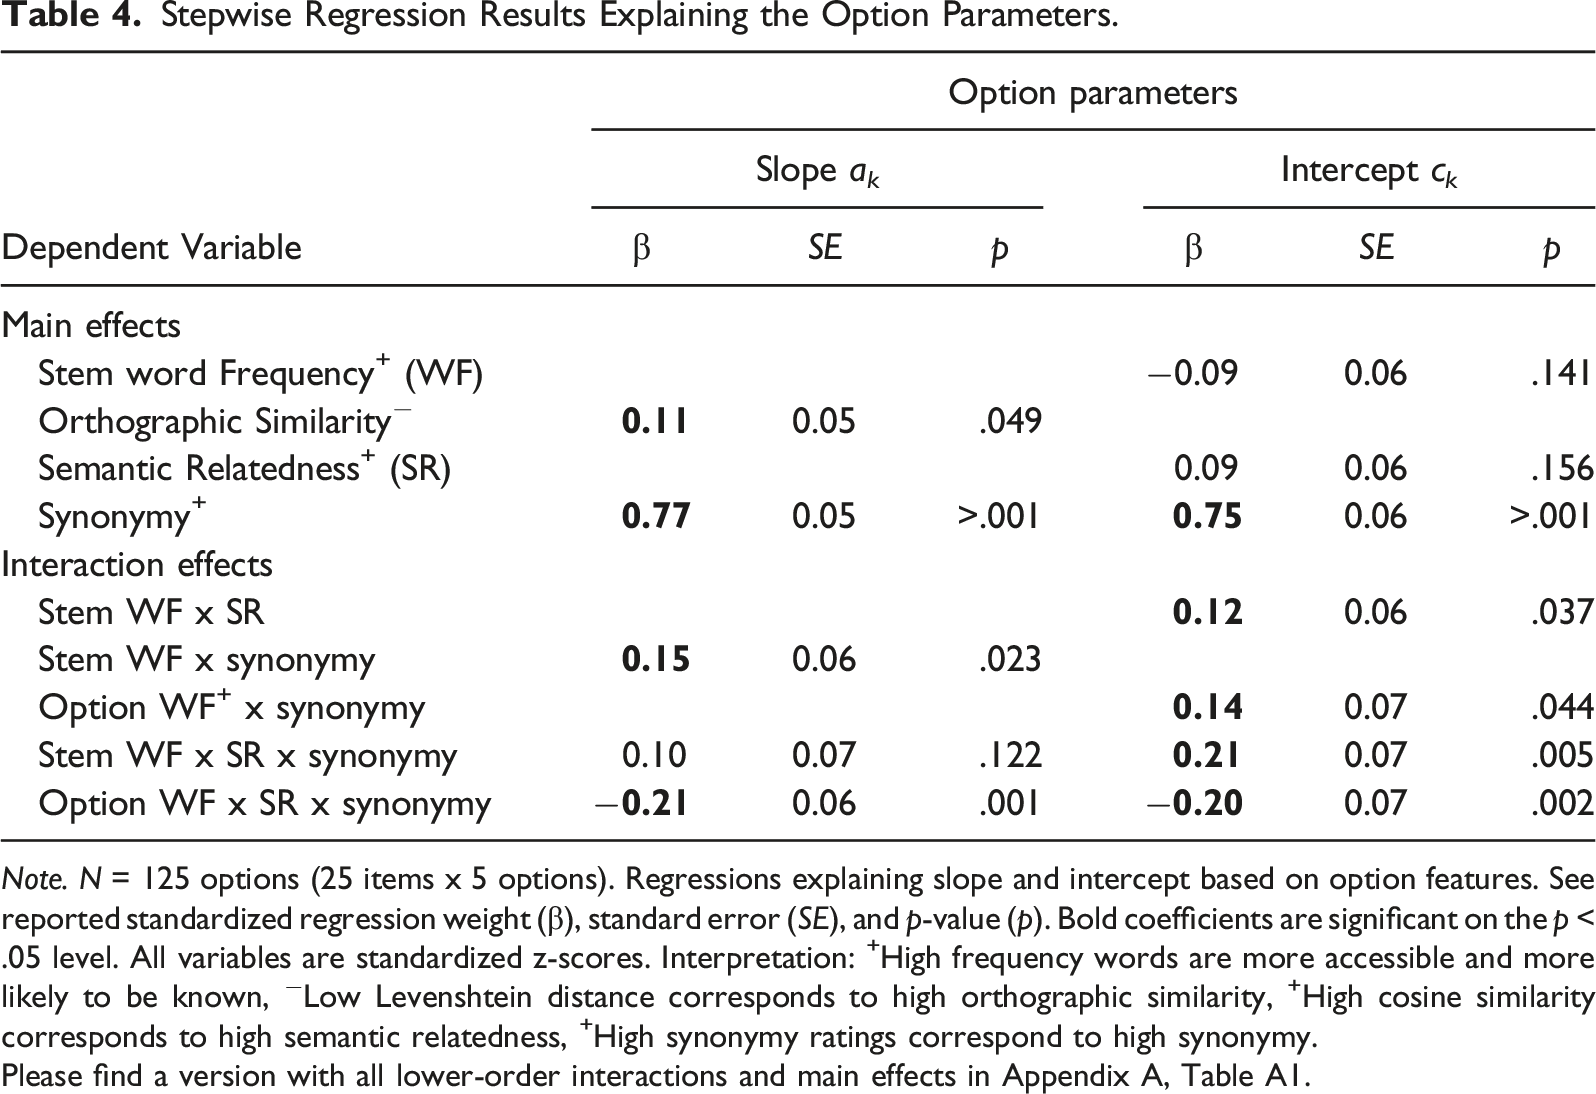
Note. N = 125 options (25 items x 5 options). Regressions explaining slope and intercept based on option features. See reported standardized regression weight (β), standard error (SE), and p-value (p). Bold coefficients are significant on the p < .05 level. All variables are standardized z-scores. Interpretation: +High frequency words are more accessible and more likely to be known, −Low Levenshtein distance corresponds to high orthographic similarity, +High cosine similarity corresponds to high semantic relatedness, +High synonymy ratings correspond to high synonymy.
Please find a version with all lower-order interactions and main effects in Appendix A, Table A1.
Word Frequency (WF)
First, we contrast situations with all possible combinations of high vs. low stem WF and high vs. low option WF (Figure 4). Items with high stem WF (Figure 4, row 1) tend to have higher item discrimination, as indicated by the steeper increase of the trace curve of the strong attractor (red line, solid) compared to the items with low stem WF (Figure 4; row 2). Combination of Different Word Frequencies in Stem and Option. Note. Different combinations of word frequency (WF) of the stem and options in a prototypical combination of features.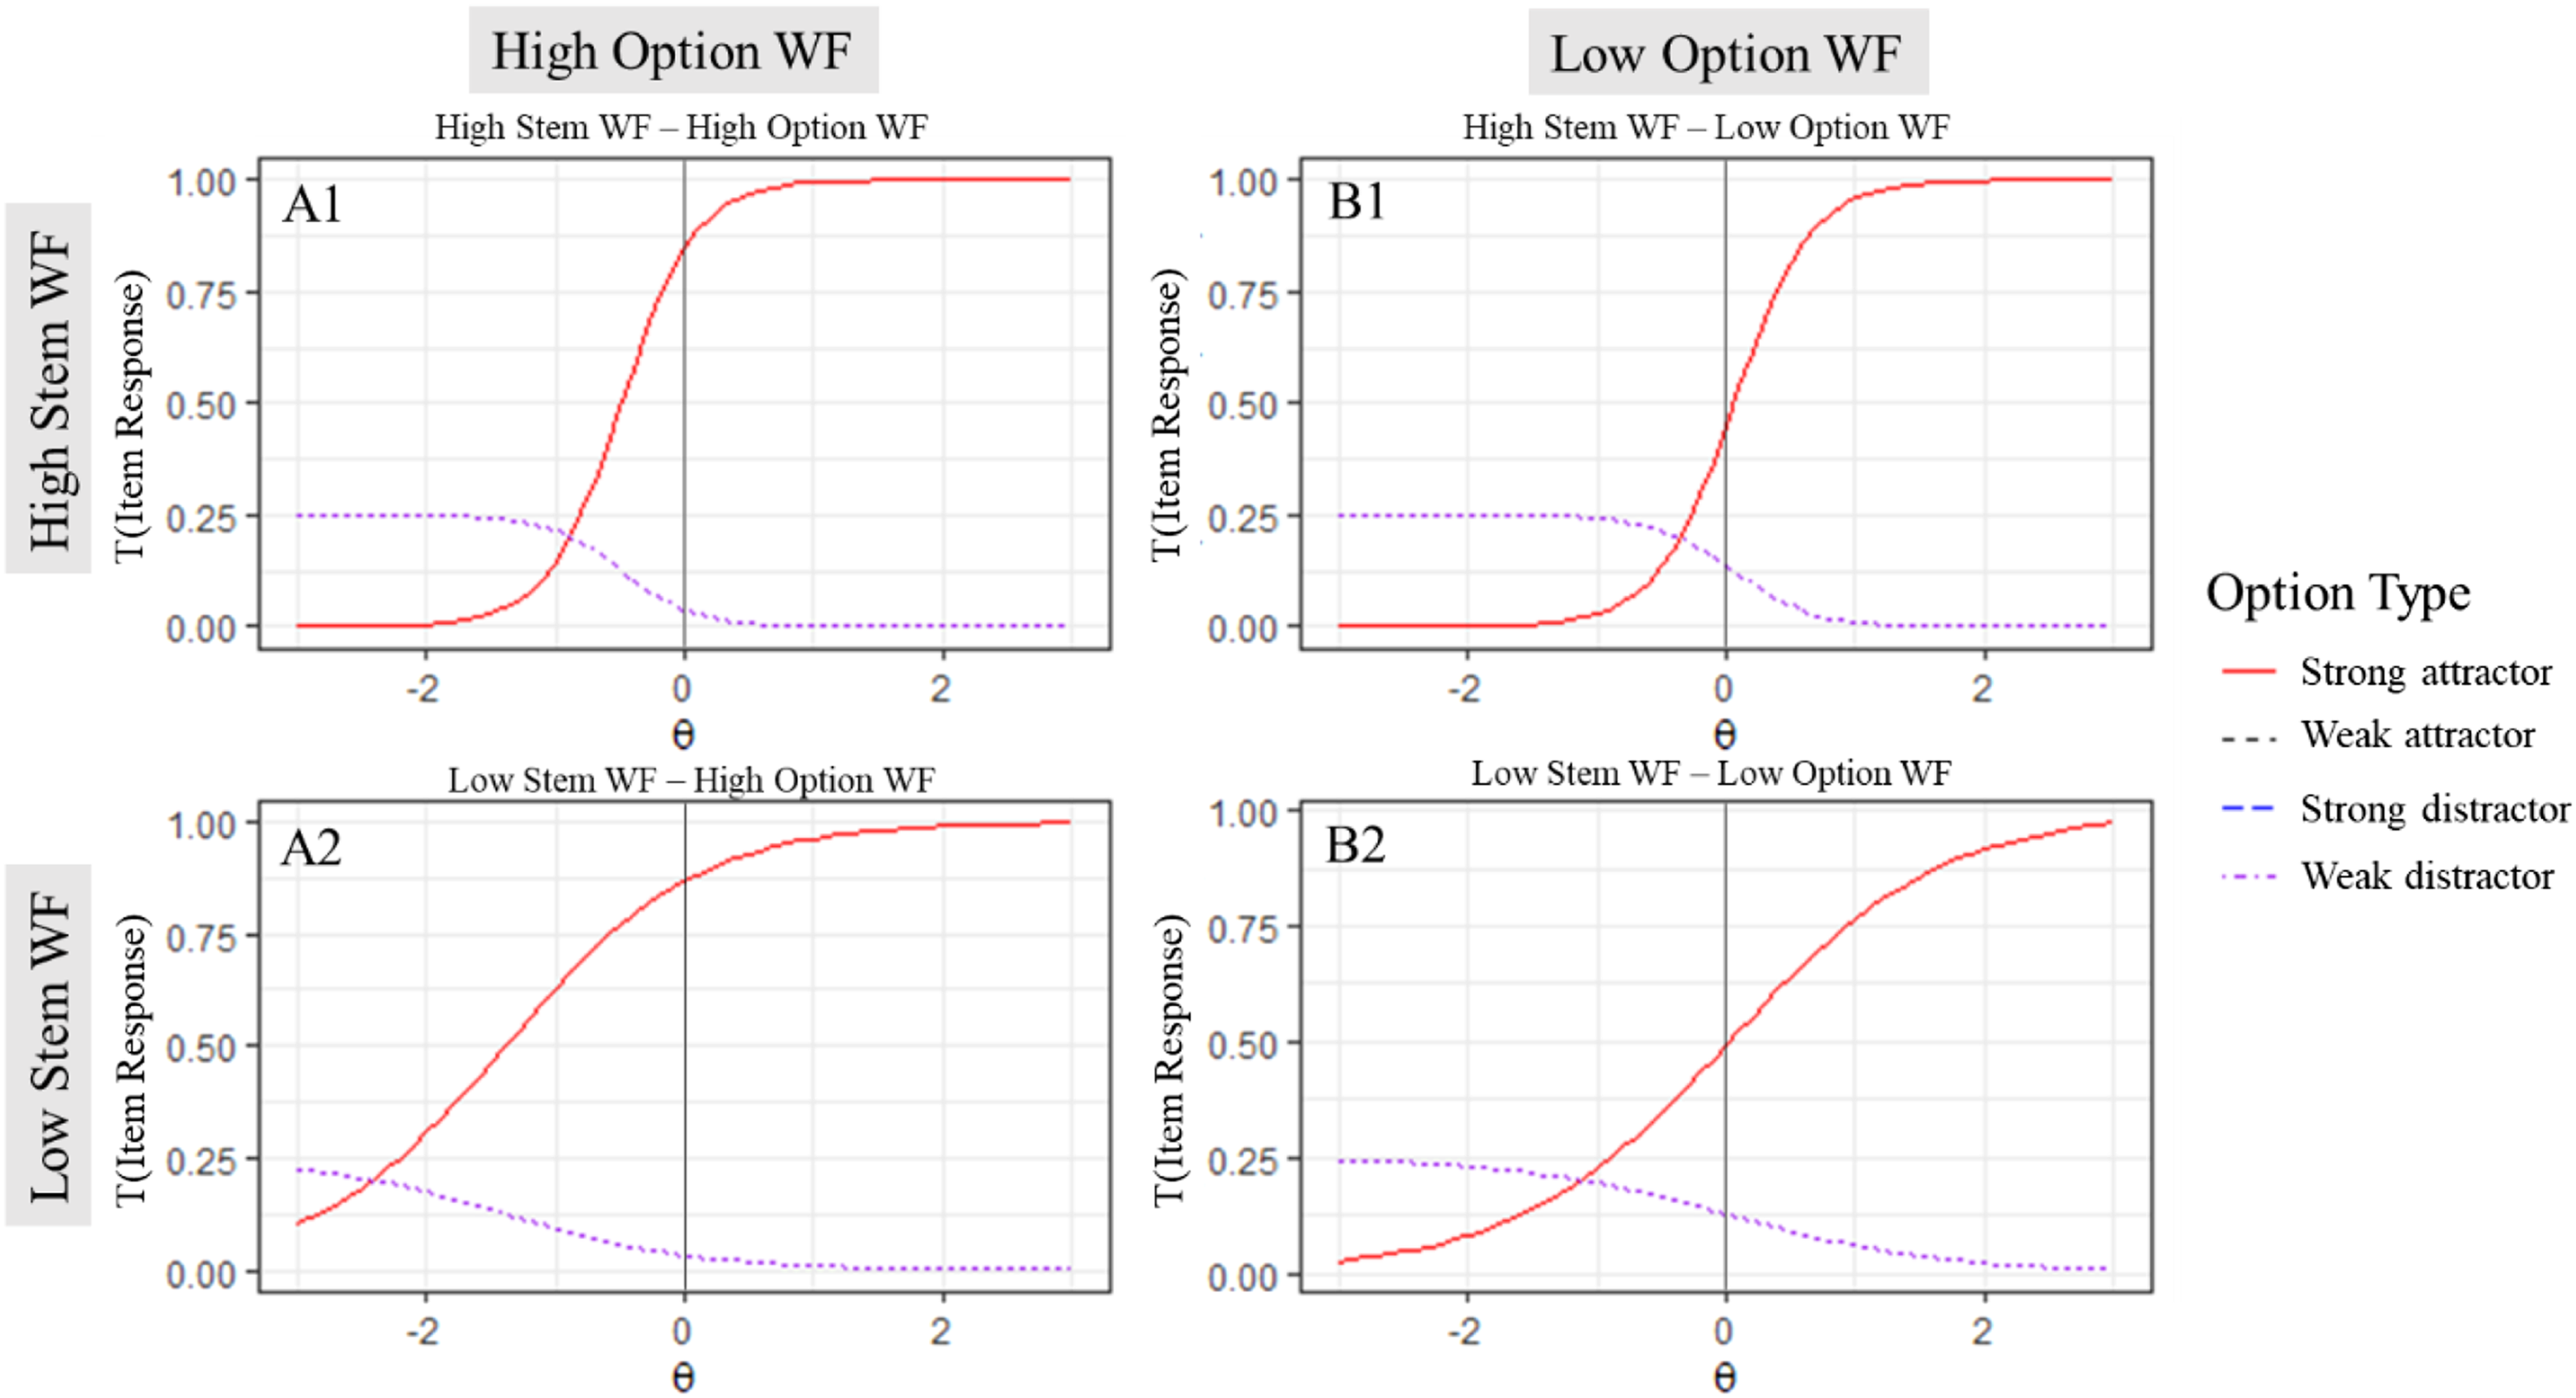
Items with low option WF (Figure 4; column B) tend to be more difficult than items with high option WF (Figure 4; column A), as indicated by their position further to the right on the ability scale (θ). Interestingly, even though the correct word pairs in the combination high stem WF – low option WF (B1) and low stem WF – high option WF (A2) have the same average WF, the expected difficulty of combination B1 is higher.
Relatedness
Distracting Features
The effects of semantic relatedness and synonymy interact with word frequency. Therefore, we display their effects in different WF combinations. Orthographic similarity had only a main effect and no interaction effect (see Table 4). Thus, we only display the effect in one prototypical combination of features.
Orthographic Similarity
We contrast situations in which a distractor has low, mean, and high orthographic similarity in an item with high stem WF and low option WF. The effect of orthographic similarity is analogous in all WF combinations. In general, low-ability students had a higher probability of choosing options with high orthographic similarity (Figure 5). Influence of Orthographic Similarity. Note. Distractors with high (Levenshtein distance = 4), mean (Levenshtein distance = 6), and low (Levenshtein distance = 8) orthographic similarity in a prototypical feature combination with high stem word frequency and low option word frequency.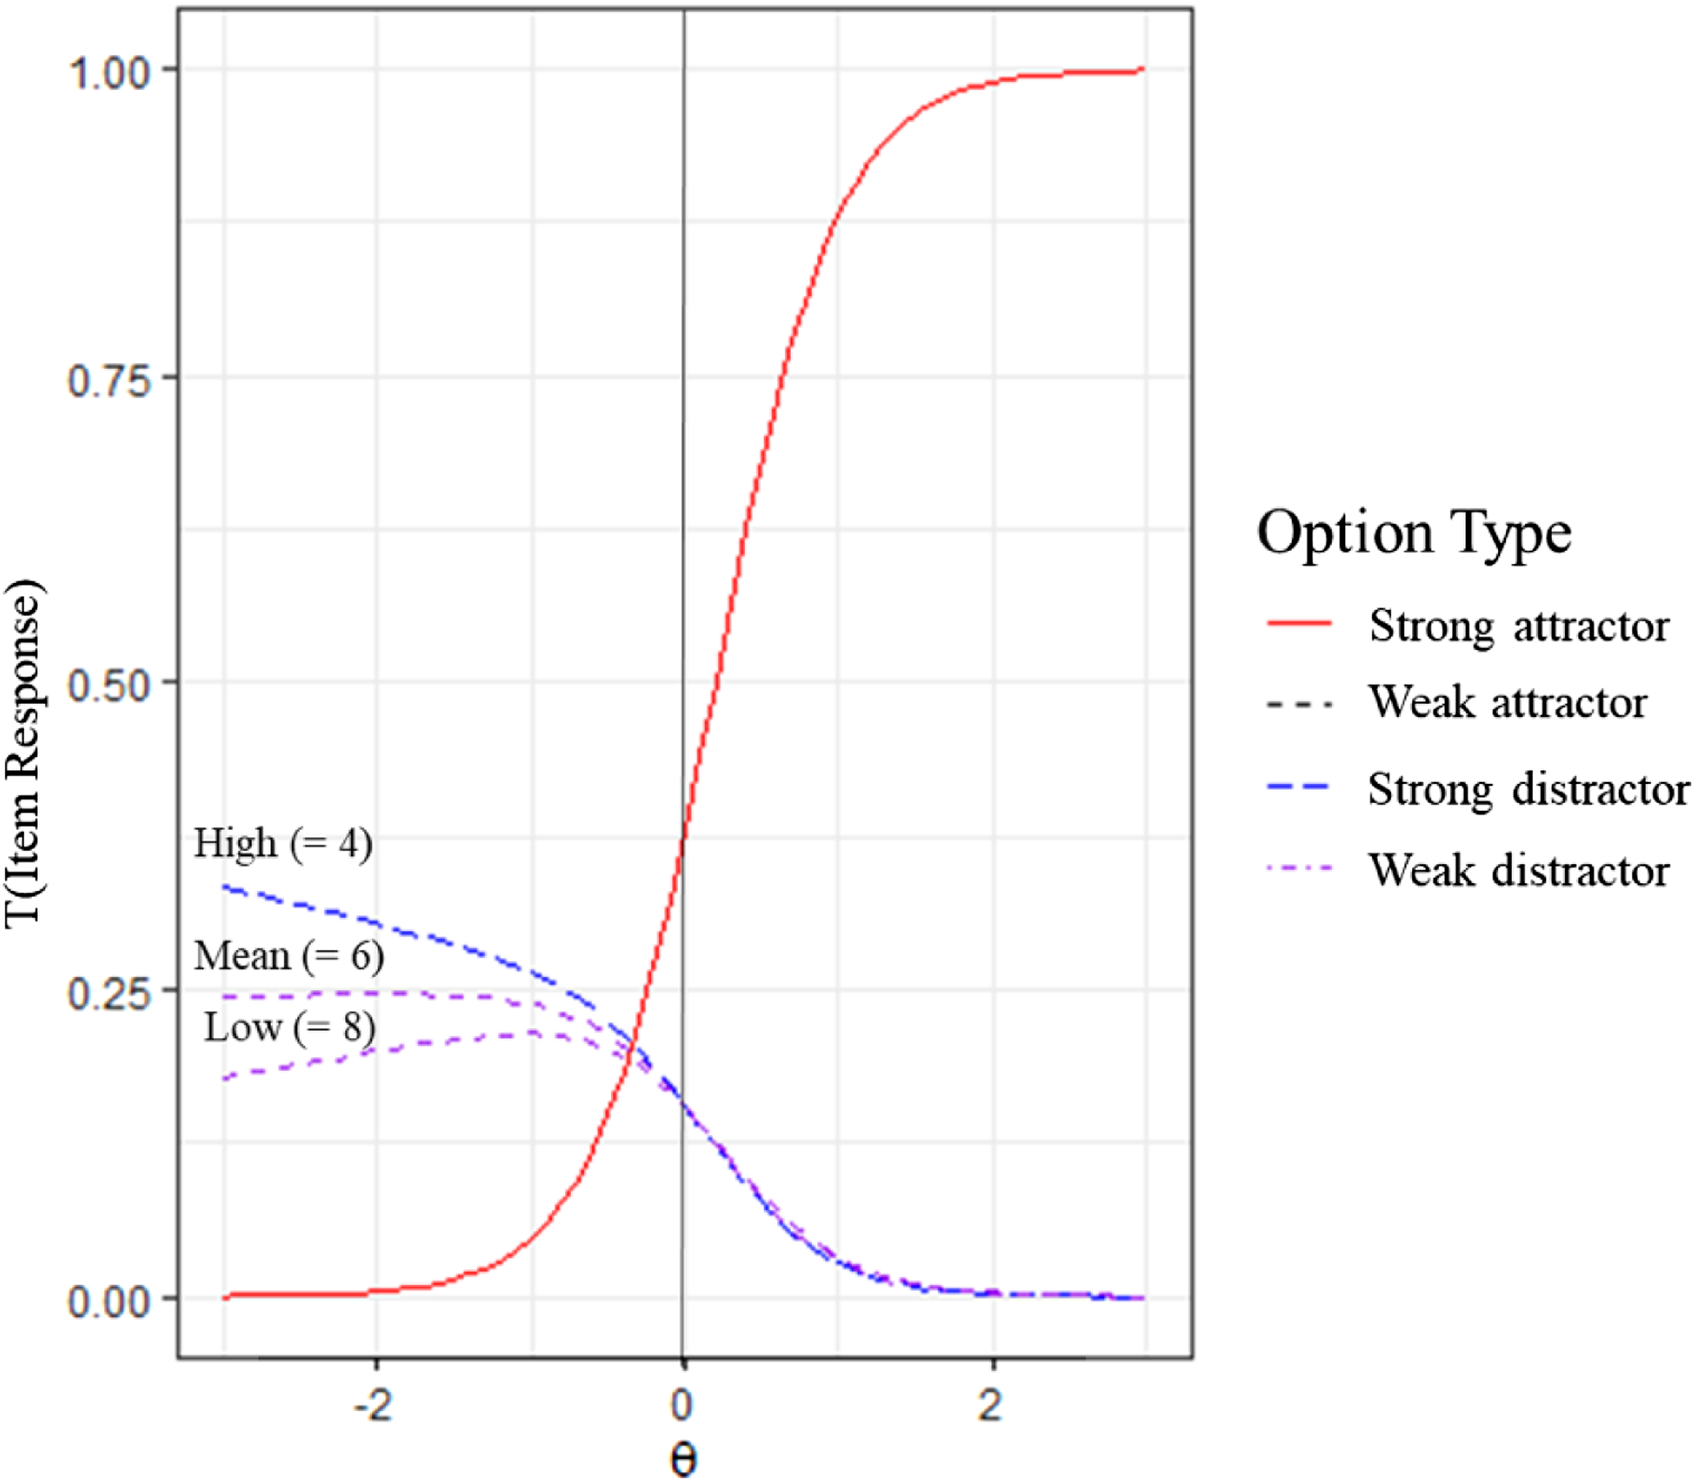
Semantic relatedness
Generally, semantic relatedness made distractors more attractive (Figure 6). However, the effect of semantic relatedness was much more pronounced when the stem WF was high (Figure 6; row 1) than in items with a low stem frequency (Figure 6; row 2). In items with a high stem WF, low option WF and a highly semantically related distractor, this distractor was most attractive to mean-ability students (i.e., θ = 0; Figure 6; B1). Semantic Relatedness in Different WF Combinations. Note. High (Cosine similarity = .8) and mean (Cosine similarity = .5) semantic relatedness in different word frequency (WF) combinations.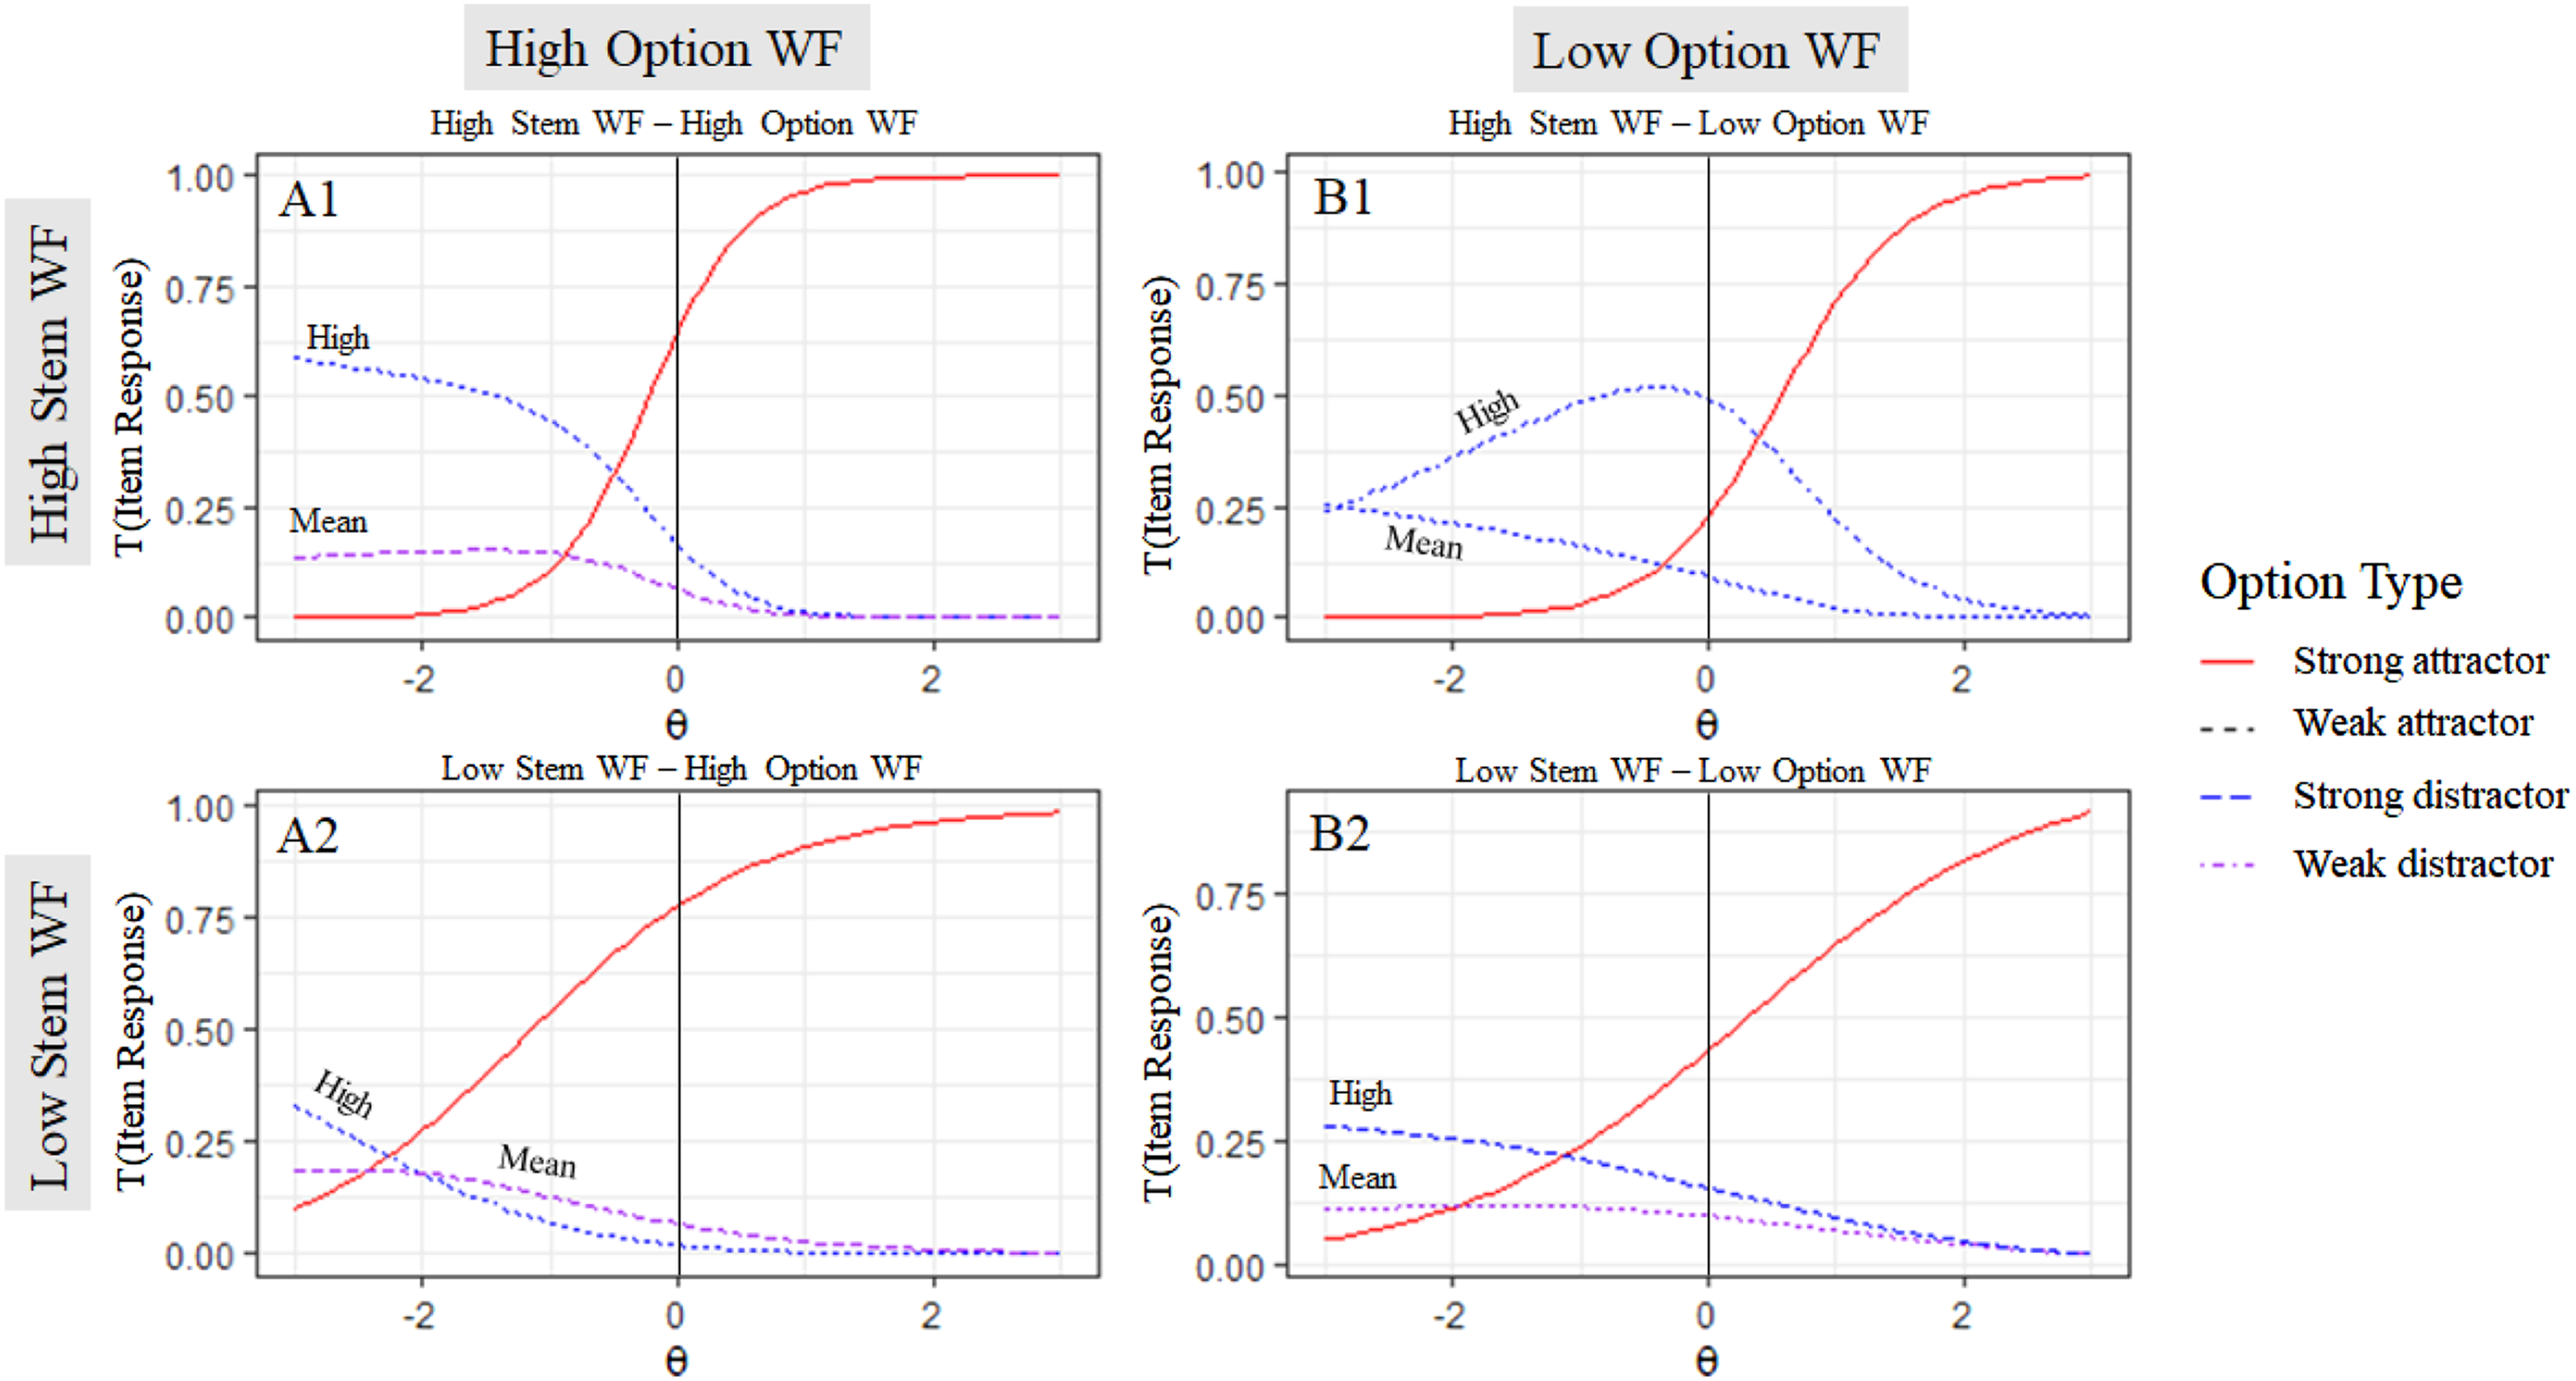
Synonymy
We graphed the expected trace curves for an item with one distractor that becomes progressively (synonymy ratings of 3, 4, 4.5, and 4.7) more similar to the key option (synonymy rating of 5; Figure 7). In summary, discrimination decreases when the distractor becomes more synonymous with the key option. In contrast, the position on the x-axis (i.e., difficulty) of the strong attractor (i.e., key option) did not change substantively. Nonetheless, the distractor can be quite similar to the key option in terms of synonymy, in which case the trace curves display a strong attractor and distractor. However, low synonymy differences eventually lead to an item with two weak attractors. The point at which this occurs depends on the feature combination. For example, if the stem WF is high and the option WF is low, the critical threshold is a synonymy difference of 0.3 (i.e., 5 – 4.7 = 0.3; Figure 7; D1). On the other hand, if the stem WF is low and the option WF is high, the critical threshold is a synonymy difference of 0.5 (5 – 4.5 = 0. 5; Figure 7; C2). Relationship Between Synonymy and Word Frequency. Note. Different degrees of synonymy (3, 4, 4.5, and 4.7) in distractor options (columns 1–4) in items with two different WF combinations (rows 1 and 2).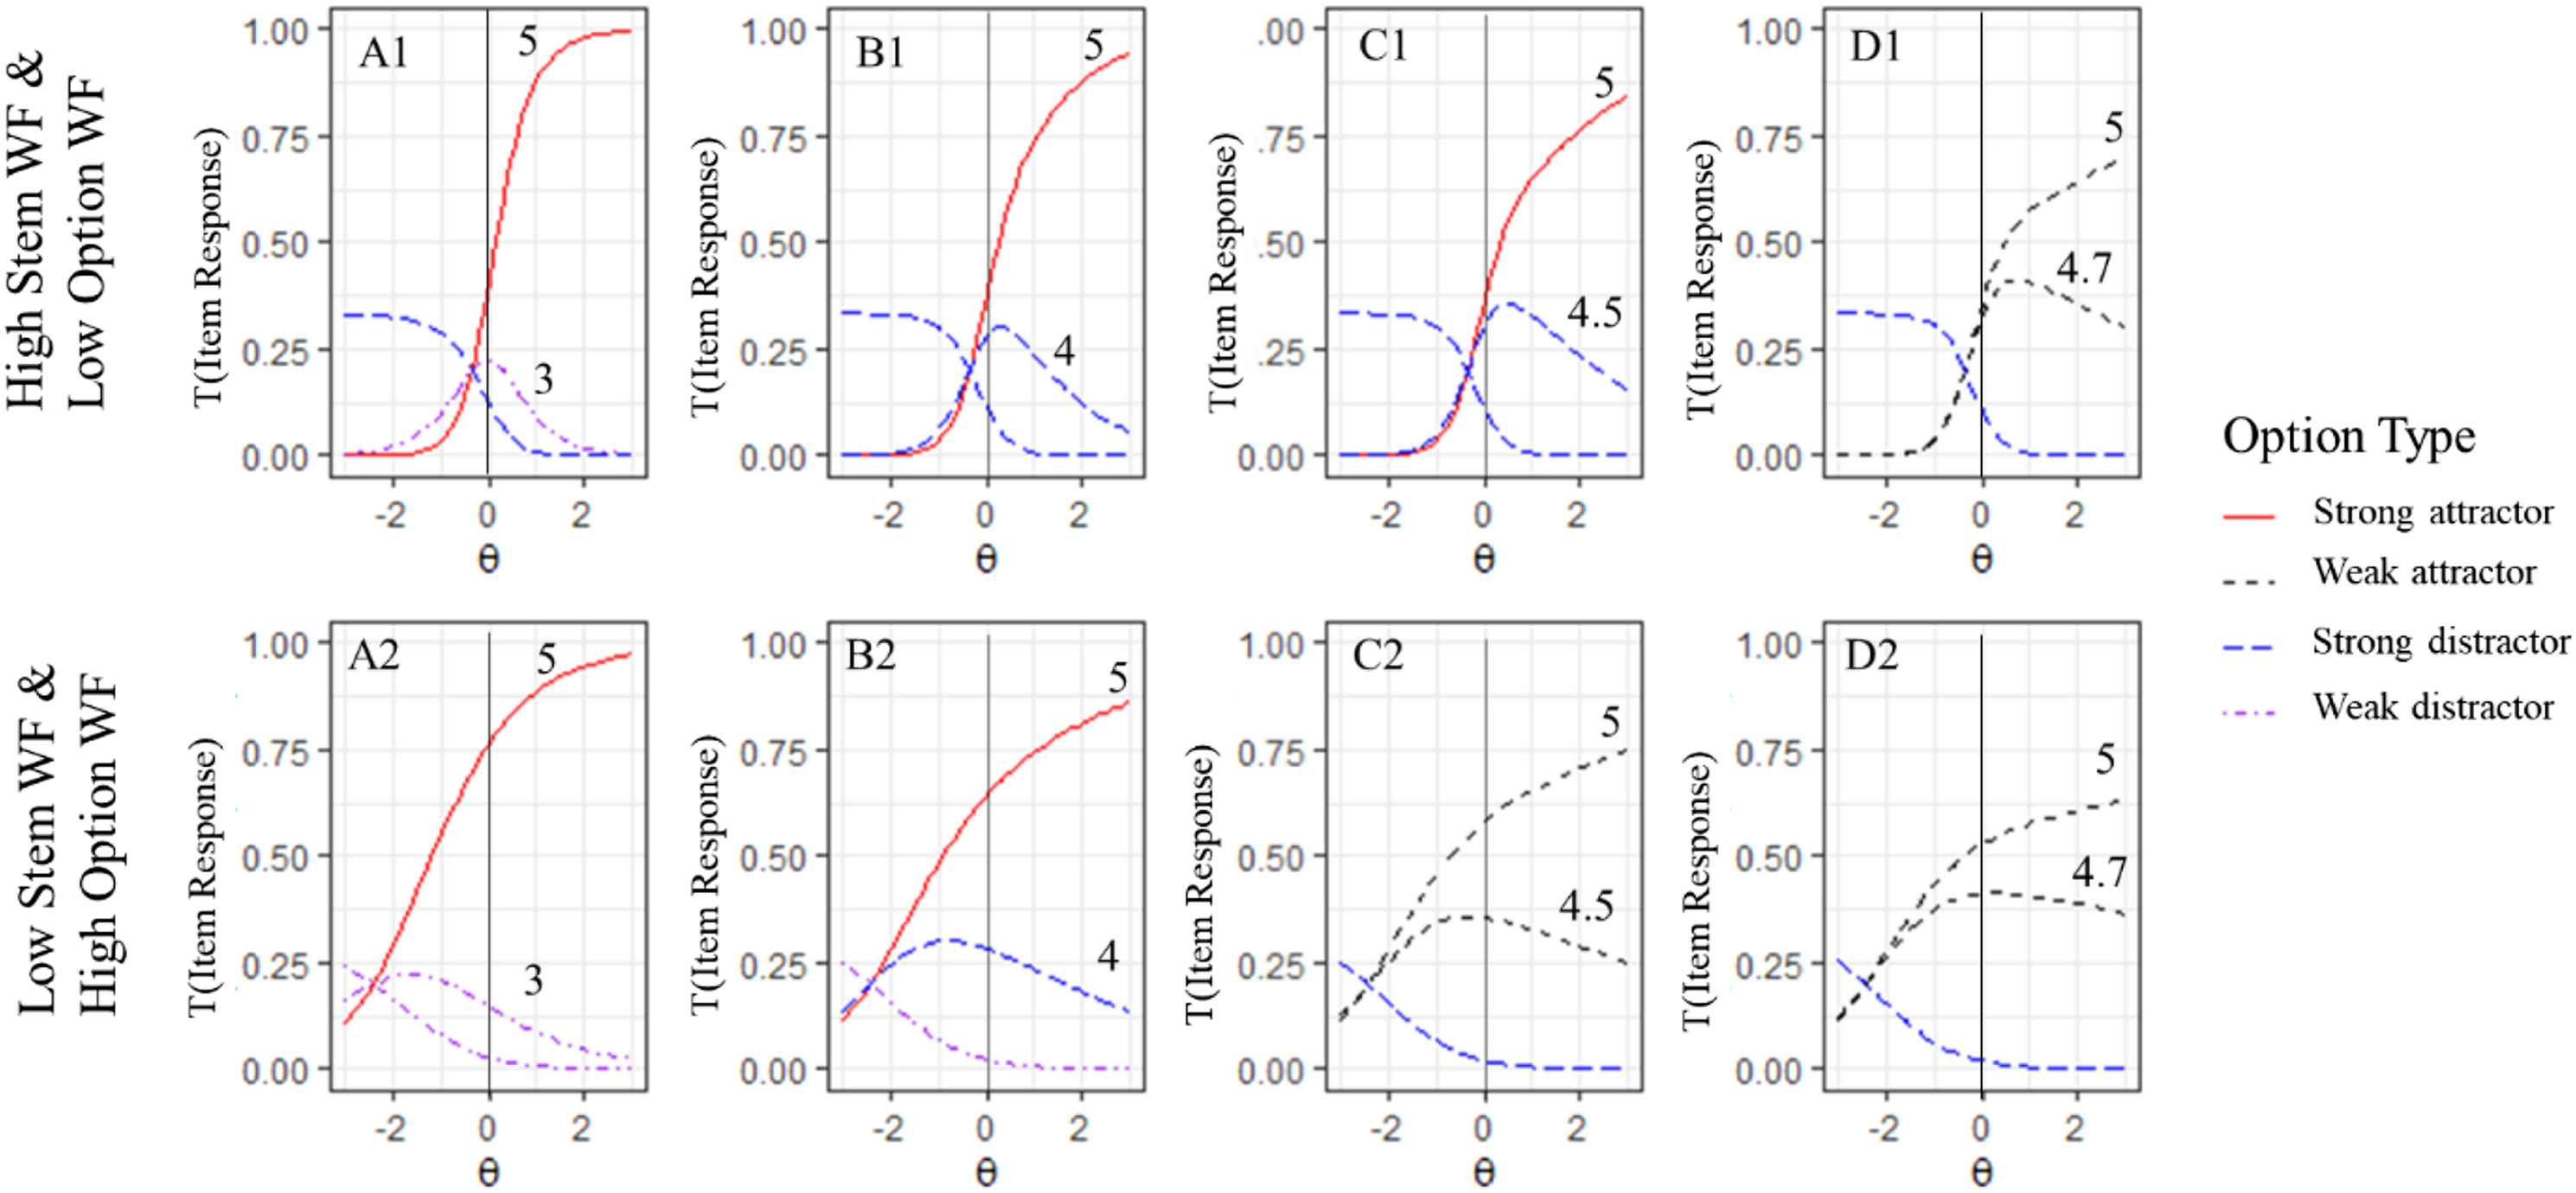
Discussion and Conclusion
A better understanding of how option features influence item’s psychometric characteristics is vital for theoretically grounded, evidence-based construct definitions, test score interpretations, and item generation (Embretson & Gorin, 2001). Therefore, this study investigated for the first time how option features in synonym-based vocabulary tests relate to option choices relative to children’s vocabulary knowledge. First, we extracted the option features, word frequency, orthographic similarity, semantic relatedness, and degree of synonymy from a standardized vocabulary test with 25 items. Then, we analyzed the relationship between option features and option parameters in a nominal categories model based on responses by 945 fourth-grade students.
The results indicated that all examined features (stem word frequency, option word frequency, orthographic similarity, semantic relatedness, and rated synonymy) explain the option parameters. However, synonymy was by far the most essential feature. The other features added between 1 and 5 percentage points explained variance in the option parameters.
Word frequency has a well-documented effect within the lexical decision paradigm (e.g., Milin et al., 2017). Our results suggest that stem word frequency changes the response process in multiple-choice vocabulary tests by interacting with semantic relatedness and synonymy. When the stem word frequency is low, students who do not know the item stem word are more likely to guess an option randomly. In contrast, if the stem word frequency is high, students associate meaning to the stem, meaning incorrect options can be more distracting. Thus, word frequency interacts with item difficulty and item discrimination. These findings add to the rich literature on the broad range of word frequency effects in different areas of human verbal behavior (for a review, see Brysbaert et al., 2018). Furthermore, these findings support the notion that whether critical information is in the stem or the response option can change a test’s psychometric characteristics (e.g., for mathematics assessments in sixth grade, see Kan et al., 2019)
Orthographic similarity and semantic relatedness can have a distracting effect. Orthographic similarity distracts very low-ability students, whereas semantic relatedness can distract even higher-ability students from the most synonymous option. Furthermore, semantic relatedness is more distracting when the stem word frequency is high. This indicates that semantic relatedness attracts students who associate some meaning to the word pair but not enough to distinguish between semantic relatedness and synonymy. Finally, options with a minor degree of synonymy decrease item discrimination. These findings align with previous research suggesting that items become more difficult when distractors are redesigned to be equivalent in content but more similar on a surface level (e.g., Ascalon et al., 2007).
The results stress at least two critical aspects. First, the word frequency of the stem and the option affect the entire response process. In items with high stem word frequencies, students are more likely to know multiple options and consequently have to distinguish between semantically related and synonymous options. This could be considered evidence for the assumption that items with high-frequency word stems measure greater vocabulary depth than those with low-frequency stems, since low-frequency stems test which words students know. In contrast, high-frequency stems test how well students can distinguish the strength and quality of the relation between two words.
Second, distractors that are plausible because they distract lower-ability students from the correct answer increase the item discrimination, but distractors that are plausible because they have a minor degree of correctness (i.e., weak synonym) decrease the item discrimination. Therefore, test developers should try to construct clearly incorrect options that are distracting and not options with a modest degree of correctness. While this is generally consistent with current item-writing guidelines (e.g., Haladyna & Downing, 1989), it may not be emphasized enough.
Item Construction Rules for Vocabulary Tests
Assuming the goal is to construct a vocabulary depth test that is likely to fit an IRT model with homogeneous ICC (e.g., Rasch model) that contains items with large variations in item difficulty, our analysis leads to the following recommendations: • The word frequency of the stem should be higher than that of the options to allow the options to be distracting and the items to be discriminating. • Include a large variation in word frequency to create variation in item difficulty. • Use some distractors with high orthographic similarity to distract very low-ability students from the correct answer. • Use some highly semantically related distractors to distract students with relatively low ability from the correct answer. • Use distractors with a substantively lower degree of synonymy than the correct answer to avoid the weak attractor effect.
Multiple-Choice Item Construction
All of the six most popular item-writing guidelines include “use plausible distractors” as their highest-priority recommendation (Gierl et al., 2017). Plausibility influences psychometric characteristics such as item difficulty and discrimination (e.g., Ascalon et al., 2007). Our results add that distractors with features that distract lower-ability students from the correct answer have the desirable effect of increasing item difficulty and item discrimination. Further, our results raise concerns about using distractors with a modest degree of correctness because they also attract high-ability students, leading to decreased item discrimination.
The distracting and correctness features are probably not as clearly separable in tests of constructs other than synonym-based vocabulary knowledge. Nevertheless, better advice for test developers may be to “use plausible distractors that are still clearly incorrect” or “use options that distract relatively low-ability students from the correct answer.”
Limitations and Outlook
This analysis is based on a large student sample but a relatively small item sample. It would be beneficial to systematically replicate the analysis with similar tests or include external manipulations to increase external validity. Ideally, the analysis should be replicated with a larger set of items. However, meaningful analysis with the nominal categories model requires many responses per item and option. Hence, most studies quickly ran into practical limitations and we had no access to a better dataset.
The current study focused on features that are theoretically relevant and well-researched. However, it might be beneficial to consider more features in future research. One such feature could be the type of semantic relationship with plausible but incorrect distractors, since there are likely differences between antonyms and, for example, metaphors. Also, many other word characteristics, such as morpheme length and orthographic similarity (Kerns & Hiebert, 2022), as well as combinations of word frequency from different corpora (Ludewig et al., 2022a) and variety of frequency related corpora statistics (Chen & Meurers, 2018) may be essential and should be considered in future research.
This study analyzed the relationships between option features, item discrimination, and item difficulty based on the trace curve of the most attractive response option. However, trace curves in the nominal categories model can differ from item characteristic curves (ICC) in logit or normal-ogive binary item response models. Therefore, the effect demonstrated for trace curves may deviate from the effect for classic ICCs. Nevertheless, the results should be largely comparable in tendency. Nevertheless, the method should be further refined in future research.
Moreover, in future research, the item feature model can automatically generate items with desirable characteristics. There are freely available databases with synonym ratings (Scheible & Im Walde, 2014), pre-trained embeddings for the evaluation of semantic relatedness (http://vectors.nlpl.eu), and datasets for word frequency (Schroeder et al., 2015). This could facilitate the automatic construction of synonym-based vocabulary tests with desirable characteristics for different applications.
In addition, due to technical and score restrictions in large-scale studies, many test developers in psychological and educational assessment need to use MC test formats. However, they struggle to construct challenging and discriminative items. The presented method could help to improve item construction in many different content domains.
Footnotes
Declaration of Conflicting Interests
The author(s) declared no potential conflicts of interest with respect to the research, authorship, and/or publication of this article.
Funding
The author(s) disclosed receipt of the following financial support for the research, authorship, and/or publication of this article: This work was supported by the Federal Ministry for Education and Research under Grant Numbers 01JI1504A and B.
Data Availability
Appendix
Stepwise Regression Results With All Lower-Order Interactions and Main Effect Explaining the Option Parameters. Note. N = 125 options (25 items x 5 options). Regressions explaining slope and intercept based on option features. See reported standardized regression weight (β), standard error (SE), and p-value (p). Bold coefficients are significant on the p < .05 level. All variables are standardized z-scores. Interpretation: +High frequency words are more accessible and more likely to be known, −Low Levenshtein distance corresponds to high orthographic similarity, +High cosine similarity corresponds to high semantic relatedness, +High synonymy ratings correspond to high synonymy.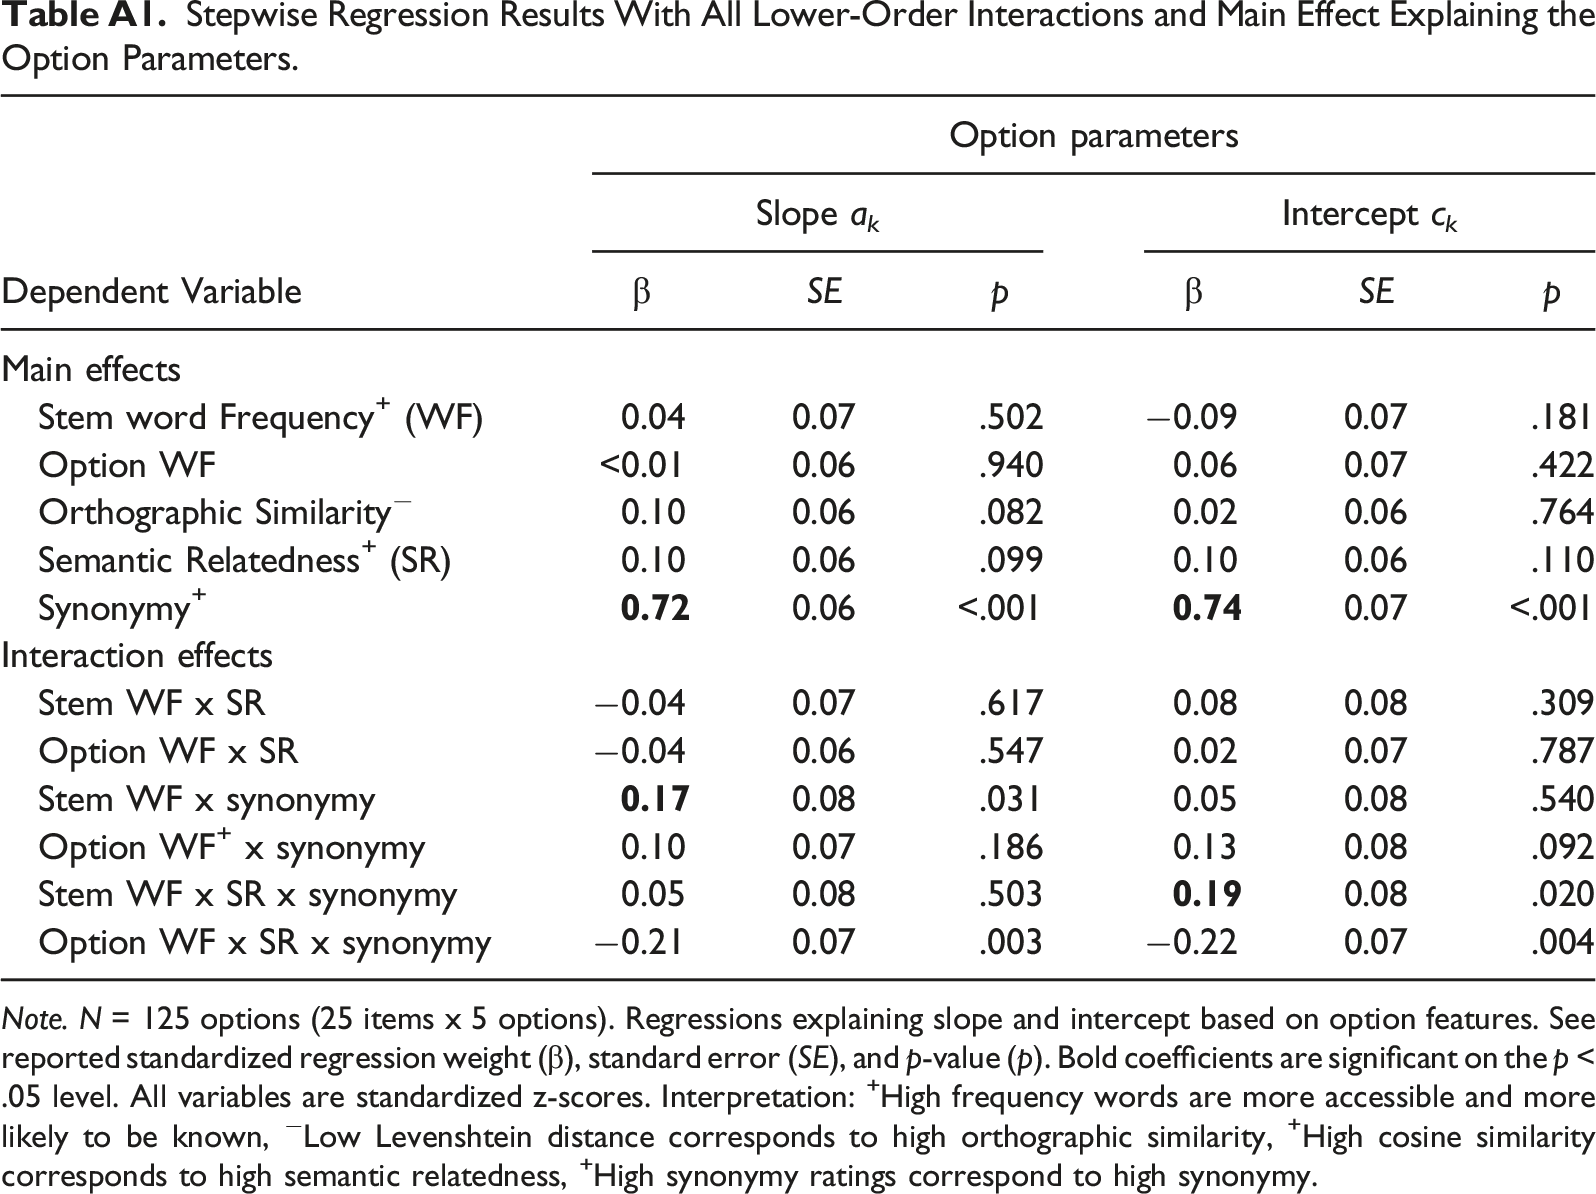
Dependent Variable
Option parameters
Slope a
k
Intercept c
k
β
SE
p
β
SE
p
Main effects
Stem word Frequency+ (WF)
0.04
0.07
.502
−0.09
0.07
.181
Option WF
<0.01
0.06
.940
0.06
0.07
.422
Orthographic Similarity−
0.10
0.06
.082
0.02
0.06
.764
Semantic Relatedness+ (SR)
0.10
0.06
.099
0.10
0.06
.110
Synonymy+
0.06
<.001
0.07
<.001
Interaction effects
Stem WF x SR
−0.04
0.07
.617
0.08
0.08
.309
Option WF x SR
−0.04
0.06
.547
0.02
0.07
.787
Stem WF x synonymy
0.08
.031
0.05
0.08
.540
Option WF+ x synonymy
0.10
0.07
.186
0.13
0.08
.092
Stem WF x SR x synonymy
0.05
0.08
.503
0.08
.020
Option WF x SR x synonymy
−0.21
0.07
.003
−0.22
0.07
.004