
Abstract
Academic procrastination has a significant influence on students’ lives, being related to several relevant variables, such as lower self-esteem, higher levels of academic anxiety, and fear of failure. The development and adaptation of reliable instruments help to assure a more in-depth study of academic procrastination. The present research aimed to adapt and assess evidence of validity and reliability of the scores of the Academic Procrastination Scale (APS) for a Brazilian sample (N = 1241). In Study 1, an exploratory factor analysis supported the unidimensional structure of the APS (25 items). In Study 2, the one-factor structure had an adequate model fit via confirmatory factor analysis. Also, through item response theory, the APS items showed adequate discrimination, difficulty, and level of information. The scores of the APS were also significantly correlated with the scores of the Tuckman Procrastination Scale, providing evidence of convergent validity.
Introduction
It is common to see people postponing day-to-day activities for no compelling reasons, for instance, postponing answering an email, doing a household task, or even paying bills. Such delays are not uncommon in the general population (15–20%; Harriott & Ferrari, 1996) and are known as procrastination. This variable is defined as a pattern of behavior that involves frequent delays in starting and/or completing tasks until the deadline (McCloskey, 2011). It is a dimension that has positive and significant associations with depression, anxiety, and stressful symptoms (Tice & Baumeister, 2018) and impacts different contexts of individuals’ lives, such as personal, social, professional, and academic (Ulgener et al., 2020). Due to its relevance, it is essential to identify suitable ways to measure the construct to increase the quality of knowledge in the area.
Procrastination is a common practice among university students. Previous studies show that its prevalence is higher than the general population (Balkis & Duru, 2009; Closson & Boutilier, 2017; Steel 2007), occurring with students of all age groups and education levels (Mccloskey & Scielzo, 2015). Solomon and Rothblum (1984) described this tendency of academic procrastination as delaying completing homework, preparing for exams, or finishing essays at the last moment of the due date. This behavior in the academic scenario often becomes recurrent among students, impairing their performance (Closson & Boutilier, 2017; Kim et al., 2017) and self-esteem (Batool et al., 2017), as well as favoring the presence of high levels of academic anxiety (Yang et al., 2019), fear of failure (Abdi Zarrin & Gracia, 2020), and academic exhaustion (Abdi Zarrin et al., 2019).
The study of academic procrastination started in the 1980s due to the phenomenon’s prevalence among students (Solomon & Rothblum, 1984). One of the most prominent studies in the decade was conducted by Solomon and Rothblum (1984), who investigated why 342 U.S. university students procrastinated, identifying the fear of failure and task aversiveness as the primary motives. Since then, the topic has been studied in different cultures (e.g., Brando-Garrido et al., 2020; Kim et al., 2017), pointing to potential cultural differences. For instance, Mann et al. (1998) identified that East Asian students (i.e., Japanese, Taiwanese, and Hong Kong students) scored higher in academic procrastination when compared to Western students (i.e., U.S., Australian, and New Zealand students). More recently, Košíková et al. (2019) compared the scores of students from Ukraine and Slovakia and found that Slovaks scored higher than Ukrainians. Other differences may occur due to the procrastination profiles, as observed by Özberk and Kurtça (2021). The authors compared Turkish and international students (e.g., Albanian, Bosnian and Herzegovinian, and Greek students) and identified different profiles in the two groups regarding general and academic procrastination characteristics. Despite the significant results, it is essential to highlight the need for more trans-cultural data on academic procrastination. In a meta-analysis conducted by Steel (2007), the author identified that approximately 88% of the research on general procrastination was carried out in the North American context (i.e., U.S. and Canada), with results not showing any significant differences between the two countries.
In the Brazilian context, research on academic procrastination has focused on the evaluation of its correlates. For instance, Soares et al. (2020) assessed the influence of academic procrastination on students’ subjective well-being and satisfaction in a postgraduate program. Their results showed that academic procrastination negatively predicted subjective well-being and positively predicted satisfaction with a postgraduate program. In another research study in Brazil with university students, Melo and Mendonça (2020) assessed the mediating role of self-leadership strategies in the relation between academic procrastination and environment support. Their results corroborated their hypothesis that self-leadership strategies reduce procrastination levels and the influence of environmental support. Despite these significant findings, studies in Brazil about procrastination are still scarce. Therefore, given the prevalence of procrastination in the academic context and its potential adverse effects, it is necessary to have psychometrically sound instruments for its measurement. The scores of these reliable questionnaires would allow the development of high-quality research. Therefore, the present research study aimed to adapt the Academic Procrastination Scale (APS; McCloskey, 2011) in Brazil.
Assessing Procrastination: The Academic Procrastination Scale
Previous research has mainly used self-report instruments to measure procrastination. In the Brazilian context, three validated tools were identified. First, the Academic Procrastination Scale–Reasons (Geara et al., 2017) assesses university students’ perception about the frequency and reasons associated with students’ procrastination of academic tasks. The instrument consists of eight items and assesses two factors (procrastination-demotivation and procrastination-anxiety) that represent trends towards academic procrastination. The reliability of the factors was only modest (Cronbach’s α = .61 and .76, respectively), and no validation or adaptation studies have been conducted.
Second, the Academic Procrastination Questionnaire - Negative Consequences (Geara & Teixeira, 2017) measures students’ perception of academic procrastination and its negative consequences in different life spheres (i.e., academic, physical, and psychological). The questionnaire is divided into six independent scales: the Overall Impact Scale (8 items, α =.84), Academic Consequences Scale (academic results subfactor, eight items, and α =.88; academic task management subfactor, 11 items, and α = .84), Physical Consequences Scale (substance use subfactor, four items, and α =.72; self-care reduction subfactor, 13 items, and α = .91), Psychological Consequences Scale (psychological exhaustion subfactor, eight items, and α = .92; personal dislike subfactor, five items, and α = .94) and the Behavior Change Scale (need to change subfactor, four items, and α =.87; interest in being helped subfactor, four items, and α = .92). No adaptation studies have been found, and no studies have been conducted to validate the six-factor structure.
Finally, the Brief Inventory of Academic Procrastination (Geara et al., 2019) is a unidimensional measure that assesses academic procrastination behaviors. The measure consists of 20 items. The internal consistency reliability for the Brief Inventory of Academic Procrastination scores was reported to be .91. However, no further studies have been conducted to validate the one-factor structure or adapt the instrument in Brazil or other contexts.
Despite their contributions, it is essential to highlight that these questionnaires assess general aspects of academic procrastination (e.g., reasons, perception, and consequences), instead of the academic construct per se. One alternative to cover this limitation was proposed by McCloskey (2011), who developed the Academic Procrastination Scale (APS), using a sample composed of 681 students. The unidimensional measure consists of 25 items, answered on a five-point Likert scale. The scores of the measure have satisfactory internal consistency reliability (α = .94) and significant convergent validity evidence when correlated with the scores of other procrastination measures (Tuckman Procrastination Scale; r = .84).
Among the advantages identified in the APS compared to the other measures used with samples of Brazilians, three points stand out. The first is that the instrument presents a clear definition of academic procrastination, whose items seek to reflect activities in the academic and school context exclusively. Second, the APS has been widely used in surveys to measure academic procrastination, presenting significant associations with different constructs. For instance, stress (Muliani et al., 2020), achievement motivation (hope of success and fear of failure; Akmal et al. ., 2017), and self-efficacy and academic achievement (Batool, 2020; Itani, 2019). Finally, as an alternative to save time and avoid participants’ burden (Coelho et al., 2020), Yockey (2016) proposed a shortened version of the tool, composed of the best five items of its original version. The short form of the Academic Procrastination Scale (APS-S) scores showed adequate reliability (α = .87). The APS-S has been validated in other countries, including Spain (Brando-Garrido et al., 2020) and India (Chakraborty & Chechi, 2019).
The Present Research
Academic procrastination can take place over a long period. When not identified and addressed, it can impact the self-image and lead to stereotypes about the student (Ahmad, 2019). Its impact can persist beyond the academic life, affecting a future professional role (Ahmad, 2019). In other words, it is a severe problem that needs to be addressed early in life. To better assess the construct, it is important to accumulate evidence that supports the interpretation of the scores of the measure (American Educational Research Association et al., 2014). Therefore, knowing the impact of academic procrastination and the need to understand its underlying mechanisms better, the present research aimed to adapt and assess the psychometric properties of the APS in a Brazilian sample. To achieve our goals, we performed two studies with 1241 Brazilian students. We assessed the psychometric properties of the APS through a combination of procedures, including exploratory factor analysis (EFA), confirmatory factor analysis (CFA), and item response theory (IRT; item discrimination, difficulty, information). The factor analytic and IRT techniques have different goals and complement each other. In Study 1, we used EFA, which allows assessing the structure of the APS in a new context, such as Brazil. Therefore, despite the promising results with the APS cross-culturally (e.g., Brando-Garrido et al., 2020; Chakraborty & Chechi, 2019), the performance of an EFA helps avoid any cultural influence on the structure by identifying whether the factor structure in this study is different from those identified in other cultures. This is a crucial step, primarily because academic procrastination can be influenced according to students’ perceptions (Özberk & Kurtça, 2021). In Study 2, we performed a CFA and IRT. “CFA allows assessing the model fit through a more robust approach” than EFA (Tabachnick & Fidell 2013, p. 681). In contrast, IRT assesses the individual parameters of the items (Pasquali & Primi, 2003). Therefore, while the CFA focuses on the latent structure of the APS, IRT provides psychometric parameters on an individual level, identifying how each item contributes to the overall measure.
Besides the APS, we assessed the model fit of the APS-S in Study 2 and convergent validity of the APS and APS-S scores with the scores of another procrastination questionnaire.
Method
Study 1
Participants and Procedure
Participants were 384 university students (M age = 24.7, SD age = 6.48), mainly women (74%) and from public universities (70.8%). No data were missing. We advertised the survey link on social media (e.g., WhatsApp, Instagram, and Facebook) to gather data. More specifically, in groups mainly composed of students (e.g., university groups, communities of academic leaders, and classroom groups), we used the snowball sampling method (i.e., disseminating and asking students to share the link with their peers; Dusek et al., 2015).
The primary survey screen presented information about the purpose of the survey and the voluntary and anonymous nature of the students’ participation. Students agreed to participate voluntarily as a convenience sampling (non-probabilistic) technique was employed. As an inclusion criterion, we only considered university students from Brazil. Our sample is aligned with the Higher Education Census (INEP, 2019), which shows that most of the Brazilian universities are public (54.5%) and most students are women (72.2%).
Instrument
The Academic Procrastination Scale (APS; McCloskey, 2011) assesses procrastination specifically on academic tasks (e.g., term papers, exams, and projects) in the academic setting. The scale consists of 25 items (e.g., I put off projects until the last minute; I waste a lot of time on unimportant things), answered using a 5-point Likert scale (1 = disagree; 5 = agree). Considering the International Test Commission guidelines, its translation and adaptation from English to Brazilian Portuguese occurred through a back-translation procedure. Initially, a bilingual researcher translated the APS to Brazilian Portuguese. Subsequently, another researcher (also bilingual) undertook the back-translation, translating the scale into English. A third bilingual researcher compared both translations and confirmed the Brazilian Portuguese version. The three translators emphasized the conceptual similarity of the items during the process instead of focusing on literal similarities. Following that, we verified the semantic validation with 10 high school students, who collaborated voluntarily. No significant changes were necessary for the items, and the content of the original versions translated was preserved. The APS-S (Yockey et al., 2016) was considered in the research, consisting of five items (Items 2, 4, 7, 17, and 23) from the original measure, and answered with the same response options.
Data Analysis
The software Factor 10.10.03 (Lorenzo-Seva & Ferrando, 2006) was used to perform the EFA. We used the Hull Method as a factor retention criterion to identify the factorial structure that best adjusts to the data, observing their respective degrees of freedom (Lorenzo-Seva et al., 2011). After, we performed the EFA using a polychoric correlation and the Robust Diagonally Weighted Least Squares (RDWLS) method, considering a minimum saturation of |.30| (Gorsuch, 1983). To measure the reliability of the scale, we used McDonald’s Omega (ω), which should be greater than .70 (Kline, 2013), and Composite Reliability (CR ≥ .70; Fornell & Larcker, 1981; Gouveia & Soares, 2015).
Results
Before performing the EFA with the responses of the students to the APS, we confirmed the adequacy of factor analysis by calculating the relevant indexes [KMO = .93 and Bartlett, χ2 (300) = 4303.9, p < .001]. Moreover, the Hull Method indicated a one-dimensional structure, supporting McCloskey’s (2011) structure. Therefore, we performed the EFA using the RDWLS method, fixing the structure to one factor (χ2 (275) = 1523.99; Root Mean Square Error of Approximation (RMSEA) = .096, (95% confidence interval) = .083–.103; comparative fit index (CFI) = .96). Furthermore, we assessed the factorial structure [KMO = .88 and Bartlett, χ2 (10) = 992.1, p < .001] of the APS-S proposed by Yockey’s (2016; Items 2, 4, 7, 17, and 23 from the original scale). Once again, results supported the unidimensional structure: (χ2 (5) = 4.071; RMSEA = .001 (95% CI = .000–.187; CFI = .99).
Factorial Structure of the Portuguese version of the APS.
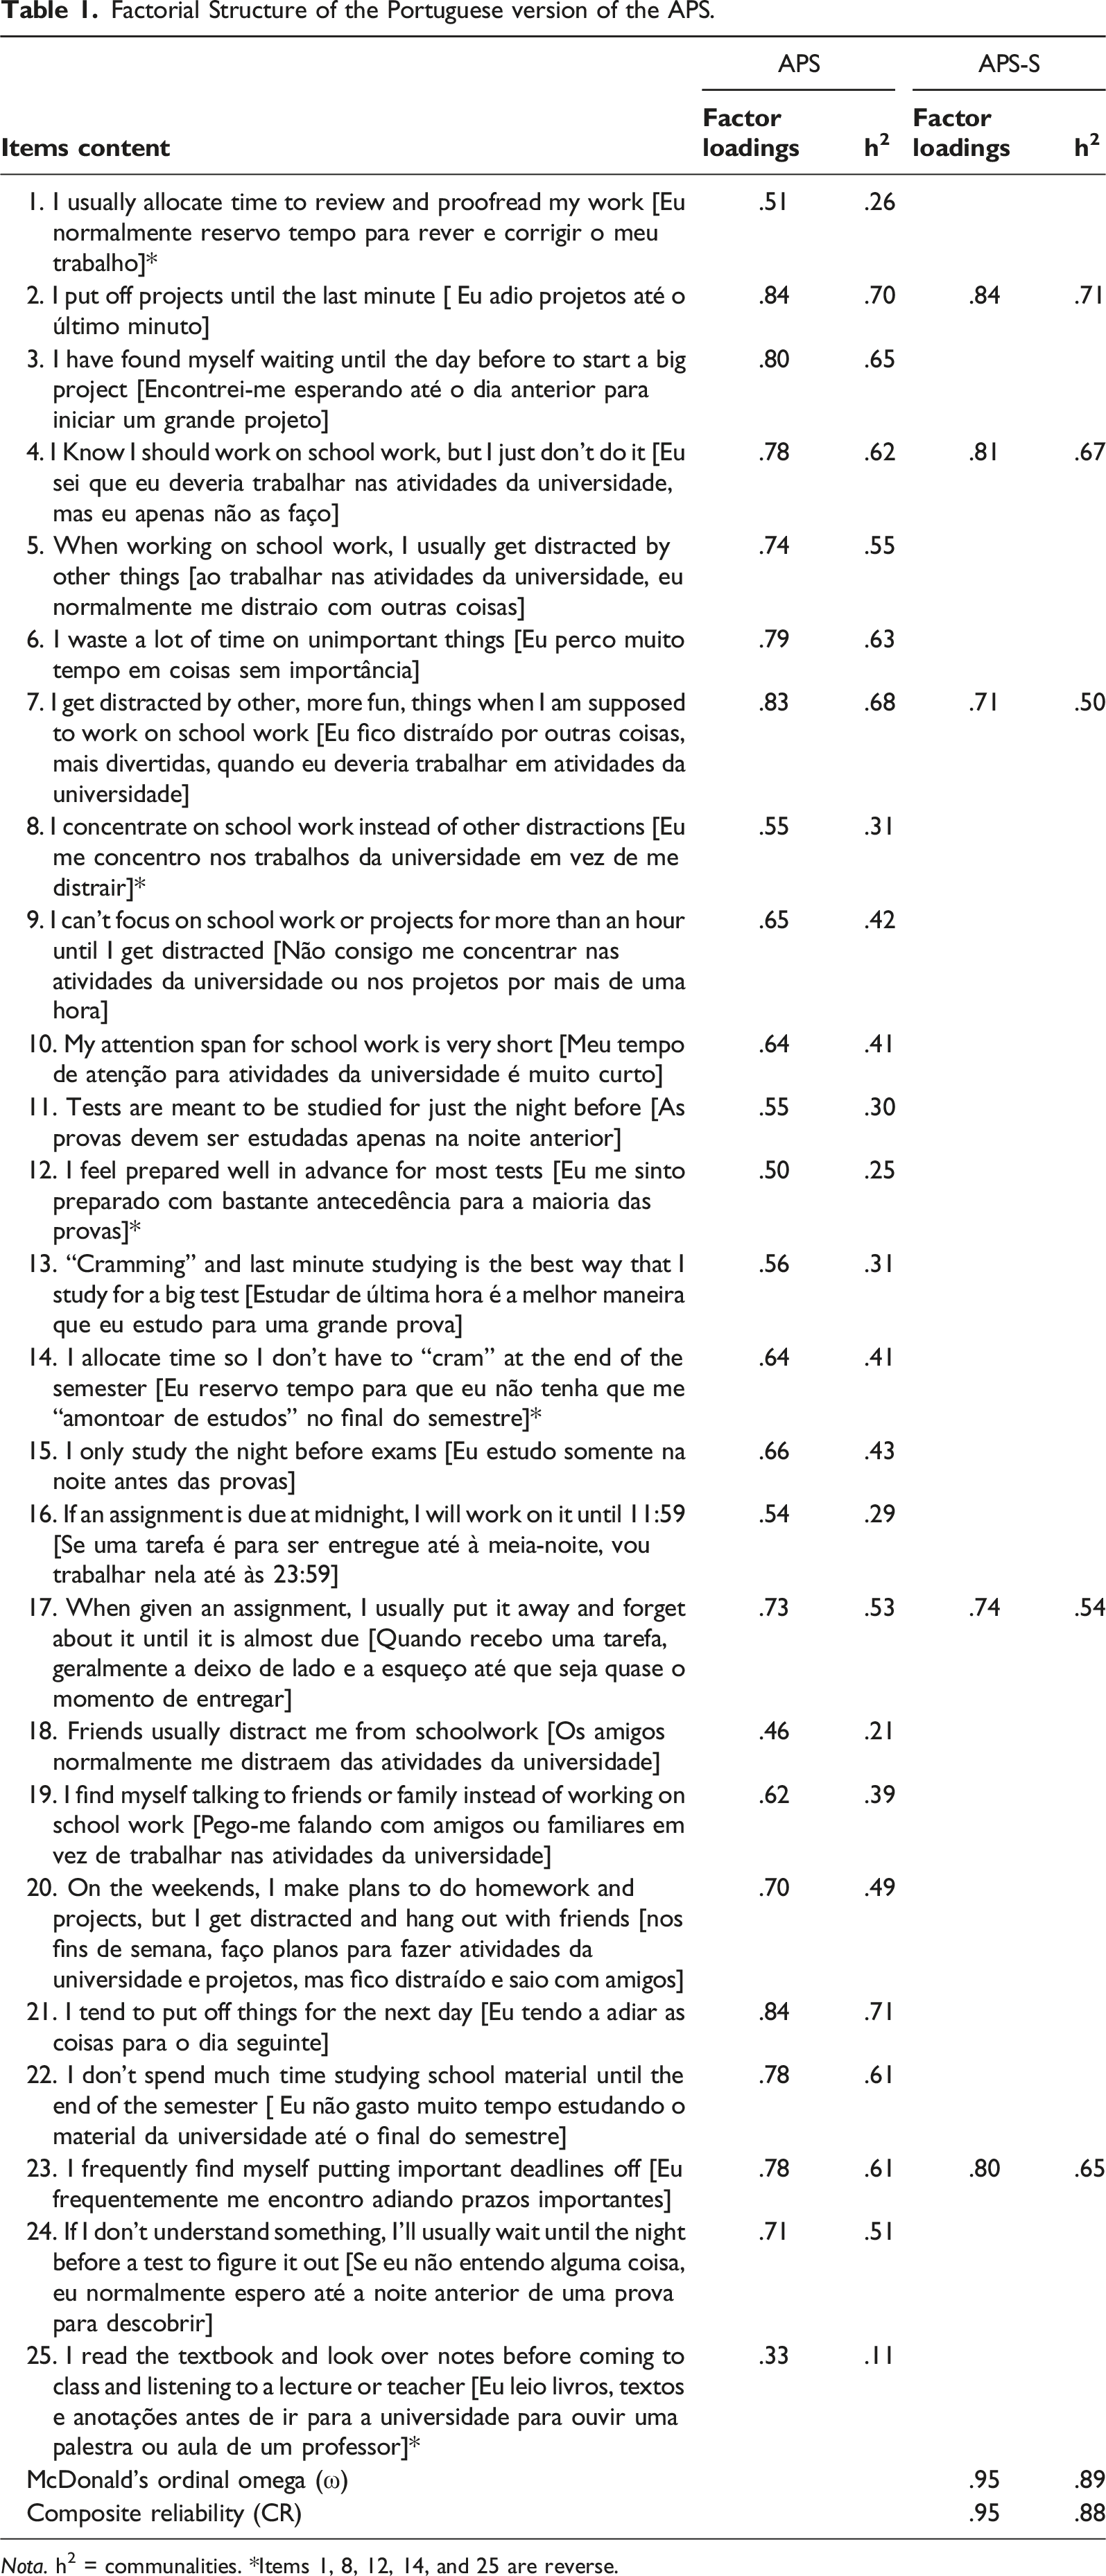
Nota. h2 = communalities. *Items 1, 8, 12, 14, and 25 are reverse.
Study 2
Participants and Procedure
For this study, we considered two samples (Ntotal = 857). Sample 1 consisted of 509 university students (M age = 23.7; SD age = 6.32; Postgrad = 257, Undergrad = 252), mainly men (57%). In sample 2, participants were 348 university students (M age = 22.5, SD age = 5.94; 45%), mostly women (59.8%). Participants completed an online survey shared on social media (e.g., WhatsApp, Instagram, and Facebook), using the same method as in Study 1 [snowball sampling - convenience sample (non-probabilistic); Dusek et al., 2015]. We only considered undergrad and postgrad students from Brazil as an inclusion criterion.
Instruments
Besides the APS (McCloskey, 2011), used for both samples in Study 2, we utilized the APS-S and Tuckman Procrastination Scale (TPS; Tuckman, 1991) in Sample 2. The TPS is a 16-item measure that assesses procrastination tendencies (e.g., “I postpone starting in on things I don’t like to do”; “I am an incurable time waster”). Participants have to answer to what extent the items are similar to them, using a four-point scale (1 = That’s me for sure; 4 = That’s not me for sure). In its development, Tuckman (1991) found satisfactory internal consistency reliability (Cronbach’s alpha of .90), and significant associations with self-regulation (r = .54).
Data Analysis
Using Sample 1, we conducted multiple CFAs and performed IRT analyses. We performed the CFA using Mplus (version 6.12) and adopted the Diagonally Weighted Least Squares (DWLS) estimator and polychoric matrix. The following indicators were considered for an acceptable model fit: CFI and Tucker–Lewis Index (TLI) values of greater than .90 or close to .95 and an RMSEA value and its 90% CI, with a preferred value of .06 or less (Byrne, 2010; Tabachnick & Fidell 2013).
We used R (R Development Core Team 2016) and the Multidimensional Item Response Theory (MIRT) to assess item parameters (i.e., discrimination, difficulty, and level of information). As the APS uses a 5-point scale, we applied the Graded Response Model (grm function; Samejima, 1969). To interpret the item discrimination indexes, we adopted Baker’s (2001) recommendation levels: 0 = no discrimination, .01 to .34 = very low discrimination, .34 to .64 = low discrimination, .65 to 1.34 = moderate discrimination, 1.35 to 1.69 = high discrimination, and higher than 1.70 = very high discrimination. Item threshold (also known as item difficulty) was evaluated using theta values (Baker, 2001). A low theta (b1–4) indicates that the item is “easier” to answer, and a higher theta indicates an item that is more “difficult” to answer. In other words, when an item is easy to answer, participants tend to agree highly with it. Whereas, if an item is difficult, participants will agree less with it. Finally, we also assessed the Item Information Curves (how much information an item shares with the total information of the measure) and the Test Information Curve (indicates how well and in what range of the latent trait, the scale can discriminate individuals).
Finally, using Sample 2, we assessed the reliability of the APS and the APS-S using McDonald’s Omega (ω > .70; Hayes & Coutts, 2020) and Composite Reliability (CR > .70; Gouveia & Soares, 2015). Also, we assessed the evidence for convergent validity through Pearson’s correlations between the scores of the APS and APS-S and the TPS scores. We expected positive and significant relations between academic and general procrastination, as measured by the APS and APS-S and the TPS, respectively.
Results
Confirmatory Factor Analysis
Factorial structure and parameters for the Portuguese version of the APS items with IRT (Sample 1, N = 509).
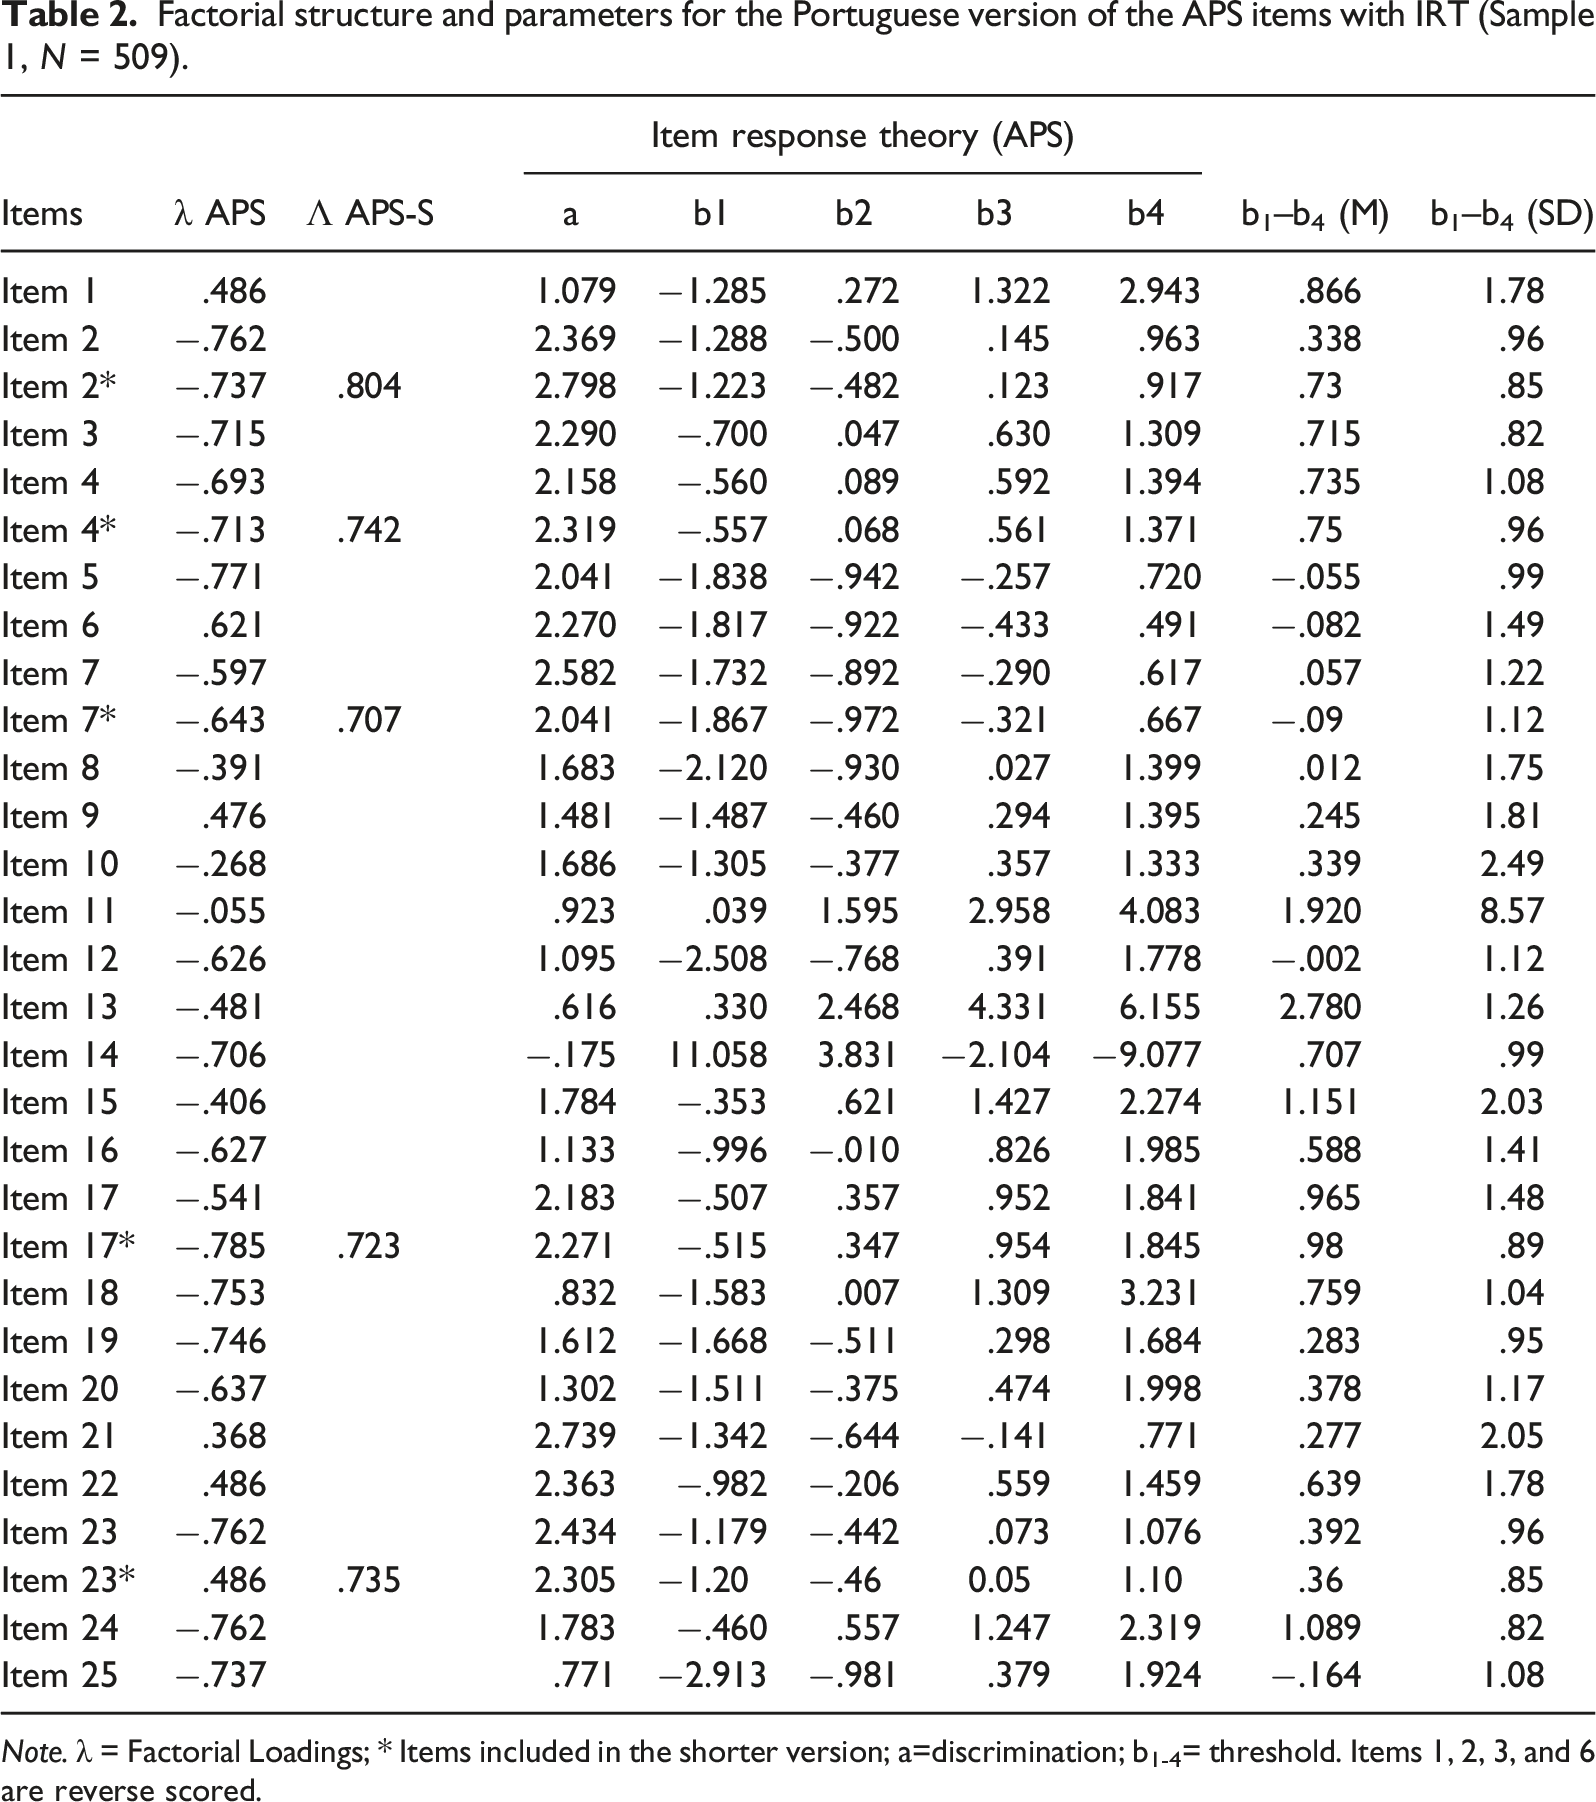
Note. λ = Factorial Loadings; * Items included in the shorter version; a=discrimination; b1-4= threshold. Items 1, 2, 3, and 6 are reverse scored.
Item Response Theory
We also performed IRT analyses to evaluate the items’ parameters. More specifically, we assessed how each of the 25 items of the final version discriminates participants with various levels of academic procrastination, their level of difficulty, and how much these items contribute individually to the overall measure. All the results are shown in Table 2. First, we present information on item discrimination. Discriminative items allow differentiating students with different levels (e.g., low and high) of academic procrastination. In our results, while two items showed very low (Item 14, a = −.17) and low levels (Item 13, a = .616), all others discrimination values were between moderate (>.65 and <1.34) and very high (>1.70; Baker, 2001), with an average of 1.65 (SD = .73). It is important to highlight that all items that form the short version of the measure had very high discrimination levels.
The difficulty parameters, also called item thresholds, describe the latent trait levels necessary to endorse the items along with the trait (Baker, 2001). A low theta (b1-4) indicates that the item is “easier” to answer, and a higher theta indicates an item that is more “difficult” to answer. Generic items lead participants with different levels of academic procrastination to agree with the items more easily. On the other hand, if an item is too difficult, only participants with higher levels of academic procrastination will endorse it completely. Therefore, items should be neither too easy nor too difficult (e.g., between −1.5 and 1.5; Rauthmann, 2013). In our results, all items were within this range of thresholds. Difficulty parameters indicated that items 7 (M b1–b6 = −.090) and 17 (M b1–b6 = .980) had the lowest and highest average thresholds, respectively. Curiously, both items are included in the APS-S. Altogether, these difficulty values of the APS are within the recommended thresholds by Rauthmann (2013), who argues that items should not be too easy nor too difficult.
Finally, we assessed Item Information Curves and Test Information Curve. Results showed that most of the items were adequately informative, with Item 21 being the most informative and Item 13 the least informative. The Test Information Curve also suggests a reasonable spread of discrimination across the latent range of academic procrastination (see Figure 1). The Test Information Curve is directly linked with the reliability levels, with a theta of 10 indicating a reliability level of .90 (Cappelleri et al., 2014). Test and Item information curves of APS and APS-SF (Short Form).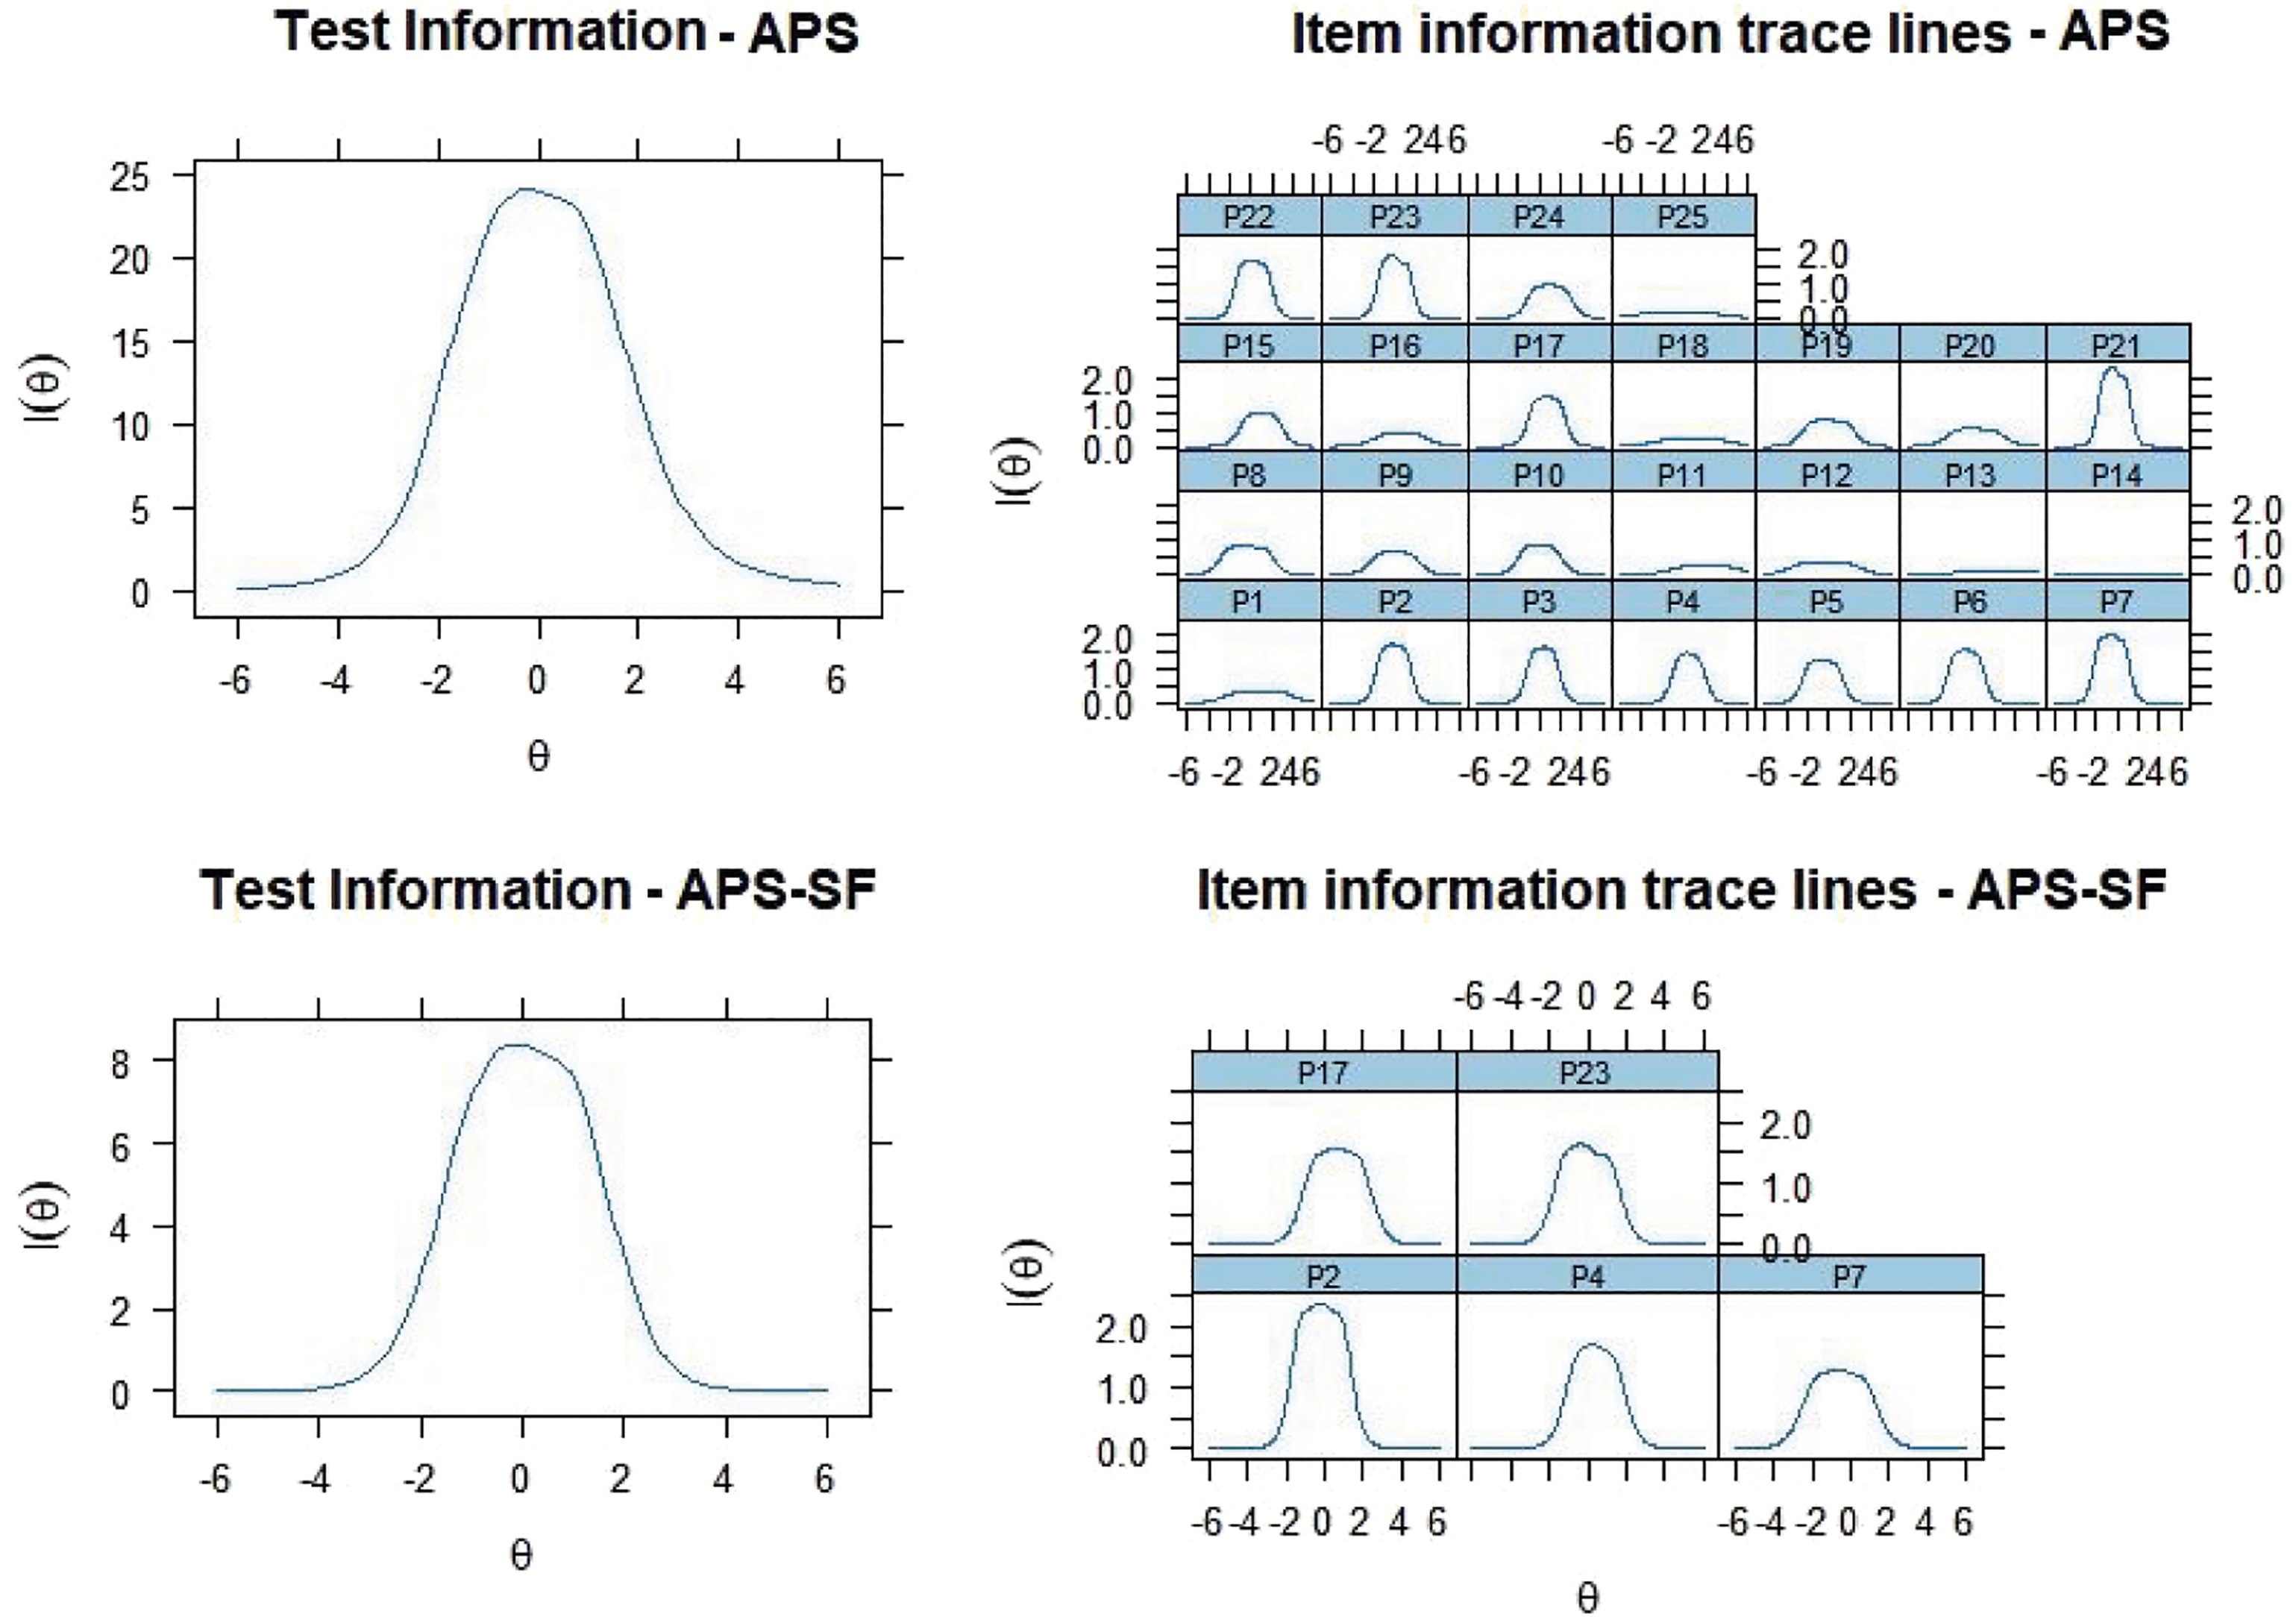
Reliability and Convergent Validity
To provide evidence of convergent validity for the APS and the APS-S scores, we assessed their correlations with the TPS scores, using Sample 2. Both APS and APS-S had significant correlations with the TPS scores (APS, r = .79; APS-SF, r = .76). Finally, we used two internal consistency estimators to assess the measure’s reliability. Both APS (ω = .91; CR = .93) and APS-S (ω = .76; CR = .86) had satisfactory internal consistency reliability (Gouveia & Soares, 2015; Kline, 2013).
Discussion
Academic procrastination has a significant impact on students’ lives, being related to several relevant variables, such as lower levels of self-esteem (Batool et al., 2017), higher levels of academic anxiety (Yang et al., 2019), and fear of failure (Abdi Zarrin & Gracia, 2020). Knowing these different implications, research has attempted to develop a reliable measure to understand better procrastination’s underlying characteristics and what factors are related to the construct. The APS is a robust questionnaire that focuses on the academic construct per se instead of general aspects of procrastination. To continuously assess and assure measure quality, cross-cultural evidence is needed. The present research aimed to adapt and assess evidence of validity and reliability of the scores of the APS in a Brazilian sample. Using powerful statistical techniques (e.g., EFA, CFA, and IRT), it was possible to integrate evidence of validity and reliability of the APS scores in two studies. In addition, we evaluated the short version of the APS, the APS-S.
Factorial Structure, Reliability, and Item Parameters
The factorial structure of the APS was assessed in two studies. In Study 1, we gathered evidence of psychometric suitability on an exploratory level, with results supporting the unifactorial structure proposed by McCloskey (2011). This unidimensional model was validated in Study 2, using a more robust method (i.e., CFA). Moreover, we also assessed the psychometric properties of the APS-S, proposed by Yockey et al. (2016). As for its original version, the measure also indicated an acceptable model fit, showing the suitability of its structure in the Brazilian context. Both versions of the APS presented adequate reliability results (>.70; Gouveia & Soares, 2015; Kline, 2013; Watkins, 2017), indicating that the measure scores are consistent over time.
After conducting EFA and CFA, we used the IRT approach. More specifically, we assessed item discrimination, difficulty, and information. Results showed that only two items showed very low or low discrimination power (Items 13 and 14), whereas others ranged from moderate to very high (Baker, 2001). Despite their weaker values, these items presented suitable psychometric properties through other analyses and therefore were retained for the final version of the APS to be used in Brazil. These results reinforce the discriminatory power of the APS items, highlighting their capability to distinguish people with different levels (e.g., low and high) of academic procrastination. Curiously, all items from the APS-S showed very high discrimination levels, indicating that the shorter version of the measure has powerful discriminative properties.
Moreover, the difficulty levels of the APS were within the recommended range, being neither too difficult nor too easy (Rauthmann, 2013). Such findings indicate that, when answering the items, participants will not tend to agree or disagree with the items completely but present different answers. The items also showed considerable information for the full measure, both individually and together. These results are related to the reliability estimates of the APS (Cappelleri et al., 2014), in previously reported research.
Finally, we assessed evidence of convergent validity of the APS and APS-S scores with scores of a general procrastination measure. Positive correlational results were found, indicating that procrastination is a multifacet phenomenon. Individuals who procrastinate in academia also tend to present higher levels of procrastination in other spheres of life, reproducing these behaviors in other day-to-day activities (e.g., going to work, finishing reports and reading a book). Such finding also highlights the importance of assessing the impact of procrastination in academia through specific measures instead of general questionnaires. These specificities can lead to a more in-depth understanding of the impact of the construct on the educational context.
Limitations, Future Studies, and Final Considerations
As with any research project, this study presents some limitations that should be discussed, although they do not invalidate our results. One limitation was using a non-probabilistic sample in our studies, restricting the generalizability of our findings. Also, another limitation is the use of self-report measures. These questionnaires offer participants the possibility of giving biased answers that do not correspond to reality, resulting from social desirability (especially when considering a topic popularly related to people who do not carry out their activities properly). Future research might consider using a social desirability measure to cover this issue. Also, it would be important to assess the APS and APS-S psychometric properties in different Brazilian contexts (e.g., high school students), with larger numbers of participants. In addition, exploring the temporal stability of the APS and APS-S scores and correlating the scores of the measures with several other psychological variables (e.g., academic performance, stress, and perfectionism) would be another direction for future research. Still, another future research direction would be to create normative tables to allow adequate interpretation of the scale scores.
The scales examined in this study (APS and APS-S) are more reliable when assessing the upper end of academic procrastination. In other words, they are more accurate in detecting students with higher levels of academic procrastination. This implies that measuring low levels of procrastination (e.g., in the school context) is error-prone. On the other hand, clinical cases would be less prone to errors. Therefore, future research needs to consider selecting items based on the test information function (TIF) and see if it is possible to establish a more reliable way of evaluating students with lower levels of academic procrastination.
Considering the multiplicity of theories that define procrastination, using the APS and APS-S as measures with their theoretical characteristics and validating the one-dimensional structure, as suggested by the original authors, seems pertinent. Future studies are needed to expand the sample and prepare normative tables that allow the measures to track students who experience high levels of academic procrastination. Studies of this nature can help educational institutions monitor and support students with potential distractions that can impact academic performance and mental health.
Footnotes
Declaration of Conflicting Interests
The author(s) declared no potential conflicts of interest with respect to the research, authorship, and/or publication of this article.
Funding
The author(s) received no financial support for the research, authorship, and/or publication of this article.
Ethical Considerations
All procedures performed in this study involving human participants were in accordance with the 1975 Helsinki Declaration.
Informed Consent
Informed consent was obtained from all participants.
Data Availability
Derived data supporting the findings of this study are available from the corresponding author upon request.