
Abstract
This study investigated if the linkages between trait emotional intelligence (trait EI) and the Five-Factor Model of personality were invariant between men and women. Five English-speaking samples (N = 307-685) of mostly undergraduate students each completed a different measure of the Big Five personality traits and either the full form or short form of the Trait Emotional Intelligence Questionnaire (TEIQue). Across samples, models predicting global TEIQue scores from the Big Five were invariant between genders, with Neuroticism and Extraversion being the strongest trait EI correlates, followed by Conscientiousness, Agreeableness, and Openness. However, there was some evidence indicating that the gender-specific contributions of the Big Five to trait EI vary depending on the personality measure used, being more consistent for women. Discussion focuses on the validity of the TEIQue as a measure of trait EI and its psychometric properties, more generally.
Trait emotional intelligence (trait EI) refers to a constellation of emotional self-perceptions located at the lower levels of personality hierarchies and integrates the affective aspects of personality (Petrides, Pita, & Kokkinaki, 2007). The construct is unrelated to human cognitive ability (e.g., Ferrando et al., 2010) and, instead, fits within extant models of personality. Despite showing moderate to strong associations with higher-order personality dimensions (Vernon, Villani, Schermer, & Petrides, 2008), trait EI’s relatively specific focus on emotions offers predictive and explanatory advantages (Petrides & Furnham, 2001). Also, the wide relevance of emotion-related attributes renders trait EI a construct of extensive ecological significance and value, as the wide range of research and applied contexts (e.g., educational, clinical, occupational, and organizational) in which it is examined demonstrates (Petrides, 2011). Yet, researchers have expressed concern toward the construct’s associations with higher-order factors, particularly those encompassed by the Five-Factor Model (FFM). The particular criticisms have been geared toward the number and fairly large magnitude of associations with these factors, culminating in the idea that the construct is perhaps redundant (Landy, 2005; Schulte, Ree, & Carretta, 2004).
Both the number and magnitude of associations between trait EI and higher-order FFM factors can be defended. Its strength of correlations is in line with personality theory and the empirical attributes of lower-order traits, which share much of their variance with higher-order factors (Paunonen, 1998; Paunonen & Ashton, 2001). Nevertheless, lower-order traits reliably predict incremental variance in a wide range of criteria beyond the Big Five, sometimes even “outpredicting” them (Paunonen, 1998; Paunonen & Ashton, 2001). Although trait EI has been conceptually and empirically situated between the upper and lower extremes of personality hierarchies, strong associations with higher-order factors are also built into the construct. Most importantly, a distinct trait EI factor has been isolated in personality factor space (De Raad, 2005; Petrides, Pita, & Kokkinaki, 2007) and has consistently demonstrated incremental validity in predicting a wide range of outcomes over higher-order personality dimensions (Ferrando et al., 2010; Parker, Keefer, & Wood, 2011; Petrides, Pérez-González, & Furnham, 2007; Russo et al., 2012; Siegling, Vesely, Petrides, & Saklofske, in press).
Correlations with more than one higher-order FFM factor are consistent with the conceptualization of trait EI as the affective dimension of personality, which appears to be distributed across higher-order factors, each comprising emotion-related attributes (De Raad, 2005). It is worth emphasizing that associations of a given personality trait with more than a single higher-order factor do not contradict theory. Even the hierarchical model, which often portrays lower-order traits as uniquely belonging to one of the higher-order factors (for the purpose of simplicity), does not suggest that lower-order traits exclusively load on a single higher-order factor (Costa & McCrae, 1995; McCrae, Zonderman, Costa, Bond, & Paunonen, 1996). It is also important to keep in mind that the magnitude of associations between trait EI and the higher-order factors is highly uneven—Neuroticism comprises the most, and Openness and Agreeableness the fewest emotion-related traits (Vernon et al., 2008)—and varies somewhat across operationalizations of the trait EI construct (Brackett & Mayer, 2003; Dawda & Hart, 2000).
Associations between trait EI measures and higher-order FFM factors have been reported in dozens of papers. In this article, we restrict our focus to the Trait Emotional Intelligence Questionnaire (TEIQue; Petrides, 2009), which is one of the most commonly used and comprehensive measures of the construct. The TEIQue assesses 15 specific facets that fall into one of four domains (well-being, self-control, sociability, and emotionality) and has shown relatively strong psychometric properties in a number of studies (Freudenthaler, Neubauer, Gabler, Scherl, & Rindermann, 2008; Gardner & Qualter, 2010; Martins, Ramalho, & Morin, 2010; Mikolajczak, Luminet, Leroy, & Roy, 2007). Neuroticism (N) and Extraversion (E) have been identified as the strongest FFM correlates of the total TEIQue scores (Vernon et al., 2008). This finding fits the underlying theory, as these two dimensions also have been labeled as negative and positive affectivity, respectively. Conscientiousness (C), Openness (O), and Agreeableness (A) also correlate with global trait EI, but these associations tend to be weaker (Vernon et al., 2008).
A worthwhile next step would be to integrate the evidence for associations between trait EI and personality in a meta-analysis. This knowledge would have important implications for understanding the construct and help assert its position in personality-factor space. The primary focus should be global trait EI scores, given the variations in EI domains across different measures, as well as the specific variances associated with individual EI domains, or subscales, that are unrelated to the global construct. A related question, but one that would require considerable empirical evidence to begin with, is whether there are gender differences in associations between trait EI and higher-order FFM factors. In the literature, we could not find studies reporting gender-specific correlations between the TEIQue and a general personality measure. The present article marks the initial step in this direction.
Many traits are socially desirable for one gender, but not for the other, at least in a traditional sense (Spence, 1993). A large proportion of these traits are naturally subsumed by, and distributed across, the extant models of personality, such as the FFM or Giant Three model (Ward, Thorn, Clements, Dixon, & Sanford, 2006). Trait EI, which correlates to varying degrees with most higher-order factors, seems to encompass some of the traits widely considered socially desirable for one or the other gender, but not for both (Bem, 1974; Guastello & Guastello, 2003). Examples of such traits are assertiveness (stereotypically male) and empathy (stereotypically female). This notion is in line with the consistently reported gender differences at the factor and facet levels of the TEIQue and much less consistent differences at the global construct level; women have been shown to score higher in the interpersonal domains of emotionality and sociability, and men in the intrapersonal domains of well-being and self-control (Arteche, Chamorro-Premuzic, Furnham, & Crump, 2008; Petrides, 2009; Siegling, Saklofske, Vesely, & Nordstokke, 2012). Thus, gender-invariant relationships of the TEIQue scores with personality would provide some evidence against the idea that trait EI scores and their relationships with higher-order factors are influenced by social desirability. Gender invariance in these associations would also speak to the psychometric integrity of the TEIQue, by providing converging evidence that the global composite score represents the same construct for men and women.
To our knowledge, the present article is the first to investigate gender-specific associations between the TEIQue and the FFM. Both the full form of the TEIQue and its short form, the TEIQue-SF (Petrides & Furnham, 2006), were examined for gender differences in their links to five different measures of the Big Five, each administered to a different sample. Multi-group moderation analysis was used to examine and compare the unique contributions of the Big Five to trait EI for men and women. Available data from five different English-speaking samples were used for this purpose, and their results were also aggregated to obtain study-wide average weighted effect sizes for bivariate, partial, and multiple correlations.
Method
Samples
All five samples used in this investigation met the rules of thumb for the minimum number of participants needed per analysis (Green, 1991). Samples 1, 2, and 3 comprised undergraduate students recruited at British universities. Sample 2 also included additional participants from the community. Samples 4 and 5 were undergraduate students from various disciplines recruited at a big university in Western Canada. The demographic characteristics for the five samples are summarized in Table 1. Additional information about Samples 2 to 4 can be found in previous publications (Gardner & Qualter, 2010; Petrides, Pérez-González, & Furnham, 2007; Siegling et al., 2012).
Demographic Characteristics of Samples and Measures Administered.
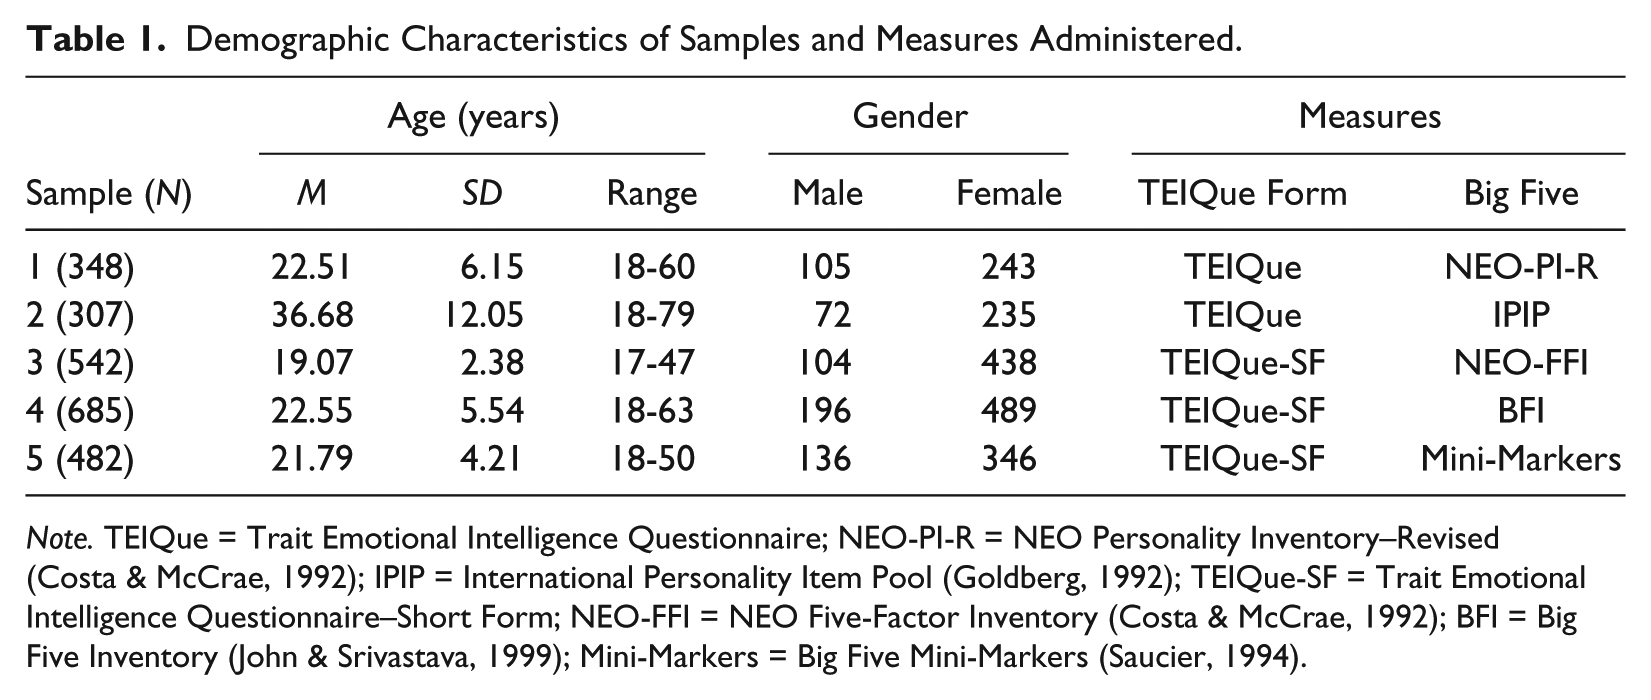
Note. TEIQue = Trait Emotional Intelligence Questionnaire; NEO-PI-R = NEO Personality Inventory–Revised (Costa & McCrae, 1992); IPIP = International Personality Item Pool (Goldberg, 1992); TEIQue-SF = Trait Emotional Intelligence Questionnaire–Short Form; NEO-FFI = NEO Five-Factor Inventory (Costa & McCrae, 1992); BFI = Big Five Inventory (John & Srivastava, 1999); Mini-Markers = Big Five Mini-Markers (Saucier, 1994).
Measures
Trait EI
Sample 1 completed the initial version of the TEIQue (v. 1.00, 144 items), whereas Sample 2 completed the current version (v. 1.50, 153 items; Petrides, 2009). Detailed descriptions of the TEIQue scales and subscales, which are not the focus here, can be found in Petrides (2009). The TEIQue items are based on a 7-point Likert-type scale, ranging from 1 (disagree completely) to 7 (agree completely). Cronbach’s alphas for global trait EI were .97 for males and .96 for females in Sample 1 and .97 for both genders in Sample 2.
Samples 3, 4, and 5 completed the TEIQue-SF (Petrides & Furnham, 2006), which contains 30 items, taken in pairs from each of the 15 facets of the full form. The items are based on the same 7-point Likert-type scale as the full form, ranging from 1 (completely disagree) to 7 (completely agree). Internal reliabilities across the samples (in ascending order and showing the alphas for female participants in parentheses) were .89 (.88), .90 (.88), and .81 (.86). At the global composite level, the TEIQue-SF provides virtually identical scores as the full form (Petrides, 2009) and has been validated through item response theory (Cooper & Petrides, 2010).
FFM
Sample 1 completed the long form of the NEO Personality Inventory–Revised (Costa & McCrae, 1992), which comprises 240 items that are evenly distributed across the five factors. The items are responded to on a 5-point Likert-type scale, labeled at each point and ranging from strongly disagree to strongly agree. The internal consistencies were .92 (.92) for N, .94 (.89) for E, .93 (.89) for O, .91 (.88) for A, and .94 (.91) for C, with alphas for female participants shown in parentheses.
Sample 2 completed the 50-item set of the International Personality Item Pool (Goldberg, 1992), a public-domain measure of lower-level Big Five facets. The items (10 per factor) are responded to on a 5-point Likert-type scale, labeled at each point and ranging from very inaccurate to very accurate. The internal consistencies were .91 (.91) for E, .82 (.74) for A, .85 (.79) for C, .89 (.88) for Emotional Stability (N), and .85 (.78) for Intellect/Imagination (O), again showing alphas for female participants in parentheses.
Sample 3 completed the short form of the NEO Five-Factor Inventory (Costa & McCrae, 1992), which comprises 60 items evenly distributed across the Big Five. The response scale is identical to the long form, using a 5-point Likert-type scale from strongly disagree to strongly agree. The internal consistencies were .87 for N, .86 (.82) for E, .86 (.80) for O, .74 (.81) for A, and .84 (.86) for C (alphas for female participants are shown in parentheses).
Sample 4 completed the Big Five Inventory (John & Srivastava, 1999) as the FFM measure. The number of items varies slightly across factors: N (8 items), E (8 items), O (10 items), A (9 items), and C (9 items). Respondents are asked to indicate the degree to which brief descriptive items apply to them on 5-point scales, ranging from 1 (disagree strongly) to 5 (agree strongly), with intermediate points also labeled. Internal reliabilities in this sample were .83 (.81) for E, .79 (.81) for A, .78 (.81) for C, .85 (.83) for N, and .80 (.80) for O (alphas for female participants are shown in parentheses).
Sample 5 completed a different type of FFM measure, the Big Five Mini-Markers (Saucier, 1994). It is based on the lexical approach to measuring personality (Goldberg, 1992), comprising 40 adjective markers that map onto the Big-Five factor structure (eight items per factor). Respondents indicate the extent to which each adjective represents them on a 9-point Likert-type scale, ranging from 1 (extremely inaccurate) to 9 (extremely accurate). Each scale point has a numerical value and a label. In this sample, internal reliabilities of this measure were .81 (.86) for E, .87 (.85) for A, .81 (.85) for C, .84 (.83) for N, and .79 (.80) for O (alphas for female participants are shown in parentheses).
Statistical Analysis
Two-tailed Pearson correlations were computed separately for men and women in each sample. Gender-specific personality contributions (R2) of the FFM to trait EI were assessed by regressing men’s and women’s trait EI scores on the Big Five. Further, multi-group moderation analyses were conducted in SPSS Amos (Arbuckle, 2012) to examine if the models and individual paths were invariant between men and women. In addition, we compared the contributions of two Big Five measures to participants’ trait EI scores between Samples 4 and 5, which were drawn concurrently from the same population. In fact, the only systematic difference was the Big Five measure administered to these two samples. Finally, average weighted effect-size indicators (r, partial r, and R2), aggregated across the five samples, were computed using Hedges and Olkin’s (1985) fixed-effects method.
Results
Bivariate Correlations
Correlations between global trait EI and the Big Five, as shown in Table 2, reveal two noteworthy patterns. First, gender differences in associations between global trait EI and the Big Five are not consistent across the samples or Big Five measures; none of the Big Five were consistently stronger trait EI correlates for one gender than for the other. For example, trait EI showed stronger correlations with E, O, and A for men than for women in Sample 1, whereas the opposite was the case in Sample 2. Second, for both genders, N was the strongest correlate of trait EI, followed by E. The only exception was that the correlations of N and E with trait EI were of the same magnitude in Sample 3 for women.
Gender-Specific Associations Between the TEIQue (Samples 1 and 2) or TEIQue-SF (Samples 3 to 5) and Different Measures of the Big Five.
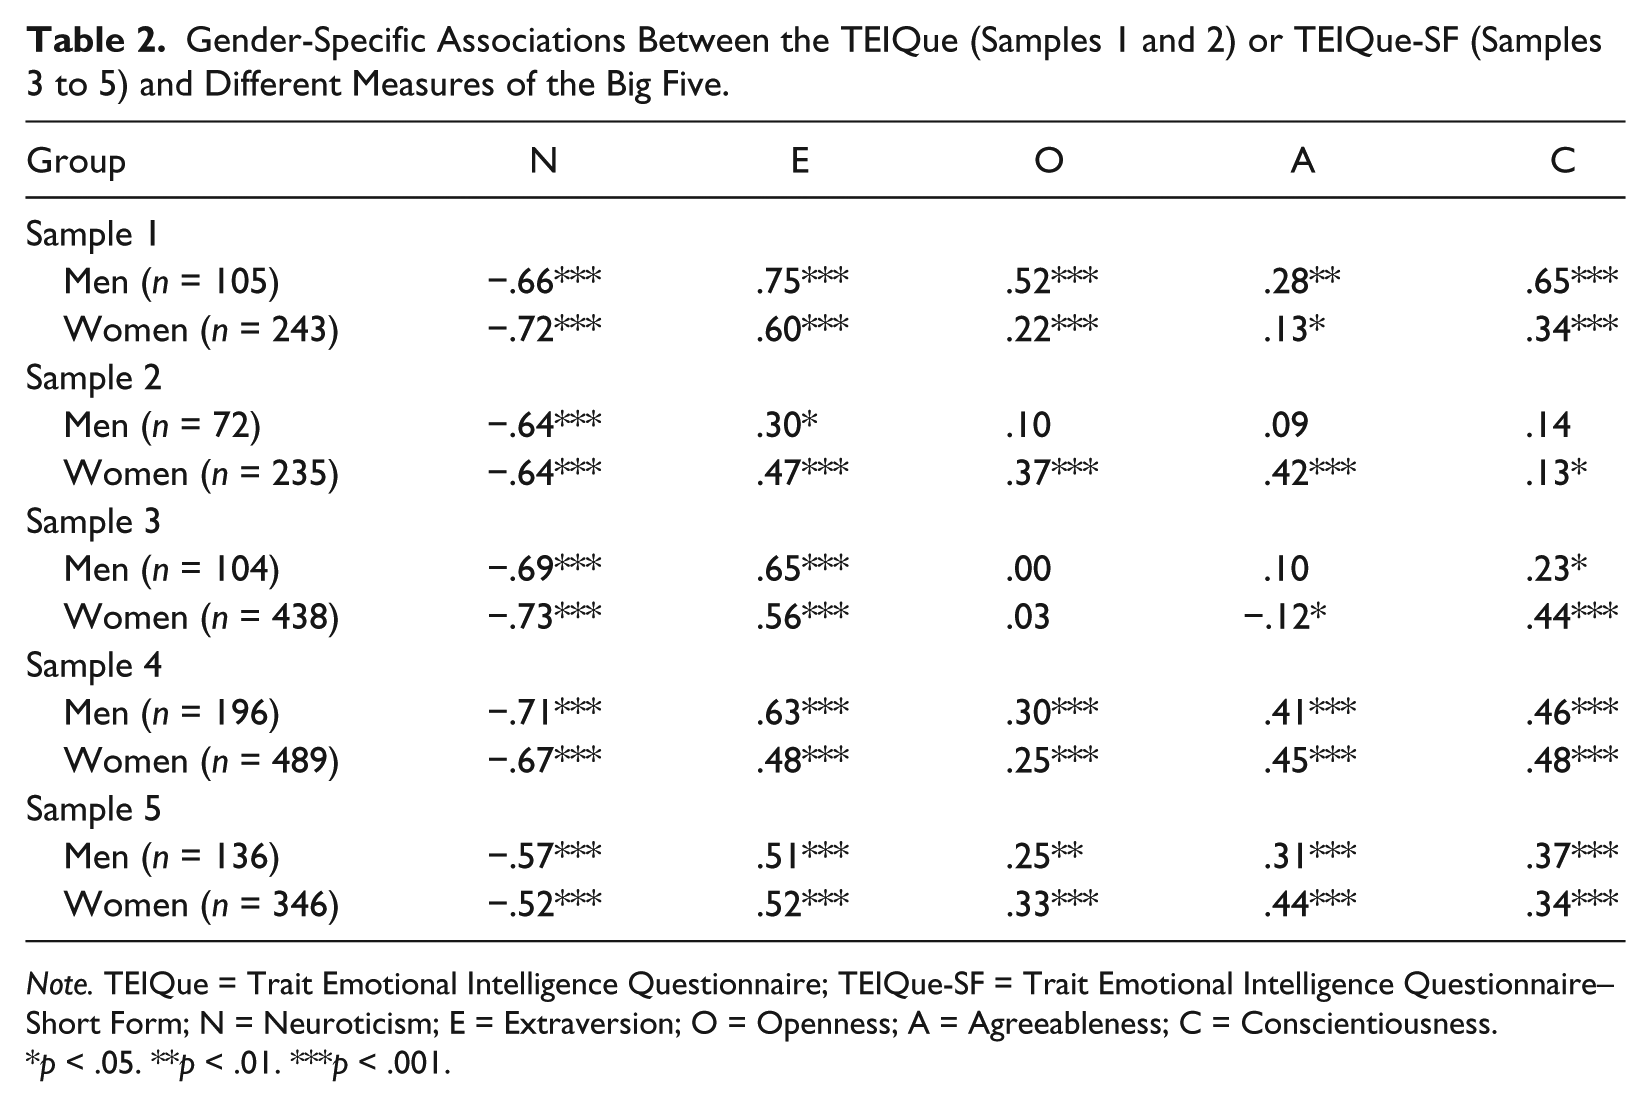
Note. TEIQue = Trait Emotional Intelligence Questionnaire; TEIQue-SF = Trait Emotional Intelligence Questionnaire–Short Form; N = Neuroticism; E = Extraversion; O = Openness; A = Agreeableness; C = Conscientiousness.
p < .05. **p < .01. ***p < .001.
After N and E, the associations were varied for O, A, and C. Yet, the associations for O were either the weakest or second weakest, and O was a weaker correlate of trait EI than C in all cases except for women in Sample 2. O also tended to be a weaker trait EI correlate than A, with the only exception that its association was stronger for both genders in Sample 1 and virtually identical in Sample 2 for men. Oddly, A correlated negatively with trait EI in women in Sample 1. Finally, C tended to be a stronger correlate than A, except for women in Samples 2 and 5. Considering significance, men’s correlations for these three factors with trait EI were not significant and all within r = .05 from each other in Sample 2. Likewise, O and A did not reach significance for men in Sample 3. O in Sample 3 was the only Big Five trait that did not correlate significantly with trait EI for women across samples.
Multiple Regressions
Table 3 shows the standard regression and invariance test results. As observed for the zero-order correlations, gender differences in these predictive effects were not consistent across samples for any of the Big Five factors. Moreover, the invariance test results indicate that the predictive effects of the Big Five on trait EI were generally gender-invariant. The gender-specific models were not significantly different in any of the five samples, with overall differences in personality contributions (R2) to trait EI scores ranging from 5% (Samples 3 to 5) to 14% (Sample 1). The only significant, though again inconsistent, differences in individual paths were higher contributions of C in Sample 1 and N in Sample 2 to men’s trait EI; in Sample 3, the effect of C also differed significantly, but this time it was stronger for women. Given this pattern of only a few inconsistent and weak gender differences in the Big Five’s contributions to trait EI scores, it is particularly important to take possible chance effects into account when interpreting these results, which were not adjusted for multiple comparisons.
Summaries for Gender-Specific Models Predicting TEIQue (Samples 1 and 2) or TEIQue-SF (Samples 3 to 5) Scores With the Big Five and Invariance Test Results.
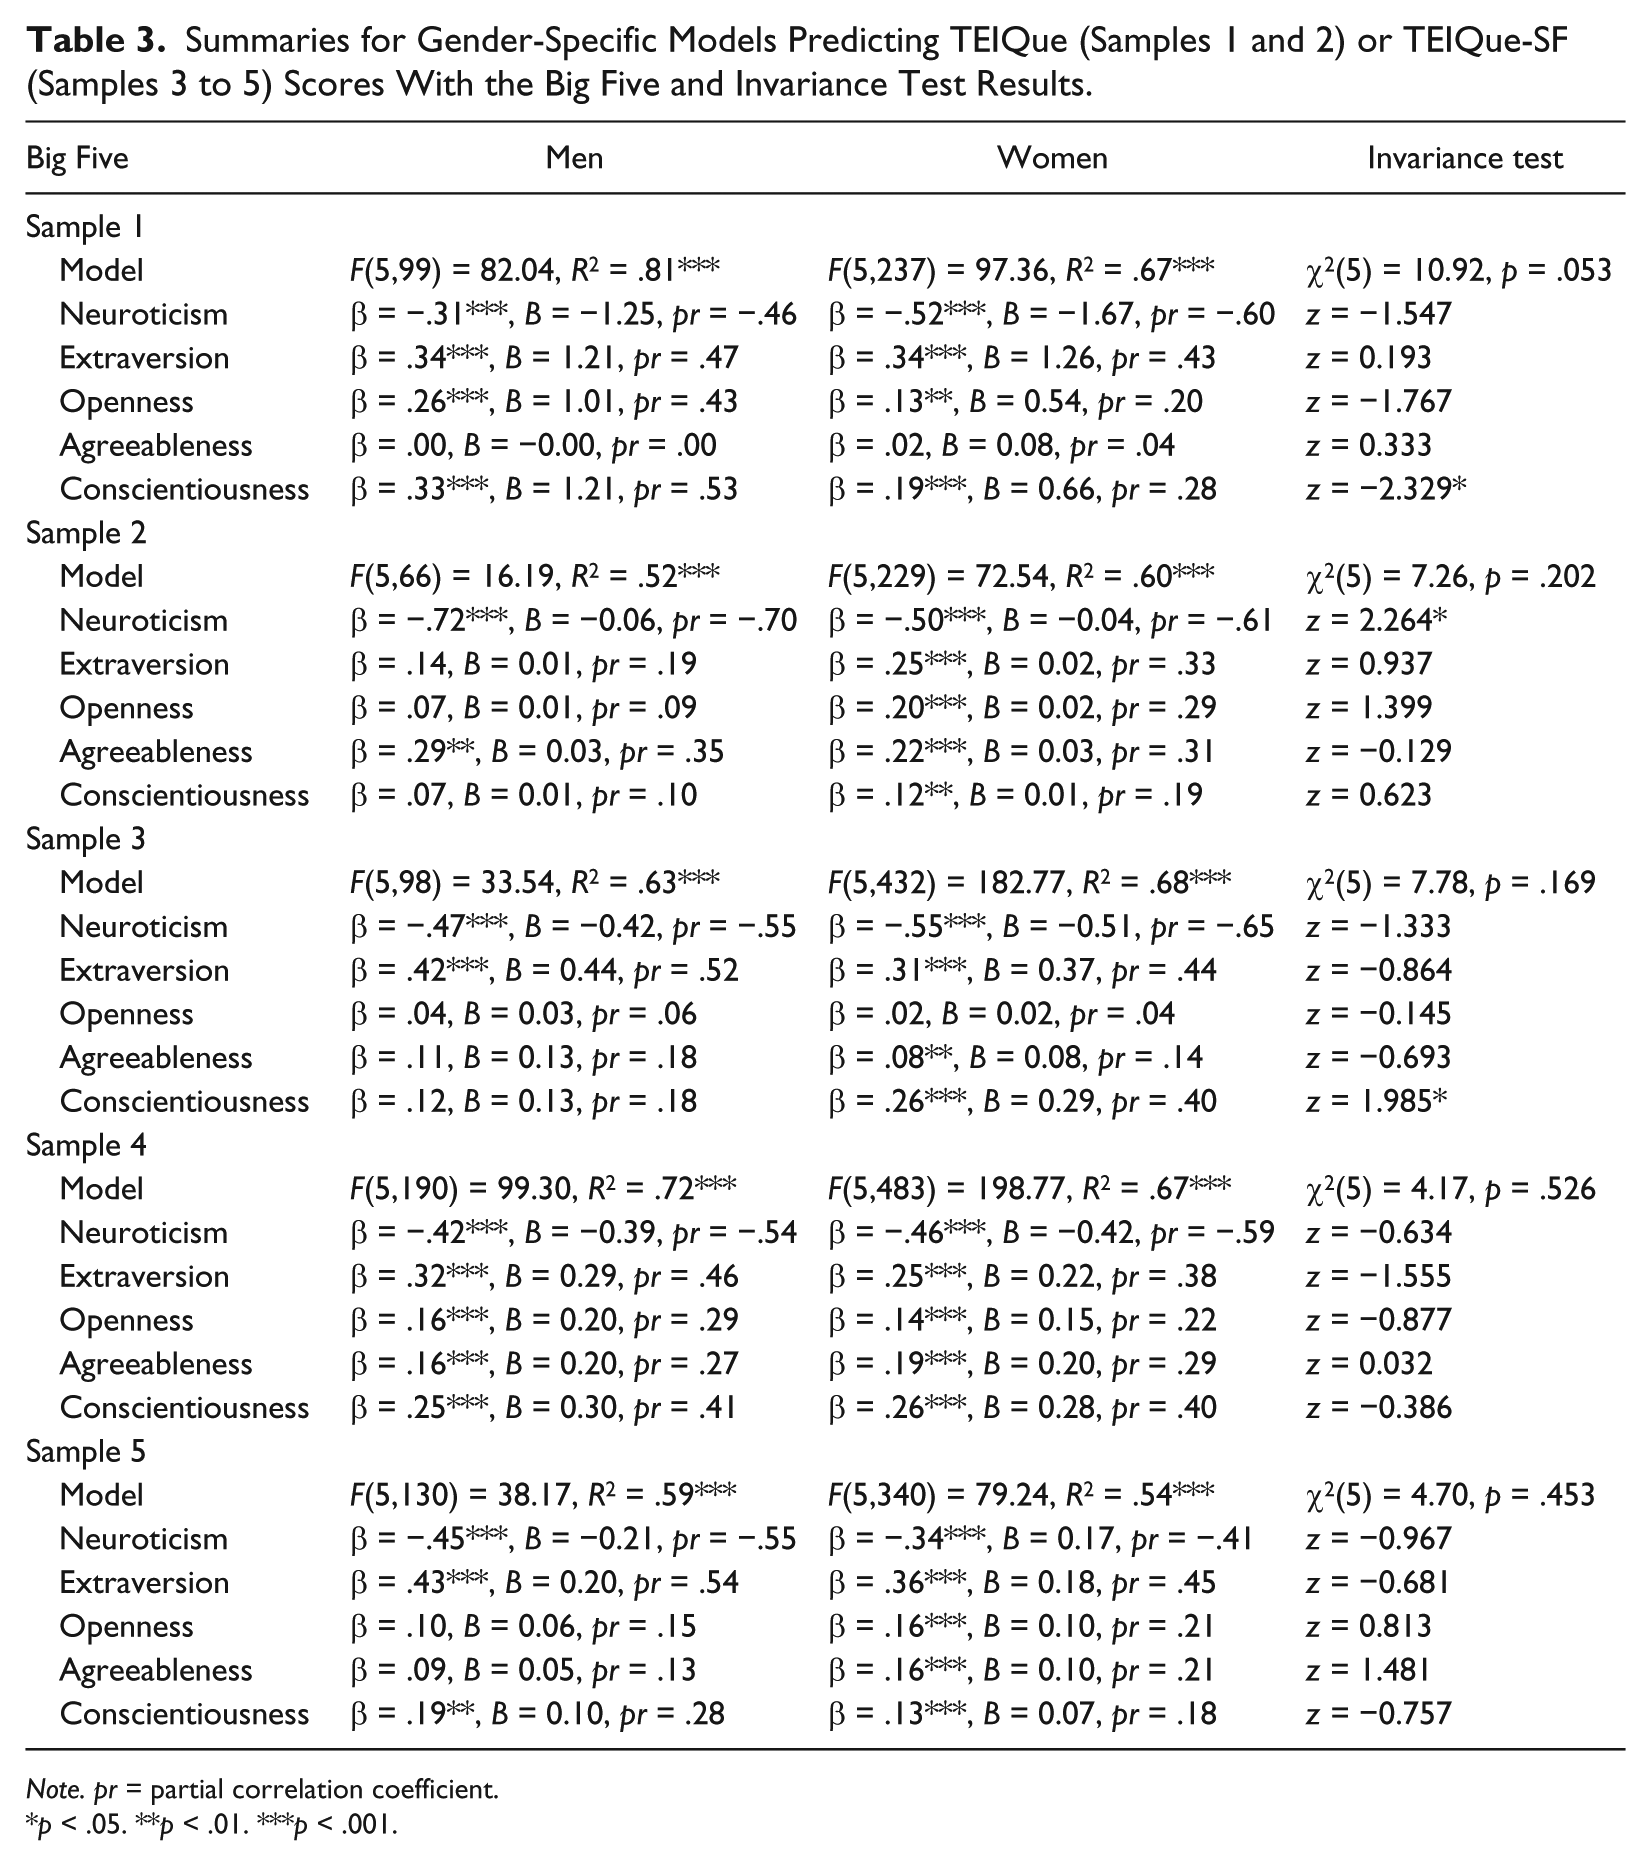
Note. pr = partial correlation coefficient.
p < .05. **p < .01. ***p < .001.
The beta weights for the Big Five were less consistent in their order of magnitude compared with the bivariate correlations. N was no longer the strongest predictor of trait EI in all cases. For men in Sample 1, its effect was slightly smaller than that of E and notably also C; for women in Sample 5, its effect was slightly smaller than that of E. Although E remained the second strongest predictor in most cases, its beta weight was surpassed by that of A in Sample 2 for men and by C for women in Sample 4. As was seen in the bivariate correlations, betas of C were larger than those of O and A in all samples except for Sample 2. O tended to have the smallest effects, though sometimes its betas were either higher than or similar to those of A and C.
The results indicate that the contributions (R2) of personality to trait EI scores vary as a function of the personality measures used. Specifically, the NEO explained more trait EI variance for both genders than the other Big Five measures, which is not surprising given the extensive depth of the NEO factors. Personality contributions to trait EI scores were weakest in Sample 2 for men (International Personality Item Pool) and in Sample 5 for women (Big Five Mini-Markers). They also seem to vary as a function of gender in interaction with the measure used, showing greater consistency across samples for women (R2 = .54-.68) than for men (R2 = .52-.81).
Within-gender comparisons between Samples 4 and 5 will be presented in text. As Table 3 indicates, it is important to note that differences in standardized betas were not always in line with the unstandardized estimates, on which the path comparisons are based. The models for both men, χ2(5) = 74.67, p < .001, and women, χ2(5) = 163.05, p < .001, were significantly different between Samples 4 and 5. For men, unstandardized estimates were significantly larger for N (z = 3.64, p < .01), O (z = −2.28, p < .05), A (z = −2.65, p < .01), and C (z = −3.51, p < .01) in Sample 4. Only the path for E was invariant (z = −1.80, p > .05) between Samples 4 and 5. For women, paths were significantly greater in Sample 4 for N (z = 7.58, p < .01), A (z = −2.44, p < .05), and C (z = −5.69, p < .01), whereas those for E (z = −1.12) and O (z = −1.31) were both invariant (p > .10) between Samples 4 and 5.
Aggregate Effect Sizes
Considering the data from all five samples together, the effect-size estimates reveal a pattern that is consistent between men and women (see Table 4). Both bivariate and partial correlations between the Big Five and participants’ trait EI scores were similar in magnitude between genders when aggregated across samples. First, even largest discrepancies between men’s and women’s associations were minimal: .08 for the bivariate correlations and .05 for the partial correlations, both pertaining to E. Second, the order of associations in terms of magnitude was identical for men and women. The strongest to weakest correlates were N, E, C, A, and O, although the difference between A and O was negligible, as is further supported by the partial correlations. For both genders, partial correlations were consistent with the bivariate correlations in order of magnitude, although naturally somewhat smaller. Overall contributions of personality to trait EI scores were similar, yet slightly larger for men (68%) compared with women (64%).
Average Weighted Effect Sizes Aggregated Across the Five Samples.
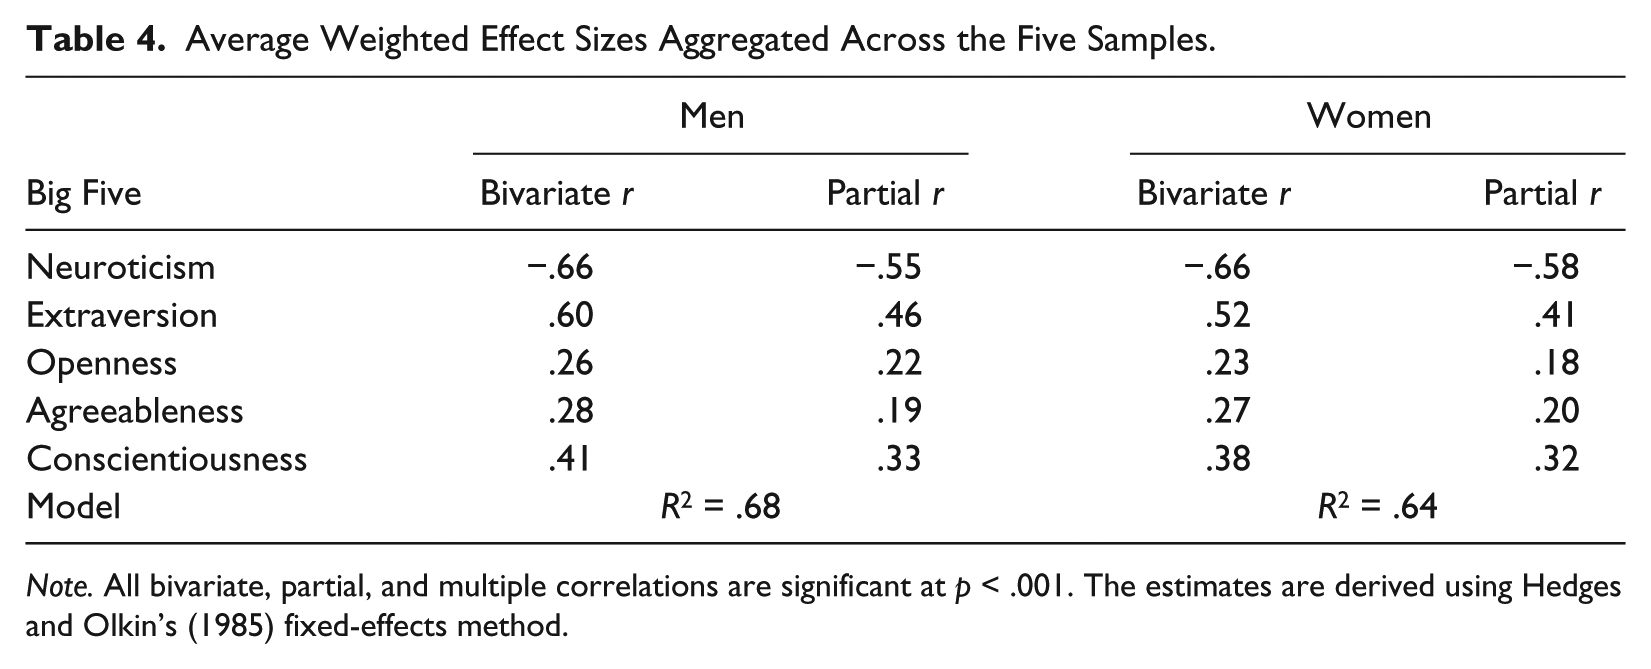
Note. All bivariate, partial, and multiple correlations are significant at p < .001. The estimates are derived using Hedges and Olkin’s (1985) fixed-effects method.
Discussion
The present investigation is the first to report and systemically examine gender-specific associations between trait EI, operationalized through total scores on the TEIQue or TEIQue-SF, and the Big Five, assessed with five different measures across samples. What we found here in terms of gender-specific correlations fits with total sample correlations between TEIQue scores and the Big Five previously reported in the literature (Petrides et al., 2010; Vernon et al., 2008). Aggregated across samples, Neuroticism and Extraversion were the strongest trait EI correlates for both men and women, followed by Conscientiousness, Agreeableness, and Openness (associations of Agreeableness and Openness were similarly weak).
A slightly less clear picture emerged from the sample-specific regression results. Consistent with previous findings (e.g., Petrides et al., 2010), either Neuroticism (in most cases) or Extraversion tended to be the strongest predictor of trait EI for both genders. For men, Conscientiousness exceeded the beta of Neuroticism, and Agreeableness that of Extraversion in one of the five samples, respectively. The effect of Conscientiousness exceeded that of Extraversion for women in one sample. In four of the five analyses conducted, Conscientiousness was the second or third strongest predictor for men, whereas in three of five analyses, Conscientiousness was the second or third strongest predictor for women. The relative contributions of Openness and Agreeableness to trait EI scores were varied across measures, being higher for Openness in some instances, but lower than, or similar to, those of Agreeableness in others. Both were weak or non-significant predictors in the NEO-FFI, and only Openness from the NEO-PI-R predicted trait EI. Most importantly, however, the aggregated results from all five samples showed that the overall pattern of associations (i.e., the order of their magnitudes) was the same for both genders, even where partial correlations were concerned.
The bivariate correlations and regression results clearly indicate a lack of consistent gender differences in the magnitude of correlation coefficients or beta weights. This finding was considerably substantiated by the invariance tests. None of the Big Five traits were significantly stronger predictors in one gender than the other on a consistent basis, and none of the between-gender model comparisons reached significance. Hence, the aggregated bivariate and partial correlations were very similar in magnitude between men and women. It, therefore, appears that the linkages of the Big Five to trait EI are invariant between men and women. It is interesting to note, however, that the gender-specific correlations reported here seem to be somewhat weaker than correlations observed in gender-mixed samples (Petrides et al., 2010; Siegling et al., 2012; Vernon et al., 2008).
The degree of overlap between the FFM and trait EI scores does not seem to differ systematically between women and men. It was larger for men in some analyses and larger for women in others, with differences ranging from 5% to 14%. Also, the aggregated average R2 values were similar for men and women, showing a difference of only 4%. Group sizes may partly explain these inconsistencies, as the Big Five accounted for more variance in women’s trait EI scores in Samples 2 and 3, in which the corresponding male samples were relatively small. These gender-invariant contributions of personality to the prediction of TEIQue scores are consistent with those reported in previous research on gender-mixed samples, in which the overlap was in excess of 50% (e.g., Petrides et al., 2010; Vernon et al., 2008). Overlap with the Big Five has also been similar, though sometimes slightly smaller, for other self-report measures of EI, specifically for Bar-On’s (1997) Emotional Quotient Inventory and Schutte et al.’s (1998) Assessing Emotions Scale (e.g., Brackett & Mayer, 2003; Dawda & Hart, 2000).
While the results did not reveal systematic gender differences in trait EI’s linkages to personality, they provided some evidence that contributions of personality vary between genders depending on the personality measure used. For example, the range of the Big Five’s contributions to trait EI scores across samples (FFM measures) was larger for men (52%-81%) than for women (54%-68%). Because different measures of the Big Five were used across samples, variables not considered here (e.g., demographics, administration procedures) may have influenced the patterns of results observed and, thus, need to be considered as alternative explanations for differences between the samples. Yet, this possibility may be of relatively minor concern, considering that the samples were fairly homogeneous (aside from the age difference of Sample 2), all comprising English-speaking undergraduate students.
It appears then that the relationships between higher-order personality factors, represented here by the FFM, and the TEIQue/TEIQue-SF are similar between men and women. This finding is important in that it speaks to the invariance of the global TEIQue across groups, in this case, gender. Diverging linkages between groups may indicate a critical degree of multidimensionality of the construct, particularly if these differences were fairly large, consistent, and distinct. The findings also minimize the possibility that the TEIQue measures socially desirable traits, many of which are known to be gender-specific, or desirable for one gender or the other, but not for both (e.g., Spence, 1993). Otherwise, more systematic gender differences in these linkages should have been observed, assuming that women and men would have responded to the items in a socially desirable manner.
Because there were no consistent gender differences in trait EI’s linkages to personality, it seems tempting to attribute any inconsistent differences observed here to measurement variations, sample characteristics (e.g., Sample 2 was significantly older than all the other samples), response accuracy (e.g., as influenced by the use of incentives, administration conditions), and so on, and less to real differences in the associations of the underlying constructs. Regardless, any inconsistencies highlight the need for a more systematic, meta-analytical integration of results, once considerably more data have accumulated in the literature. Not all Big Five measures may represent the Big Five equally well, in which case more credibility should be given to measures that excel psychometrically. More research from different samples taking the same measures of the Big Five under the same conditions will shed light on the external validity of our results.
Although the samples for men and women all met the rules of thumb for the minimum number of cases needed per analysis (Green, 1991), there were considerably fewer men than women across samples. Further, two male groups (Samples 2 and 3) were on the boundaries of the aforementioned rules of thumb. This factor may well have contributed to the variation in sample-specific results obtained here, although it is noteworthy that the statistical models were gender-invariant across samples, including those involving relatively small male groups. Finally, the observed differences in contributions of the Big Five to trait EI across personality measures (with some indication that gender may interact with the type of measure used) further highlight the need for additional evidence and systematic comparison of results from a larger number of samples.
Footnotes
Declaration of Conflicting Interests
The author(s) declared no potential conflicts of interest with respect to the research, authorship, and/or publication of this article.
Funding
The author(s) received no financial support for the research, authorship, and/or publication of this article.