
Abstract
Waste minimisation and prevention are crucial for the circular economy (CE), sustainable development goals (SDGs) and environmental, social and governance (ESG) principles, focusing on waste elimination and resource efficiency. However, there are significant gaps in implementing effective waste minimisation strategies, mainly due to the lack of standardised waste prevention terminologies and indicators. This article introduces a novel simplified and comprehensive framework for assessing waste prevention and minimisation measures tailored to developing countries. The primary contribution of this study lies in proposing relevant indicators aligned with the SDGs, ESG standards, and CE principles, while addressing data scarcity through proxy indicators to enable effective assessment in resource-limited settings. Six key indicators were proposed: Zero Waste Index, Food Loss Index, Extended producer responsibility, Education and awareness programmes for waste minimisation, Waste prevention and Plastic Bag Reduction Ratio. Eleven countries were selected as case studies to demonstrate the framework’s applicability. The findings reveal that while these countries are progressing in enacting legislation and recognising the importance of waste prevention, compliance in practice is lacking, as indicated by poor quantitative results in actual waste reduction and diversion. The framework evaluates the environmental, social and economic implications of waste prevention measures, showing wide variations among countries. Each country faces unique challenges, but strengthening policy frameworks, investing in infrastructure, promoting public awareness and fostering collaboration are key steps towards advancing sustainable waste management practices. The study highlights the necessity for tailored policies addressing specific weaknesses while ensuring economic viability. The integrated framework provides actionable insights and forward-thinking solutions that can be adapted, scaled and replicated to address developing nations’ unique challenges.
Keywords
Introduction
As the global community confronts urgent environmental challenges and resource scarcity, transitioning to a circular economy (CE) necessitates a fundamental shift towards waste prevention and minimisation (Purvis et al. 2023). Central to this transition is a critical focus on strategies to reduce waste generation, aiming to optimise resource utilisation and reduce waste through sustainable practices (Liu and Ramakrishna, 2021). Its importance extends beyond environmental considerations, significantly impacting economic and social development (Epstein 2017). Amidst rapid urbanisation, industrialisation and population growth, waste management poses a multifaceted challenge (Maalouf and Mavropoulos, 2022).
According to recent projections by the United Nations Environment Programme (2024), the generation of municipal solid waste (MSW) is predicted to escalate from 2.3 billion tonnes in 2023 to 3.8 billion tonnes by 2050. The direct global cost of waste management reached USD 252 billion in 2020, with additional hidden costs arising from pollution, health issues and climate change due to improper waste disposal practices, pushing the total cost to USD 361 billion. This issue is particularly acute in developing countries, where 93% of the generated waste is mismanaged through open dumping or burning (World Bank, 2023).
In a complementary study, Maalouf and Agamuthu (2023) focused on waste generation, with a specific emphasis on developing countries. Their findings highlight a significant increase in MSW production, rising from approximately 0.64 billion tonnes in 1970 to 2 billion tonnes in 2019, a growing challenge that developing nations face in waste generation compared to their developed counterparts (Ugwu et al., 2021). Projections indicate that transitioning to a CE model, which decouples waste generation from economic growth through strategies like waste avoidance, sustainable business practices and comprehensive waste management, could result in a substantial annual net gain of USD 108.5 billion (United Nations Environment Programme, 2024).
In 1975, the European Union (EU) enacted the Waste Framework Directive (1975/442/EEC), marking the introduction of the waste hierarchy concept into European waste policies (European Commission, 2014). This directive stressed the importance of minimising waste and prioritising environmental and human health protection. Since then, EU policies have aligned with the principles of waste hierarchy. Ad Lansink, the originator of the waste hierarchy, outlined its significance in his book ‘Challenging Changes – Connecting Waste Hierarchy and Circular Economy (Lansink, 2017). He explained that the waste hierarchy is not a linear process but rather a series of circular processes. Lansink emphasised the crucial role of the upper tiers of the waste hierarchy – prevention, product reuse and material recycling – in achieving a CE.
New frameworks for the traditional waste hierarchy are being explored to adapt to the CE paradigm. While the 4R approach (reduce, reuse, recycle, recover) remains popular and is embedded in the European Commission’s definition, more complex and comprehensive frameworks such as the 9R model (refuse, rethink, reduce, reuse, repair, refurbish, remanufacture, repurpose, recycle, recover) offer analytical insights into resource management and waste reduction strategies (Potting et al., 2017).
Transitioning from reactive approaches to proactive waste prevention is vital for long-term sustainability. The International Solid Waste Association (ISWA)’s Key Issue Paper on Waste Prevention, Waste Minimisation and Resource Management highlights resource management as the process and policy of efficiently managing materials and energy throughout their life cycle to maximise utilisation efficiency and minimise material loss as waste (Goorhuis, 2015). Unlike waste management, which primarily focuses on end-of-life management, resource management adopts a holistic approach covering various stages, from production and consumption to end-of-life strategies.
Waste minimisation and prevention initiatives are essential to both CE and environmental, social and governance (ESG) frameworks (Patil et al., 2021; Subedi et al., 2023). It showcases a company’s and stakeholders’ commitment to environmental stewardship, enhancing its ESG performance and reputation (Quintana-García et al., 2022). Evaluating waste minimisation actions is crucial for assessing social responsibility, governance practices and sustainable business efforts, driving positive outcomes for society and the environment (Guarnieri and Lee-Davies, 2023).
Despite significant advancements in waste minimisation techniques in developed nations, a notable gap persists in transferring these achievements to their developing counterparts (Zaman, 2016). Solid waste minimisation emerges as a critical facet of sustainable waste management, focusing on reducing the volume of waste generated and its environmental impact (Mostaghimi and Behnamian, 2023). It encompasses a spectrum of strategies and practices to avoid waste generation at its source (Khanal et al., 2023), promote reuse and recycling (Kihila et al., 2021) and optimise production processes.
Previous research studies have illuminated significant challenges and advancements in waste minimisation, particularly within developing and developed countries (Mmereki et al. 2016; Kwakye et al. 2024; Zhang et al. 2024). A critical gap identified is the absence of comprehensive, standardised indicators for efficient waste prevention (Yano and Sakai, 2016). Although many metrics have been proposed by various organisations, such as the European Commission (2024), European Union (2008), and the Ministry of Environment in Japan (2023), adopting effective policies is still hindered by problems with data availability and differing regional definitions of waste types.
Despite these contributions, numerous studies, such as those by Moraes et al. (2021) on food waste and Wilts et al. (2019) on Organisation for Economic Co-operation and Development (OECD) countries, often employ a limited focus. This narrow scope can overlook the complex interplay of factors necessary for a truly holistic understanding. Building on these insights, recent comparative studies have investigated waste prevention and minimisation strategies across varied economic contexts. Abarca-Guerrero et al. (2017) and Maalouf and Agamuthu (2023) offer a thorough analysis of the intricate challenges faced by developing countries, suggesting systemic reforms tailored to their unique conditions. In contrast, Nelles et al. (2016) highlighted advanced implementations of CE practices, exemplified by Germany’s exemplary waste management paradigms. Rodríguez-Antón et al. (2022) further expanded this perspective by aligning CE strategies with sustainable development goals (SDGs), highlighting their global applicability and relevance.
Understanding the connection between waste prevention measures is crucial for devising comprehensive strategies that effectively address the multifaceted challenges of global waste management (Ma and Hao 2024). Recent research has illuminated these dynamics, offering invaluable insights. For instance, Brunner et al. (2023) explored successful waste reduction policies in developed countries, presenting a paradigm that may be adapted to emerging economies. Similarly, Kaza et al. (2018) examined MSW management in developing nations, highlighting the socio-economic factors that shape stakeholder engagement and influence outcomes. Coggins (2001) concluded that effective waste management must shift from end-of-pipe solutions (e.g. recycling) to a focus on resource management, highlighting the critical role of both producers and consumers in waste prevention strategies to foster sustainable practices. Bortoleto (2015) underscored the critical need to shift perceptions of consumption and waste. Effective waste prevention requires understanding the relationship between policies and individual behaviours, which can drive meaningful behavioural change and promote sustainable waste management (Bortoleto, 2015).
This study aims to fill this gap by addressing the following research questions: (1) What indicators are studied and proposed in the scientific literature for assessing waste prevention and minimisation in developing and developed countries? (2) What is the proposed framework for assessing waste prevention and minimisation in a developing context?
This article proposes a simplified framework to assess waste prevention and minimisation techniques and practices, aiming to support decision-makers in developing countries. The primary contribution of this study is an extensive survey of both theoretical and practical waste prevention and minimisation strategies documented in scientific literature. A set of relevant indicators was selected from the literature based on their alignment with key principles from the SDGs, ESG standards and CE principles to assess waste prevention and minimisation in developing countries. In cases where data scarcity is common, proxy indicators were proposed. This innovative approach facilitates the standardisation of existing waste prevention and minimisation evaluation metrics and aids in improved applicability and relevance of waste management assessments in resource-limited settings.
Furthermore, several countries across various regions were selected as case studies to demonstrate the proposed framework’s applicability and adaptability in real-world scenarios. These indicators were evaluated based on their environmental, economic and social implications using a multi-criteria analysis (MCA) to allow comparison among countries and assess overall performance. Through this integrated framework, the study aims to provide practical and forward-thinking solutions that can be adapted, scaled and replicated to meet the unique challenges faced by these developing nations. In conclusion, this research endeavours to advance the discourse on sustainable development by promoting inclusive, equitable and environmentally responsible waste management strategies.
Methodology
Overview of research
This study was conducted in collaboration with 13 members of the ISWA Young Professionals Group (YPG), all actively involved in waste prevention and minimisation, particularly in the context of developing nations. This collaboration allowed for the collection of primary and secondary data from developing countries, drawing from current and previous research efforts. The data collection phase occurred between January and June 2024, during which ISWA YPG members conducted investigations in various countries. The research methodology involved an extensive scientific literature review, resulting in a proposed framework based on selected indicators specifically tailored for developing countries. Specifically, the study aimed to gather detailed insights into effective waste minimisation and prevention actions that could be replicated in other developing countries. Table SM1 in the Supplemental Material describes the research steps, whereas Table SM2 outlines the key contributions.
Scope definition
In the existing literature, waste prevention and minimisation practices are delineated through diverse conceptualisations and terminologies, often referred to by distinct terms like ‘waste prevention’, ‘waste reduction’, ‘waste diversion’, ‘waste avoidance’ or ‘waste minimisation’, as detailed in Table SM3 (Supplemental Material). In this study, we have defined and categorised various terms related to this field aimed at reducing waste generation and its environmental impact, focusing specifically on waste prevention/avoidance/reduction (referred to hereinafter as ‘waste prevention’) and waste minimisation/reduction (referred to hereinafter as ‘waste minimisation’).
‘Waste prevention’ encompasses all proactive measures taken before materials become waste, involving actions by stakeholders – ranging from manufacturers to consumers – to ensure waste is not generated. This includes redesigning products and manufacturing processes to be more sustainable, utilising materials with lower environmental impact, reducing the use of hazardous substances and encouraging behaviours that minimise waste generation at the source.
‘Waste minimisation’ involves measures taken after materials have become waste but aims to reduce the overall volume and toxicity. This includes volume reduction by using less raw material, switching to easily recyclable materials, reducing multi-material packaging, extending product lifespans, promoting the reuse of existing materials and implementing recycling and remanufacturing processes. The distinction between these two categories lies in the timing and focus of the interventions: waste prevention is about preventing waste creation, while waste minimisation focuses on managing waste more effectively before handing it to the waste collection, treatment and disposal systems. This study considers all measures, choices, attitudes and practices different stakeholders adopt for effective waste prevention and minimisation. It is important to highlight that ‘waste diversion’, which considers the practices of rerouting waste away from landfills and incinerators to alternative destinations, commonly recycling and composting, although other options like reuse, repurposing and sometimes energy recovery are also considered, is not part of the scope of this study.
Data collection
An extensive literature review was conducted to identify existing indicators for assessing waste prevention and minimisation available in the literature. We specifically looked for studies that addressed both developed and developing countries’ contexts to ensure the broad applicability of our findings. The literature review focused on scientific peer-reviewed articles in English; no start date was specified. Reports, books and conference proceedings were deliberately excluded. Keywords such as ‘waste prevention’, ‘avoidance’, ‘minimisation’ and/or ‘reduction’ were combined in different ways alongside their synonyms (minimise*, reduce*, ‘zero waste’, or ‘avoidance’) and (‘method’, ‘case study’, ‘indicator’ or ‘practice’), as well as scale-specific terms (‘developing countries’, ‘developed countries’, ‘local’ or ‘municipal’). The word search was conducted across various academic search engines such as Scopus, Web of Science, SAGE, Science Direct and Google Scholar. Identified articles underwent manual screening to eliminate irrelevant literature, such as content concerning sorting, reuse, recycling, landfilling and incineration, which fell outside the scope of waste prevention and minimisation. Furthermore, geographical criteria were applied to include publications relevant to both developed and developing countries, thus ensuring the findings’ applicability to a developing context.
This study used secondary data collected from public reports, governmental sources and academic publications on waste composition (organic, paper, plastics and others), waste statistics, baseline conditions of the selected countries and policies for waste reduction in developing countries to analyse the selected indicators and proposed framework. In case of data unavailability, the regularly updated ‘What a Waste Global Database’ (World Bank, 2024), which compiles available data from nearly all countries, has been used in this study.
Proposed framework for assessing waste prevention and minimisation in developing context
Figure 1 demonstrates the proposed framework that comprises four principal steps: (1) Indicators selection: building on the existing literature, six relevant indicators in the context of waste minimisation and prevention were selected based on their direct linkage with CE, ESG and SGSs principles and specifically adjusted to be applicable in the context of developing economies when data is unavailable. (2) Indicators scoring: a scoring system was adopted to assess the overall performance of a specific country in terms of waste prevention and minimisation. (3) Impact evaluation: assessment of each indicator’s environmental, social and economic implications. (4) Overall scoring: combined scoring of each country’s performance in waste minimisation and prevention measures, along with the environmental, social and economic implications of this performance, to facilitate comparison between countries.
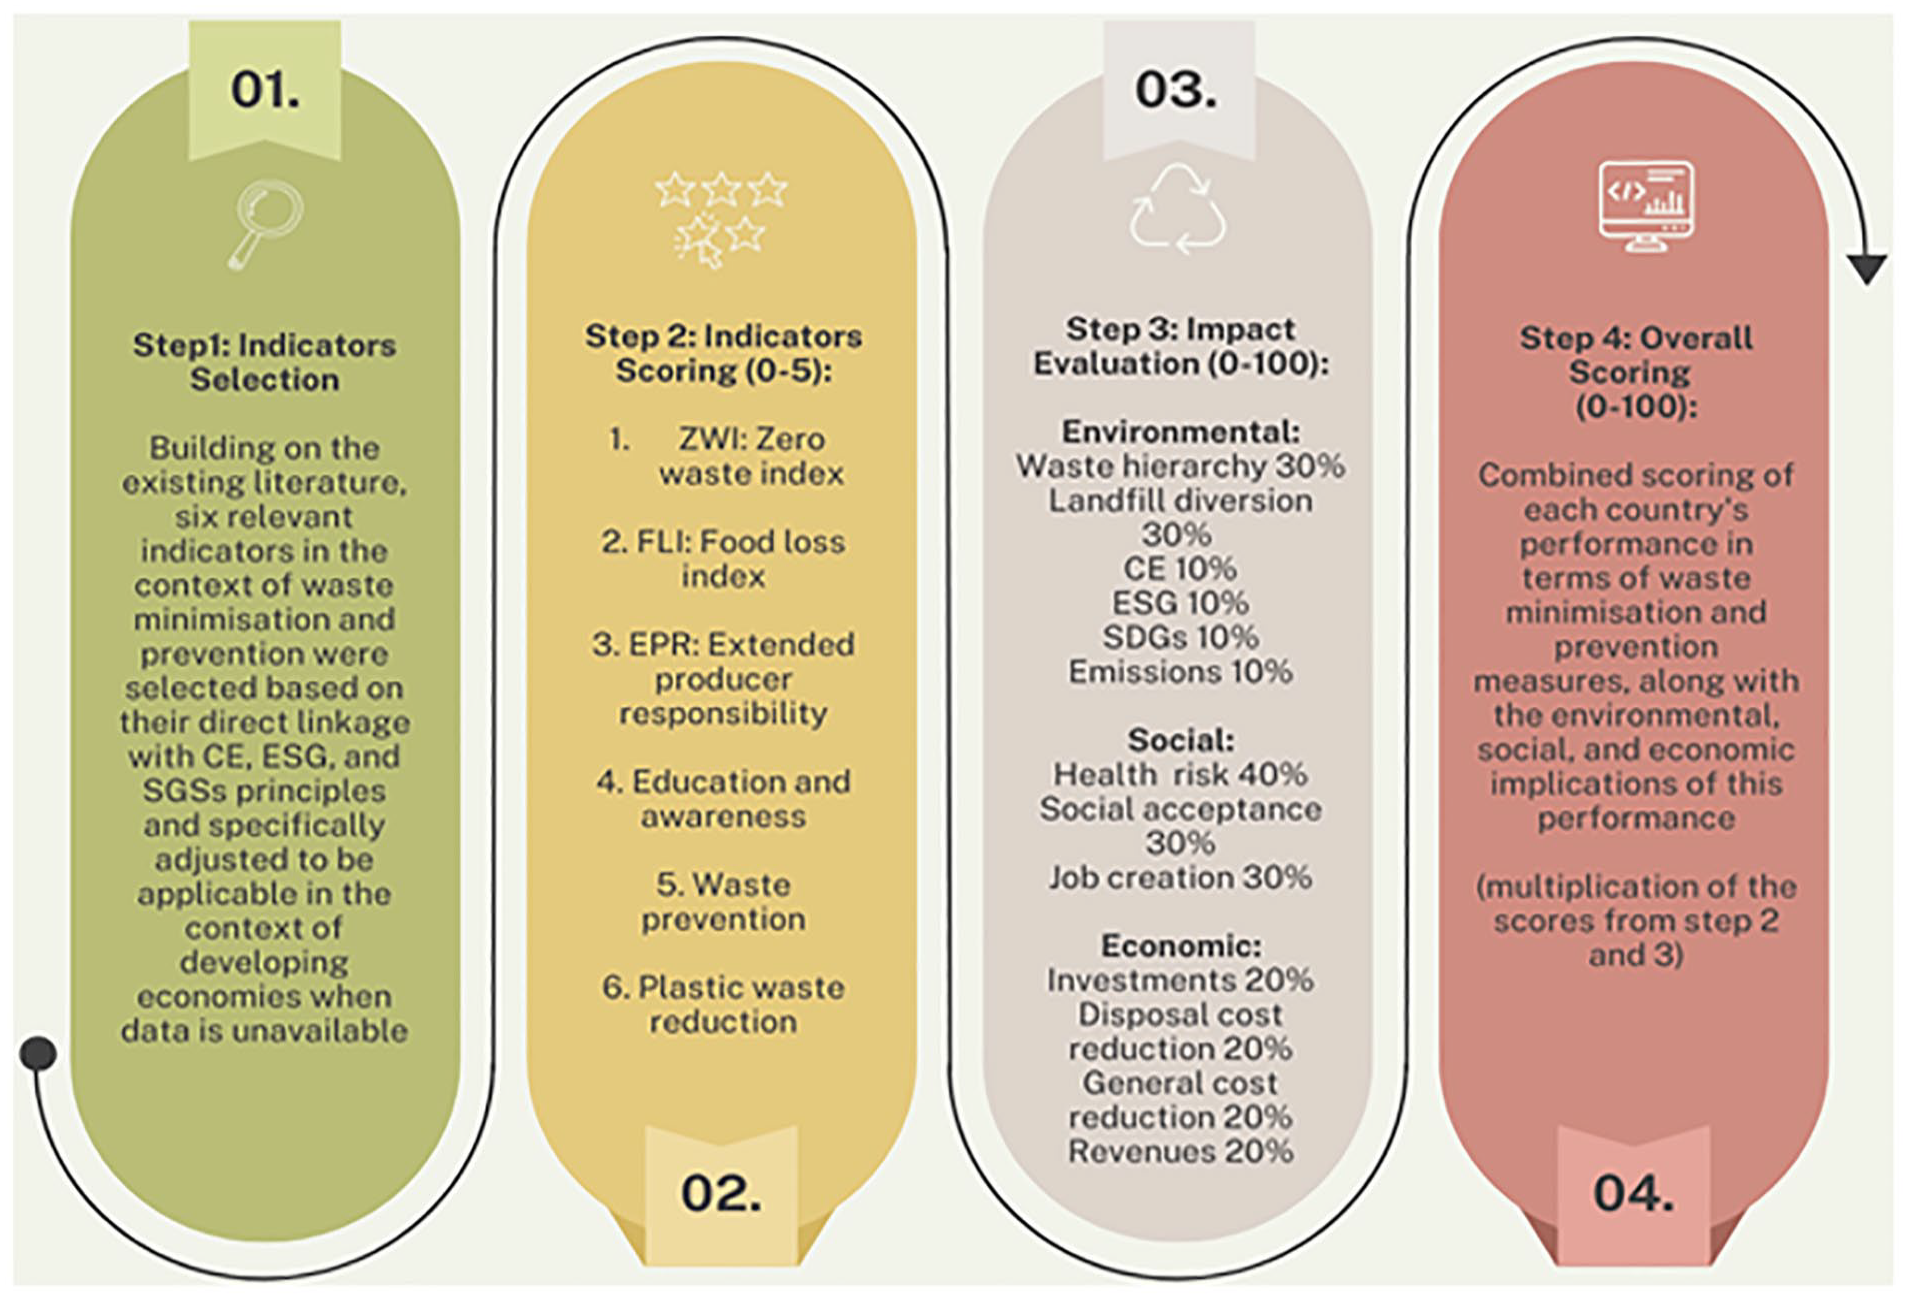
Proposed framework for assessing waste prevention and minimisation in developing countries (developed by the authors).
A simplified Excel tool (SM2: Proposed Framework) is available in the Supplemental Material for further details.
Indicators’ selection
A literature review was conducted, and the techniques and practices identified in this article were categorised into different fields, including education, awareness, regulations, policies, technology, research, innovation and economic incentives or penalties.
These categories were established through discussions among the authors regarding the similarities among the identified practices. Subsequently, a dataset was compiled, organising these practices based on their objectives within the waste value chain and the stakeholders involved. Furthermore, the fields were grouped into four major clusters to facilitate content analysis, including (1) Education and awareness; (2) Policies, regulations and governance; (3) Technology, research and innovation; (4) Economic incentives and penalties.
The complete results from the review process are presented in the Supplemental Material (Table SM4), where all 28 indicators and practices are shown with their fields and references.
Out of the 28 indicators, six were selected for this study: Zero Waste Index (ZWI), Food Loss Index (FLI), Extended Producer Responsibility (EPR), Education and Awareness, Waste Prevention and Plastic Bag Reduction Ratio. These indicators were selected following a thorough analysis as the most suitable for assessing the impact of MSW prevention and minimisation in developing countries. These indicators reflect the developing country’s main challenges and address primary waste types such as organic and plastic waste. The selection was also based on their alignment with SDGs, CE and ESG principles. A detailed linkage of these indicators with their respective principles is provided in Table SM6 in Supplemental Material.
Table 1 summarises the six proposed indicators; they form the foundation of the framework proposed in this study and are further analysed in the following sections. The table outlines the relevant fields, corresponding methodologies, definitions of waste reduction indicators, proxy indicators used when data is unavailable, related practices for each field and their respective sources. These indicators were categorised into quantitative and qualitative types. While specific, measurable values characterise quantitative indicators, qualitative indicators often display binary outcomes, such as affirmative or negative responses. This categorisation elucidates the diverse methodologies employed in assessing and addressing waste prevention and reduction practices.
Summary of proposed indicators for assessing waste prevention and minimisation techniques and practices (developed by the authors).
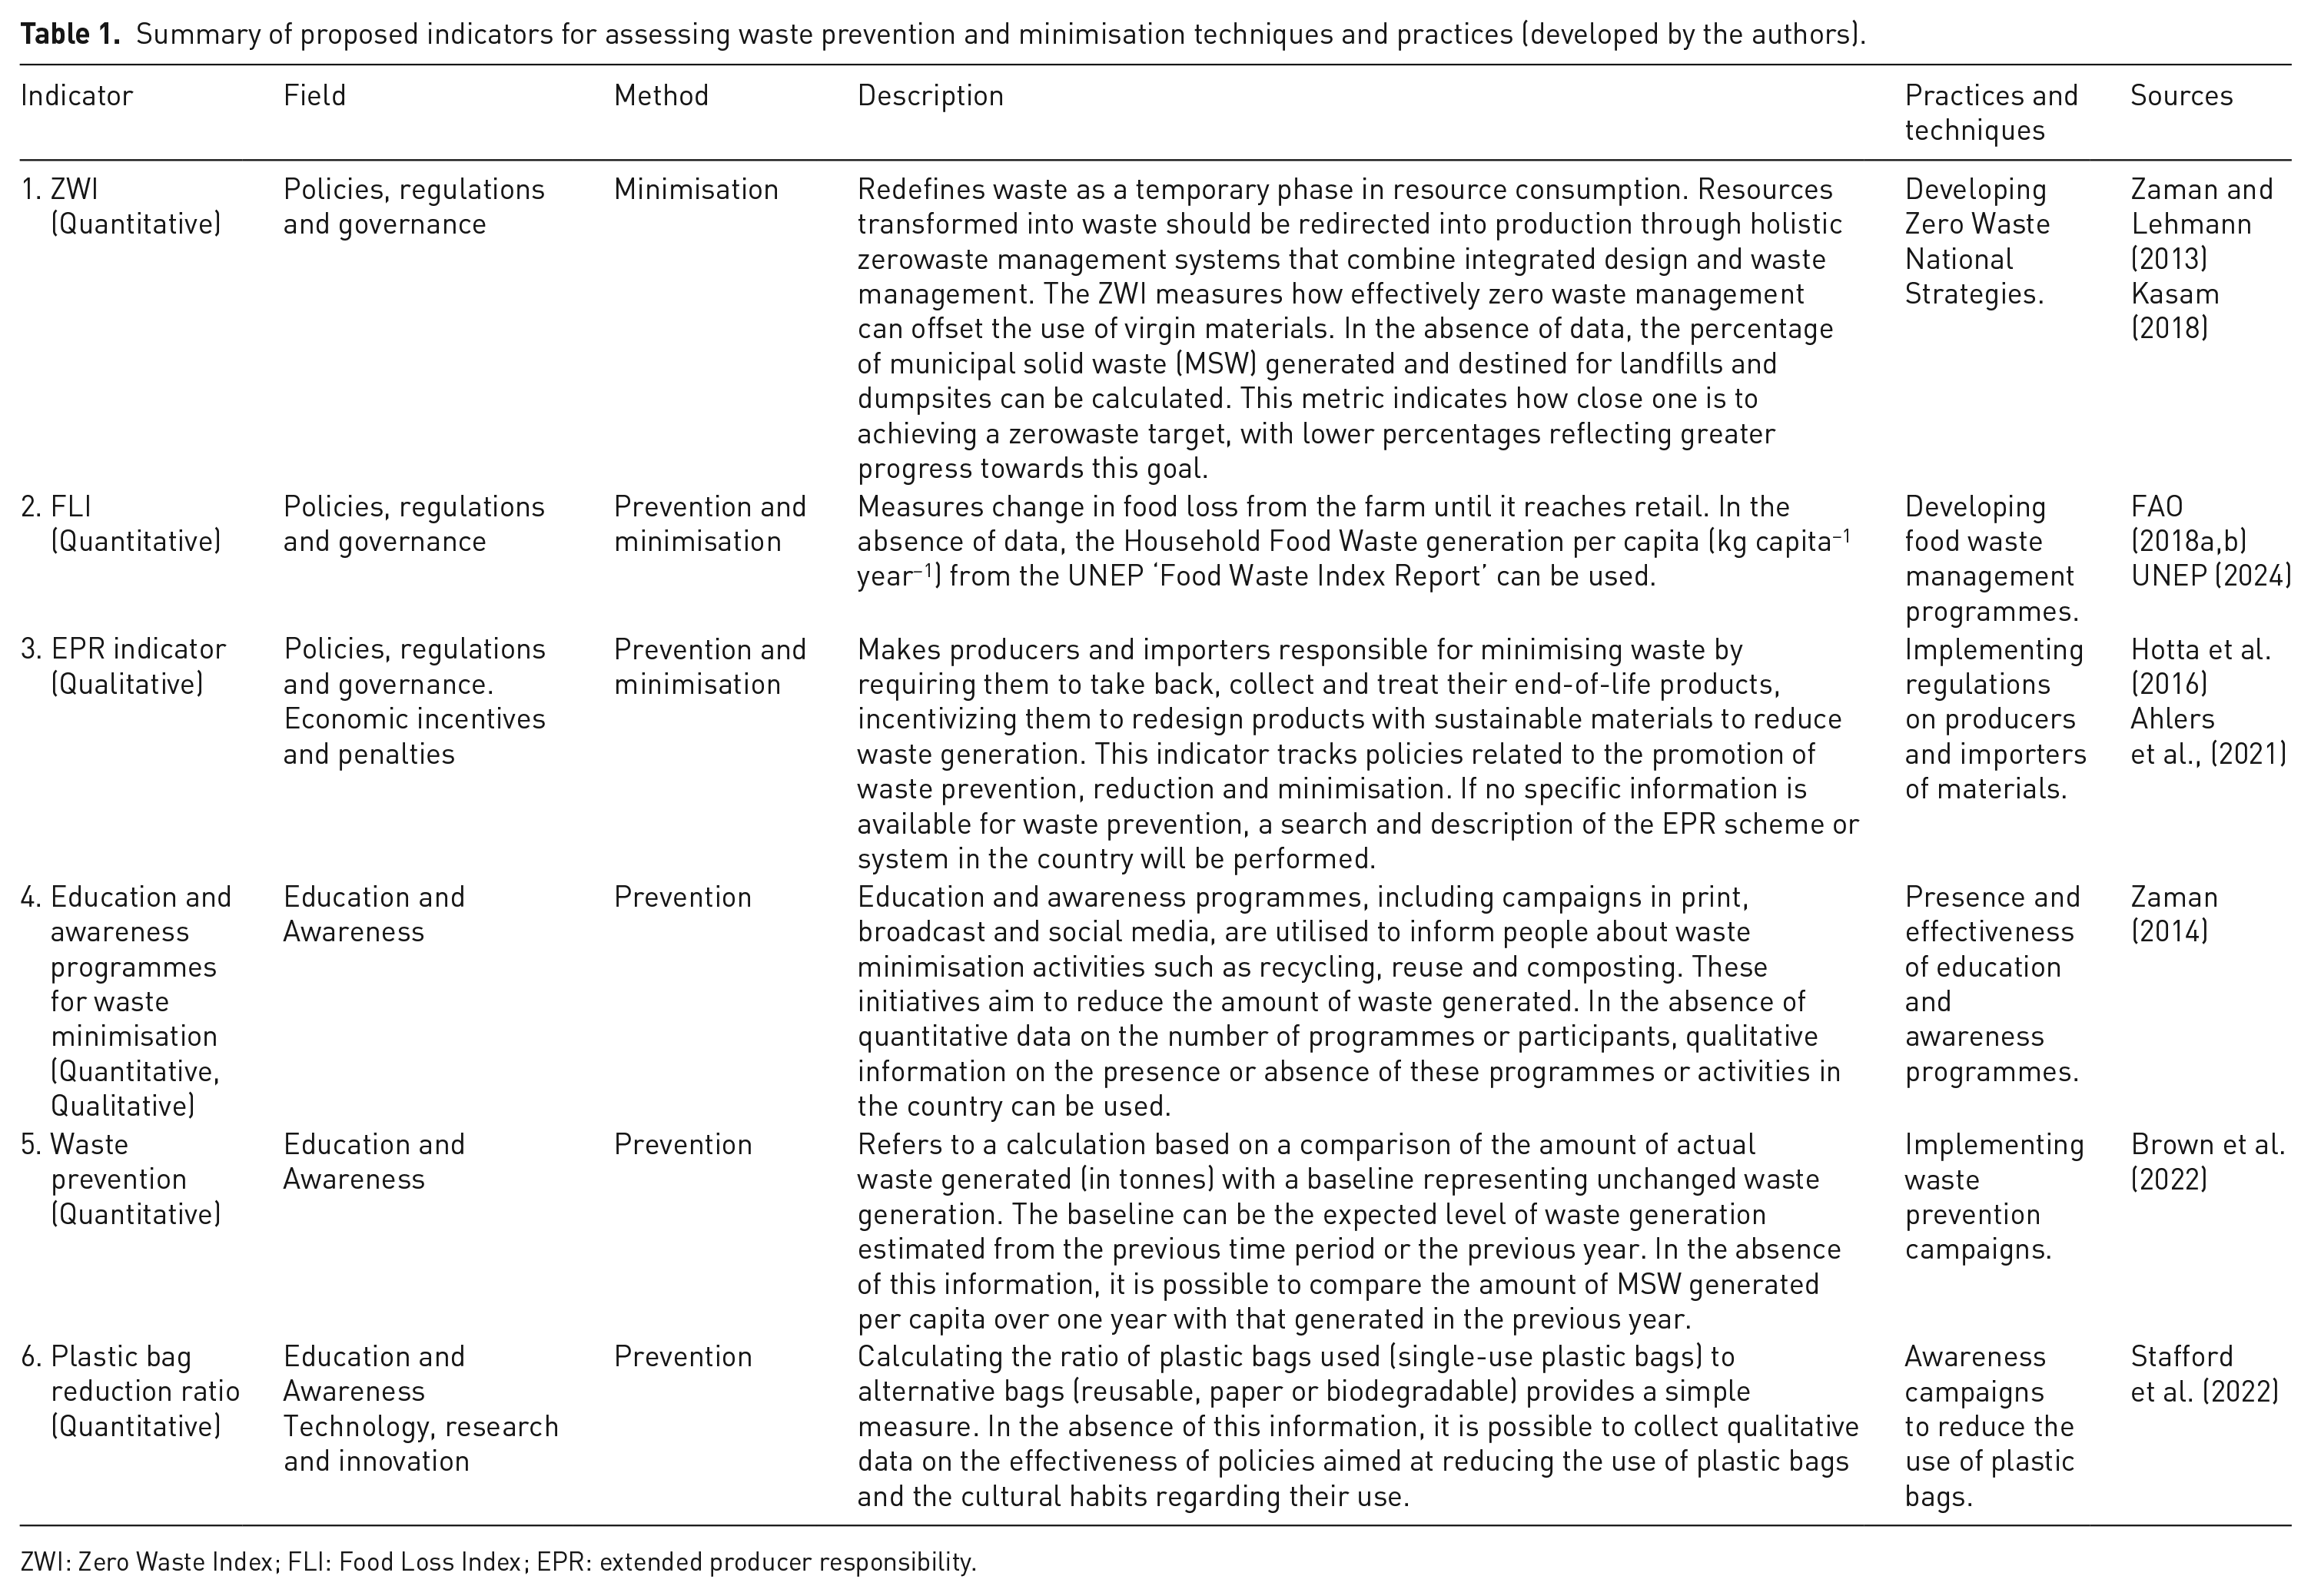
ZWI: Zero Waste Index; FLI: Food Loss Index; EPR: extended producer responsibility.
It is important to acknowledge that using the same waste prevention indicators for comparison across regions is challenging due to data availability and quality variations. As mentioned by Yano and Sakai (2016), indicators must be adapted to suit each region’s various situations and periods, for which this study proposes using proxy indicators when data is unavailable, enabling a fair comparison of performance across the selected developing countries. Table SM5 (Supplemental Material) provides methods for measuring these indicators and possible adjustments to account for data gaps. However, it is important to note that proxy indicators can introduce biases and limitations, especially when unobserved factors influence participation and outcomes, which may compromise generalisability (Anton et al., 2022). Therefore, careful selection of proxy variables is essential to accurately capture the underlying constructs, minimise spurious relationships and enhance research validity (Ryan and Seltzer, 2021). Finally, this study emphasises the need to refine these indicators in future research to improve their accuracy and applicability.
Indicators scoring
After selecting the indicators, each was assigned a score on a scale of 0 to 5 for each country under study. A score of 0 indicated a lack of relevant information for that indicator. A score of 1 represented the poorest performance, with scores increasing incrementally up to 5, signifying the best performance in waste minimisation and prevention measures. Further details regarding the criteria used to define score ranges for each indicator can be found in Table SM7 of the Supplemental Material.
Impact evaluation
An MCA approach was utilised to systematically assess the environmental, social and economic implications of the indicators. MCA is a widely used tool in solid waste management (Karmperis et al., 2013). For example, Yap and Nixon (2015) used MCA to evaluate alternative technologies for energy recovery from MSW, whereas Antonopoulos et al. (2014) employed it to rank MSW treatment alternatives based on their ecological footprint. The principle of MCA involves breaking down the decision problem into smaller components (sub-criteria), analysing each component individually and then integrating them logically by assigning different weights based on their importance. This method aims to minimise the subjectivity inherent in evaluation procedures.
The choice of MCA was based on its flexibility in accommodating both quantitative and qualitative criteria, which was essential for our case given the diverse nature of the factors under consideration (e.g. environmental, economic and social). Additionally, MCA was preferred due to its ability to integrate the input from multiple stakeholders in a transparent and participatory manner. In contrast to more structured methods like AHP or ELECTRE, MCA provided adaptability to handle the complexity of stakeholder preferences without becoming overly prescriptive, and this helped ensure the decision-making process remained inclusive and aligned with the waste minimisation objectives and our study’s objective (Palafox-Alcantar et al., 2020).
This study used MCA to assess a range of waste minimisation indicators across environmental, social and economic criteria. Table 2 presents the sub-criteria evaluated within the three main aspects and the weights assigned to each. The environmental, social and economic criteria were assigned weights of 40%, 30% and 30%, respectively. These weightings were informed by the researchers’ experience in waste management and supported by relevant literature. The results are weighted to reflect the importance of each criterion and sub-criterion within the study, ensuring a balanced and accurate evaluation. As a result, the environmental criterion is given greater emphasis, reinforcing the critical role of waste prevention and reduction in the context of a country’s environment.
Environmental, social and economic evaluation of the proposed indicators.
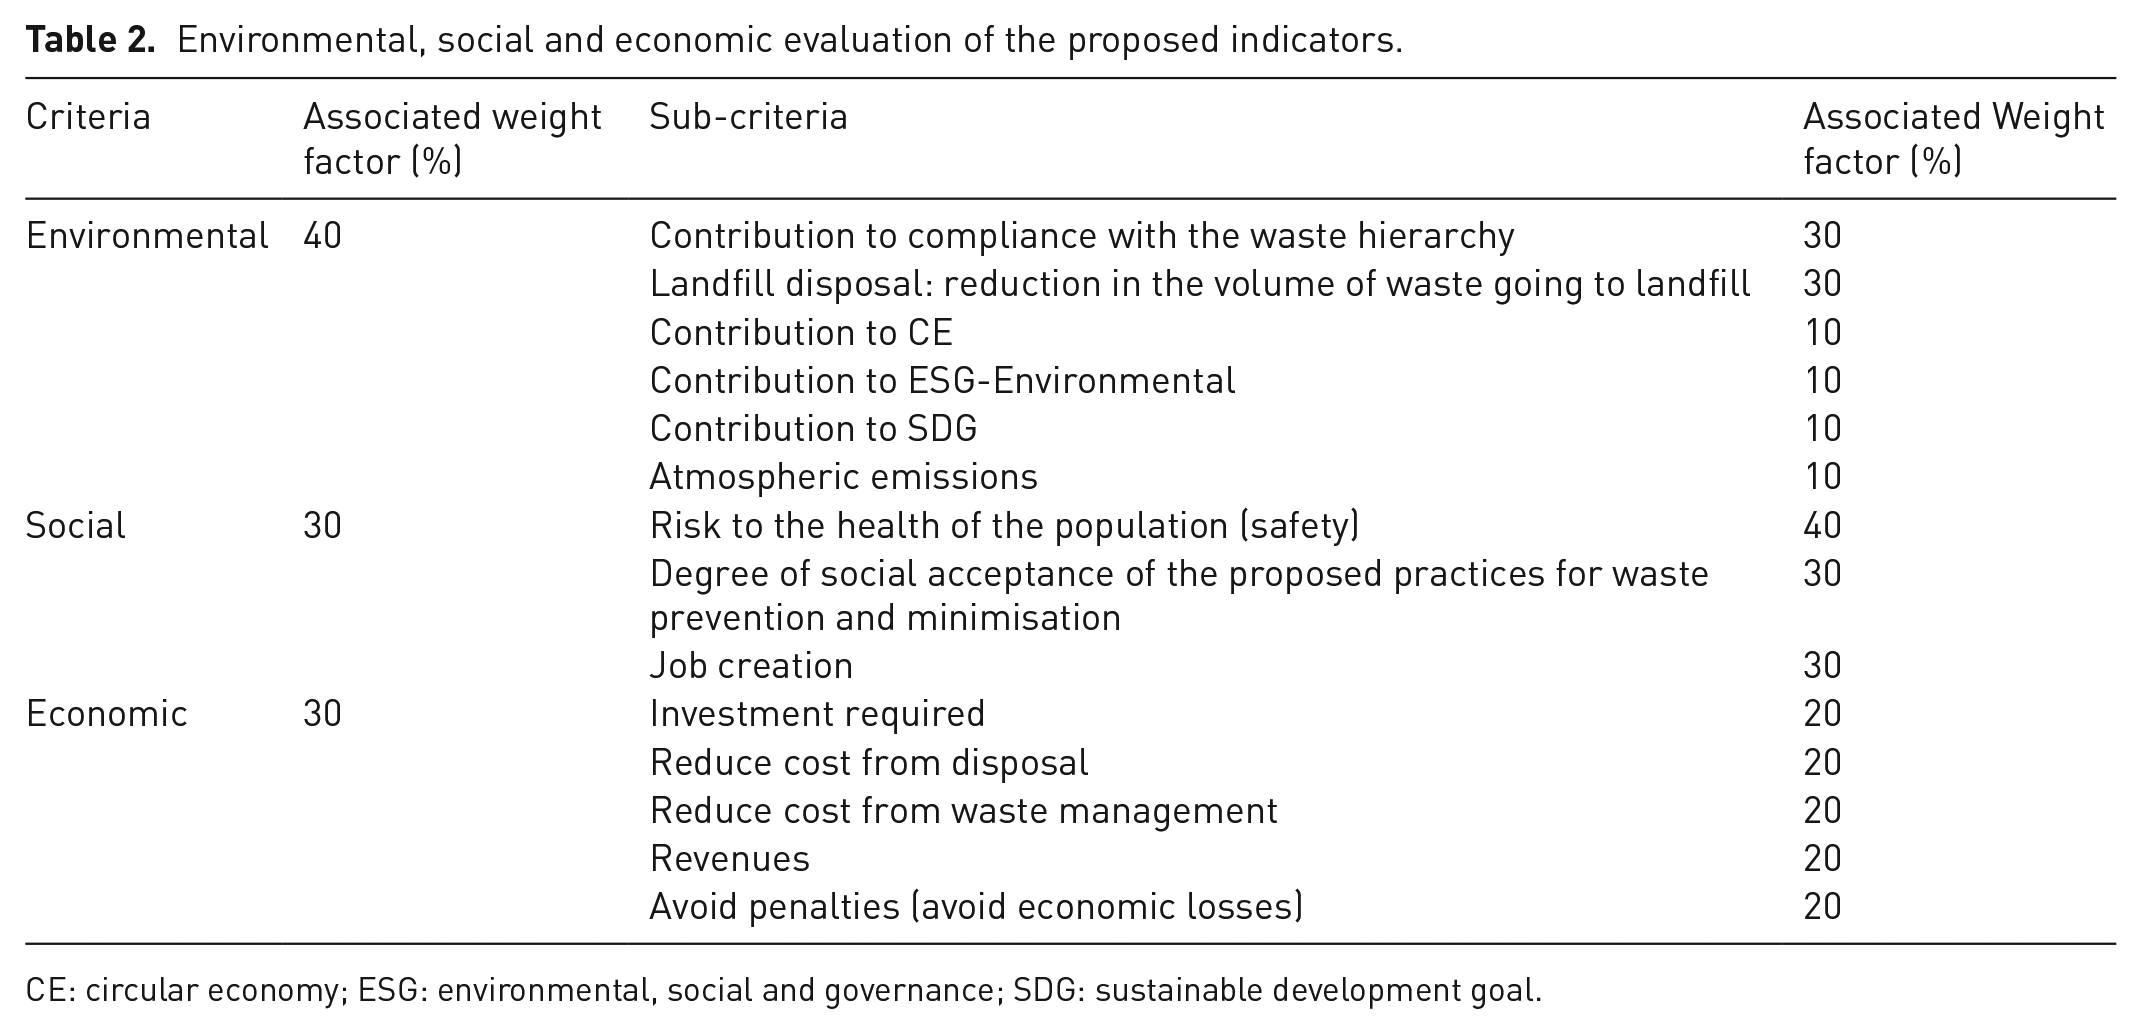
CE: circular economy; ESG: environmental, social and governance; SDG: sustainable development goal.
For each indicator, the impact associated with each sub-criterion was evaluated by assigning a value from 1 to 5, with 1 indicating a minimal impact and 5 indicating a significant impact. The impact of each indicator was evaluated based on four key aspects:
Degree of impact: This refers to how indicator improvement can positively influence the sub-criterion under consideration. For example, the ZWI aims to significantly reduce the amount of waste going to landfills, potentially reducing this value to 0%. Therefore, its impact on this sub-criterion would be rated as 5.
The weight of the waste stream: This refers to the proportion of the waste stream directly affected by the indicator. Indicators affecting larger fractions of the waste stream receive higher scores, while those impacting smaller fractions receive lower scores. For instance, while the Plastic Bag Reduction Ratio indicator contributes to reducing waste going to landfills, its impact is negligible due to plastic bags representing only a tiny fraction of the total waste stream. Consequently, the impact of the Plastic Bag Reduction Ratio on this sub-criterion will be rated lower.
The speed of effect: This refers to the rapidity with which improvement of the indicator affects the sub-criterion, with slower effects resulting in a lower score. For example, measures or actions related to public awareness are typically characterised by a more gradual and progressive influence. It often takes time for voluntary changes in the habits of the population and society to have an effect, thus receiving a lower score compared to more immediate interventions.
Area of influence: This aspect refers to the scope of the indicator’s impact on the population. Indicators affecting only a small population segment received a lower score due to their limited reach and slower overall effect. For example, the efficacy of citizen awareness programmes is often limited by their narrow focus on a select segment of the population and participation in these programmes is typically constrained to small, isolated groups. In contrast, legislative measures like laws regulating recycling or sorting can affect the entire population nationally, making them more impactful and therefore scoring higher due to their broader and more immediate influence.
The results of the MCA for each indicator are illustrated in Figures SM1 and SM2 in the Supplemental Material. This comprehensive approach ensures a balanced evaluation of the environmental, social and economic implications of waste minimisation strategies.
Overall scoring
To calculate the overall score for each country, the indicator scores were multiplied by the environmental, social and economic values obtained through the MCA for each indicator. This process produced a composite score reflecting the environmental, social and economic impacts of each country’s waste prevention and minimisation measures. A detailed overview of the scoring methodology can be found in the simplified Excel tool (SM2: Proposed Framework) provided in the Supplemental Material, which outlines the proposed framework.
Application of the proposed framework: Selected countries
To demonstrate the applicability of the proposed framework, 11 countries were selected as case studies. The selection criteria included factors such as each country’s waste management profile, unique characteristics and the authors’ familiarity with these locations and access to pertinent data. The aim was to encompass countries of diverse sizes, populations and geographic, climatic, economic and political conditions. This selection included a mix of high-, middle- and low-income countries, with a predominant focus on low- and middle-income nations, consistent with the approach taken by Wilson et al. (2012) to compare developed and developing countries.
In line with the World Economic Situation and Prospects classification, the study compared 10 developing countries with one developed country (United Nations Department of Economic and Social Affairs, 2021). Emphasis on developing countries results from their significant waste management challenges, such as the prevalence of dumpsites and open burning, informal recycling practices, plastic pollution and inadequate waste collection services, as highlighted by Maalouf and Agamuthu (2023).
The selection of countries also considered the availability of relevant data and the authors’ direct knowledge of MSW management systems, informed by their ongoing research, project engagements and field studies in these countries. This selection approach mirrors that employed by Ferronato et al. (2023) in their review. Table 3 provides detailed information regarding the selected countries and their characteristics. Additional data regarding the baseline conditions, including the current proportion of waste generated that is collected and sent to landfills, dumpsites or other forms of waste management, can be found in the Supplemental Material ‘Application of proposed framework: Selected countries (case studies)’.
Introduction of countries assessed (GNI<12,850 USD for developing countries).
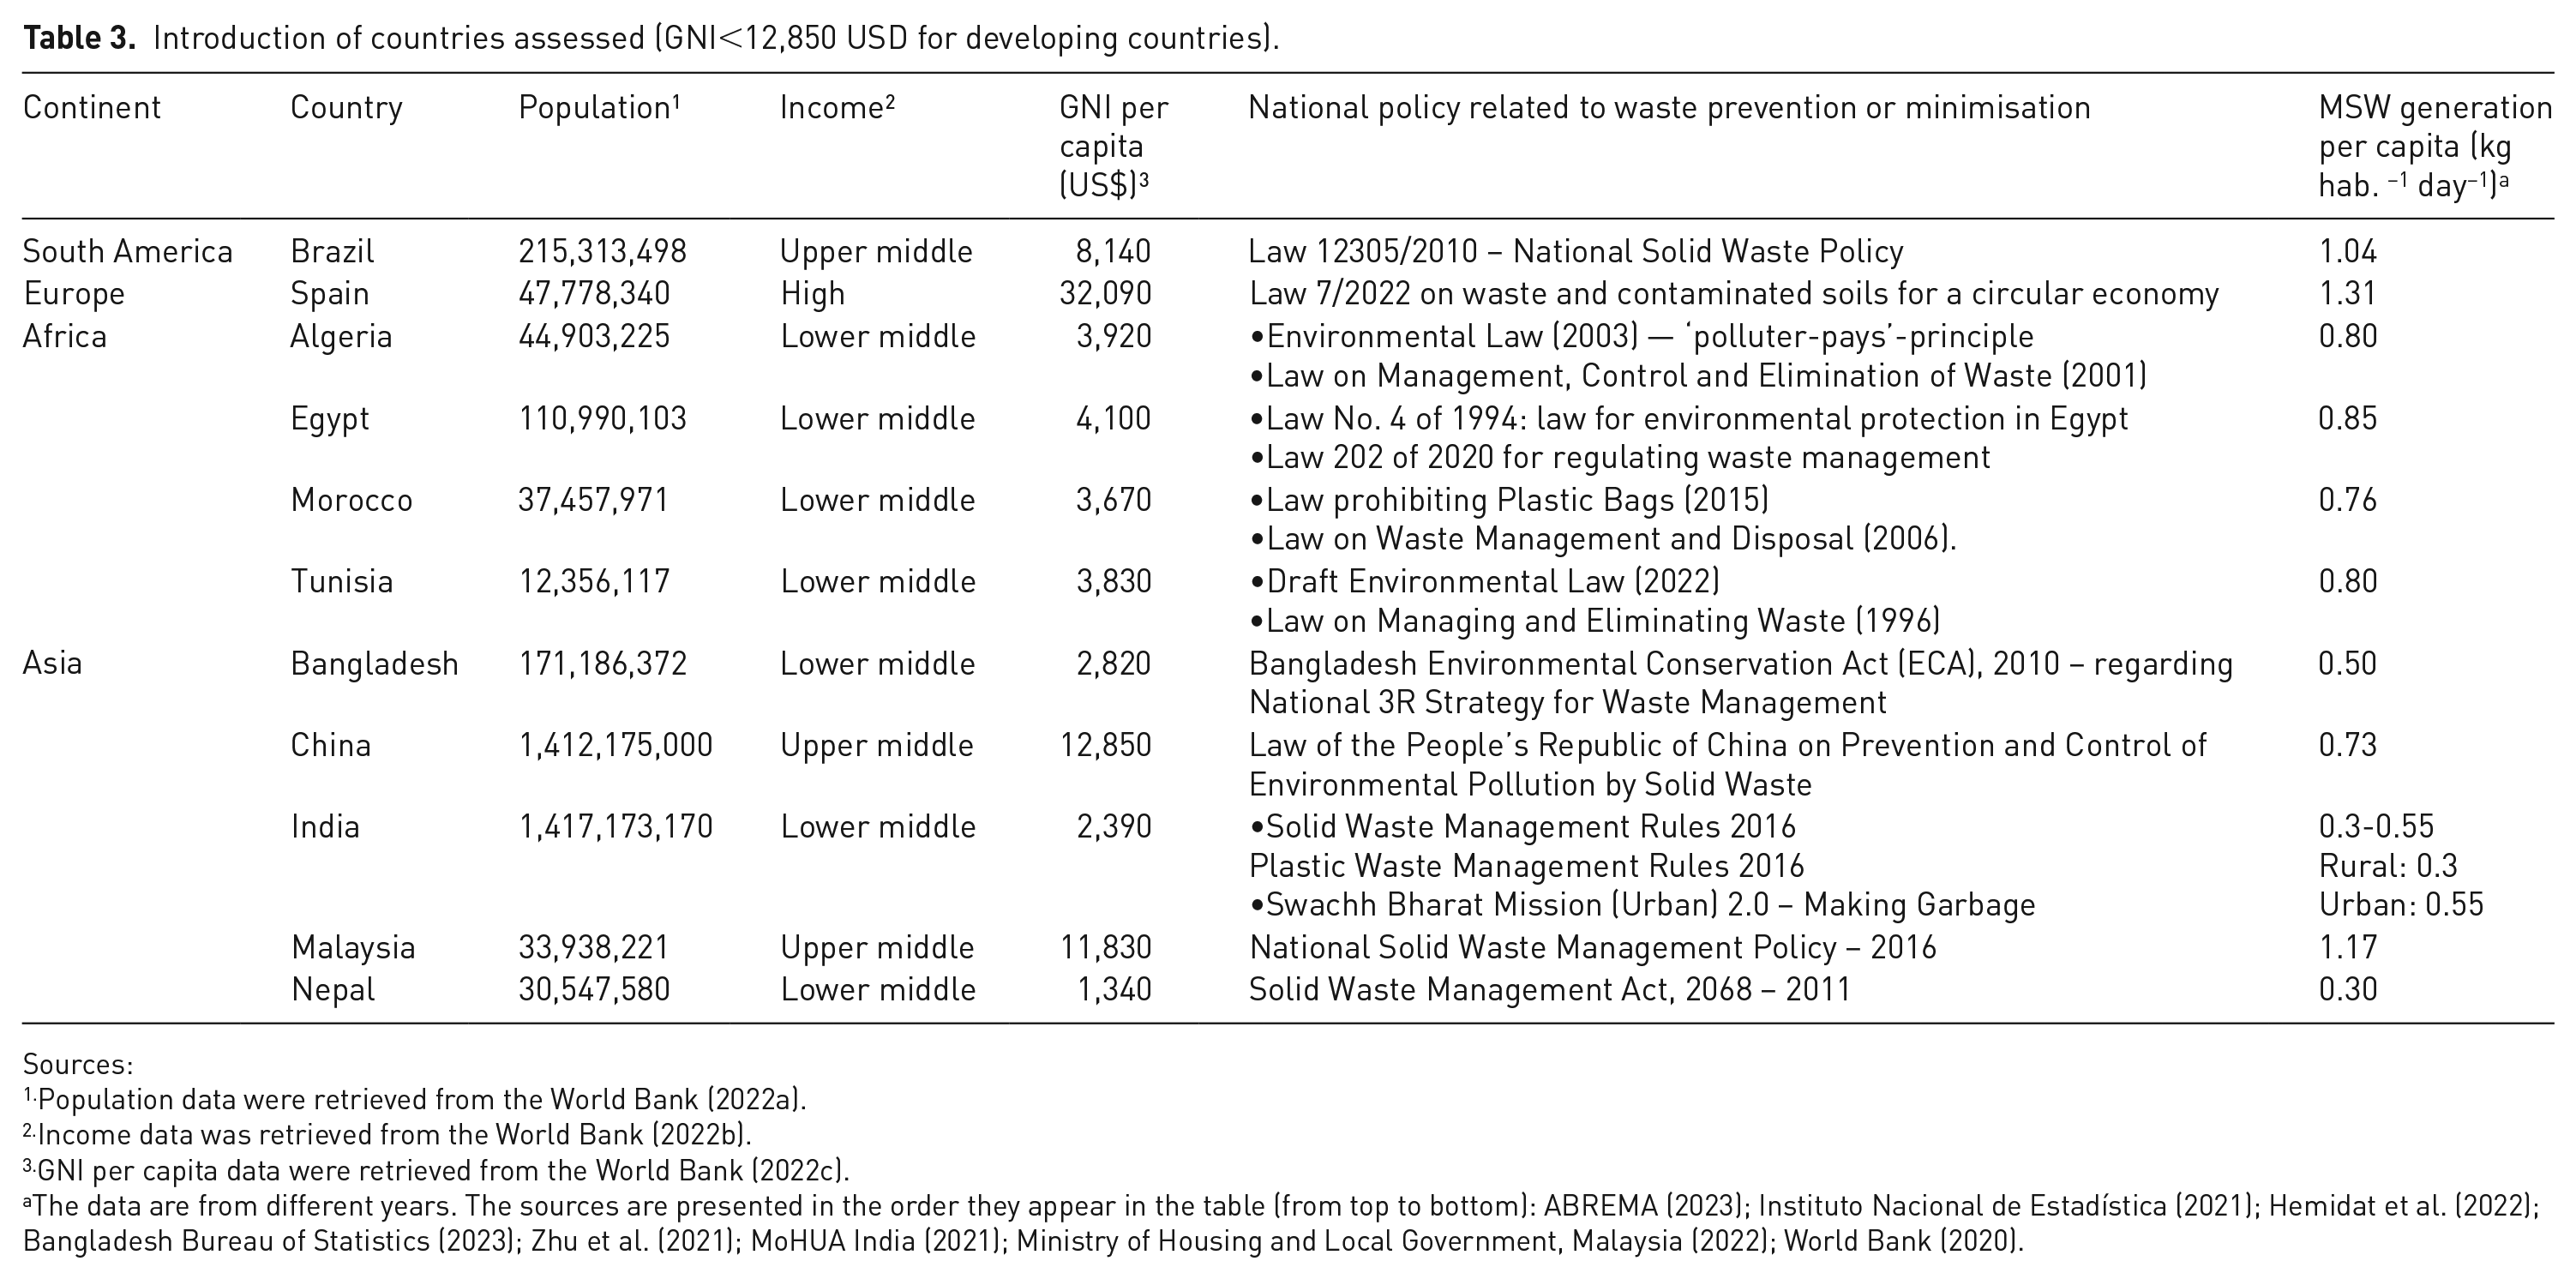
Sources:
Population data were retrieved from the World Bank (2022a).
Income data was retrieved from the World Bank (2022b).
GNI per capita data were retrieved from the World Bank (2022c).
The data are from different years. The sources are presented in the order they appear in the table (from top to bottom): ABREMA (2023); Instituto Nacional de Estadística (2021); Hemidat et al. (2022); Bangladesh Bureau of Statistics (2023); Zhu et al. (2021); MoHUA India (2021); Ministry of Housing and Local Government, Malaysia (2022); World Bank (2020).
These countries were explicitly chosen to illustrate the effectiveness and adaptability of the proposed framework in diverse contexts. By focusing on developing countries, the study aims to address the unique waste management challenges they face and provide a comprehensive assessment method that can be tailored to varying local conditions. More detailed information on the overall score calculation is provided in the Supplemental Material (Table SM8), using India as an example.
Most of the selected countries are in Asia and Africa, with 63.6% classified as lower-middle-income. There is significant variability in their Gross National Income (GNI) per capita, with higher values observed in Spain, China and Malaysia and lower in Nepal, India and Bangladesh. About 45% of the included countries have populations exceeding 100 million, with India, China, Brazil and Bangladesh ranking among the ten most populous countries globally.
Spain was chosen as the developed country for comparison due to its specific waste prevention and reduction policy (Law 7/2022). In 2021, Spain achieved a recycling rate of 19.8% and a composting rate of 22.4%; however, 57.6% of municipal waste was still directed to incineration or landfills (Ministry for the Ecological Transition and Demographic Challenge, Spain, 2021), indicating opportunities for improved waste management practices.
All selected countries have a national policy, plan or programme focused on solid waste reduction and minimisation, though the comprehensiveness of these policies varies. Some policies, such as the Brazilian Solid Waste Policy and Indian Solid Waste Management Rules, prioritise waste reduction without specifying implementation strategies, whereas others provide detailed directives. However, it is important to note that the existence of policies does not necessarily mean they are being implemented in the selected countries. It simply indicates that discussions on the topic have begun, which is why these countries were included in the research for a more in-depth analysis of the application of the overall performance of prevention and minimisation. More detailed information on the waste generation and composition of the selected countries is provided in the Supplemental Material (Figure SM3).
Results and Discussion
Evaluation of waste reduction and minimisation measures in the context of developing countries
This section provides an overview of waste reduction and minimisation practices in the ten assessed developing countries using the selected indicators. Figure 2 summarises general findings about these countries based on the indicators proposed in this study. Due to limited data availability for the primary indicators, similar proxy indicators were used to gather equivalent information, ensuring a common basis for comparison (see Table SM5 in the Supplemental Material). These proxy indicators enabled meaningful comparisons across countries while acknowledging their potential limitations and the need for refinement in future studies to improve accuracy and minimise biases.
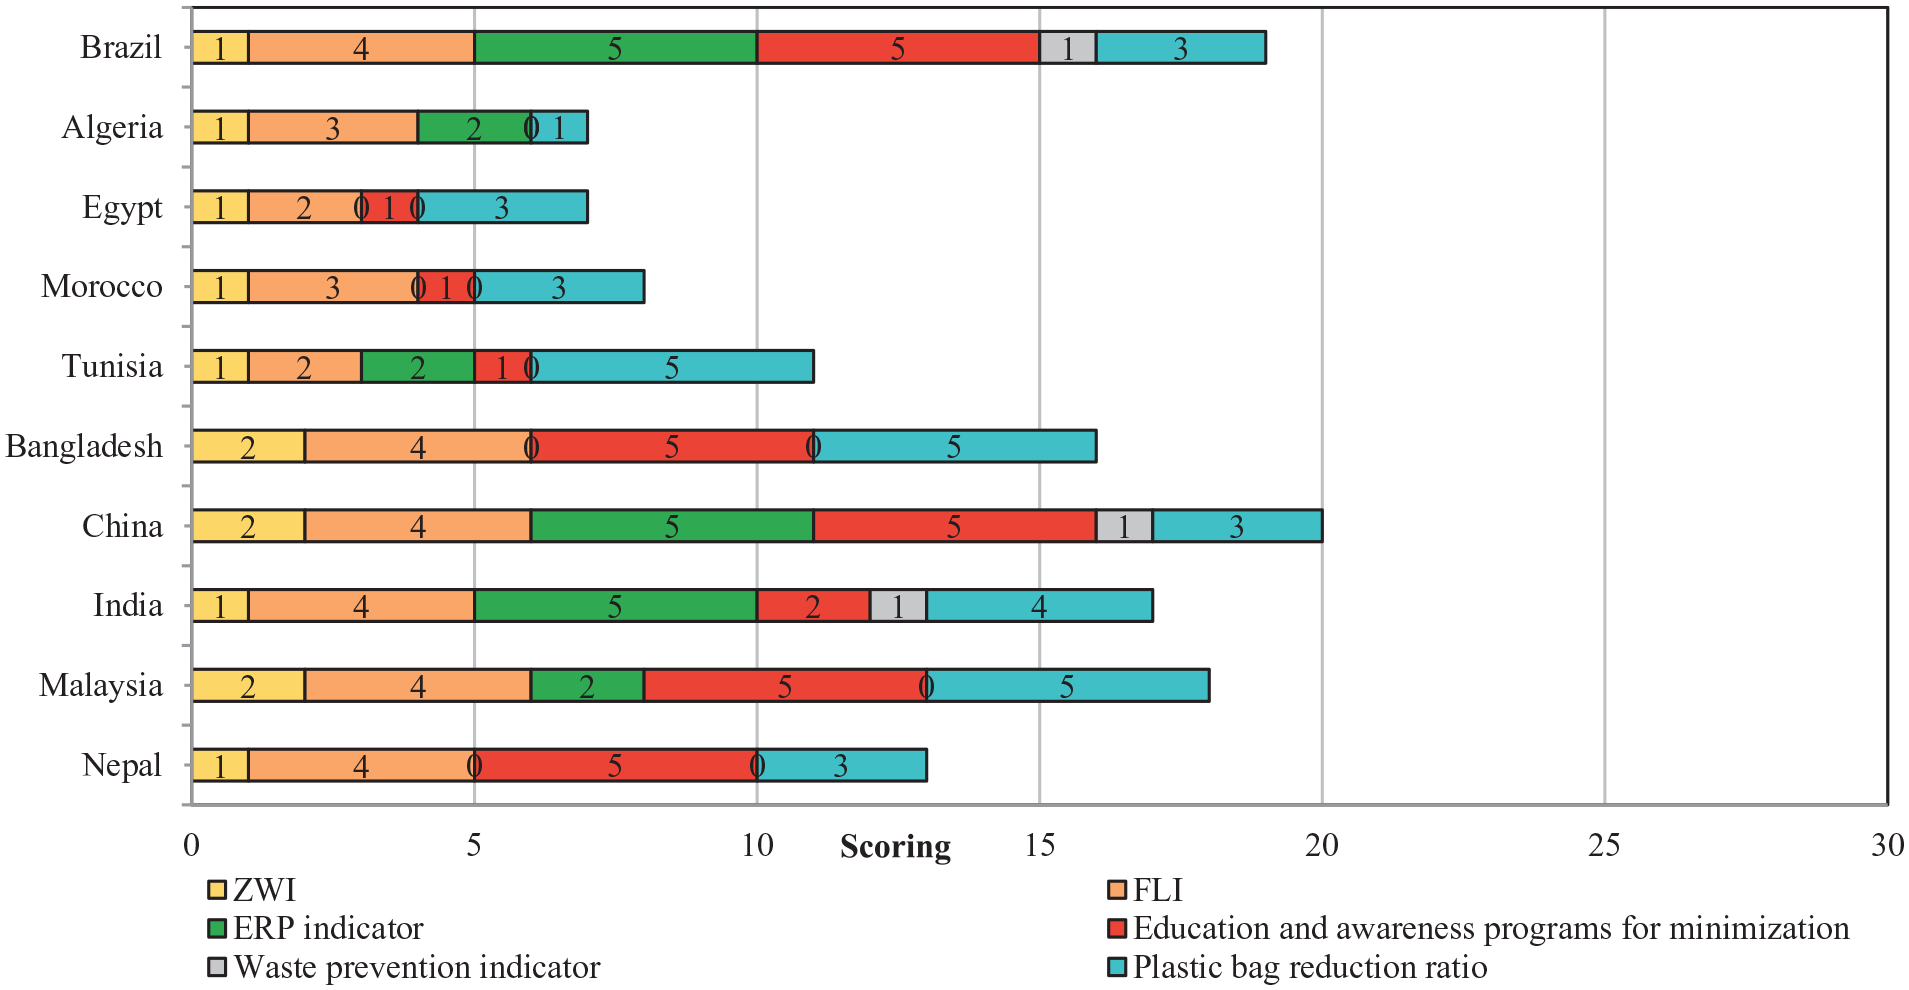
Scoring of the indicators by country.
The scores of the countries studied ranged from 7 to 20, with none achieving the maximum score of 30. China had the highest score of 20, excelling due to its EPR for multiple waste types, environmental education programmes integrated into the primary curriculum and a household food waste generation of 76 kg capita−1 year−1, which is lower than the average for upper-middle-income countries (UNEP, 2024). China’s higher score is also influenced by its significant demand for recycled materials, driven by its large manufacturing sector, which relies on secondary raw materials for global production. This demand has incentivised the development of robust recycling systems and policies, further strengthening China’s waste minimisation efforts. Thus, China’s performance reflects effective policy frameworks and the economic demand for recyclable materials. Algeria and Egypt scored the lowest, with over 80% of their MSW improperly disposed of (Dahmane et al., 2024; Adelphi et al., 2020). Their household food waste generation exceeded the lower-middle-income average of 86 kg capita−1 year−1 (UNEP, 2024), environmental education is not part of the primary curriculum, no commercial alternatives to plastic bags and textile shopping bags are not commonly used.
For the ZWI indicator, the percentage of MSW destined for disposal in landfills and dumpsites was used as a proxy, with better scores for countries diverting more waste. All countries studied had low scores with low recovery rates, but Bangladesh, China and Malaysia performed slightly better, with disposal rates of 70% (Bangladesh Bureau of Statistics, 2023), 52% (Ding et al., 2021) and 67% (Ministry of Housing and Local Government, Malaysia, 2022), respectively. The remaining countries allocated over 70% of their waste to final disposal, resulting in a score of 1 due to minimal waste diversion. Except for China, all other countries operate non-sanitary landfills or dumpsites, contributing to pollution and negative impacts on human health and the environment.
For the FLI indicator, household food waste generation per capita was used as a proxy, with higher generation leading to lower scores. Brazil, Bangladesh, China, India, Malaysia and Nepal scored 4, generating between 50 and 99 kg capita−1 year, close to the world averages of 88 and 86 kg capita−1 year−1 for upper- and lower-middle-income countries, respectively (UNEP, 2024). No country achieved the maximum score, which would require values below these world averages. African countries presented values above the average, receiving lower scores: Algeria and Morocco generated 113 kg capita−1 year−1 and scored 3, while Egypt and Tunisia generated 163 and 172 kg capita−1 year−1, scoring 2 (UNEP, 2024).
For the EPR indicator, proxies focused on other EPR systems that appropriately collect, recycle, process or dispose of waste. Higher scores were given to countries encompassing more types of waste. Brazil, India and China scored the highest with comprehensive EPR systems: Brazil includes 12 waste types (Ministry of the Environment, Brazil, 2024a), India includes oils, e-waste, batteries and plastic packaging (CPCB, 2022) and China includes electrical and electronic products, automotive products, lead-acid batteries and beverage paper-based composite packaging (Chen et al., 2023; Jiang and Zhang, 2023; NDRC, 2020). Algeria, Tunisia and Malaysia scored only 2, having EPR for just one category of waste: packaging in Algeria (Eco-Jem, 2024) and Tunisia (ANGed, 2021) and plastic in Malaysia (Ministry of Environment and Water, Malaysia, 2021). Egypt, Morocco, Bangladesh and Nepal scored 0 as they have not implemented any EPR systems yet.
This analysis highlights significant differences in the implementation of EPR across developed and developing economies. For example, in Germany, EPR is reinforced by the Green Dot programme, which stabilises recycling markets and stimulates demand for recycled materials, fostering a CE (Lifset & Lindhqvist, 2002). A robust recyclable market in these economies is essential for maintaining the effectiveness of EPR, ensuring that recycled materials are valued and reintegrated into production cycles. In contrast, the United States employs an ‘open market approach’, resulting in inconsistencies in EPR effectiveness due to varying state regulations (Geyer et al., 2016). Such disparities reflect the complexities developing countries face as they work to establish effective waste management strategies.
Furthermore, recent research, including the study by Brooks et al. (2018), underscores how these differences in EPR frameworks, alongside global market dynamics, significantly impact local practices in plastic waste management. It is important to note that this proxy indicator only considered the existence of EPR and the amount of waste included in these schemes without deeply analysing each legislation and the recycling market in each country. In addition, we highlight the lack of measures focused on prevention, which should be a priority before recycling according to the waste hierarchy, and this is a flaw in all the countries studied.
For the Education and Awareness programmes proxy indicator, the existence of awareness programmes, the inclusion of waste education in primary education, and differentiation in legislation regarding prevention and minimisation terms were analysed. Brazil, Bangladesh, China, Malaysia and Nepal scored 5, demonstrating positive results in all three criteria and having more than two environmental education programmes. For instance, Brazil has a platform for disseminating environmental education practices (Oliveira, 2015), special environmental education rooms in municipalities (Ministry of the Environment, Brazil, 2024b) and national campaigns on waste reduction and responsible disposal (National Water and Sanitation Agency, Brazil, 2024). Bangladesh runs community clean-up drives, educational workshops and media campaigns (Jerin et al., 2022), whereas China has the Clean Plate Campaign and other initiatives (Global Times, 2023; Feng et al., 2022). Malaysia’s actions are organised through Community, Education and Public Awareness programmes (Department of Environment of Malaysia, 2024.), and Nepal focuses on river cleanups, composting programmes, household biogas and rooftop gardening training (Ferronato et al., 2023; Khanal et al., 2024). India scored 2 due to environmental education programmes and terminology differentiation but lacks mandatory waste education in the primary curriculum. Egypt, Morocco and Tunisia scored 1, only presenting results for the existence of educational campaigns.
In this context, Coggins (2001) and Bortoleto (2015) recognised the importance of shared responsibilities among stakeholders, highlighting the essential roles of both producers and consumers in minimising waste generation and mitigating environmental impacts. Torres-Pereda et al. (2020) emphasised the importance of education in raising awareness about waste prevention in developing countries’ public and private sectors. Environmental education can drive behavioural change at individual and community levels, fostering a deeper understanding of waste issues. Although recycling is widely understood, many remain unfamiliar with waste prevention, which sits at the top of the waste management hierarchy and is crucial in addressing waste-related challenges. Engaging local communities in decision-making ensures strategies remain contextually relevant and culturally appropriate, promoting higher participation and successful outcomes. Additionally, comprehensive education and awareness campaigns are essential for informing consumers and producers of their roles and responsibilities.
Regarding the Waste Prevention proxy indicator, which measures the difference in MSW generated compared to the previous year, all scores were very low. Brazil saw a 2% reduction in MSW per capita between 2021 and 2022, likely due to decreased purchasing power and changes in consumption habits post-pandemic (ABREMA, 2023). China reported a 1.71% reduction (National Bureau of Statistics, 2021, 2022), though some authors contest this, claiming an increase in waste generation (Ding et al., 2021). India reported a 0.25% decrease, but local studies suggest otherwise (Kapoor and Chakma, 2024; Kapoor et al., 2024). These three countries scored 1, as reductions did not exceed 2%. Malaysia and Bangladesh saw increases in waste generation, scoring 0 (Ministry of Housing and Local Government, Malaysia, 2021; Ministry of Housing and Local Government, Malaysia, 2022; Dhaka South City Corporation, 2020).
For the Plastic Bag Reduction Ratio proxy indicator, the evaluation considered the existence of commercial alternatives to plastic bags, the common use of textile bags and regulations on single-use bags. Tunisia, Bangladesh and Malaysia scored 5, presenting positive results for these criteria and having more than one commercial alternative, such as jute, paper, synthetic fibre and biodegradable bags. Significant regulations include Tunisia’s plastic bag prohibition (Circle Economy, 2024.), Bangladesh’s 2002 ban (The Business Standard, 2021) and Malaysia’s Roadmap Towards Zero Single-Use Plastics 2018–2030 (Ministry of Energy, Science, Technology, Environment and Climate Change of Malaysia, 2018). However, although these countries demonstrate positive steps in plastic bag reduction, the effectiveness of such initiatives in developing countries often faces significant challenges. These differences raise concerns, especially for developing countries reliant on local and global market dynamics as they implement effective plastic waste prevention and minimisation strategies. According to Zeng et al. (2019), the effectiveness of plastic waste reduction systems in developing countries, including plastic bags, is often compromised by insufficient infrastructure and limited access to markets for secondary materials, which greatly influence reverse logistics practices. India scored 4, meeting all criteria but lacking multiple commercial alternatives. Brazil, Egypt, Morocco, China, and Nepal scored 3, with alternatives and regulations, but textile bags are not commonly used. Algeria scored 1, lacking these initiatives.
In summary, the indicators with the poorest performance and lowest scores were waste prevention and the ZWI. These indicators measure the effectiveness of waste prevention and minimisation by capturing the outcomes of efforts such as reducing food waste and plastic use, implementing EPR and promoting environmental education. These aspects remain challenging and require further advancements in most countries.
Environmental, economic and social implications of waste prevention and minimisation measures
An MCA assessed the environmental, economic and social implications. The results for each country, based on the available information for each indicator, are presented in Figure 3.
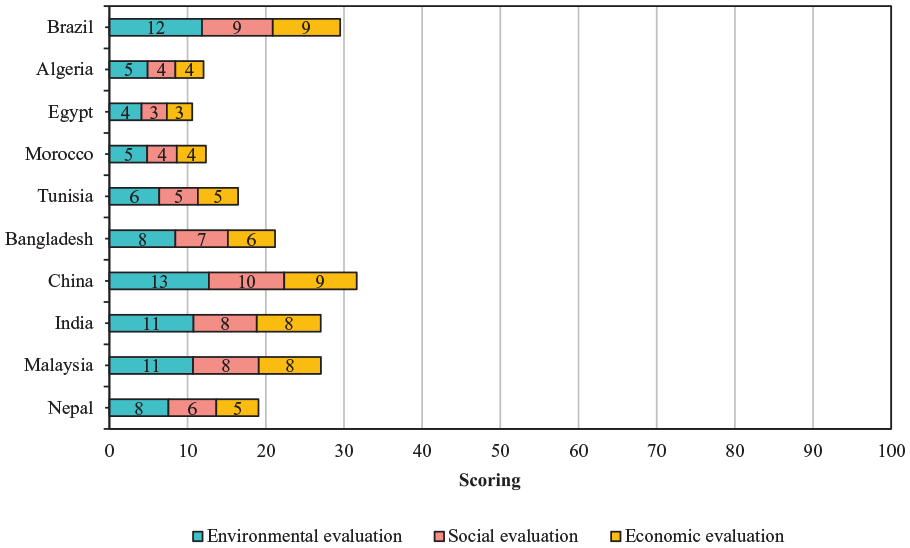
Associated environmental, social and economic implications of the selected waste prevention and minimisation measures by country.
The environmental performance in this study refers to the effectiveness of waste prevention and minimisation measures in reducing environmental impacts. This includes compliance with the waste hierarchy, reduction in landfill waste, promotion of the CE, contributions to ESG principles, alignment with SDGs and reduction of atmospheric emissions.
The environmental scores among the countries studied ranged from 4 to 13. The indicators with the most significant environmental impact were the ZWI, followed by waste prevention, the FLI and EPR (see Figure SM1 in the Supplemental Material). China achieved the highest score due to its comprehensive waste management policies and effective EPR implementation. Conversely, Egypt had the lowest score, primarily due to its high rate of improper waste disposal and lack of comprehensive environmental policies.
China’s high environmental score can be attributed to several factors, including its waste management initiatives prioritising waste diversion from landfills. This significantly contributes to environmental sustainability by minimising resource consumption and reducing landfill waste, thereby lowering atmospheric emissions. The country also boasts low household food waste generation (64 kg capita−1 year−1) and robust EPR systems covering various waste types, such as electronics and beverage packaging. These measures have significantly reduced landfill waste and promoted recycling. ZWI initiatives in China have significantly contributed to environmental sustainability by minimising resource consumption and reducing landfill waste, thereby lowering atmospheric emissions. The EPR systems in China incentivise producers to manage the entire lifecycle of their products, enhancing resource recovery and reducing environmental impacts.
Brazil achieved the second-highest score, ranking just behind China, due to its lower performance on the ZWI criterion. Brazil’s lower score is primarily attributed to its lower recovery rates and greater reliance on landfill disposal (Brazil, 2023). The ZWI, which assesses the percentage of MSW diverted from landfills, was used as a proxy indicator for both countries. China scored higher than Brazil because it diverts much of its waste from landfills.
In contrast, Egypt’s low environmental score reflects its high proportion of waste sent to landfills and dumpsites without pre-treatment, with over 80% of MSW ending up in open-air sites. The lack of effective EPR systems and high food waste generation further exacerbate Egypt’s environmental challenges.
The social performance evaluates the impact of waste management practices on public health, social acceptance and job creation. This includes assessing the safety risks to the population, the degree of social acceptance of the measures necessary to improve the indicator and the potential for job creation in the waste management sector. Indicators have greater social implications when they pose more significant health risks, are more socially accepted and generate more employment. Therefore, countries with higher scores on the ZWI, waste prevention and FLI indicators have a more significant social impact (see Figure SM1 in the Supplemental Material).
The social performance scores ranged from 3 to 10, with China achieving the highest score and Egypt, followed by Morocco and Algeria, performing the lowest. China’s high social score can be attributed to its comprehensive waste management policies that reduce health risks and create job opportunities. Initiatives like the Clean Plate Campaign have enhanced social acceptance of waste minimisation efforts (Feng et al., 2022). Integrating waste management education into the curriculum and public awareness campaigns has significantly contributed to this high performance (The State Council of The People’s Republic of China, 2019). The Clean Plate Campaign in China directly addresses food waste by promoting responsible consumption, reducing waste and engaging the community in sustainable practices. This initiative has been well-received socially and has contributed to job creation in the waste management sector (Feng et al., 2022).
Egypt and Algeria scored low due to higher health risks from improper waste disposal and lower social acceptance of waste minimisation initiatives. The lack of job creation in waste management further hinders their social performance. In Egypt, for instance, over 80% of MSW end up in open-air sites, posing significant health risks (Mahmoud et al., 2020). Brazil has made strides in environmental education with initiatives like EducaRES and Green Rooms, promoting waste reduction and recycling. However, the recent 2% reduction in MSW generation is attributed more to economic factors than increased awareness, indicating a need for more effective social engagement strategies (ABREMA, 2023).
Economic performance assesses the financial impact of waste management practices, including the required investment, cost savings and revenue generation. The indicators most affected by economic aspects are those requiring higher investment, reducing the costs of waste treatment or disposal, generating higher revenues and helping minimise potential economic losses by avoiding penalties. Consequently, countries with favourable scores on the ZWI, waste prevention and EPR indicators tend to exhibit higher scores in this economic aspect (see Figure SM1 in the Supplemental Material). The economic performance scoring ranged between 3 and 9 among the countries, with Egypt again performing the lowest, followed by Morocco and Algeria, while China and Brazil scored the highest. China’s high economic score is driven by effective EPR systems that manage waste efficiently, generate revenues and reduce overall waste management costs (Jiang and Zhang, 2023). The EPR programmes cover various waste types, promoting product stewardship and recycling, which lead to significant cost savings. EPR programmes shift financial responsibility from local governments to producers, leading to significant cost savings in waste management and creating economic opportunities through recycling and remanufacturing activities. These systems incentivise producers to design products for recyclability, further enhancing economic benefits. Egypt, Morocco and Algeria scored lower due to less effective waste reduction practices. Egypt’s high disposal costs and minimal recycling efforts further impact its economic performance (GIZ, 2014).
Brazil’s, as well as other countries’, EPR systems focus on collection rather than prevention, limiting their economic impact. The recycling credit market in Brazil encounters several challenges, notably the lack of differentiation in plastics, which results in inefficiencies in waste prevention (Castilho, 2022). Companies frequently introduce plastics into the market without possessing the necessary technology for their recycling, subsequently purchasing credits to create a facade of compliance. This allows the continued use of materials that should be phased out rather than incentivising investment in solutions to eliminate these problematic plastics. Ultimately, this practice is expected to lead to significant revenue losses.
The MCA results highlight the varying performance of the selected developing countries in implementing waste prevention and minimisation measures. Due to its robust policies and practices, China consistently scored the highest across environmental, economic and social criteria. In contrast, Egypt’s lower scores in all categories indicate significant room for improvement in its waste management strategies. These findings highlight the importance of comprehensive and integrated approaches to waste management that address environmental, economic and social dimensions to achieve sustainable outcomes. It is important to note that the evaluation of the indicators is hindered by the lack of monitoring and measurement that is controlled and maintained over time. Consequently, the available information is limited, difficult to access and does not provide a comprehensive picture of the current situation of the developing country in terms of waste minimisation and prevention.
Overall scoring assessment of waste prevention and minimization
Figure 4 presents the overall scoring of each country, derived by multiplying their environmental, social and economic scores by the scores for each indicator specific to each country. Spain is included to compare the results of developing countries with those of developed countries. The detailed results for the countries assessed, based on the overall scoring of indicators such as ZWI, FLI, EPR, education and awareness programmes, waste prevention and plastic bag reduction ratios, are presented in the Supplemental Material (Table SM9) and SM2 (Proposed Framework-Excel Tool).
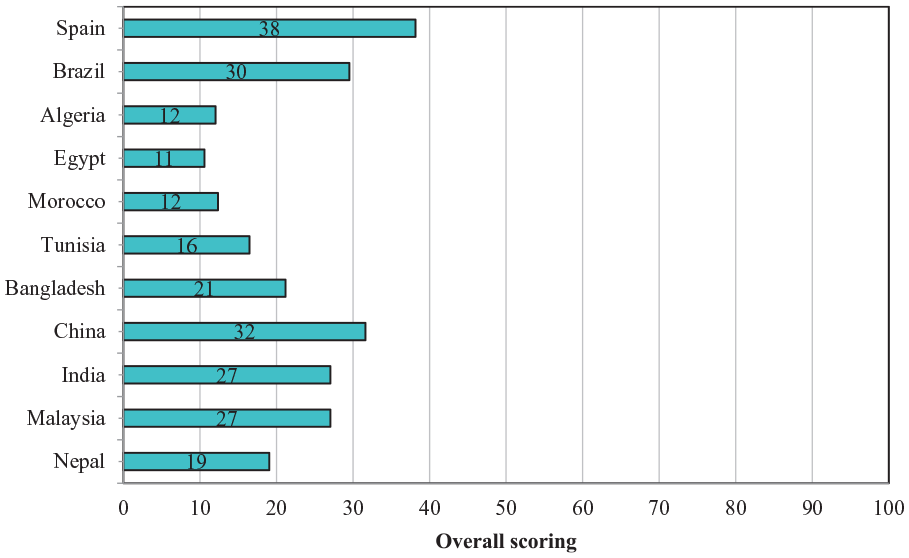
Overall scoring of the waste prevention and minimisation measures in the assessed countries.
Spain received a higher score than the developing countries studied, but the difference was not as substantial as expected, particularly when compared to countries like China and Brazil. Although Spain had the maximum score in the EPR, Education and Awareness programmes for minimisation and Plastic Bag Reduction Ratio indicators, it lost points for still sending 46.8% of MSW to landfills (Ministry for the Ecological Transition and Demographic Challenge, Spain, 2021) and for reducing only 3.6% in the generation between 2019 and 2020 (European Commission, 2022). While superior to those found for developing countries, these results did not earn Spain the maximum score in our framework, indicating that even developed countries need to advance their waste prevention efforts. The low scores can be attributed to the global recyclable market, especially plastics, which has experienced disruptions and restricted waste imports following China’s National Sword Policy. This forced exporters to meet stricter contamination standards, raising costs and increasing prices for materials like plastics and paper (Lin et al., 2023). European countries, including Spain, have been affected by limited export options, pushing them to develop domestic recycling capacities (Rubio, 2019). The reduced ability to export low-quality recyclables and the need for domestic recycling improvements may have lowered the profitability of recycling programmes. This could discourage investment in waste reduction initiatives, slow down recycling rates for plastics and other materials and send more waste to landfills. Consequently, materials like plastics may still end up in landfills or face lower recycling rates than expected due to decreased demand or processing capacity limitations.
It is also important to recognise that countries such as China, India, Malaysia and Brazil are taking significant steps to improve waste prevention and minimisation outcomes. China, in particular, achieved the highest score of 32, which is distinguished by its high performance in the FLI, EPR and Education and Awareness programmes for minimisation indicators. Additionally, China obtained the maximum score in the three impact categories assessed (environmental, economic and social), with higher values than other developing countries. In contrast, African countries generally performed poorly on the developed scoring framework. Notably, Egypt scored the lowest overall with a score of 11, showing low performance mainly in the ZWI, EPR, Education and Awareness programmes for minimisation and Waste Prevention indicators, as well as in the three impact categories, especially social and economic.
As shown in Figure 4, the scoring framework proposed in this study provides insights into the comparative analysis of developed and developing nations regarding waste prevention and minimisation efforts. This comparative approach can be applied globally to evaluate and benchmark waste prevention and minimisation practices among various countries.
Proposed framework applicability and recommendations for decision-makers
The proposed scoring framework represents an innovative methodology for clarifying and enhancing waste prevention and minimisation strategies across diverse geopolitical contexts. This comparative analysis serves to highlight gaps in data availability, particularly between developing and developed nations, thereby illuminating successful waste management practices that could potentially be replicated across borders. By accentuating both the disparities and commonalities in waste management paradigms, the framework facilitates the identification of effective strategies employed by one nation that others could adopt. As such, this analytical lens is pivotal for policymakers and stakeholders, delineating best practices alongside areas necessitating substantial improvement.
Despite the invaluable insights proffered, a principal challenge associated with the framework resides in the inconsistent availability of data. Countries such as China, characterised by readily accessible and comprehensive datasets, tend to achieve higher scores, whilst others may falter due to insufficient data collection and reporting mechanisms. This discrepancy underscores the urgent imperative for enhanced data systems to accurately quantify the waste generated, recovered and disposed of in landfills and incinerators, particularly in developing contexts. Systematic data collection, especially longitudinal datasets, facilitates a comprehensive assessment of national progress, uncovering trends, patterns and the effectiveness of implemented strategies.
Furthermore, while the framework evaluates the existence of laws and policies about waste prevention and minimisation, it does not assess their practical implementation and effectiveness at the community level. This limitation suggests that the framework’s applicability remains unverified in pragmatic scenarios. Future research should aim to address this gap by evaluating the real-world effectiveness of these policies, thereby enriching the framework’s utility in guiding transformative waste management practices.
To augment their overall scores within the framework, developing nations must prioritise enhancing their EPR policies, and broadening their applicability to encompass a more extensive range of products. For instance, countries can leverage economic incentives to mitigate overall waste generation by expanding the EPR concept to cover electronic waste and plastic packaging. Concurrently, substantial investment is essential in closing unsustainable dumpsites, where approximately 90% of MSW remains improperly disposed of. Initiatives to improve recycling rates are critical in diverting more waste from landfills and nurturing CE principles that advocate for resource recovery.
+Moreover, sustained investment in environmental education is imperative; although indicators reflect positive outcomes in certain regions, consistent efforts are necessary to cultivate awareness across all societal levels. Community-based initiatives, informed by the framework, can catalyse public engagement in waste minimisation practices.
It is noteworthy that, although countries such as Egypt, Algeria and Morocco have instituted waste management laws – for example, Egypt’s National Solid Waste Management Programme and Morocco’s legislation prohibiting plastic bags – the inconsistent implementation of these policies remains a barrier. These nations continue to grapple with high rates of food waste generation and ineffective environmental education programmes. Consequently, there is an exigent need for policymakers in these regions to enforce existing legislation more effectively, leveraging the framework’s findings for targeted interventions that yield improved waste management outcomes.
The proposed framework serves as a practical instrument for decision-makers in developing countries, facilitating the identification of critical gaps in solid waste management. Governments can devise tailored strategies that resonate with their unique contexts by concentrating on indicators such as education and awareness, waste prevention practices and economic incentives. For example, linking measurable indicators to environmental impacts can guide resource allocation towards vital areas, such as investing in recycling infrastructure that enhances ZWI performance or implementing targeted awareness initiatives to address food waste based on assessments of the FLI.
Furthermore, the framework elucidates systemic challenges, such as the need to formalise informal recycling sectors in countries like Bangladesh and Egypt or enhance EPR systems in India to encompass a broader array of waste streams. By synchronising national policies with global sustainability frameworks, such as the SDGs and CE principles, governments can promulgate data-driven legislation that fosters sustainable waste management while advancing broader socio-economic objectives.
Ultimately, this framework is a pioneering blueprint for decision-makers, offering a comprehensive approach to coordinating transformative waste management policies. By harnessing its analytical capabilities, nations can elevate their environmental stewardship, establishing benchmarks for sustainability that not only inspire local approaches but also resonate on an international scale.
Conclusion
This study provided a comprehensive analysis of waste prevention and minimisation strategies in both theoretical and practical contexts, focusing on their applicability in developing countries. The primary objective was to address the gap in the existing literature by proposing a simplified framework to assess waste prevention and minimisation techniques and practices, with a specific emphasis on supporting decision-makers in developing nations. The proposed framework is based on six indicators for assessing waste prevention and minimisation tailored explicitly for developing countries when data is not available: ZWI, FLI, EPR, Education and Awareness, Waste Prevention and Plastic Reduction. These indicators reflect the main challenges developing countries face in addressing primary components such as organic and plastic waste. The selection was based on their alignment with SDGs, CE and ESG principles and data availability across countries.
Several developing countries, including Nepal, Algeria, Egypt, Morocco, Tunisia, Brazil, Bangladesh, China, India and Malaysia, were selected as case studies to demonstrate the applicability of the proposed framework for sustainable waste management. The findings revealed significant variations in waste management practices across these nations. China exemplifies the effective application of EPR systems and robust public education initiatives, leading to significant reductions in waste output. In contrast, Brazil faces persistent challenges characterised by a heavy reliance on landfills, revealing substantial deficiencies that necessitate urgent reform in its waste prevention framework. Similarly, Spain is a pertinent example of the challenges developed nations encounter; despite its well-established regulatory frameworks, a significant portion of municipal waste continues to be directed to landfills, highlighting the pressing need for enhanced practices related to the FLI. Countries such as China and Spain illustrate effective practices, whereas Egypt, Morocco and Algeria reveal critical areas for improvement. This rich diversity of experiences underscores varying levels of commitment to the proposed indicators and delineates invaluable insights that can inform future practices. Moreover, countries like India and Bangladesh demonstrate considerable potential for advancement through strengthened EPR systems and community engagement initiatives focused on waste prevention. Tunisia has made commendable progress with its legislation prohibiting single-use plastic bags, yet effective implementation remains challenging. Meanwhile, Egypt, Morocco and Algeria exemplify the urgent need for enhanced enforcement of waste prevention policies and the establishment of efficient recycling infrastructures, demonstrating a stark need for improvement in commitment and action.
Given these insights, several targeted recommendations emerge for enhancing waste prevention and minimisation efforts in developing countries. Firstly, it is imperative to reinforce EPR policies, expanding their scope to encompass a wider array of waste types to improve recycling rates. Additionally, investing in educational programmes to elevate public awareness and reinforce community participation is crucial in fostering a culture of sustainability. The immediate prioritisation of closing non-sanitary dumpsites is vital for mitigating health risks associated with inadequate waste disposal, thereby ensuring safer environments for communities. Lastly, refining data collection methodologies and standardising waste definitions undeniably supports more effective policy implementation, enabling countries to share best practices and collaboratively advance their waste prevention and minimisation strategies.
The proposed framework in this study enhances operational efficiency by standardising waste prevention terminologies and indicators, allowing stakeholders to implement targeted strategies effectively. This structured approach improves resource allocation and drives tangible waste reduction, particularly in developing countries where such initiatives are often lacking. From a policy perspective, it provides policymakers with a tool to evaluate existing waste management policies, identify gaps and develop tailored policies that address regional challenges, fostering a more sustainable waste management system. Theoretical implications include enriching academic discourse on waste management by integrating diverse indicators into a unified framework encouraging research on the links between waste prevention and SDGs. However, challenges to the effective implementation of the proposed framework include the need for accurate, comprehensive data collection from each country and the potential for subjective interpretations of environmental, social and economic impacts. Maintaining the framework’s adaptability to diverse waste management practices and ensuring it undergoes regular updates to reflect evolving sustainability initiatives and policies present further challenges.
This research contributes to sustainable waste management by proposing a comprehensive, adaptable framework tailored to the unique challenges of developing countries. The study highlights the importance of a multidimensional approach, robust data collection and stakeholder collaboration. The framework helps identify critical areas for improvement and supports data-driven, collaborative strategies aligned with sustainability goals, facilitating the shift towards a CE. Future research should continue refining this framework, expanding its applicability and exploring additional indicators to strengthen its impact on waste reduction and resource minimisation across diverse contexts.
Supplemental Material
sj-pdf-1-wmr-10.1177_0734242X251328911 – Supplemental material for A simplified framework for assessing waste prevention and minimisation in developing countries within the context of CE, SDGs and ESG principles
Supplemental material, sj-pdf-1-wmr-10.1177_0734242X251328911 for A simplified framework for assessing waste prevention and minimisation in developing countries within the context of CE, SDGs and ESG principles by Amani Maalouf, Amaia Garcia-Tabar, Ana Maria Rodrigues Costa de Castro, Ashpreet Kaur, Ankur Saini, Mohit Somani, Md Azijul Islam, Ashish Khanal, Norshah Aizat Shuaib, Kartik Kapoor, Giovani Palafox-Alcantar, Ameer Al Farsi and Nour El Houda Chaher in Waste Management & Research
Footnotes
Acknowledgements
The authors thank the International Solid Waste Association (ISWA) and the Young Professionals Group (YPG), the University of Oxford, UK; IDOM Consulting, Engineering, Architecture, S.A.U, Spain; the University of São Paulo, Brazil; Stony Brook University, USA; MVW Lechtenberg & Partner, Germany; TERI School of Advanced Studies, India; Bangladesh University of Engineering and Technology (BUET), Bangladesh; Sarek Waste & Resource Management PVT Ltd, India; Indian Institute of Technology Bhubaneswar, India; Universiti Malaysia Perlis, Malaysia; Oman Environmental Services Holding Company (be’ah), Oman and the University of Rostock, Germany for supporting international collaboration.
Author contributions
Amani Maalouf: Conceptualisation, Data curation, Formal analysis, Methodology, Project coordination, Supervision, Validation, Visualisation, Writing – original draft (all sections of the article and Supplemental Material), Writing – review and editing; Amaia Garcia-Tabar: Formal analysis, Methodology, Results and discussion, Case study (Spain), Supplemental Material, Validation, Writing – review and editing; Ana Maria Rodrigues Costa de Castro: Methodology, Results and discussion, Case study (Brazil), Supplemental Material, Validation, Writing – review and editing; Ashpreet Kaur: Results and discussion, Case study (China), Supplemental Material; Ankur Saini: Introduction, Methodology, Supplemental Material; Mohit Somani: Methodology, Supplemental Material; Md Azijul Islam: Case study (Bangladesh); Ashish Khanal: Case study (Nepal); Norshah Aizat Shuaib: Case study (Malaysia), Kartik Kapoor: Case study (India), Giovani Palafox-Alcantar: Proofreading; Ameer Al Farsi: Formatting; Nour El Houda Chaher: Case Studies (Algeria, Egypt, Morocco, Tunisia), Supplemental Material, Validation, Writing – review and editing. All authors approved the submission of the article for publication.
Declaration of conflicting interests
The authors declared no potential conflicts of interest with respect to the research, authorship, and/or publication of this article.
Funding
The authors received no financial support for the research, authorship, and/or publication of this article.
Supplemental material
Supplemental material for this article is available online.
References
Supplementary Material
Please find the following supplemental material available below.
For Open Access articles published under a Creative Commons License, all supplemental material carries the same license as the article it is associated with.
For non-Open Access articles published, all supplemental material carries a non-exclusive license, and permission requests for re-use of supplemental material or any part of supplemental material shall be sent directly to the copyright owner as specified in the copyright notice associated with the article.