
Abstract
This article uses model materials to introduce a controlled, location- and manufacturer-independent internationally accepted method for assessing shredding machines based on large-scale tests. Furthermore, a better understanding of the comminution behaviour of shredders with fixed settings (gap width, shaft speed, cutting tool geometry) is in the focus of the present investigation and assessed, using the statistical analyses for particle size distribution in certain screen sections. Conclusions have been drawn on the comminution behaviour in general and the material–material interactions of different fractions in the grinding chamber of the shredder by showing significant differences in the pure fraction’s comminution behaviour against the mixture’s comminution behaviour. In addition, the effect of the wear condition of the cutting tools on the particle size distribution has been investigated using statistical tests. As a result, interactions of the materials in the shredder grinding chamber can be demonstrated. The null hypothesis of the statistical test can be rejected due to the p-values, which are around 0.01 and therefore less than the predetermined alpha, which is 0.05, meaning that the shredding behaviour of pure fractions and those in a mixture is different. Additional investigations of waste wood only have shown that the wear condition of the cutting tools does not exhibit any effect on the particle size distribution of waste wood, as seen in the p-value (0.29), which is higher than the used alpha value. This could mean that the cutting tools need to be changed less frequently, which could have a positive effect on plant operation.
Keywords
Introduction
To achieve the goals of the European Green Deal and transform the Union into a modern, resource-efficient and competitive economy, challenges need to be addressed (European Commission, 2019). In general, the provision of raw materials through recycling requires less energy and therefore has less environmental impact than primary sources (Seelig et al., 2017). Many recyclable materials are currently not sorted out in pre-treatment plants and remain in mixed waste streams and are incinerated as solid secondary fuels (Pomberger et al., 2017; Sarc et al., 2019; Weissenbach and Sarc, 2021). However, sorting out certain materials is necessary to achieve the EU recycling targets, cf. European Commission (2018). In addition to municipal waste, large quantities of mixed commercial waste are generated annually, which require efficient treatment processes to enable recycling (Khodier, 2021). However, the demand for an increased supply of secondary raw materials poses new challenges for waste treatment (Bapasola et al., 2023; Seelig et al., 2017) in terms of optimised material sorting and optimised mechanical treatment in previous stages. This is where mechanical waste treatment comes into play, which includes shredding, screening, sifting, sorting, etc.
Coarse shredding is often the first step in processing mixed (commercial) waste and has a considerable impact on the efficiency of the subsequent machines (screens, wind sifter, sorters, etc.) in terms of comminution and liberation of the particles (Feil and Pretz, 2018; Khodier et al., 2020). If the comminution is not optimal in terms of particle size or dosing of the material stream for the subsequent sorter, this can have an impact on the sorting performance and, by extension, on the recycling rates. In general, different processes typically have different requirements to work optimally and therefore may require different shredders. However, the assessment and comparison of shredders regarding their performance is challenging due to the influences of the waste material (Khodier, 2021). The heterogeneous composition of the shredder feed material (mixed municipal and commercial waste) poses a major challenge in predicting the nature of the output stream of a primary shredder. The particle size distribution, throughput capacity and uniformity of the material stream that is further conveyed through the mechanical waste treatment plant depend on the respective shredder and its settings (cutting gap, shaft speed, cutting tools, etc.) (Khodier et al., 2021). To select the optimal shredder for the respective application, a model for predicting the shredding behaviour or further on a method for assessing shredders is required. However, developing an assessment method requires precise knowledge of the shredder concerning various indicators, such as throughput, energy consumption or the quality of the output stream, in order to ensure an energy-efficient and optimised shredding process later on. The first approaches to describe shredders form studies about failure mechanism (Vicente et al., 2019), the wear behaviour of the cutting tools and shredding mechanism (Wong et al., 2022b) or the performance of a shredder using model material in lab-scale (Luo et al., 2010, 2011). In addition, Feil and Pretz (2018) discussed the influence of shredders on the performance of subsequent machines by comparing the throughput steadiness of a single-shaft and a two-shaft shredder. There are studies describing the comminution behaviour of shredders – the particle size distribution – using different shredders for mixed municipal solid waste with different machine settings. However, in Zhang et al. (2019), the analysis of the waste takes place at the interface from mechanical to biological treatment, thus after more processing steps than just shredding; therefore, no conclusions can be drawn about the distribution of the shredded, unsorted waste. Moreover, Khodier and Sarc (2021) and Khodier et al. (2021) described studies that deal with the shredder assessment and offered a basis for shredder characterisation based on real-scale experiments. Khodier and Sarc (2021) provided a parameter study of various independent variables, describing the particle size distribution. In Khodier et al. (2021), a systematic procedure for assessing shredders in real-scale experiments is presented. Despite these initial approaches and the insights gained, these two studies reveal drawbacks in the characterisation or assessment of shredders. Firstly, using mixed commercial waste to determine shredder influences requires extensive large-scale tests. The basic idea of Khodier et al. (2021), to keep the feed material as constant as possible and to randomly vary the shredder settings, involves a lot of effort (e.g. changing the cutting tools). Secondly, the use of mixed waste, and therefore the comparability of the data with other data of different experiments and the reproducibility of the data, is doubtful. Because mixed waste is highly seasonal dependent and the composition generally varies depending on the area collected, describing the materials composition is challenging or only applicable to a specific batch of material. Results, in relation to the effects of the machine, obtained with mixed waste in Khodier et al. (2021) are therefore only applicable to the material used in the tests. A comparison of the tested machine by selected settings with other machines and the settings selected there requires the attempt to be started again with new material. Furthermore, the fact that different materials are shredded at the same time (in the case of mixed waste) makes it difficult to draw conclusions about the behaviour of individual fractions in the shredder and to investigate their shredding behaviour. The use of model materials should minimise the material influence by experimental trials. Furthermore, the influences of different shredder settings should be identifiable, regardless of location, time and machine, to make methods for shredder assessment internationally acceptable. This work therefore uses model materials that consist of a pure fraction collected separately. Their cost-effective procurement is just as necessary as the international comparability of the materials. For this contribution model materials, such as waste wood, waste paper and a mixture of them were used, more details about the materials are given in ‘Material’ section. The use of model materials is intended to show possible interactions between different material fractions in the shredder, by predefined methodical large-scale tests. Answering the question about interactions should give fundamental information about comminution, in relation to the particle size distribution. Particularly important for machine manufacturers in the waste sector, who generally have to design machines for heterogeneous material streams, a methodical approach with defined framework conditions can provide basic information and identify optimisation potential. So in the further, providing a basis for a methodical assessment of machines with regard to their comminution behaviour – and thus the material quality – is one of the aims of this study, making it useful for industry (machine manufacturers, plant operators) and providing information about the machines and the processing success of certain material streams. Another objective focusses on investigating the state of wear and whether this has an impact on the particle size distribution. The first methodically determined findings should provide information for plant operators as to whether the replacement of wear parts should be considered (for selected material streams) and adapted as well as maintenance intervals adjusted.
Materials and methods
For a detailed understanding of the comminution behaviour of a shredder, it must be investigated in detail regarding defined key parameters, framework conditions and defined experimental set-ups. In the following, the experimental set-up, including the defined and selected materials used as feed materials, the machines, the experimental design and the duration, number of experimental runs as well as the sampling are described. Additionally, the material analysis, screening and sorting methodology are presented. Furthermore, the data analysis is described. A visualisation of all relevant steps is shown in Figure 1.
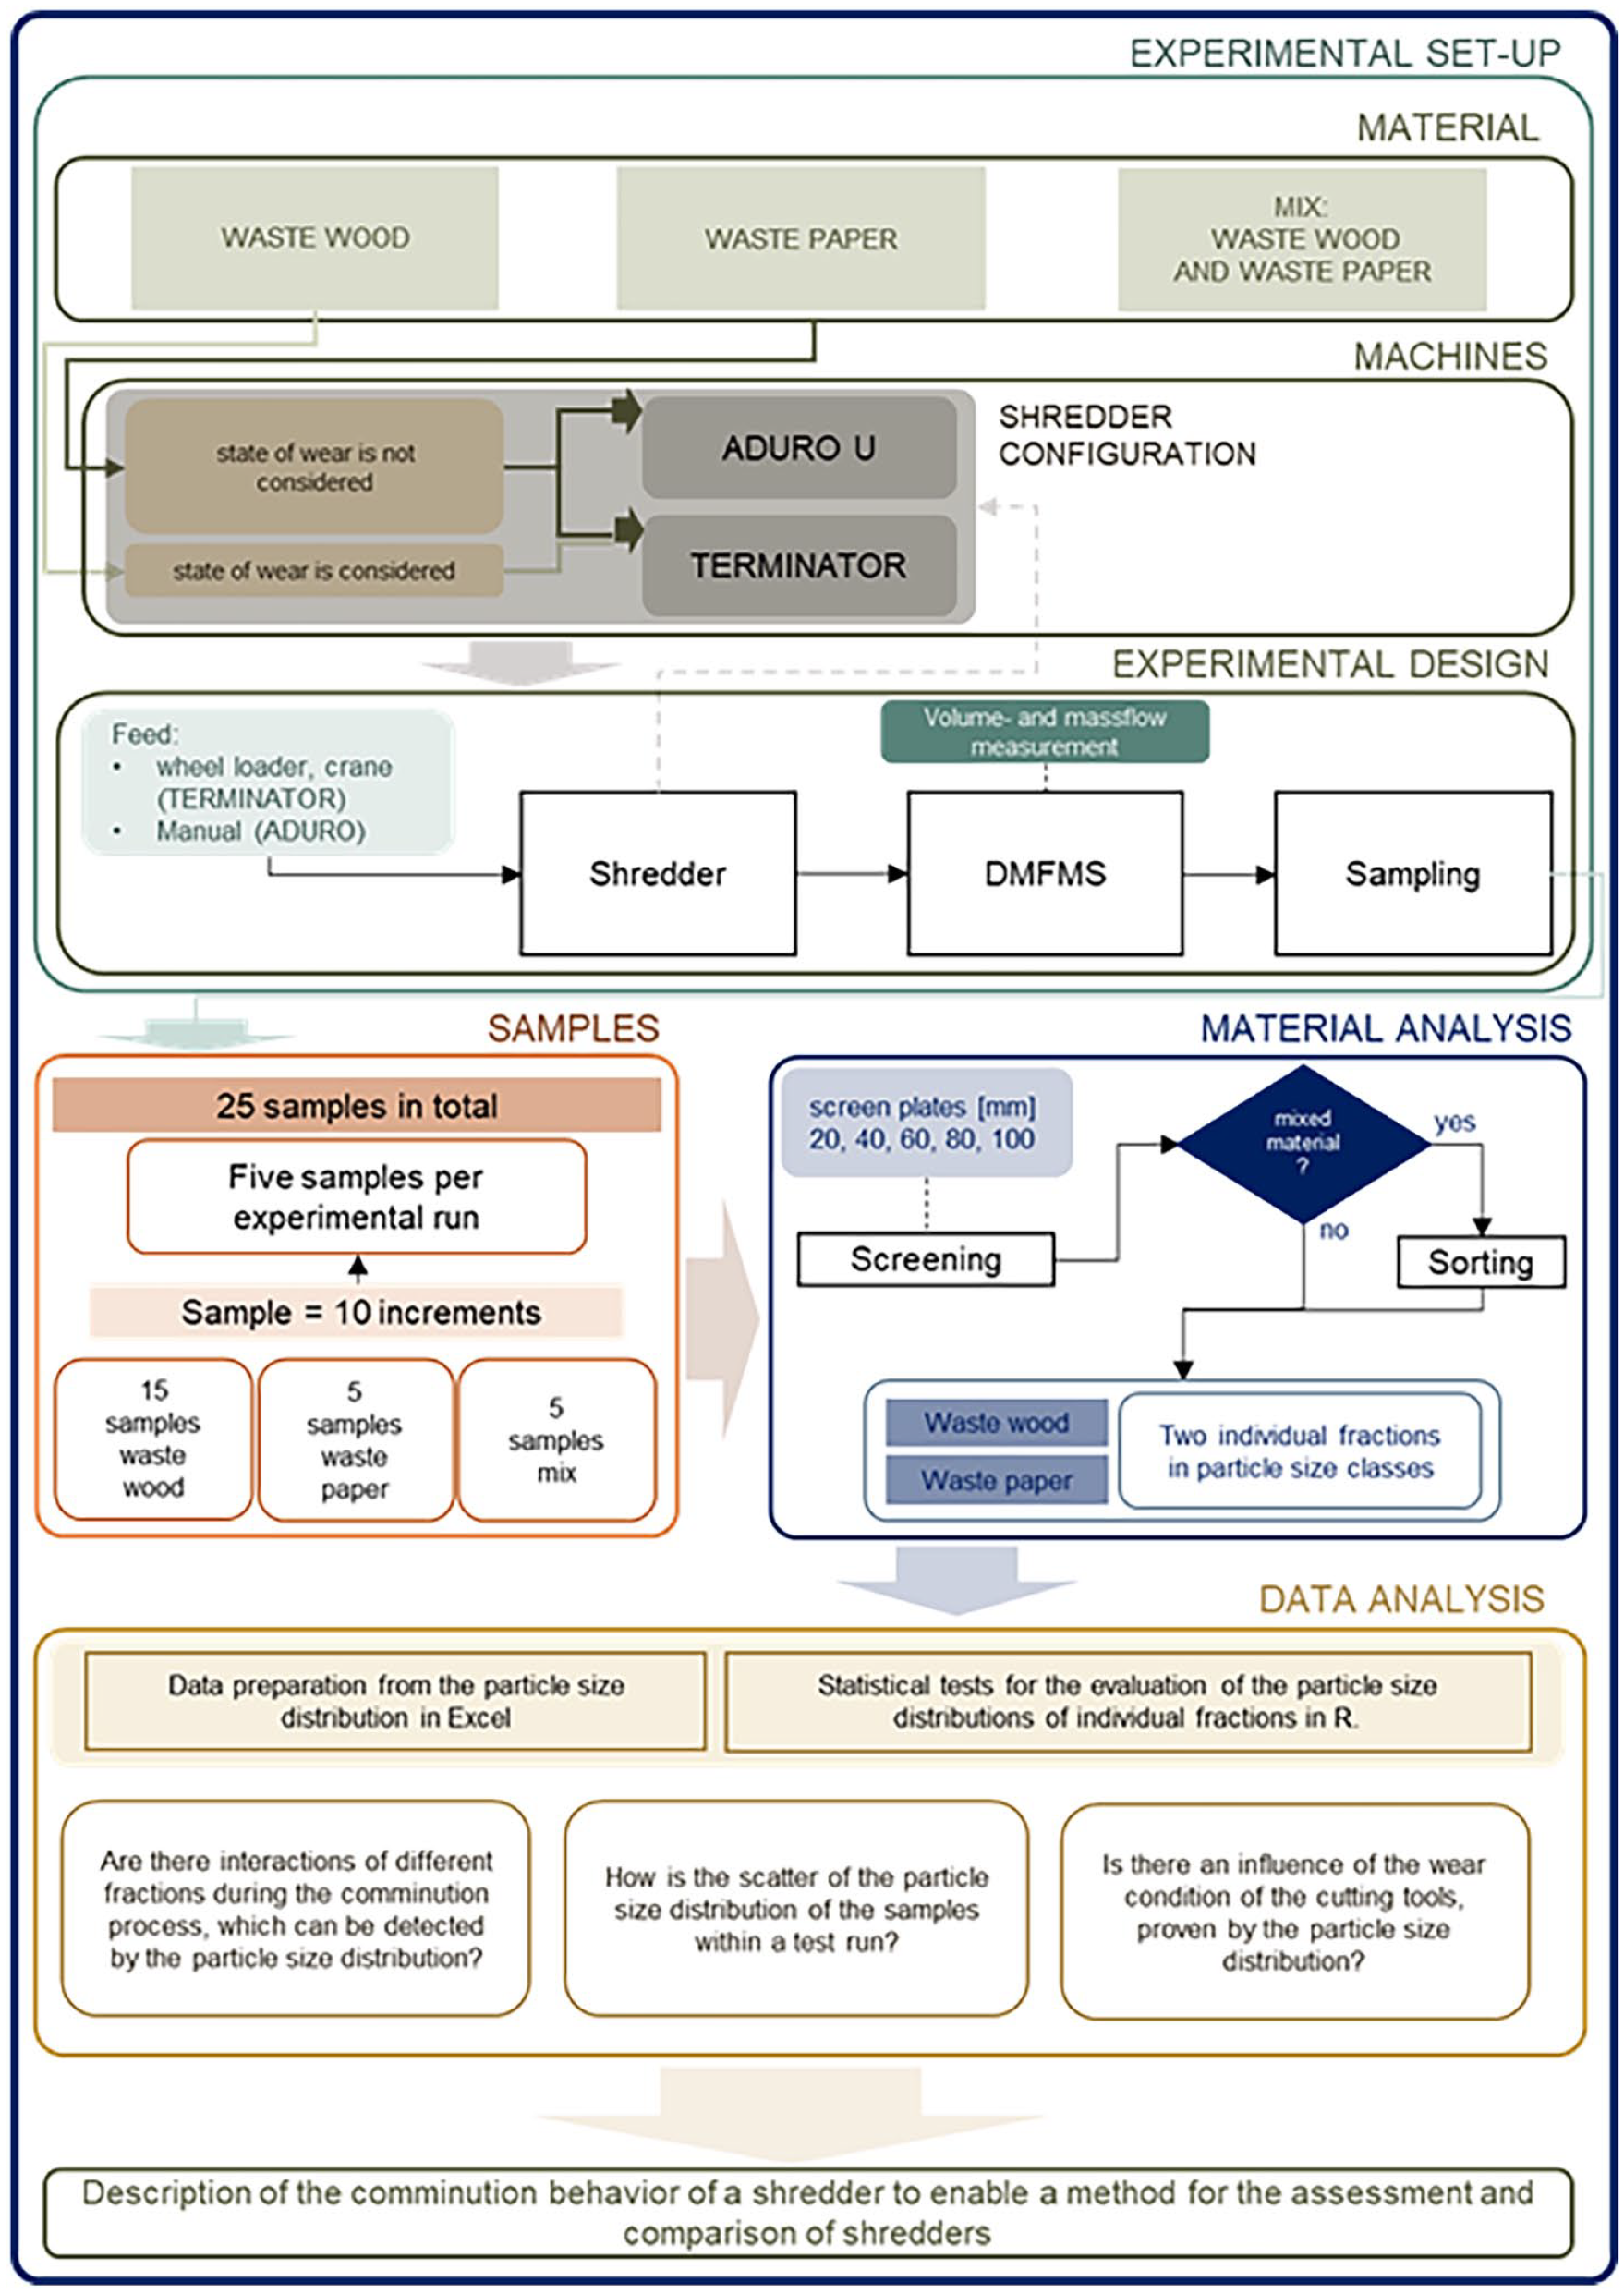
Schematic layout of the experimental set-up, samples and material data analysis for a description of the comminution behaviour of a shredder.
Experimental set-up
This article gives an insight into possible interactions between the fractions waste wood and waste paper in the shredder and provides general information about the particle size distribution of the fractions waste wood, waste paper and a mixture of them. In addition, it shows the particle size distribution of waste wood depending on the wear condition of the cutting tools of a shredder.
Material
This study focussed on the use of model materials instead of, for example, mixed commercial waste. While mixed commercial waste is suitable for performing parameter studies on machines that are locally and seasonally dependent (as in Khodier (2021)), experiments using model materials should be carried out locationally and time independent. The selection of materials was essential in order to be able to develop an internationally accepted, location- and manufacturer-independent method to perform investigations and assess shredders worldwide. Waste wood and waste paper are traded international and are therefore available and standardised, in particular waste paper is a standardised material. Furthermore, attention was paid to the fact that the materials occur in significant quantities in commercial waste in order to draw a conclusion from the shredding of model materials to mixed commercial waste for further studies. For this purpose, waste wood and waste paper (both separately collected) seem to be the most suitable materials.
Waste wood
The waste wood used for the shredding experiments was provided by Austrian companies (Naturgut composting and landscaping company GmbH and Müllex-Umwelt-Säuberungs-GmbH) in March 2022 and November 2022. Waste wood is defined in the Recycling Wood Ordinance (Recyclingholzverordnung) (BMLFUW, 2020) as wood that is considered waste of code number group 17 (17 201; BMK, 2023). The waste wood composition results from wood emballages and waste wood, such as wooden pallets, crates, doors, wooden boards, chipboard and partly lacquered wooden component. In addition, some metal components used for processing the wood, here considered as impurities, such as screws, nails, hinges and other components from furniture, or as well from windows (glass) and wood industry can be detected in this waste fraction. A representation of the waste wood used in the experiments is shown in Figure 2.
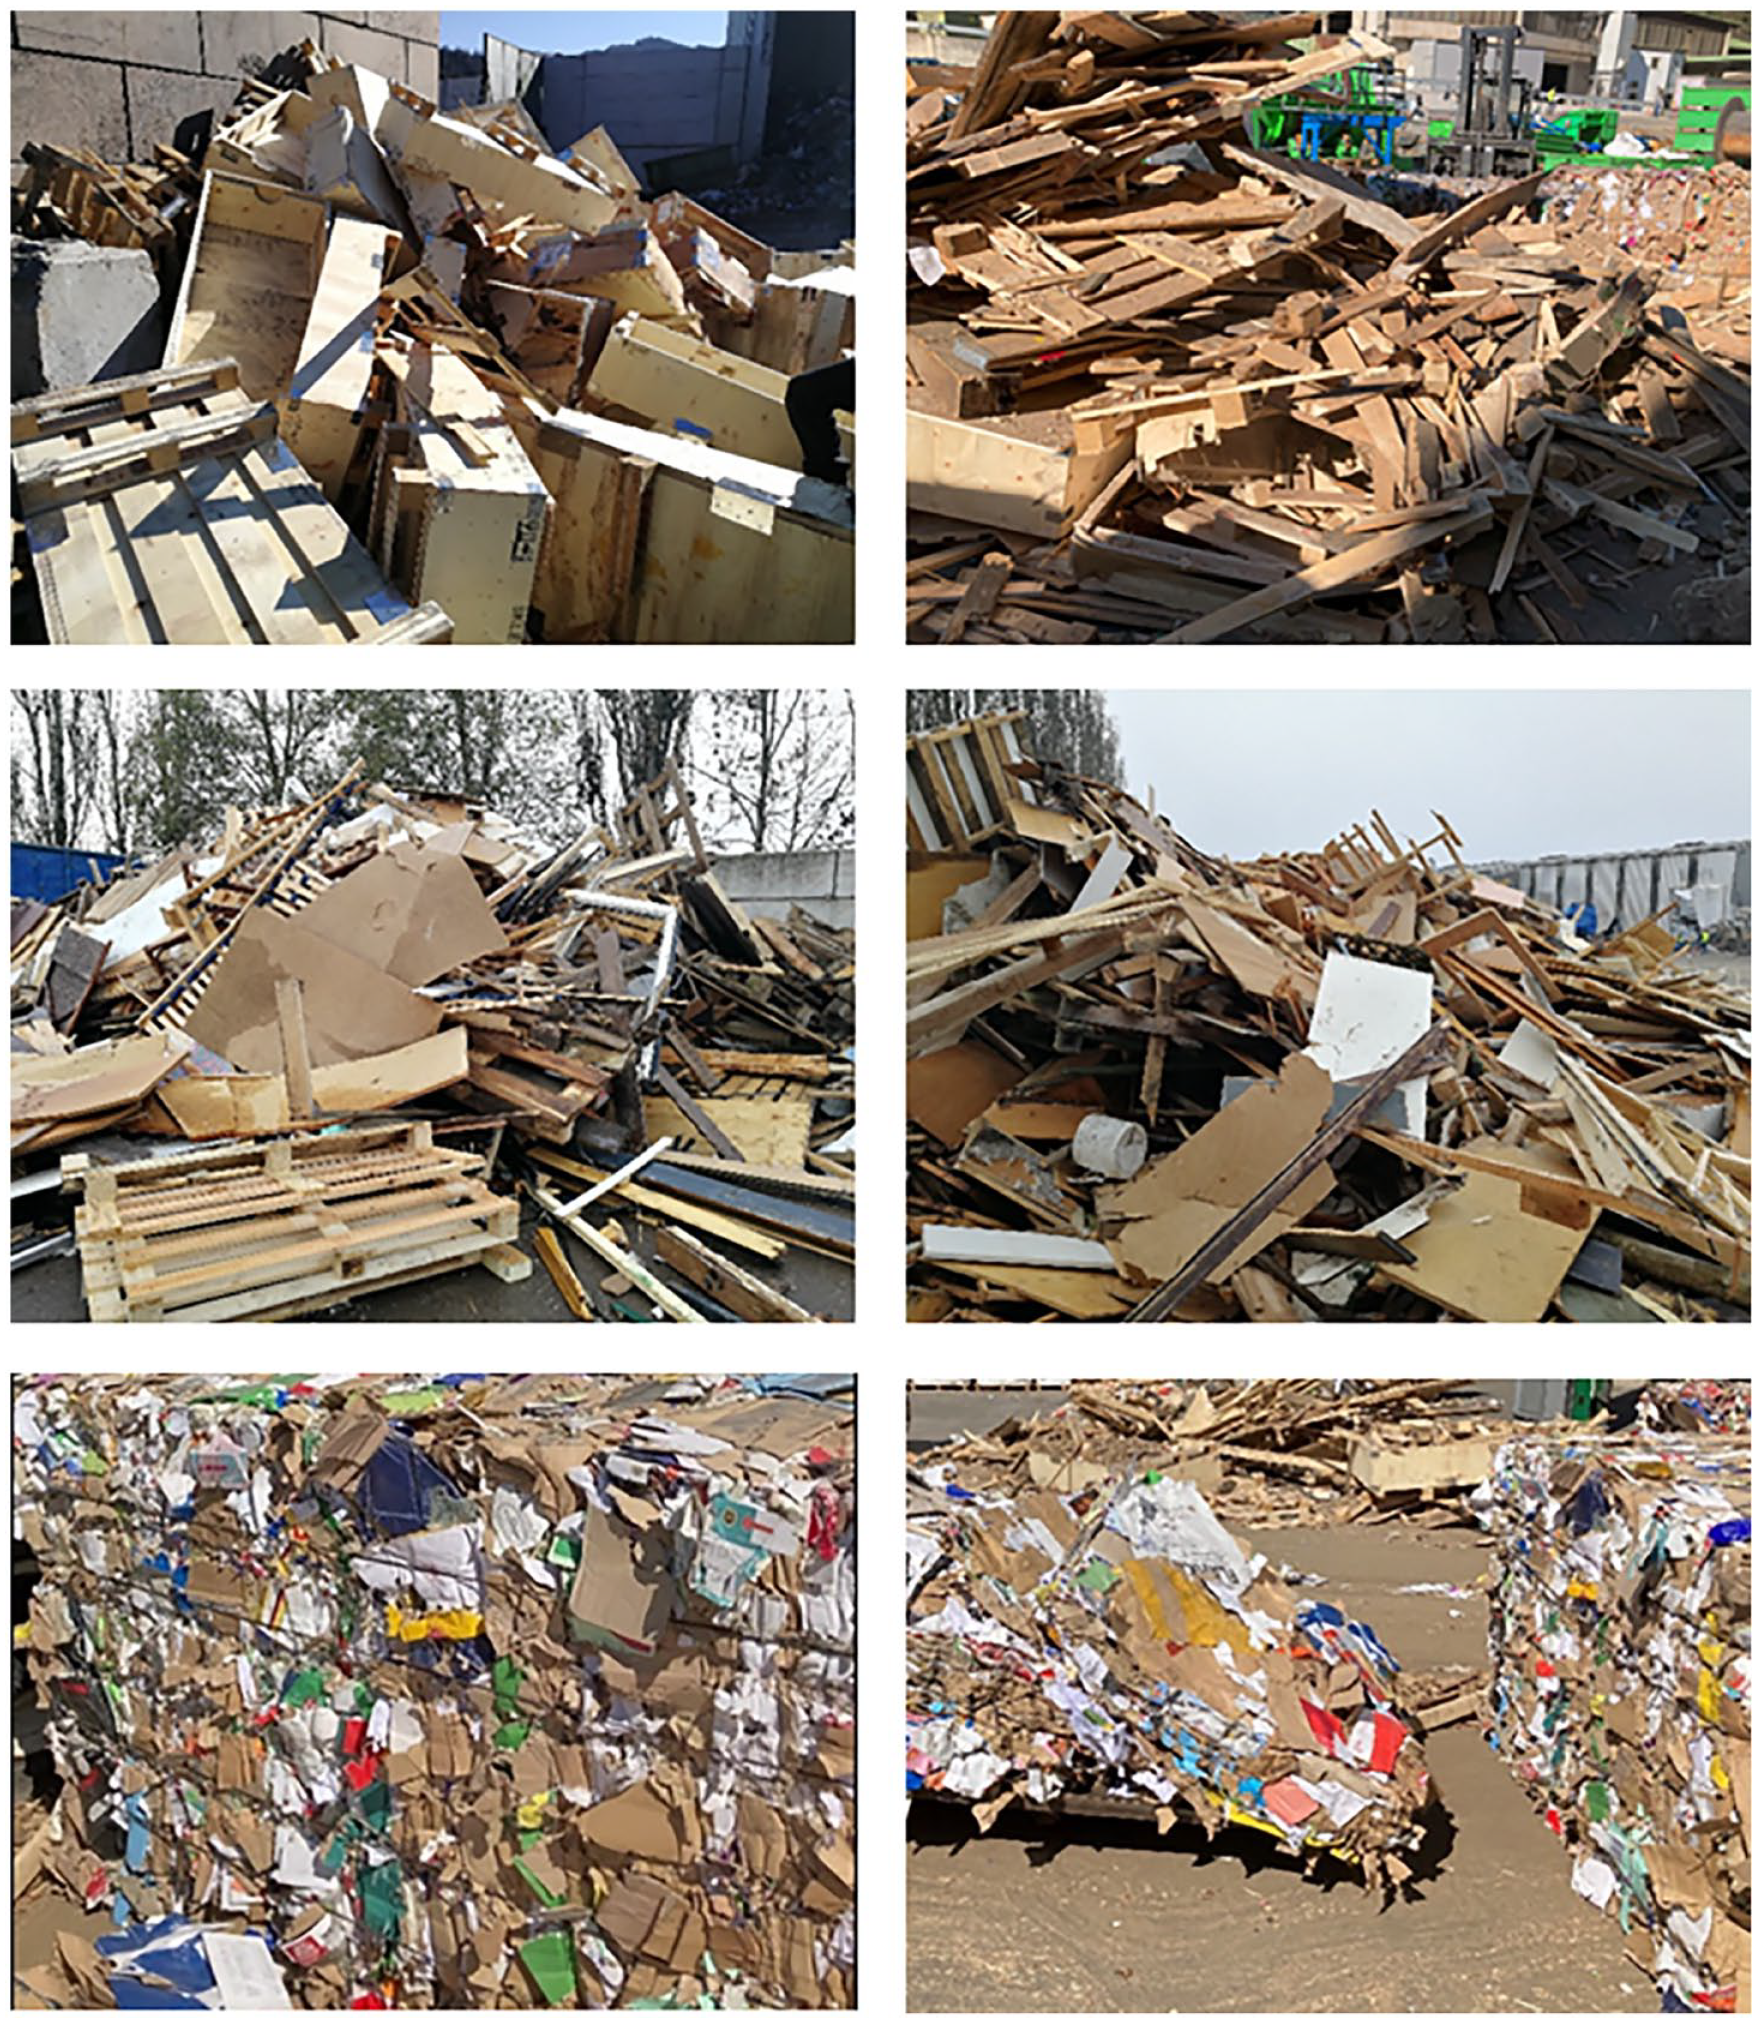
Example images of the input material waste wood and waste paper.
Waste paper
The waste paper fraction – shown in Figure 2 – is declared as paper of quality class Q 1.04, provided by an Austrian company (Mayr Melnhof Frohnleiten GmbH, Frohnleiten, Austria) in March 2022. According to the European List of Standard Grades of Paper and Board for Recycling EN 643, the old Grade Number: 1.04 includes supermarket corrugated paper and board, and this is how the waste paper supplied was defined in these trials (cepi, 2013).
Mix of waste wood and waste paper
A mix fraction, consisting of waste wood and waste paper, was used as further feed material in the experimental runs. In the experimental set-up, with the Shredder Terminator, the mixture was prepared using a wheel loader, which mixed the two fractions (approximately 45% waste wood and 55% waste paper, based on the mass) by using its loader bucket. In the experimental set-up with the Shredder Aduro, the mixture was prepared by manually feeding the material alternating onto a conveyor belt (in a quantity ratio of approximately 1:1 in relation to the volume), which then fed the shredder.
Machines
As shown in Figure 1, the investigations regarding to the interaction of the waste wood and waste paper fractions in the shredder grinding chamber were carried out with two shredders to show material–material interactions, independent of a shredding machine and to support the aim of developing a manufacturer-independent method, which is why two shredders from different manufacturers were analysed. Further investigations, that is, the influence of the state of wear, were carried out with one shredder (Terminator).
Terminator
The Terminator 5000S (from the Austrian company Komptech GmbH) is a mobile slow-running single-shaft shredder; here, the cutting tool type F was used (Komptech GmbH, 2023). The geometry of the cutting tools used is described in more detail in Khodier et al. (2021); furthermore, in the supplementary part an image (Supplemental Figure 1) is attached. The machine was operating on a 100% maximum of the shaft rotation speed, which is 31 rpm, and the cutting gap was completely closed.
Aduro
The Aduro U-1400 shredder (from Andritz AG) is a stationary slow-rotating, single-shaft shredder, with a hydraulic pendulum pusher (Andritz AG, 2023). The cutting component of the machine consists of a series of bottom and top blades that constantly overlap during cutting (cf. Supplemental Figure 2). An integrated screen insert – a screen basket is mounted under the shaft – with a mesh size of 60 mm (round mesh screen) was used for the experimental investigations resulting in a defined particle size range. The machine was operated on a 100% maximum of the shaft rotation speed, which is 100 rpm.
Digital material flow monitoring system
For each experiment, a mobile machine with an integrated belt scale – a digital material flow monitoring system (DMFMS) – was connected subsequently to the shredder. This machine is described in more detail in Curtis (2021) and is shown as an image in the Supplemental Figure 3. For the investigations considered in this work, the DMFMS was only used as a sampling aid by means of swivelling the discharge belt, samples can be taken at defined times and a more detailed description of the sampling process can be found in ‘Samples’ section.
Experimental design
Firstly, the experimental design is described in general terms, but for reasons of clarity, later, based on the objective (material–material interactions or wear condition of the cutting tools), a subdivision is made, and a detailed description is given there. Differences in the experimental design arise with regard to the feeding of the material, the feed material itself, the shredder and the sampling device. The rough experimental set-up is shown in Figure 1. Generally, the experimental design of all the attempts listed here is based on the trials conducted by Khodier (2021). Due to the use of different feed materials instead of mixed commercial waste, the experimental runs, the duration times and the sampling were adapted. The experiments were carried out as described: the feed material was fed into the shredder, further the shredded material was discharged by a conveyor belt, included in the shredder. This stream was fed into the DMFMS. Samples were taken from a falling stream using the output conveyor belt of the DMFMS by swivelling back and forth over a sampling device, and this sampling process was carried out according to the scheme of Khodier and Sarc (2021). The shredded material, except the taken samples, was collected in a product heap.
Material–material interactions
In this set-up, two shredders (Terminator and Aduro U) with fixed settings are tested to obtain machine-independent results. Depending on the shredder, the material was fed by hand using a conveyor belt (Aduro U) or by a wheel loader (Terminator). The feed materials used were waste paper, waste wood and a mixture of these two fractions. First the pure fractions were shredded in each case and then a mixture of those pure fractions. In both cases, the samples were taken with the help of a funnel to which a big bag was attached.
Wear condition of the cutting tools
Using the Terminator shredder, the focus here is on whether differences in the state of wear result in differences in the particle size distribution. Two different states of wear, ‘new’ and ‘old’ cutting tools, were used. The new cutting tools are brand new, and the old ones were worn out at that stage, so a change was imminent (operating hours approximately 250–300). The feed material used for the experiments was waste wood, which was fed into the shredder by a crane. The sampling was implemented by using a box.
Samples
In contrast to experiments with mixed waste (cf. Khodier et al. (2021)), the fractions considered here are expected to be more homogeneous, so a shorter test duration is chosen to minimise the amount of material used and thus to increase the general trial efficiency; nevertheless, with the expectation that the test time is long enough to cover the still existing inhomogeneity of the material and to take samples representatively. The first trial duration was set to 15 minutes to increase efficiency and because there was still sufficient buffer for sampling (sampling can take some time depending on how successful it is, positioning of forklift, jamming of sampling device, etc.), the test time for the subsequent tests was shortened to 10 minutes. The sampling interval was thus reduced from 3 to 2 minutes.
The sampling procedure was carried out based on Khodier and Sarc (2021) and Khodier et al. (2020), where sampling for mixed waste is discussed in detail. Furthermore, the Austrian Standard Austrian Standards Institute (2011) for the basic characterisation of waste heaps or solid waste from containers and transport vehicles was considered. In the present work, a sample is composed of increments, so a sample should cover the whole lot (cf. Khodier and Sarc (2021)). To obtain a representative increment, the sampling device was held under the falling material stream for about 1.4 seconds, whereas the conveyor belt of the DMFMS swung over the sampling device, so 10 increments per sample were taken. The average time of taking one increment is estimated from the total throughput per trial time and the average sample weight, and additionally verified by video recordings.
Every experimental run was repeated, so in total every material fraction (waste wood, waste paper and the mix of waste wood and waste paper) was tested five times, and so for every set-up five samples have been obtained. The sampling device used in this experimental design was a self-made funnel with the dimensions of 440 × 975 (length × width in mm) – so it is 2.5 times larger than the dimensions of the largest particle (cf. Austrian Standards Institute, 2011) –, underneath a big bag was mounted (cf. Figure 3). The sampling device was elevated by a forklift.
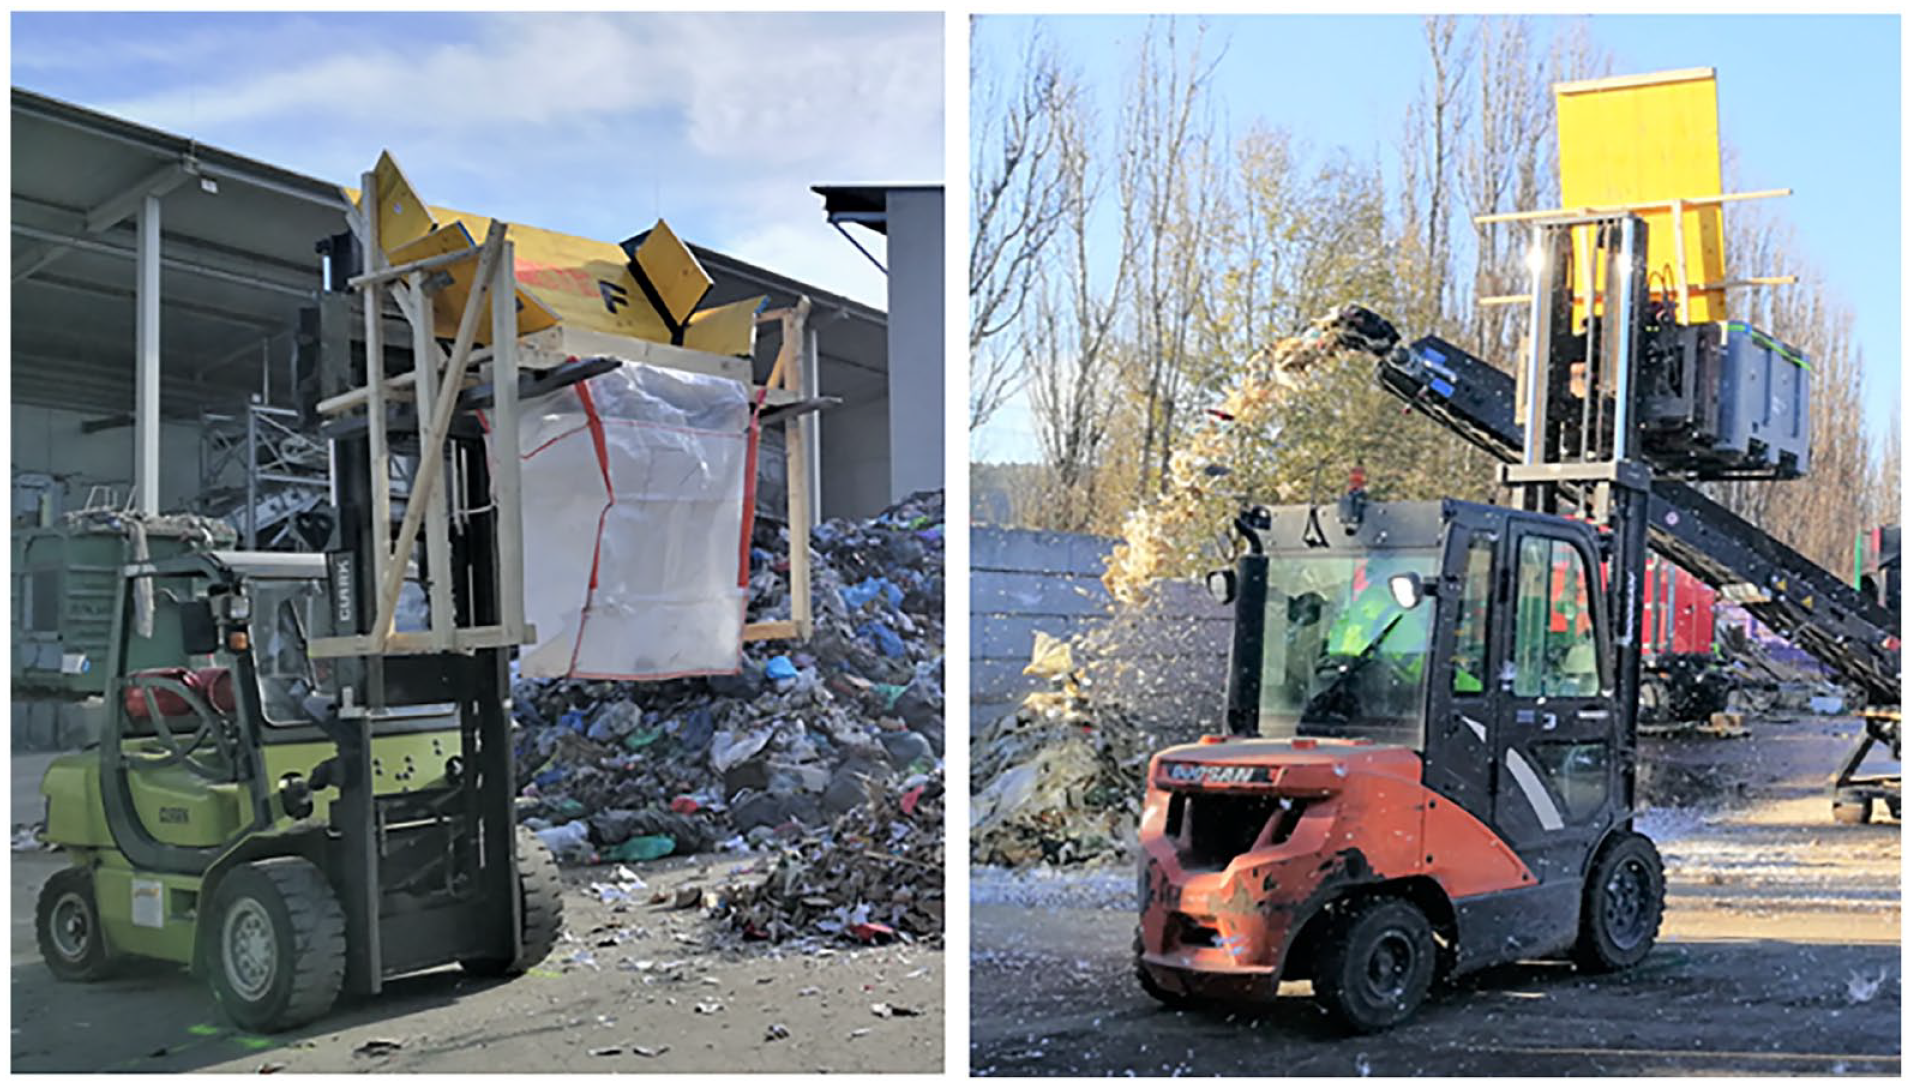
Sampling device positioned by a forklift: left for the material–material interaction experiments, right for the wear condition experiments.
For the experimental runs that consider the wear condition of the cutting tools, a sample was taken every 2 minutes (one run lasted 10 minutes). These experimental runs were repeated five times for each wear condition, so that five samples were obtained in each case. Because of availability reasons, a different sampling device was used compared to the former experiments. The sampling was implemented by using a box with the inner dimensions of 1115 × 915 × 565 (length × width × height in mm), again taking into account the standard: Austrian Standards Institute (2011). In order to collect the entire amount of sampling material in the sampling box, a wall was built out of wood to increase the back-side wall of the box (cf. Figure 3). A forklift elevated the sampling device.
Material analysis
All samples were analysed by a drum screen, and the samples of the mixture were also analysed by sorting.
Screening
A batch drum screen (Supplemental Figure 4 shows the dimensions) – described in detail by Khodier et al. (2020) – was used for screening analysis. This screen has a shape of an equilateral octagonal prism formed by the screen plates with circular holes. Screen plates of five different diameters (100, 80, 60, 40 and 20 mm) were used to screen the samples into six different particle size classes (0–20, 20–40, 40–60, 60–80, 80–100 and >100 mm) for the Terminator Shredder. Due to the integrated screen in the Aduro shredder, the particle size distribution for this experiment was between 0 and 60 mm. So, for the Aduro shredder, three different diameters (60, 40 and 20 mm) were used to get four particle size classes (0–20, 20–40, 40–60 and >60 mm). The screen was filled batch-wise, and a batch was about 2 × 80 l of material. A screening run consisted of two 90-second runs of the drum screen and about 7.5 drum revolutions per 90 seconds.
Sorting
To determine the distribution of the respective fractions (waste wood and waste paper) in the mixture particle classes wise, a manual sorting analysis was carried out for each screening section. In addition, impurities (including those in the pure fractions) were sorted out. For example, metallic components that are essential in the processing of wood products were sorted out in the waste wood fraction.
Data analysis
The aim of the data analysis is to show possible material–material interactions – based on the comminution behaviour of a fraction in the mixture and the same fraction separately comminuted – in the case of the experimental runs with different material fractions as feed material. A further goal is to show differences in the comminution behaviour dependent on the wear condition of the cutting tools based on the particle size distribution. The data obtained from the screening and sorting analysis of the particle size distribution were evaluated. The results in the particle size distributions from the five samples were obtained per material fraction, or in the case of the wear conditions, per wear condition. For the data analysis, a programming language for statistical computing: R was used (R. version 4.2.2 © The R Foundation). Firstly, univariate normality was tested on the proportions of the individual particle size classes per material fraction by a Shapiro–Wilk test (Royston, 1982a, 1982b, 1995) using the R-function shapiro.test. This test showed a normal distribution of the data as a result for most of the tested data. However, when testing the data for multivariate normal distribution, using the Shapiro–Wilk test (suitable for small sample sizes) (Farrell et al., 2007; Royston, 1982b), no normal distribution of the data was observed. Here, the package ‘mvnormtest’ version 0.1-9 for performing the Shapiro–Wilk test for testing multivariate normal distribution ‘mshapiro.test(x)’ in R was used (Czeslaw Domanski, 1998; Royston, 1982a, 1982b, 1995). However, as the data do not show multivariate normality, non-parametric statistical tests must be used for data analysis (Siegel, 1957).
A permutational multivariate analysis of variance (PERMANOVA), using the R-function adonis, was performed to investigate whether two groups of samples show any significant differences, based on the calculation of the distance between two samples in the experiment. The PERMANOVA is used when several dependent variables are analysed in a dataset. The null hypothesis (H0) is true if the centres of the groups are the same for all groups as defined in the space of the selected similarity measure (Anderson, 2017; Kelly et al., 2015). In this work, the test was used to check for significant differences in the particle size distributions of a material fraction (e.g. waste wood) from the mixture and the pure fraction (waste wood). In addition, investigations on significant differences in the particle size distribution of samples from different cutting tool wear conditions were tested. The graphical representation of the scattering of the data and the display of a comparison view is created in R as well. The mean value of the data is also displayed (as a square) in the figures, and the confidence intervals were created for all values with a univariate normal distribution. In addition to the graphical representation of the samples within a test series and their scatter, the Kruskal–Wallis test is performed using R. This test shows whether groups differ in one variable. The null hypothesis states whether the individual subsets correspond to the same population (McKight and Najab, 2010). This test is used to show that there is no significant difference between the samples within an experimental trial using the same model material.
Results and discussion
Here, at first the sampling quality in terms of the similarity of the samples within a test series is discussed. Furthermore, the results of the statistical permutation hypothesis test are presented, subdivided into their objectives, material–material interactions and wear of the cutting tools.
Sampling quality
In this part, the samples obtained – five samples each – from the respective fractions are investigated. Khodier et al. (2020) investigated the sampling quality of mixed commercial waste and addressed various sampling errors. As a result, it was found that the method used gives good results (with a threshold of 20% for good sampling) only for some of the fractions analysed and rather poor results for others. In the present work, the sampling errors were not investigated in more detail, but the total scatter is composed of material-related scatter, process-related scatter and sampling scatter, so the sampling scatter is a part of the total scatter. Figure 4(a) shows an example of the scattering of data from the pure waste paper fraction of the Terminator shredder. Here, it is assumed that compared to Khodier et al. (2020), the scatter is smaller, since for example, the feed material is a pure fraction or consists of two pure fractions; therefore, less material variation is assumed. In addition, the results of the Kruskal–Wallis test for a singular difference within a test series show that the null hypothesis – the five samples from the same fraction do not show any significant differences – can be accepted.
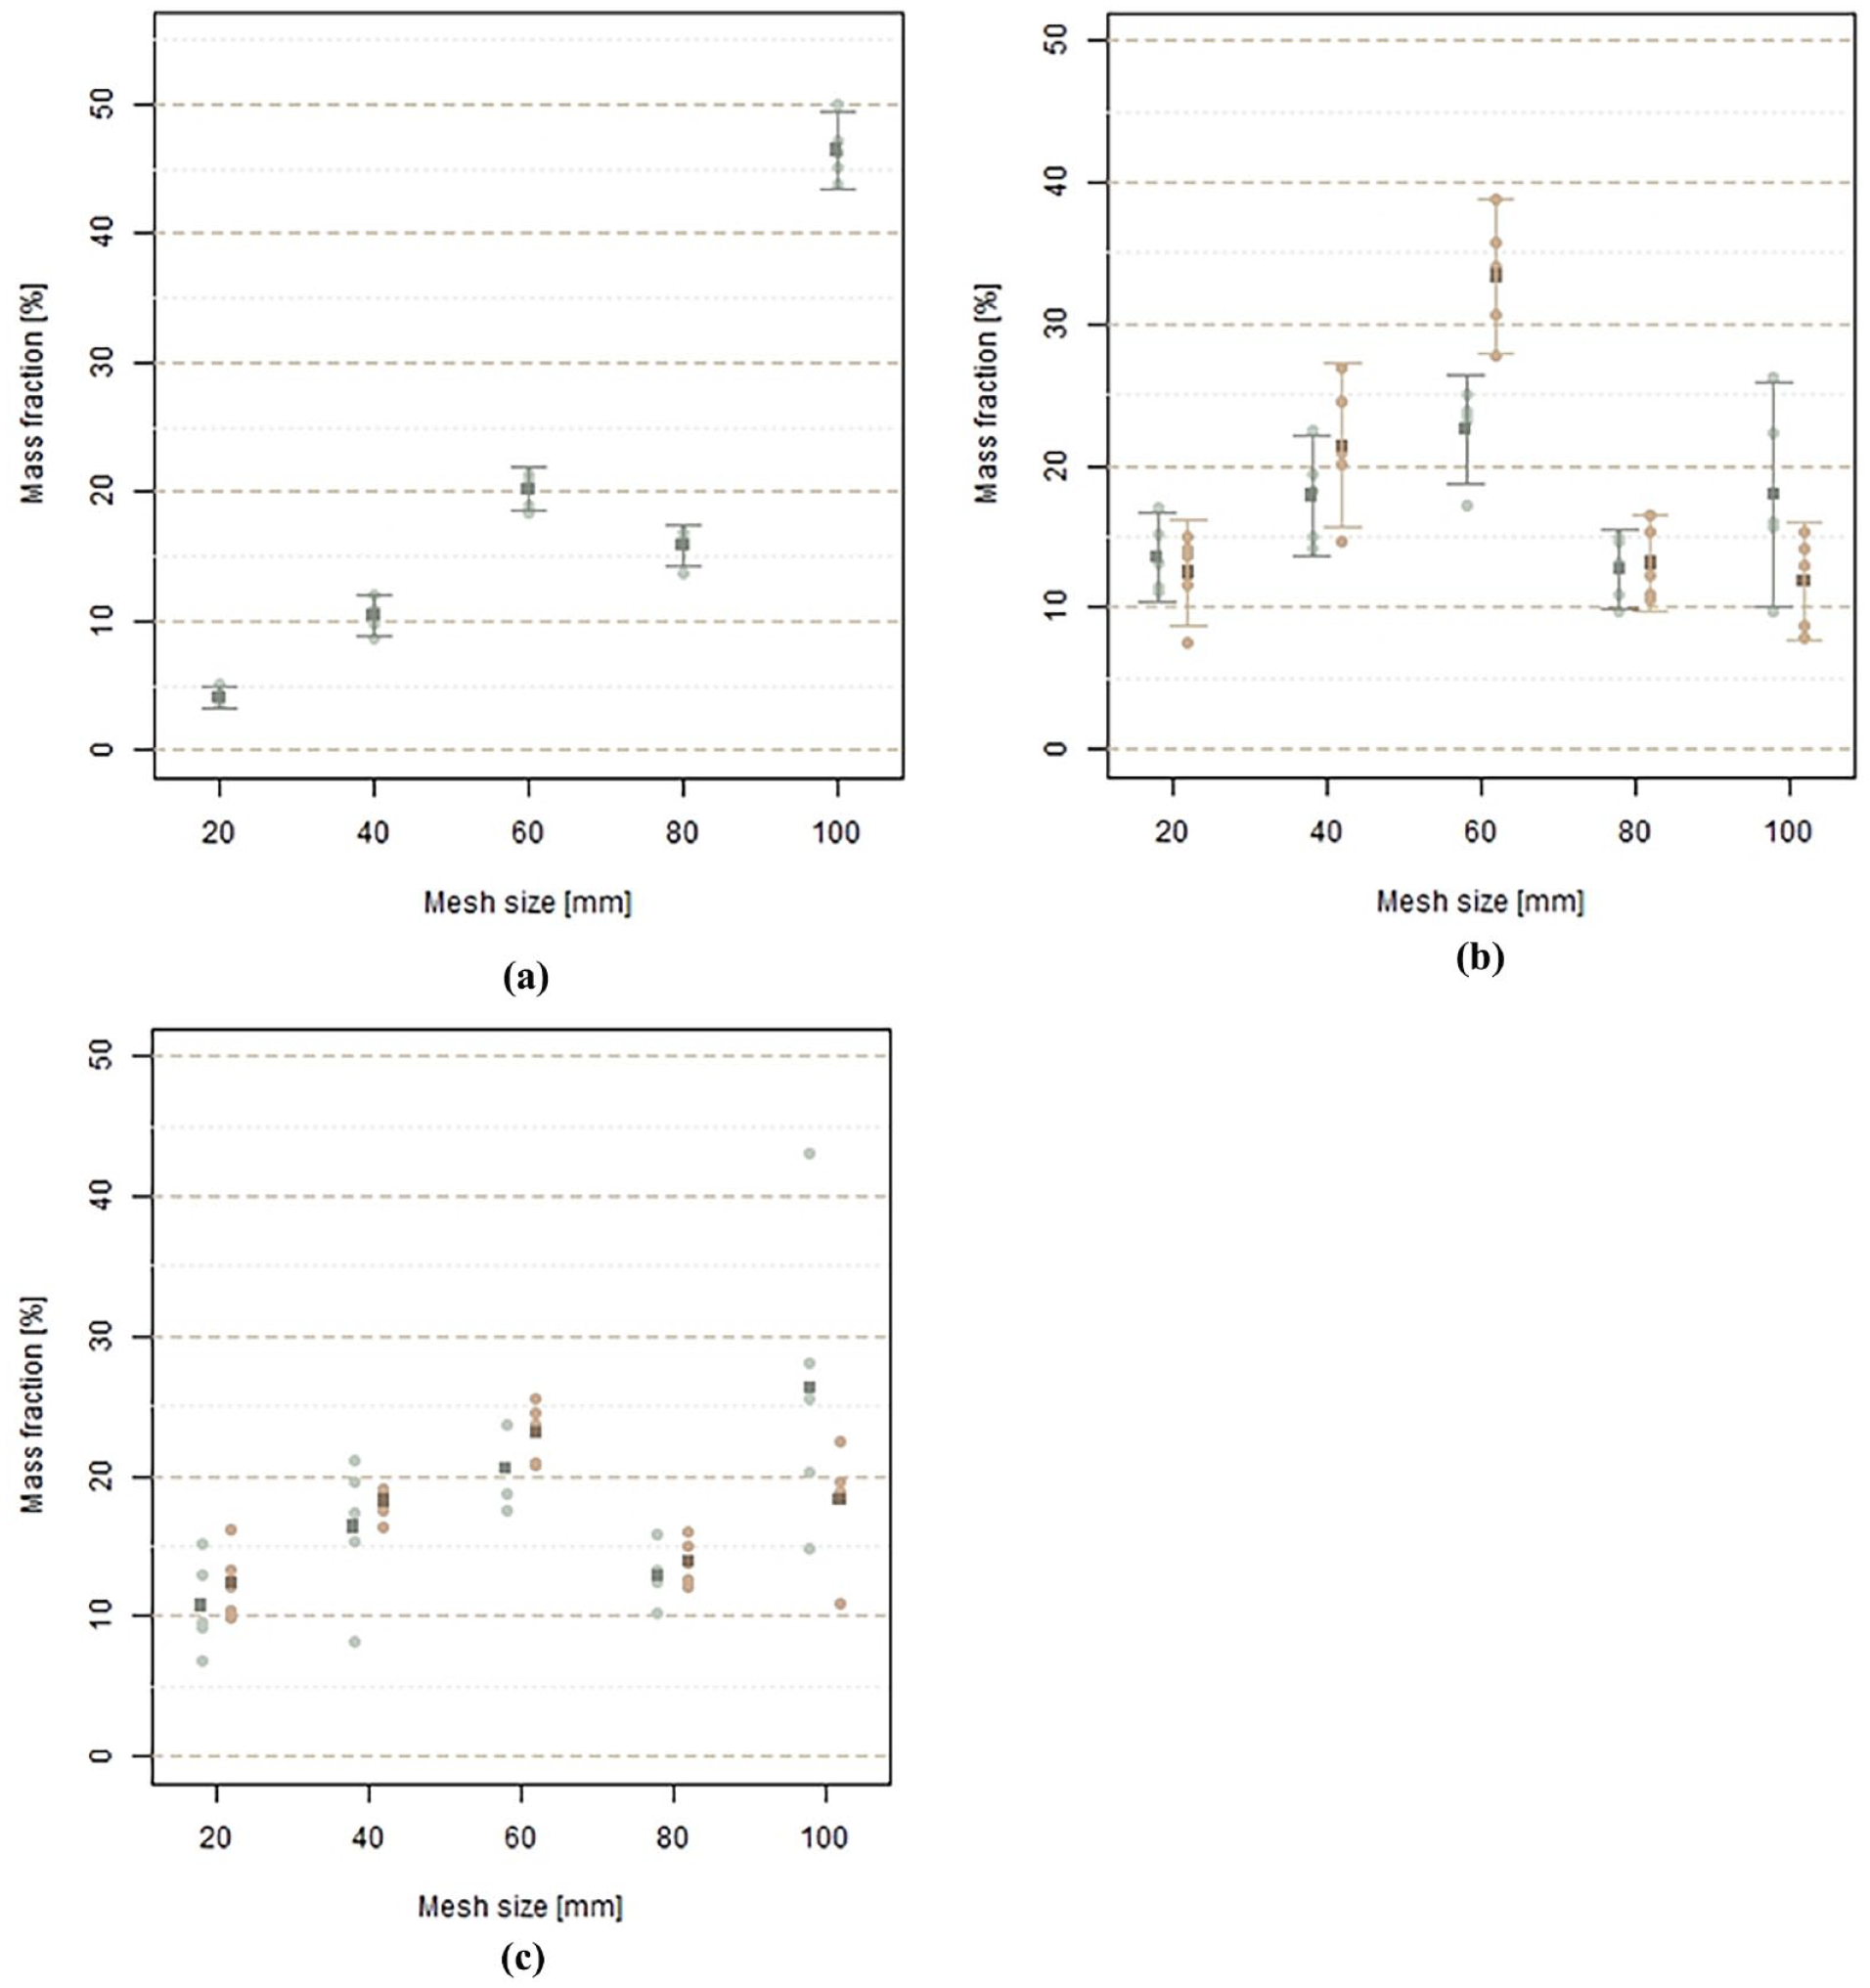
(a) Particle size distribution from the pure waste paper fraction (Shredder: Terminator); with confidence intervals and mean value (shown as a square), created in R. (b) Comparison of the particle size distribution (Terminator shredder) of waste wood from the pure fraction, the left side (in petrol) and from the mixture, the right side (in brownish). Also the confidence intervals and mean value (shown as a square) are presented. (c) Comparison of the particle size distribution (Terminator shredder) of waste wood with different wear conditions of the cutting tools; new cutting tools left side (petrol), old cutting tools right side (brownish). The mesh size indicates the smallest particle size.
Material–material interactions
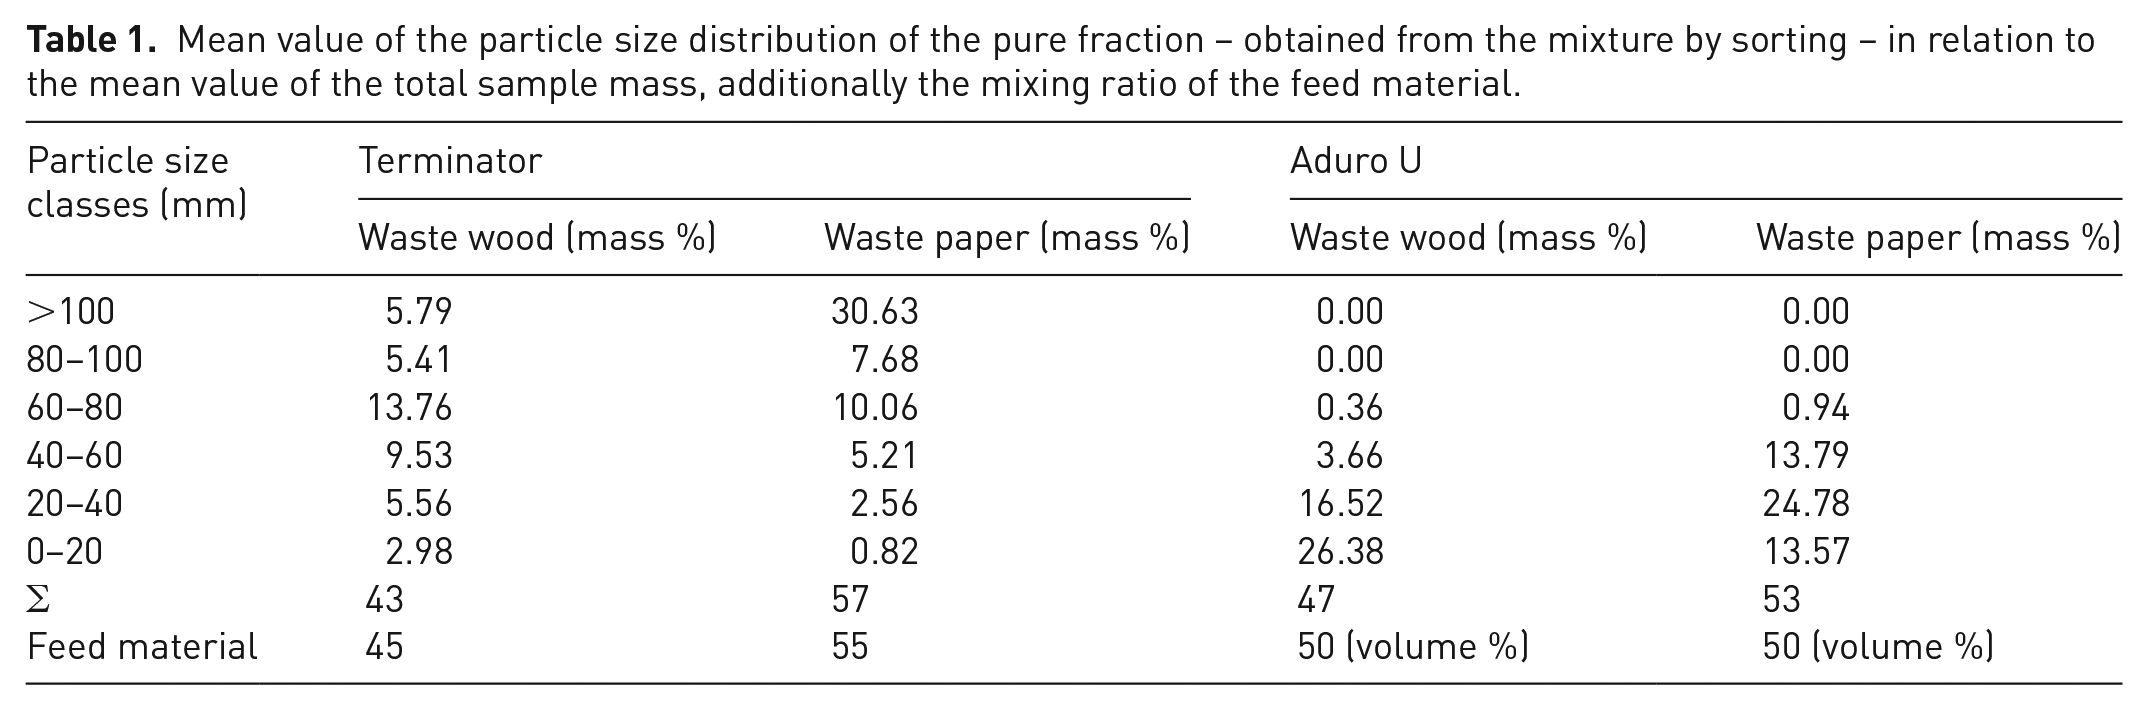
The results of PERMANOVA and the resulting findings on material–material interactions are discussed here. The particle size distribution of the pure fractions (waste wood and waste paper) resulting from the comminution of the mixture are shown in Table 1. The feed is also entered in the table to compare the proportions of the mixture in the feed material with the mixing ratios in the samples. As shown in the table, the input mixture of the terminator shredder consists of 45 mass % waste wood and 55 mass % waste paper. This ratio was determined by weighing the respective pure fractions before the mixing process. The composition of the samples resulting from the sorting analysis consists of 43 mass % waste wood and 57 mass % waste paper. The mixing ratio of the input material to the Aduro shredder is given in volume % (50% waste wood and 50% waste paper), as the mixture was made manually, when it was fed onto the conveyor belt into the shredder. The mixing ratio in the samples was determined in mass % and results in a ratio of 47 mass % waste wood and 53 mass % waste paper.
Mean value of the particle size distribution of the pure fraction – obtained from the mixture by sorting – in relation to the mean value of the total sample mass, additionally the mixing ratio of the feed material.
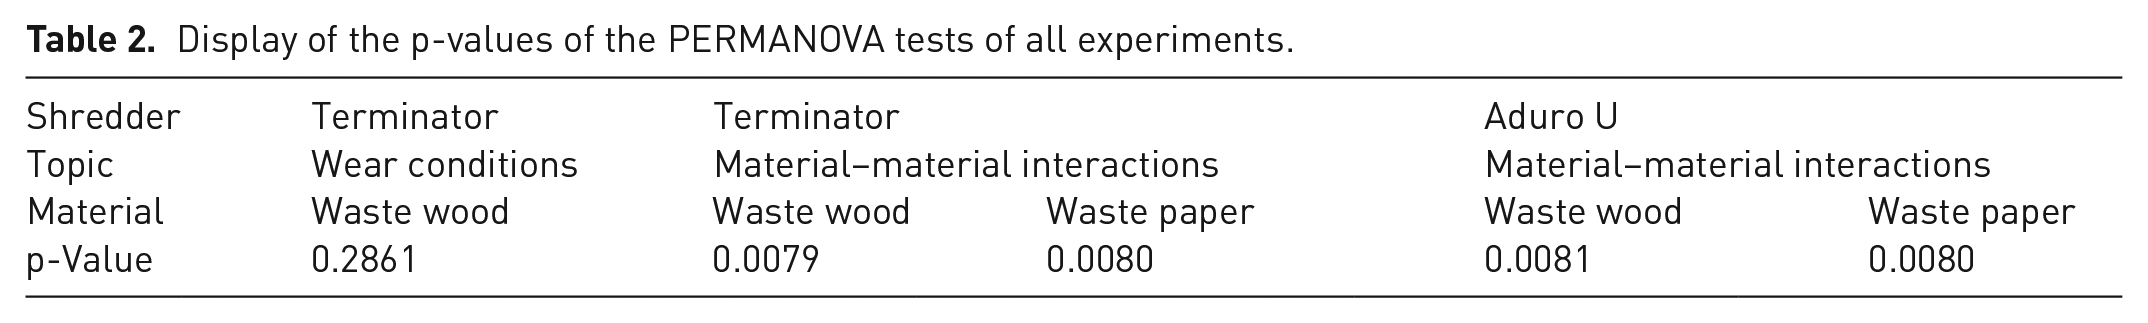
Results of the PERMANOVA show that the null hypothesis for all experiments can be rejected, cf. Table 2: some p-values (the empirical significance p) are below the defined significance level (α = 0.05). Hence, there is a significant difference between the samples obtained from the comminution of the pure fraction and the samples obtained from the comminution of the mixture. For visualisation purposes, a plot of the particle sizes of the pure fraction compared with the particle size distribution of the fraction obtained from the mixture is shown in Figure 4(b). The mean value of the representative particle size distribution (indicated by a square) and the confidence intervals (represented by vertical lines) are shown in the figure as well. The confidence intervals of the particle size distribution with the 60 mm mesh size do not overlap, which indicates a difference in the distribution. Additionally, further visualizations of the comparison of the particle sizes are shown in the supplementary material in the Supplemental Figure 5.
Display of the p-values of the PERMANOVA tests of all experiments.
The shredding is performed by the rotation of the shaft, while the material is shredded by the cutting tools and the counter comb (Komptech GmbH, 2023; Wong et al., 2022b). The shredding performance is influenced by the number, geometry, thickness and angle of the cutting tools. The material itself influences the shredding performance, whether it is the type of material and therefore the different properties (e.g. brittleness) or the orientation (vertical, inclined or horizontal orientation) of the material in the shredder. The size of the feed material used also influences both the feed behaviour and the forces and energy requirements that occur during shredding. Voluminous materials generally lead to less favourable feed conditions (Heibeck et al., 2021; Heibeck et al., 2023; Sridhar and Surendrakumar, 2017; Woldt, 2004; Wong et al., 2022a; 2022b). The results of the tests show that different materials in the shredder’s grinding chamber also influence the shredding process. In the case of waste wood, the harder material compared to waste paper, waste paper could be torn by the waste wood, or the feed behaviour of waste paper could be influenced due to the presence of coarser pieces of waste wood. Conversely, the brittle shredding of waste wood could be softened by the presence of waste paper (e.g. paper between the cutting tools and the wood). If, as has been proven, different material fractions have an influence on the particle size distribution, then it is also possible in terms of energy consumption, so that, for example, the comminution of the mixture is more energy-intensive than that of a pure fraction. The same could also be the case for throughput.
Influence of the wear conditions of the cutting tools
The results of the PERMANOVA and the resulting findings on the influence of the wear conditions of the cutting tools on the particle size distribution of waste wood are presented here. The p-value of the PERMANOVA (cf. Table 2) is higher than the chosen significance level of α = 0.05. So the null hypothesis cannot be rejected. Based on this result, no influence on the particle size distribution of the waste wood can be determined caused by different wear condition of the cutting tools. A reason for this could be the brittle comminution behaviour of waste wood. The wood is broken by the shredding mechanism, which results from the movement of the cutting tools against a counter comb. Due to the brittle properties of the wood, breakage can occur here, which is little affected by the wear condition of the cutting tools. Further investigations of other model materials, where it is assumed that they are more influenced by the cutting tools in their comminution behaviour, could show a different result. For example, in Feyerer et al. (2023), it was shown that the wear condition of the cutting tools has an influence on the material quality when shredding mixed commercial waste. In addition, it was shown that the throughput and energy consumption are influenced by different wear conditions. However, in the case of waste wood, no significant difference can be determined in the comminution behaviour of new cutting tools and old cutting tools, differences in for example, energy consumption or throughput could still arise, but these parameters are not part of the present investigations. Figure 4(c) shows the particle size distributions and their scatter, and the particle size distributions of the new cutting tools are compared to those of the old ones. These data do not follow a normal distribution, so the confidence intervals are not shown in this figure.
In general, further tests must be carried out to examine the comminution behaviour more closely, for instance to determine, if there are influences caused by wear conditions of cutting tools on other materials. Other cutting tools should also be tested, as the state of wear can have different effects on the material depending on the geometry of the cutting tools. Further investigations, which deal with cutting tools that are more intensively worn, could possibly determine an influence of the wear condition on the particle size distribution by experiments with waste wood.
Conclusions
By using model materials, it has been shown that interactions of the materials exist in the shredder grinding chamber. Therefore, the comminution of a pure waste fraction differs in the produced particle size distribution from that of a waste fraction in a mixture. In this work, the existence of these interactions was investigated and proven for the fractions waste paper mixed with waste wood. The investigation of other fractions (e.g. different plastics) can be assumed to provide additional information regarding the interactions of materials in the shredder grinding chamber. In addition, to obtain more meaningful data, a larger number of samples would be necessary; small sample sizes limit the use of many statistical tests. In further tests, to obtain more information about interactions and the general comminution process, the settings on the shredder are also to be varied and their influences to be described using model materials. Khodier et al. (2021) already described the influences of the different cutting tools on the particle size distribution (using mixed commercial waste), so this is a potentially promising approach that can be further investigated. Optimisation potential can therefore be identified and exploited by plant operators. If the comminution process is understood in detail and can be optimised, this can lead to energy savings and thus help to reduce emissions. The creation of the framework conditions for the assessment and subsequent optimisation supports several aspects: on the one hand shredder parameters (throughput, particle size, energy) can be made objectively comparable, on the other hand the optimised comminution process can have a positive effect on subsequent machines, thus improving their performance and contributing to better sorting efficiency to achieve recycling rates at the forefront of the circular economy. It is assumed that there is more potential information behind the wear condition of the cutting tools than has been proven so far. Current results do not show any effect of wear on the particle size distribution of waste wood, but it may influence other fractions that have a different comminution behaviour. However, if only the particle size distribution of wood is considered, the results can be used to consider changing the cutting tools less frequently, as they perform just as well in a worn state. This would reduce labour and material costs, as well as machine downtime, but energy consumption and throughput must also be taken into account. Here, only the effects of the wear conditions of the cutting tools on the particle size distribution were investigated, but other parameters such as energy consumption or the throughput rate of the shredder were not investigated. Since Feyerer et al. (2023) described that the wear condition has an influence on these two other parameters when shredding mixed waste, it cannot be ruled out that this is also the case with waste wood. Further investigations with different model materials and under consideration of the parameters mentioned are necessary to give a more precise picture of the influence of the wear condition.
Supplemental Material
sj-docx-1-wmr-10.1177_0734242X241306602 – Supplemental material for Influence of material–material interactions and wear on coarse waste shredders
Supplemental material, sj-docx-1-wmr-10.1177_0734242X241306602 for Influence of material–material interactions and wear on coarse waste shredders by Tatjana Lasch, Karim Khodier, Christoph Feyerer, Markus Lehner and Renato Sarc in Waste Management & Research
Footnotes
Declaration of conflicting interests
The authors declared no potential conflicts of interest with respect to the research, authorship, and/or publication of this article.
Funding
The authors disclosed receipt of the following financial support for the research, authorship, and/or publication of this article: Recycling and Recovery of Waste for Future (project nr. 882512) is a COMET Project within the COMET – Competence Centers for Excellent Technologies Programme and funded by BMK, BMAW and the federal state of Styria. COMET is managed by FFG.
Supplemental material
Supplemental material for this article is available online.
References
Supplementary Material
Please find the following supplemental material available below.
For Open Access articles published under a Creative Commons License, all supplemental material carries the same license as the article it is associated with.
For non-Open Access articles published, all supplemental material carries a non-exclusive license, and permission requests for re-use of supplemental material or any part of supplemental material shall be sent directly to the copyright owner as specified in the copyright notice associated with the article.