
Abstract
This study tackles the growing global concern about municipal waste management, particularly in cities like the Grand Guayaquil Metropolitan Area (GGA). Through realistic field studies on in situ household waste generation and geographic information system (GIS) tools, this work offers a framework to predict the quantities and types of recyclable household waste for any metropolitan area in Latin America. Over 4 weeks, students collected, sorted and weighed recyclable waste types, including plastic, paper, metal, glass and fabric, from 776 sampled household of the GGA. ArcGIS survey tool identified household locations and allowed to survey different socio-demographic features. With the help of ArcGIS interpolation method, the total household waste generation for GGA was predicted, and the classification of the different types of recyclable waste was also spatially distributed for the study area. The report identified notable trends in plastic waste, specifically polyethylene terephthalate waste’s steady prevalence and 42% growth rate, emphasizing the importance of enhanced recycling techniques. Spatial density maps showed a heterogeneous waste distribution across the GGA, emphasizing locations with higher waste output. This study demonstrates that improving recyclable waste collection can be accomplished with a moderately cheap expenditure by collaborating with academia to overcome knowledge gaps. This strategy provides opportunities to mitigate the environmental impacts of poor waste management.
Introduction
Municipal solid waste (MSW) management concerns are growing more prominent on the global environmental agenda as the rise in population and consumption leads to more significant waste generation volumes (Zhang et al., 2022). This issue brings forth a range of ecological, logistical and economic dilemmas for urban areas and regions (Hemidat et al., 2022; Guibrunet and Allen, 2014). Effective waste management must curate waste generation, minimize landfill use and mitigate the potential for environmental material losses throughout the resource recovery process. These materials can be broadly classified into three groups: household waste, other waste akin to household waste from commercial and industrial sectors and commercial and industrial waste. Household waste primarily includes food, plastics, paper, cardboard, textiles, glass, metals and inert substances like dust and ashes (Dharmendra, 2022). The proportions of each type fluctuate based on socioeconomic status, living standards and other factors (Nguyen et al., 2020). Nonetheless, plastic waste, the most prevalent recyclable waste, requires a suitable waste management system for collection and treatment at the end of its lifespan due to its persistence in the natural environment (Wamba et al., 2023).
Disposing of solid waste through open dumping can exert environmental and societal repercussions, leading to adverse effects on public health, such as the proliferation of diseases and an increase in child mortality rates (Ferronato et al., 2021). Mitigating these impacts begins with the secure collection of waste through source separation. Source separation of waste involves sorting waste at the location where it is generated prior to transportation. This practice aims to minimize overall waste production, enhance the recovery of reusable materials and ensure the proper disposal of hazardous waste (Zhang et al., 2019, 2022). Solid waste management services are predominantly furnished by local authorities on a global scale, either directly or indirectly, by outsourcing certain or all aspects of these services (Chalkias and Lasaridi, 2011).
Like other developing nations in the Global South, Ecuador grapples with issues like illicit dumping, uncontrolled burning and haphazard waste disposal (Ferronato and Torreta, 2019). Throughout numerous countries in Latin America and the Caribbean, sanitary landfills stand as the sole recourse for waste management and disposal. However, using landfill sites necessitates substantial land expanse, a resource progressively dwindling within urban frameworks (Langa et al., 2021). In this matter, the absence of organized waste collection persists in outlying urban areas. Chen et al. (2020) illustrated that source separation exhibits multifaceted benefits in their community study. Notably, it diminishes landfill burdens, lowers waste incineration moisture levels and elevates the lower heating value of MSW. Moreover, source separation yields a significant reduction in carbon emissions, with findings indicating a minimum decrease of 66.8% (Chen et al., 2020).
To attain top-tier waste management goals through an ongoing enhancement process, more is needed to merely possess knowledge about the overall global waste generation within a city. It is imperative to establish the quantity of waste produced, its composition and its spatial distribution (Eskandari et al., 2022; Dehghanifard and Hadi, 2018). Moreover, understanding the waste output in individual neighbourhoods can play a pivotal role in setting priorities for waste containment, collection and transportation. This, in turn, enhances the efficiency of planning and procurement processes (Majid et al., 2021).
Waste management systems encompassing multiple recyclable streams often require more significant transportation efforts, which can escalate costs when overseen by local authorities (Sonesson, 2000). Separation at source reduces MSW production, cross-contamination and significantly increases the fraction of MSW effectively recycled. As reported by Zhang et al. (2022), separation at source is carried out using complex quadruple or quintuple sorting systems (e.g. Shanghai or the EU), or in an essential wet/dry separation in which recyclable materials from the dry fraction are collected mixed in a single container (commingled collection of recyclables). Therefore, after collection and transportation, additional classification at the destination is still necessary after separation at the origin.
Commingled recyclables collection is an option to reduce costs and make citizen participation viable in communities with less tradition in separate collection (Baldwin and Dripps, 2012; Cimpan et al., 2015; Zhang et al., 2022). Whatever the type of separate collection system, it will always be necessary to quantify the quantities generated from each type of material to organize the whole waste management, from collection to transport and subsequent treatment (Zhang et al., 2022). Nevertheless, recycling is a fundamental practice in realizing zero-waste urban setups. The absence of reliable data on recyclable waste contributes to suboptimal and ineffective execution of waste recycling policies. Urgent attention is demanded to establish a dependable database for recyclable waste to furnish trustworthy information to national and local city governing bodies. A previous study underscored the significance of quantifying and acknowledging local recyclable waste as a cornerstone for developing zero-waste cities (Gu et al., 2021).
Comprehensive information regarding the generation of household waste can offer valuable insights to decision-makers aiming to target initiatives for waste reduction, enhance the efficiency of resource utilization and circularity objectives, pinpoint specific technological and infrastructural gaps and guide forthcoming advancements (Madden et al., 2021). However, this valuable data is frequently constrained due to concerns about individual household privacy and the high costs of doing detailed measurements and surveys on a broad scale. Furthermore, the lack of a standardized methodology for determining the categories, quantities, sources of generation and pathways of recyclable waste in any covered study area complicates the development of a geo-referenced database capable of effectively addressing waste management challenges (Blanco et al., 2018). Understanding the volume of waste within urban regions and identifying areas with the largest concentrations of recyclable waste in each geographical expanse could help develop an effective management strategy.
Geographic information system (GIS) helps identify waste sources across large tracts of land. GIS allows for efficient storage, geographic referencing, retrieval, exploitation and presentation of large amounts of data based on user-specified criteria (Blanco et al., 2018). This technique also makes it easier to create surface density indices for different types of recyclable waste and identify suitable disposal sites. These indicators are critical in providing evidence for conducting economic viability assessments on proposed recycling facility sites. Additionally, they foster discussions concerning the conceivable environmental ramifications associated with such facilities.
Through realistic field studies on in situ household waste generation and GIS tools, this work offers a framework to predict the quantities and types of recyclable household waste for any metropolitan area in Latin America. The study was conducted in the Grand Guayaquil Metropolitan Area (GGA) – a city that bases MSW management on a final disposal site – between February and March 2022. The findings of this research allow us to comprehend the generation of valuable materials at the source (before collection by scavengers) to geographically understand the potential for generating recyclable materials. This information is the first stage in determining the factual potential of the market for producing and selling recyclable materials, as well as for designing and implementing strategies to integrate recyclers into a formal economy, granting them access to health services and other government benefits.
Review of household solid waste, plastic waste, waste recycling and the role of GIS in waste management
Household solid waste
Waste management operational techniques include containment, collection, transfer, transportation, sorting and processing and final disposal. The collection and transport of household wastes are among the most critical factors in waste management, representing a significant part of the budget. However, the quantities and classification of wastes vary greatly. Their production depends on several factors, such as the number of inhabitants per area, lifestyle, food habits, seasons, movements and migration of people (Nuortio et al., 2006).
Many studies have analysed household solid wastes in different cities. For instance, Phuong et al. (2021) calculated solid waste generation from 110 households in the city of Hanoi, Vietnam, finding out an average waste generation rate of 0.63 kg/hab/day, with recyclables other than food waste being plastics (7.4%), paper and cardboard (5.65%), metals (1.52%), glass (1.18%) and fabric (0.29%). Discards of household solid wastes in the municipality of Sao Paulo, Brazil, were found to average 0.61 kg/hab/day, being paper and plastics the most frequent items with around 53% wt% and 79% vol., respectively (Mantovani et al., 2016). The waste generation rate was reported to be 0.36 kg/hab/day for Dar ES Salaam City, Tanzania, and ~55% of this waste can be recycled (Kaseva et al., 2002). For the case of Guayaquil in Ecuador, one previous research was effectuated in 2018 accounting for the amount of waste generated during 2 weeks for 683 households in the city, finding out that total household solid waste generation is 0.58 kg/hab/day, being the percentage for organic and inorganic recyclable wastes the following: plastic 9.48%, paper and cardboard 6.96%, glass 3.27%, metals 2.43% and fabric 2.10%, accounting a total of 24.24% of recyclable waste (Hidalgo-Crespo et al., 2021b).
Household plastic waste
Over 368 million tonnes of plastics were produced in 2019 worldwide (de Sousa, 2021), and their use is constantly growing due to the increase in delivery services influenced by the pandemic. Research conducted in Osaka revealed that plastic packaging waste and greenhouse gas (GHG) emissions increased 1.35-fold during the COVID-19 pandemic (Limuro and Tabata, 2023). Household plastic waste can be suitable for economically feasible mechanical recycling. However, cleaning is necessary since they often are contaminated with pieces of organic matter and other pollutants, such as oils (Nikiema and Asiedu, 2022).
Previous studies have measured the classification and quantities of the different plastic wastes present in MSW such as polyethylene terephthalate (PET), high-density polyethylene (HDPE), low-density polyethylene (LDPE), polyvinyl chloride (PVC), polypropylene (PP) and polystyrene (PS), for years 2019 and 2021, finding out that the total plastic waste generation augmented a total of 31.26% going from 28.41 in 2019 to 37.29 g/hab/day in 2021 (Hidalgo-Crespo et al., 2021b, 2022). From the plastic waste generated in 2021, the classification was PET 40.57%, PP 19.92%, HDPE 15.88%, LDPE 10.70%, PVC 6.73% and PS 6.19% (Hidalgo-Crespo et al., 2022).
Waste collection
Paper, cardboard, fabrics and non-biodegradable wastes such as plastics, metals and glass are commonly the most collected materials by any city’s formal and informal sectors. In Latin America, informal waste pickers (IWPs) follow their collection routes, depending on their self-organization (Botello-Álvarez et al., 2018). According to information from the Ministry of Environment, Ecuador has a commercial balance of solid waste, mainly in markets for scrap metal, plastic, rubber, paper and cardboard.
Urban mining is the recollection of waste materials from any anthropogenic reserves. This activity has a positive environmental impact and is part of waste management systems. According to the Ecuadorian National Institute of Statistics (INEC, 2022), every Ecuadorian produces an average of 0.58 kg/hab/day of MSW. Citizens engaged in waste collection as an economic activity are known as scavengers or IWPs. Their activities impact the environment by helping reduce GHG emissions. A Mexican study showed that waste pickers reduce GHG emissions in the MSW management system by 8.4% (Botello-Álvarez et al., 2018). According to the Inclusive Recycling Initiative (IRR), the most collected materials for the city of Guayaquil are paper and cardboard (42%), soft plastics (LDPE) (13%), hard plastics (HDPE) (9%), PET (20%), glass (11%) and metals (5%) (IRR, 2015).
Additionally, according to IRR (2015), IWPs sell their collected recyclable waste to small and medium entrepreneurs, commonly known as brokers or resellers or medium-level aggregators, with the capacity to transport, process, store and trade with local industries and recycling facilities. The broker establishes the purchase price for the recyclable waste based on the volume and quality of the materials. According to the National Network of Waste Pickers (RENAREC), there are an estimated 20,000 waste pickers nationwide, and Guayaquil accounts for 4465 (22%) (IRR, 2015). However, only 1000 are part of RENAREC. According to RENAREC, in Guayaquil, ~69,000 tonnes of solid recyclable waste are annually by waste pickers. For example, it is estimated that the Ecuadorian industry imports 49.2 ktonne/year of virgin PE plastic per month, and the informal sector supplies ~15.3 tonne/year of PE, meaning 31% of the country’s annual demand. One study found that 8.4% of post-consumer recycled plastic waste in the USA produces net GHG savings and net annual revenue, and more importantly, these values continue to be negative even considering a 100% collection efficiency (Basuhi et al., 2021).
GIS in waste management
GIS is a location intelligence technology that supports the systematic collection, integration and sharing of spatial data. It is among the most sophisticated modern technologies nowadays. These data are usually organized into thematic layers in the form of digital maps. Thematic maps show the distribution pattern of a particular theme objective. It involves data classification methods such as equal interval, equal area, standard deviation, means, natural break and user-defined (Shoba and Rasappan, 2018). GIS has been successfully used in a wide variety of applications, such as waste management (Quintero-Herrera et al., 2023; Balaguru and Rasappan, 2013), including collection, transportation (Benitez-Bravo et al., 2021; Rada et al., 2013), waste generation prediction (Purcell and Magette, 2009; Hysenaj and Duraj, 2022; Mahmood et al., 2018) and final disposition (Rueda-Avellaneda et al., 2021; Zhang et al., 2021; Cheniti et al., 2020) and is looking for space availability for specific waste treatment systems, such as anaerobic digestion and composting (Edwards et al., 2016).
GIS provides an effective tool for characterizing and visualizing geographical distributions of waste and recyclable resources or materials dispersed across urban environments, it can be used to capture and analyse location intelligence about the spatial distribution and values of recyclable resources and associated collection systems, this information empower and inform the policymakers and the broader community with comprehensive, accurate and accessible information. A web mapping portal integrated with a GIS for recyclable resources serves as an effective platform for engaging stakeholders and the general public. It offers a spatial database supported by national spatial data infrastructure, along with analytical functions for collection studies and tools to effectively communicate the value of recyclable resources to the broader community (Zhu, 2014). Life cycle assessment reveals that transportation, sorting and disposal of household recyclable waste significantly contribute to its environmental impact, which can be mitigated by selective sorting at the source (Wang et al., 2018).
Materials and Methods
This study focuses on households’ biodegradable and non-biodegradable solid recyclable waste, excluding food, hygiene products, dust and hazardous waste. Following the work of Tsheleza et al. (2022), a stratified random sampling was applied for the study area, followed by the collection of one previously donated plastic bag containing all their recyclable biodegradable (paper and cardboard, and fabrics) and non-biodegradable (plastics, metals and glass) household waste in a mixed manner. The generated waste was after hand-sorted, classified and weighed for each category (Miezah et al., 2015; Tsheleza et al., 2022). Plastic waste was further classified into seven categories, namely PET, PP, PS, PVC, HDPE, LDPE and other plastics (OP) as previously done by Hidalgo-Crespo et al. (2022).
A socio-demographic survey was developed and applied to the sampled population through the ArcGIS Survey 123 tool, which additionally allowed to have a very clear geo-location of each participating household. To continue, the data collected manually was connected to the geo-location and uploaded into ArcGIS. Spatial interpolation was later used to predict the total waste generation of all types of waste for the whole study area following the works of Velastegui-Montoya et al. (2023) and Hidalgo-Crespo et al. (2023).
Figure 1 shows the general diagram of the methodology proposed for this work. First the study area is presented, its current MSW management system, and the sampling and data-gathering procedure. Subsequent the sampling and waste collection is introduced. Furthermore, the waste sorting and weighing procedure is shown: working tables were assembled, and participant students were trained to sort the different types of waste. Then the use of a GIS tool to survey and geo-locate every participating family is demonstrated. Finally, the spatial interpolation process to obtain (waste-coloured maps based on the density per polygon of the study area is presented.
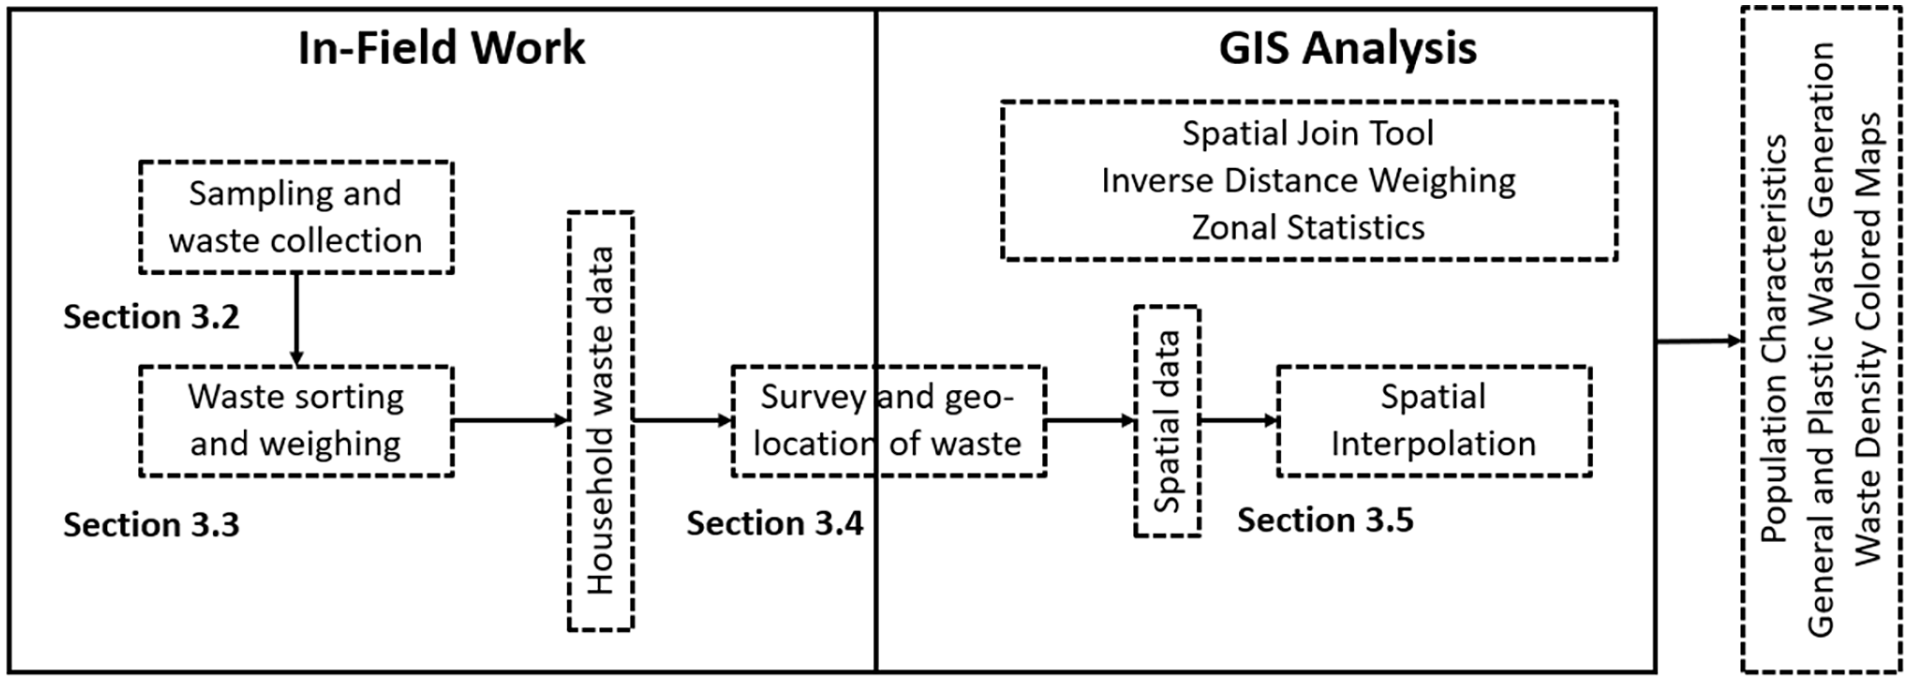
Framework for waste quantification prediction.
Description of the Grand Guayaquil Metropolitan Area and its MSW management system
The GGA comprises the city of Guayaquil and some portions of its three surrounding cities (Duran, Samborondon and Daule). The population growth and the lack of affordable housing have forced the population to start living in the surrounding cities; however, most of the population’s economic activity occurs in Guayaquil, having the population commute to work back and forth every day. The GGAs territory is 545.68 km2 (~98% belongs to Guayaquil) between latitudes 1°57′–2°17′S and longitudes 79°44′–80°05′W, as shown in Figure 2. Collectively, these four urban centres account for a population of 3.03 million individuals, constituting 17.30% of the entire country’s population. A previous work (Mora-Araus et al., 2021 and Velastegui-Montoya et al., 2023) divided the GGA into 91 polygons (neighbourhoods), where 86 of them belong to the city of Guayaquil, whereas the other 5 represent the urban expansion to the other 3 mentioned cities (polygons 22, 45, 71, 89 and 90). For a more detailed figure including the names of the 91 polygons, refer to Supplemental Appendix A.
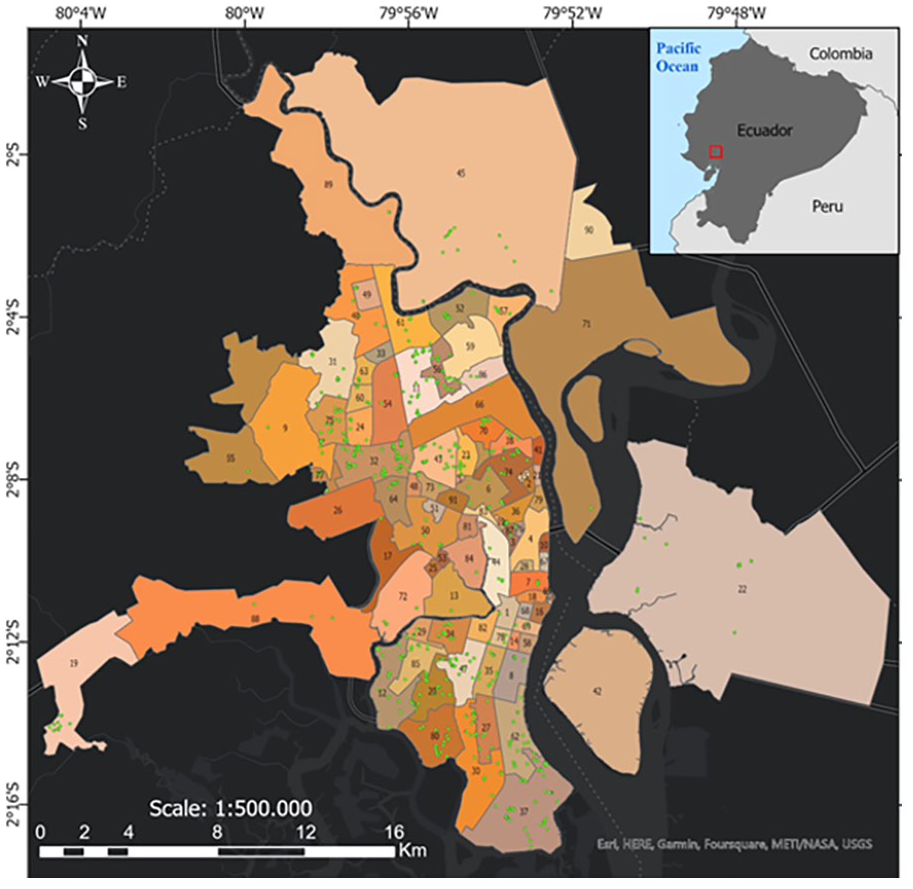
Grand Guayaquil Area and the distribution of 91 polygons.
The traditional collection system for waste in GGA functions with households and commercial stores leaving their waste at previously specified corners (curbside) or bins close to the streets at a specific range of hours. The garbage truck passes on different days and hours depending on the neighbourhood, emitting a distinctive song upon its arrival and after transporting the waste to the local landfill. This results in recyclable materials being mixed with organic waste and other impurities. This method has proven to be the most economical and is mostly applied in the urban sectors of the country (Zbib and Wøhlk, 2019). Some IWPs gather some of the valuable recyclables from the curbside and then transport them to other aggregators for accumulation and recycling (Hidalgo-Crespo et al., 2023).
With regard to waste generation, a prior study for the city of Guayaquil in 2018 identified that every person generates 4.06 kg of solid waste weekly, with food waste representing 76%, biodegradable recyclable waste recyclable a value of 9% and non-biodegradable waste a total of 15% (Hidalgo-Crespo et al., 2021a). When zooming into the plastic household waste generation, another study for the city of Guayaquil for 2021 found that the most generated types of plastic waste were in order of magnitude: PET 39%, PP 19%, HDPE, 15%, LDPE, 10%, PVC, 6%, PS, 6% and OP, 5% (Hidalgo-Crespo et al., 2022).
Sampling and waste collection
This research employed a direct quantification approach to ascertain the total amount and composition of recyclable waste generated in 2022. The direct method offers the advantage of more accurately reflecting the specific local characteristics and current study area conditions. This methodology was chosen over the indirect quantification method, which relies on predefined indices from various sources. This study applied a probabilistic sampling technique to select households, ensuring a statistically representative sample of the overall population. The selected households were strategically chosen to maintain a relatively uniform spatial distribution throughout the urban periphery of the GGA. The determination of the sample size for the study area employed the formula provided below (Dillman, 2000):
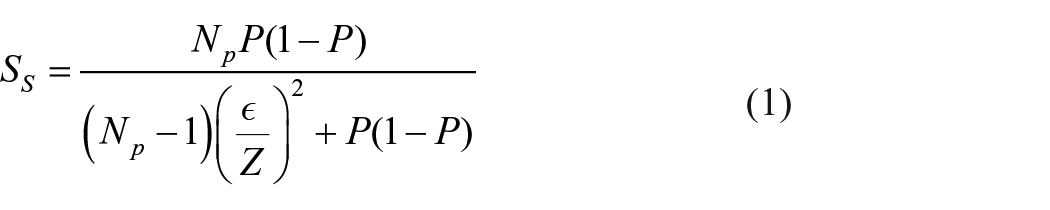
where, SS represents the sample size, Np is the total size of the population, P is the anticipated proportion of the specific type of answers (we consider 0.5 to keep a conservative approach), ε is the acceptable sampling error and Z is the statistic value associated with the confidence interval (1.960 for 95% confidence level).
The project procedure was presented to students enrolled in Energy and Environment courses across two local universities during the final 2 weeks of December 2021. The collection required each student to involve 6 households from any of the 91 polygons of the GGA, indicating to each household head the instructions to separate and store their recyclable waste (plastic, paper and cardboard, metal, glass and fabric) into 2 black plastic bags (size 95 × 120 cm), and recuperating and delivering the filled bags each week to the University of Guayaquil. Each bag was given a name tag with a code depending on the student’s last name, the participant’s family and the collection week. Participant families were instructed to deposit all their recyclable waste into the bags, and every student passed at the end of each week to collect the filled bags and left the two new ones with the new codes’ stickers. The project lasted 4 continuous weeks, starting 31st January and finishing 28th February. One hundred fifty-six students registered, 135 for the collection and 21 for the sorting segments.
The study included a cohort of 776 verified households, with a 95% confidence level and a sampling error of 3.52%, based on a population of almost 570,000 households.
Waste sorting and weighting
Three working tables were assembled for the sorting part, as shown in Figure 3. Seven students participated at each table. Students were instructed in the sorting process through two trainings. The first training was to show the materials for each working table and the entire process from getting each bag to the registration of the weighs for every type of waste. The second training’s objective was to instruct the students the process to separate the plastic waste into the seven sub-categories. Each working table had the following materials: 12 previously weighed buckets (5 large of 26 L and 7 mediums of 16 L), one 50 kg hanging scale, two high precision digital scales of 5 kg of maximum waste and 1-g precision. The process consisted of weighing the tagged bags with the hanging scale and recording the data from the bag in a printed spreadsheet. Secondly, the waste was sorted according to the five types of recyclables (each bucket had a label indicating the type of waste), the five large ones for plastics, metals, glass, fabric and paper and cardboard, and the seven medium ones for the different types of plastics: PET, HDPE, LDPE, PVC, PS, PP and OP (Table 1). Any liquid or other material inside the waste was poured before the measurements.
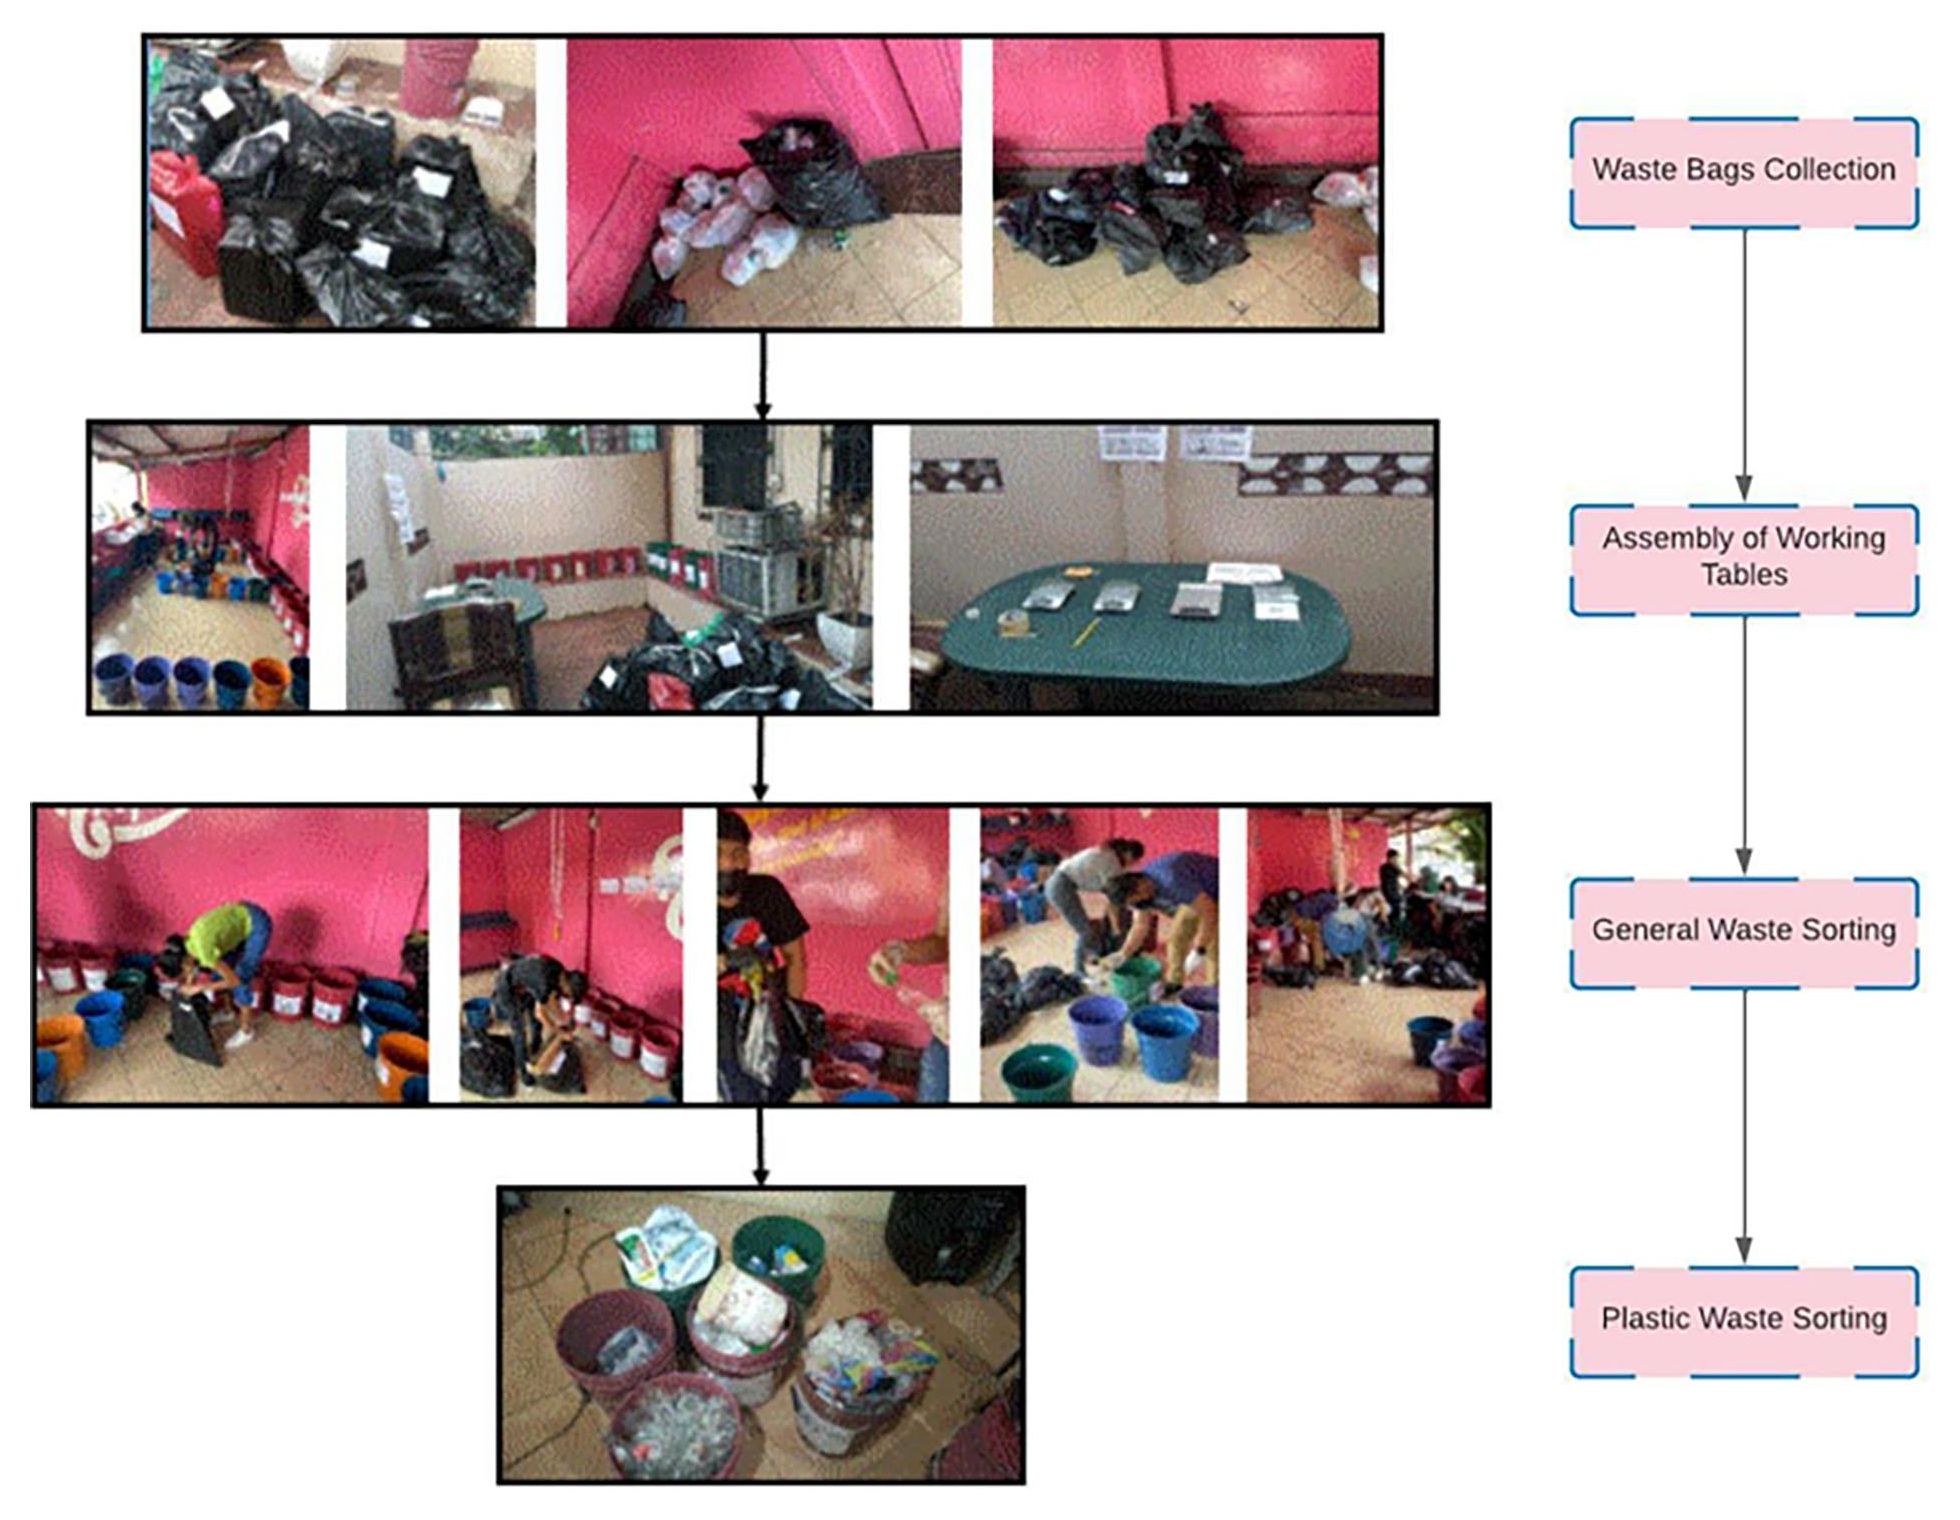
Collection and sorting process of household recyclable waste.
Characteristics of the household sample (percentages).
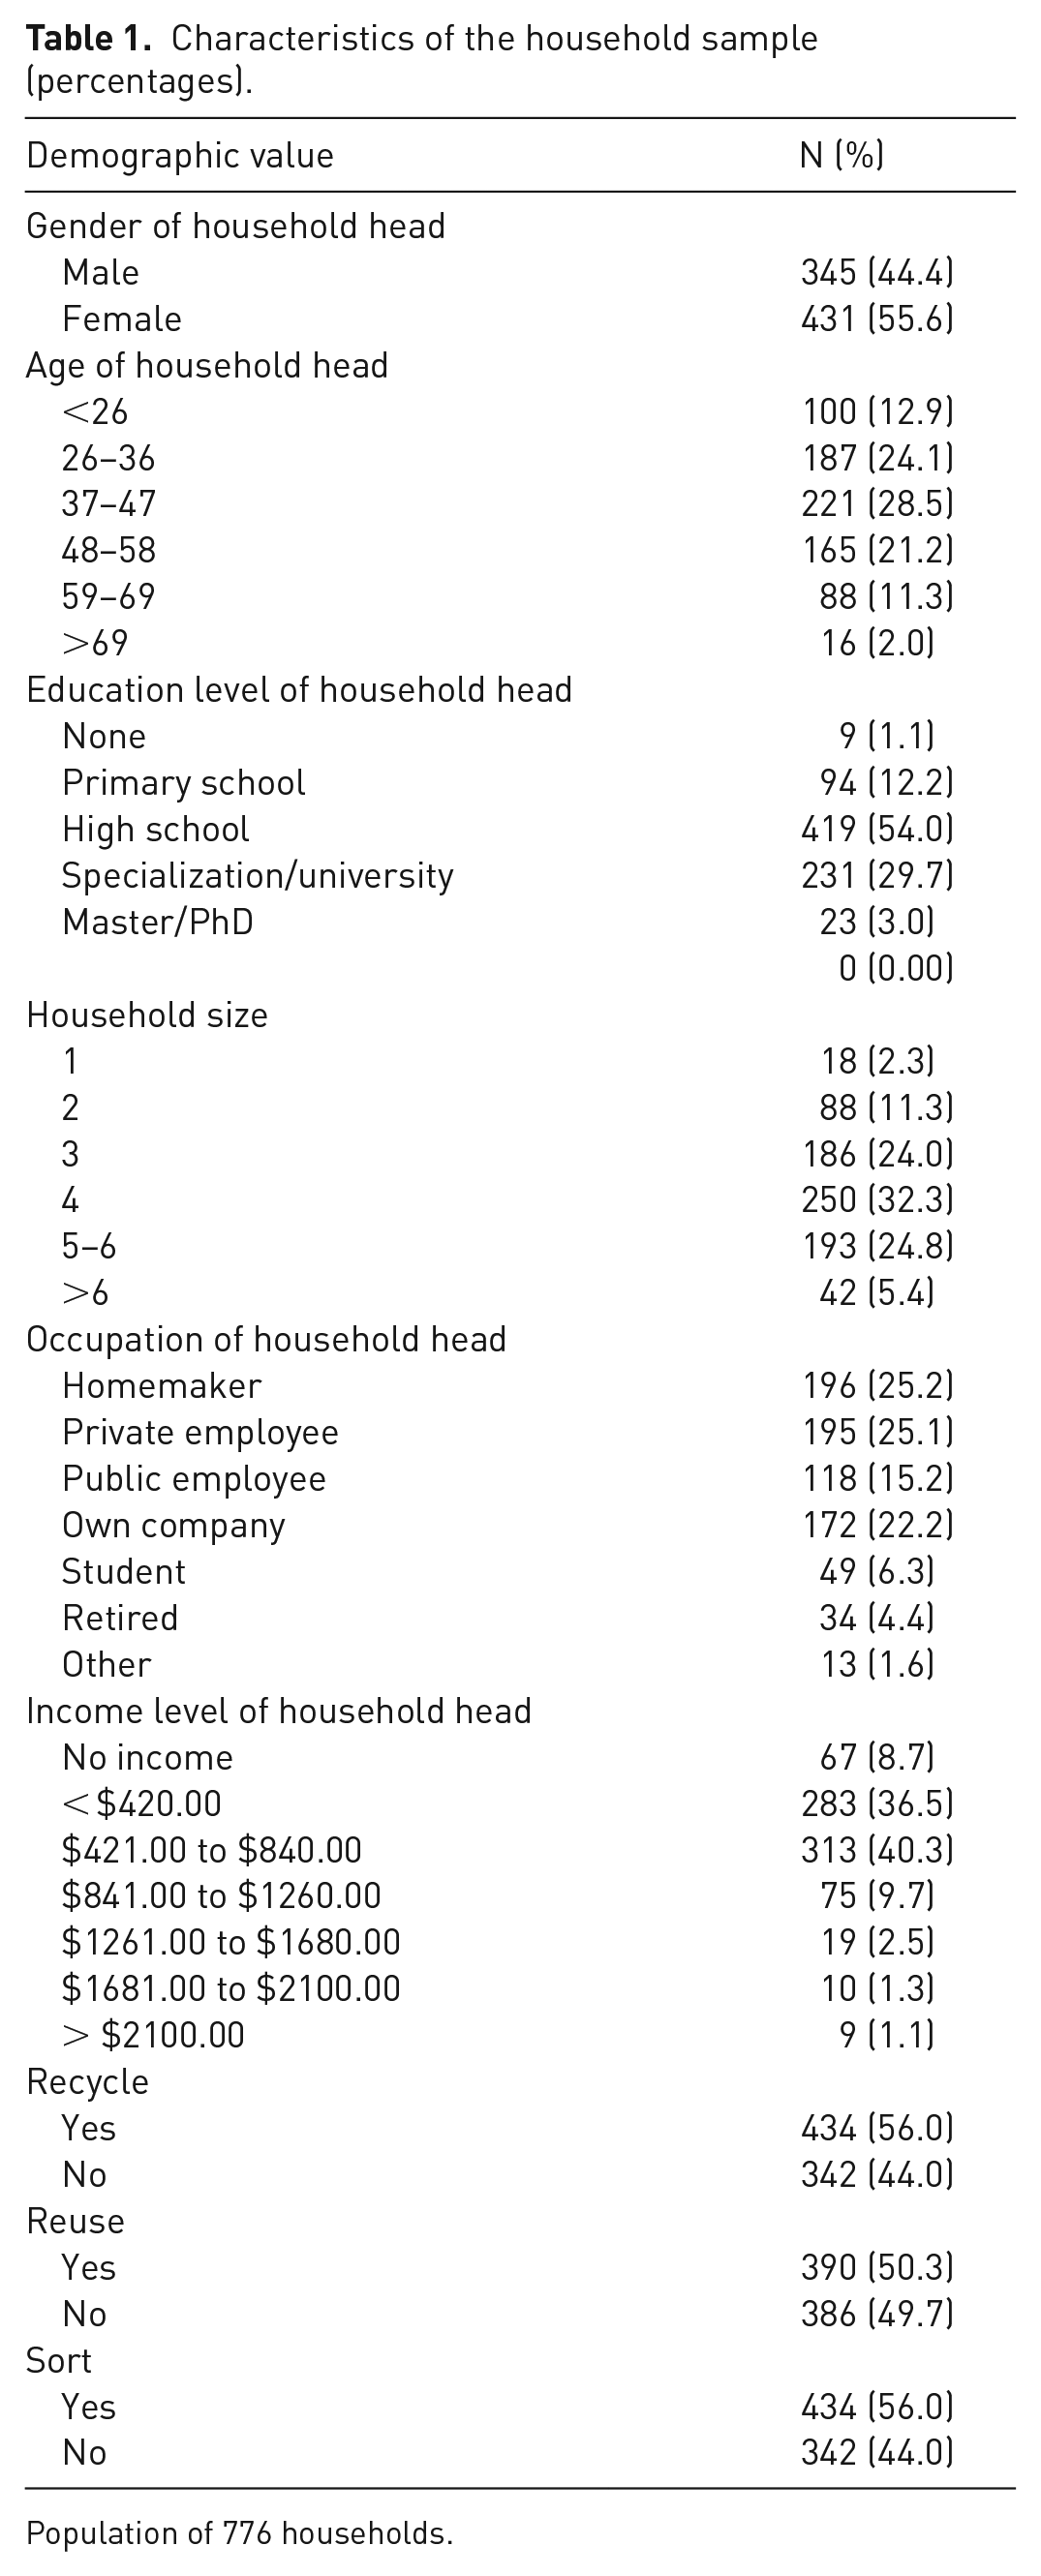
Population of 776 households.
Thirdly, all plastic waste was also sorted into seven types. The same procedure was followed for the plastic classification as the one made in 2021 and 2022 (Hidalgo-Crespo et al., 2021b, 2022). Firstly, they needed to look for the plastic identification code (to see in detail in Hidalgo-Crespo et al., 2022). If the code was not found, they needed to check for the typical characteristics and applications of each type of plastic waste, with one of the authors supervising the classification. If the supervisor could not identify the type of plastic, the residue would only be deposited in the OP bucket. Data from the spreadsheets were registered in Excel and ordered by household and week to quantify recyclable and plastic waste.
Survey and geo-location of waste
Between 28th February 2022 and 14th March 2022, a questionnaire was administered after the waste quantification process to the household heads of every participating family. The initial section of the questionnaire encompassed the personal characteristics of the respondents, including age, gender, educational level, income and occupation (to see in detail, refer to the Supplemental Appendix B). The subsequent segment focused on general household details such as size and prior knowledge about recycling. The questions were the same as the ones used in previous studies (Hidalgo-Crespo et al., 2022, 2023).
The survey was conducted via in-person interviews, where in each participating student was tasked with surveying the head of the household. The information was collected using the ArcGIS Survey123 platform, which allowed us to collect the precise GPS location of each home. To ensure traceability, the students’ and interviewees’ family names and name tag codes were requested as part of the information. Every interviewed individual signed an informed consent authorizing the use of the information for research purposes only and they were reassured of their anonymity in the use of the data.
Once all the families were surveyed, an Excel file was downloaded from the ArcGIS Survey123 platform and combined with the spreadsheet that had the waste sorted weights to have one Excel file containing first the X and Y GPS reference and the total grams per household per week produced of each general and plastic waste.
The Spatial Join tool was used to superimpose and associate all the family points with the layer of polygons of the GGA, resulting in different points per polygon. Due to the type of study and the information coming from the students’ homes and their surroundings, some neighbourhoods ended up with many points (e.g. La Florida, Guasmo and El Fortín, with 87, 60 and 41 points, respectively) and others with not so many (e.g. Urdesa, Urdaneta, Samborondón, Quinto Guayas, Los Ceibos, Monte Sinai, Vernaza Norte, Simón Bolivar, Garzota, Bellavista and 9 de Octubre with 1 point).
Spatial interpolation
By combining data processing with spatial statistics, values collected from measured sites can be used to forecast values across all locations. In ArcGIS, spatial interpolation methods are divided into two categories: deterministic and geostatistical techniques. Both approaches use the proximity of neighbouring sample locations to generate spatial interpolation.
As an early technique, Inverse Distance Weighting (IDW) has been applied to immediately show interpolated data as horizontal layers depicting the distribution of recyclable waste without completing prediction error assessments. IDW operates if each measurement point produces a local influence that decreases with distance. It assigns greater weight to points near the prediction location than those situated farther away, which encapsulates the concept of inverse distance weighting. The general formula for predicting concentration at location S0 is:

where, n signifies the count of measured sample concentrations, Z(Si) denotes the vicinity around the forecasting spot and λi represents the weight assigned to each measured concentration related to the home population. The calculation of these weights is based on the subsequent equations:
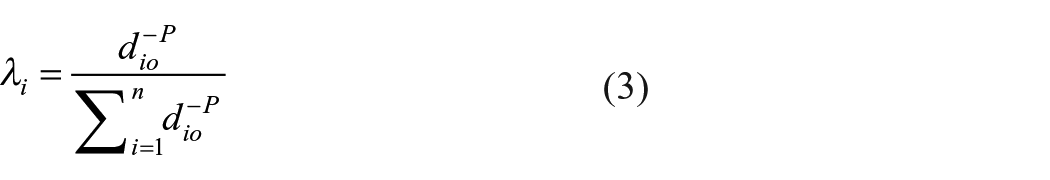

The parameter dio represents the distance between the prediction location S0 and the sampled location. The power parameter P governs the weighting of the sampled location. Identifying the optimal value for P involves minimizing the root mean square prediction error.
In this instance, the sampled population represented by points were positioned on the neighbourhood-divided map and subsequently categorized by polygon. Of the 91 polygons considered for the study area of GGA, we successfully collected data from 62 (68%) of them. Once all the GPS points were assigned their corresponding waste values (grams/household/week), interpolation was effectuated to produce maps that reached the total GGA. Subsequently, through the Zonal Statistics as Table tool, it determined the sum of all the pixels per neighbourhood and obtained the estimated weekly generation of mass of each type of waste in each polygon. Afterward, the total sum of every waste was divided by the total area to obtain the waste density indexes, and maps were created according to these indexes, showing by colours the neighbourhoods that produce the most and the least.
Results
Population characteristics
Table 1 illustrates the characteristics of the participating homes. Among the 776 household heads, 56% were female. Approximately 53% of the household heads were aged 26–47. Approximately 54% of household heads have a high school diploma or equivalent. Homes are mainly occupied by three to six individuals, with homes with four family members (32% of the assessed population) accounting for the majority. When discussing household heads’ occupations, homemakers and private employees represent 25% each, followed by people with their own business (22%) and public employment (15%). Some household heads are still students or retired, representing ~6% and 4%, respectively. The monthly income level of many household heads is between 421 and 840 USD, with 40%, followed by people who gain up to the minimum wage value of 420 USD (37%). Approximately 9% of the surveyed population does not have any income. This can be due to the fact that children return home after getting their own families and being sustained by their parents. However, this issue should be analysed in further research. Finally, over 50% of the population recycles, reuses and sorts their recyclable waste. These values align with the IRR (2015) results, which found that 47% of Guayaquil’s households classify their waste.
General and plastic waste generation
General waste generation
Table 2 illustrates the frequency, weekly generation and standard deviation of each waste type within the study area per household. The frequency represents the percentage of households that produced every type of waste during the 4 weeks of the study. Plastic was the most present recyclable household waste. In fact, out of the 776 households, all generated this type of waste (100%), followed by paper and cardboard, and fabric. The total weekly biodegradable and non-biodegradable waste generation per household was 3067 g, with plastics, paper and cardboard and glass representing most of the waste in mass with ~93%.
General waste generation for the sample (N = 776).

g/w/H: grams per week per household.
Plastic waste generation
Column 3 of Table 3 shows the frequency of occurrence for each sort of plastic waste per household, as well as the weekly average waste generation per household in grams for 2022. Additionally, Table 3 compares the values found for this research with those found by Hidalgo-Crespo et al. (2022, 2019, 2021a), considering an average of four inhabitants per household. In general terms, PET waste remained the highest, being present in almost 100% of the population, followed by PP and LDPE, with ~90% and 71%. Regarding mass, PET remains the most generated waste for 2022, followed by PP, HDPE and LDPE. From all seven types of plastic waste, it can be observed that five of them have increased when compared to last year, especially for PET waste, growing 42%. On the other hand, PVC waste decreased the most between 2021 and 2022, with a reduction of almost 83%, followed by OP waste at (−50%). Also, we can observe an increase in the total weekly plastic waste generation per household from 2019 to 2022. One possible reason is the increment in delivery services after the COVID-19 pandemic (Limuro and Tabata, 2023).
Plastic waste generation and evolution for the city.
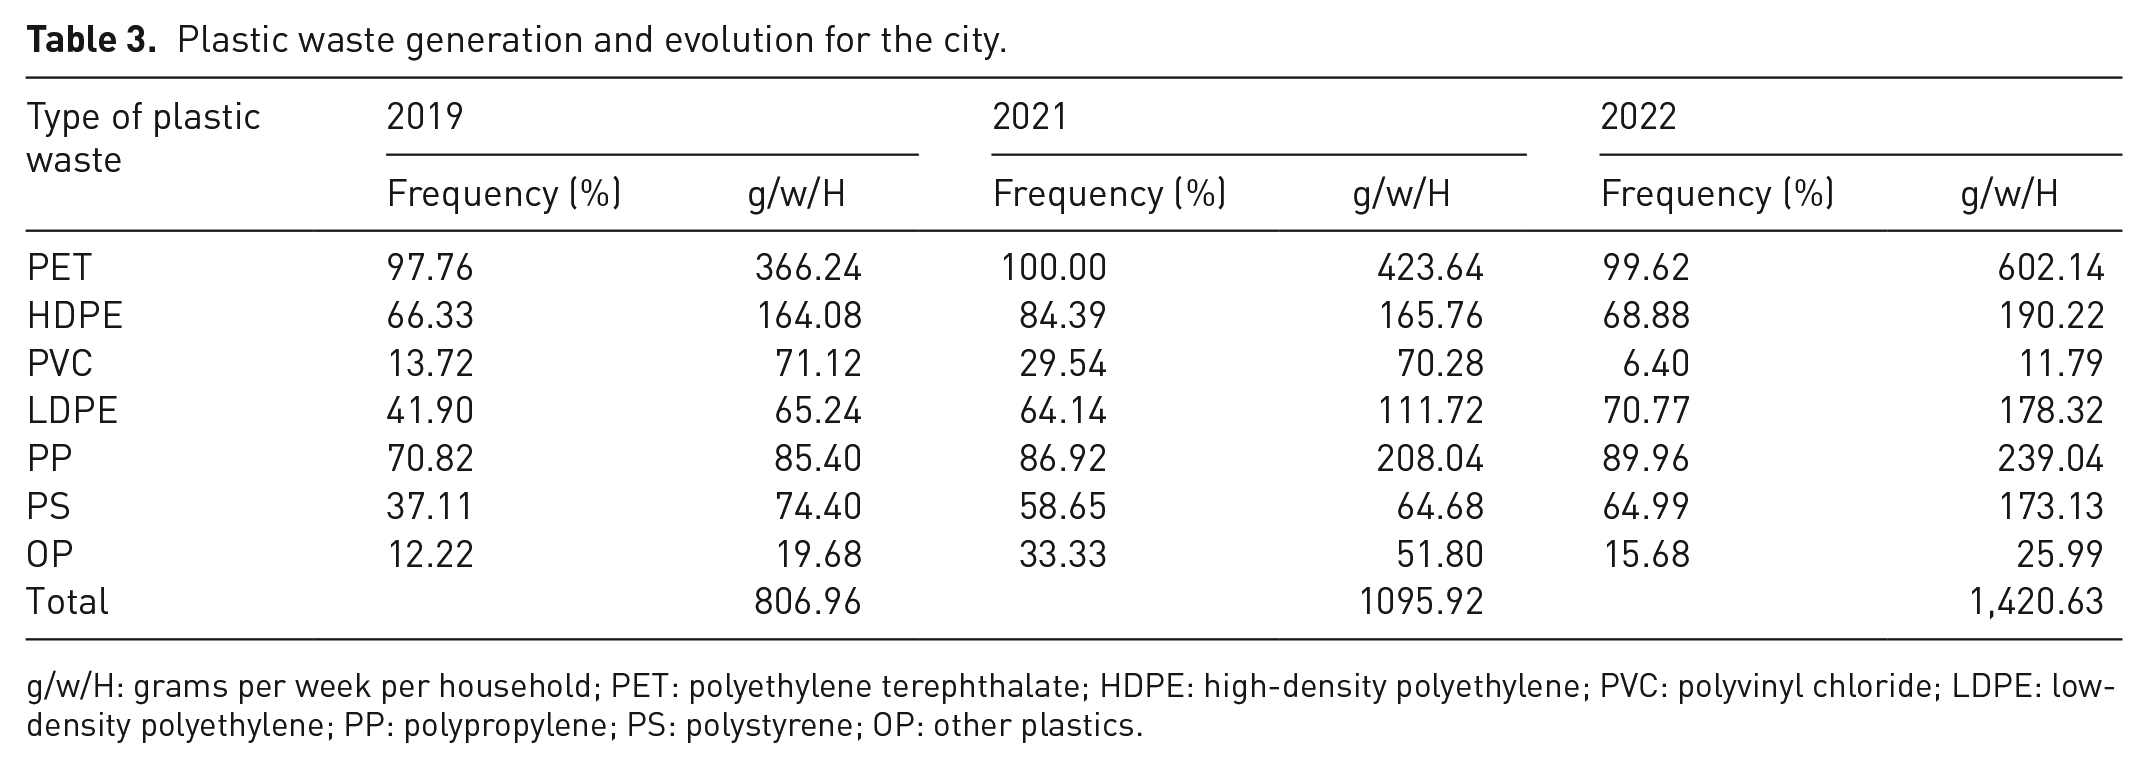
g/w/H: grams per week per household; PET: polyethylene terephthalate; HDPE: high-density polyethylene; PVC: polyvinyl chloride; LDPE: low-density polyethylene; PP: polypropylene; PS: polystyrene; OP: other plastics.
Waste density maps
Figures 4 and 5 show the general and plastic waste density indexes once the interpolation of the waste produced from the 776 points was extended to the borders of the whole study area, and then each pixel was summed per neighbourhood and divided by the area of said neighbourhood. The heat maps indicate the waste density produced from low (pale yellow) to high (ruby-red) levels. Table 4 shows the most generating neighbourhoods for each type of waste and their average production index. It can be observed that plastic is the most produced waste, followed by paper and cardboard. PET is the most generated type of plastic waste, followed by PP.
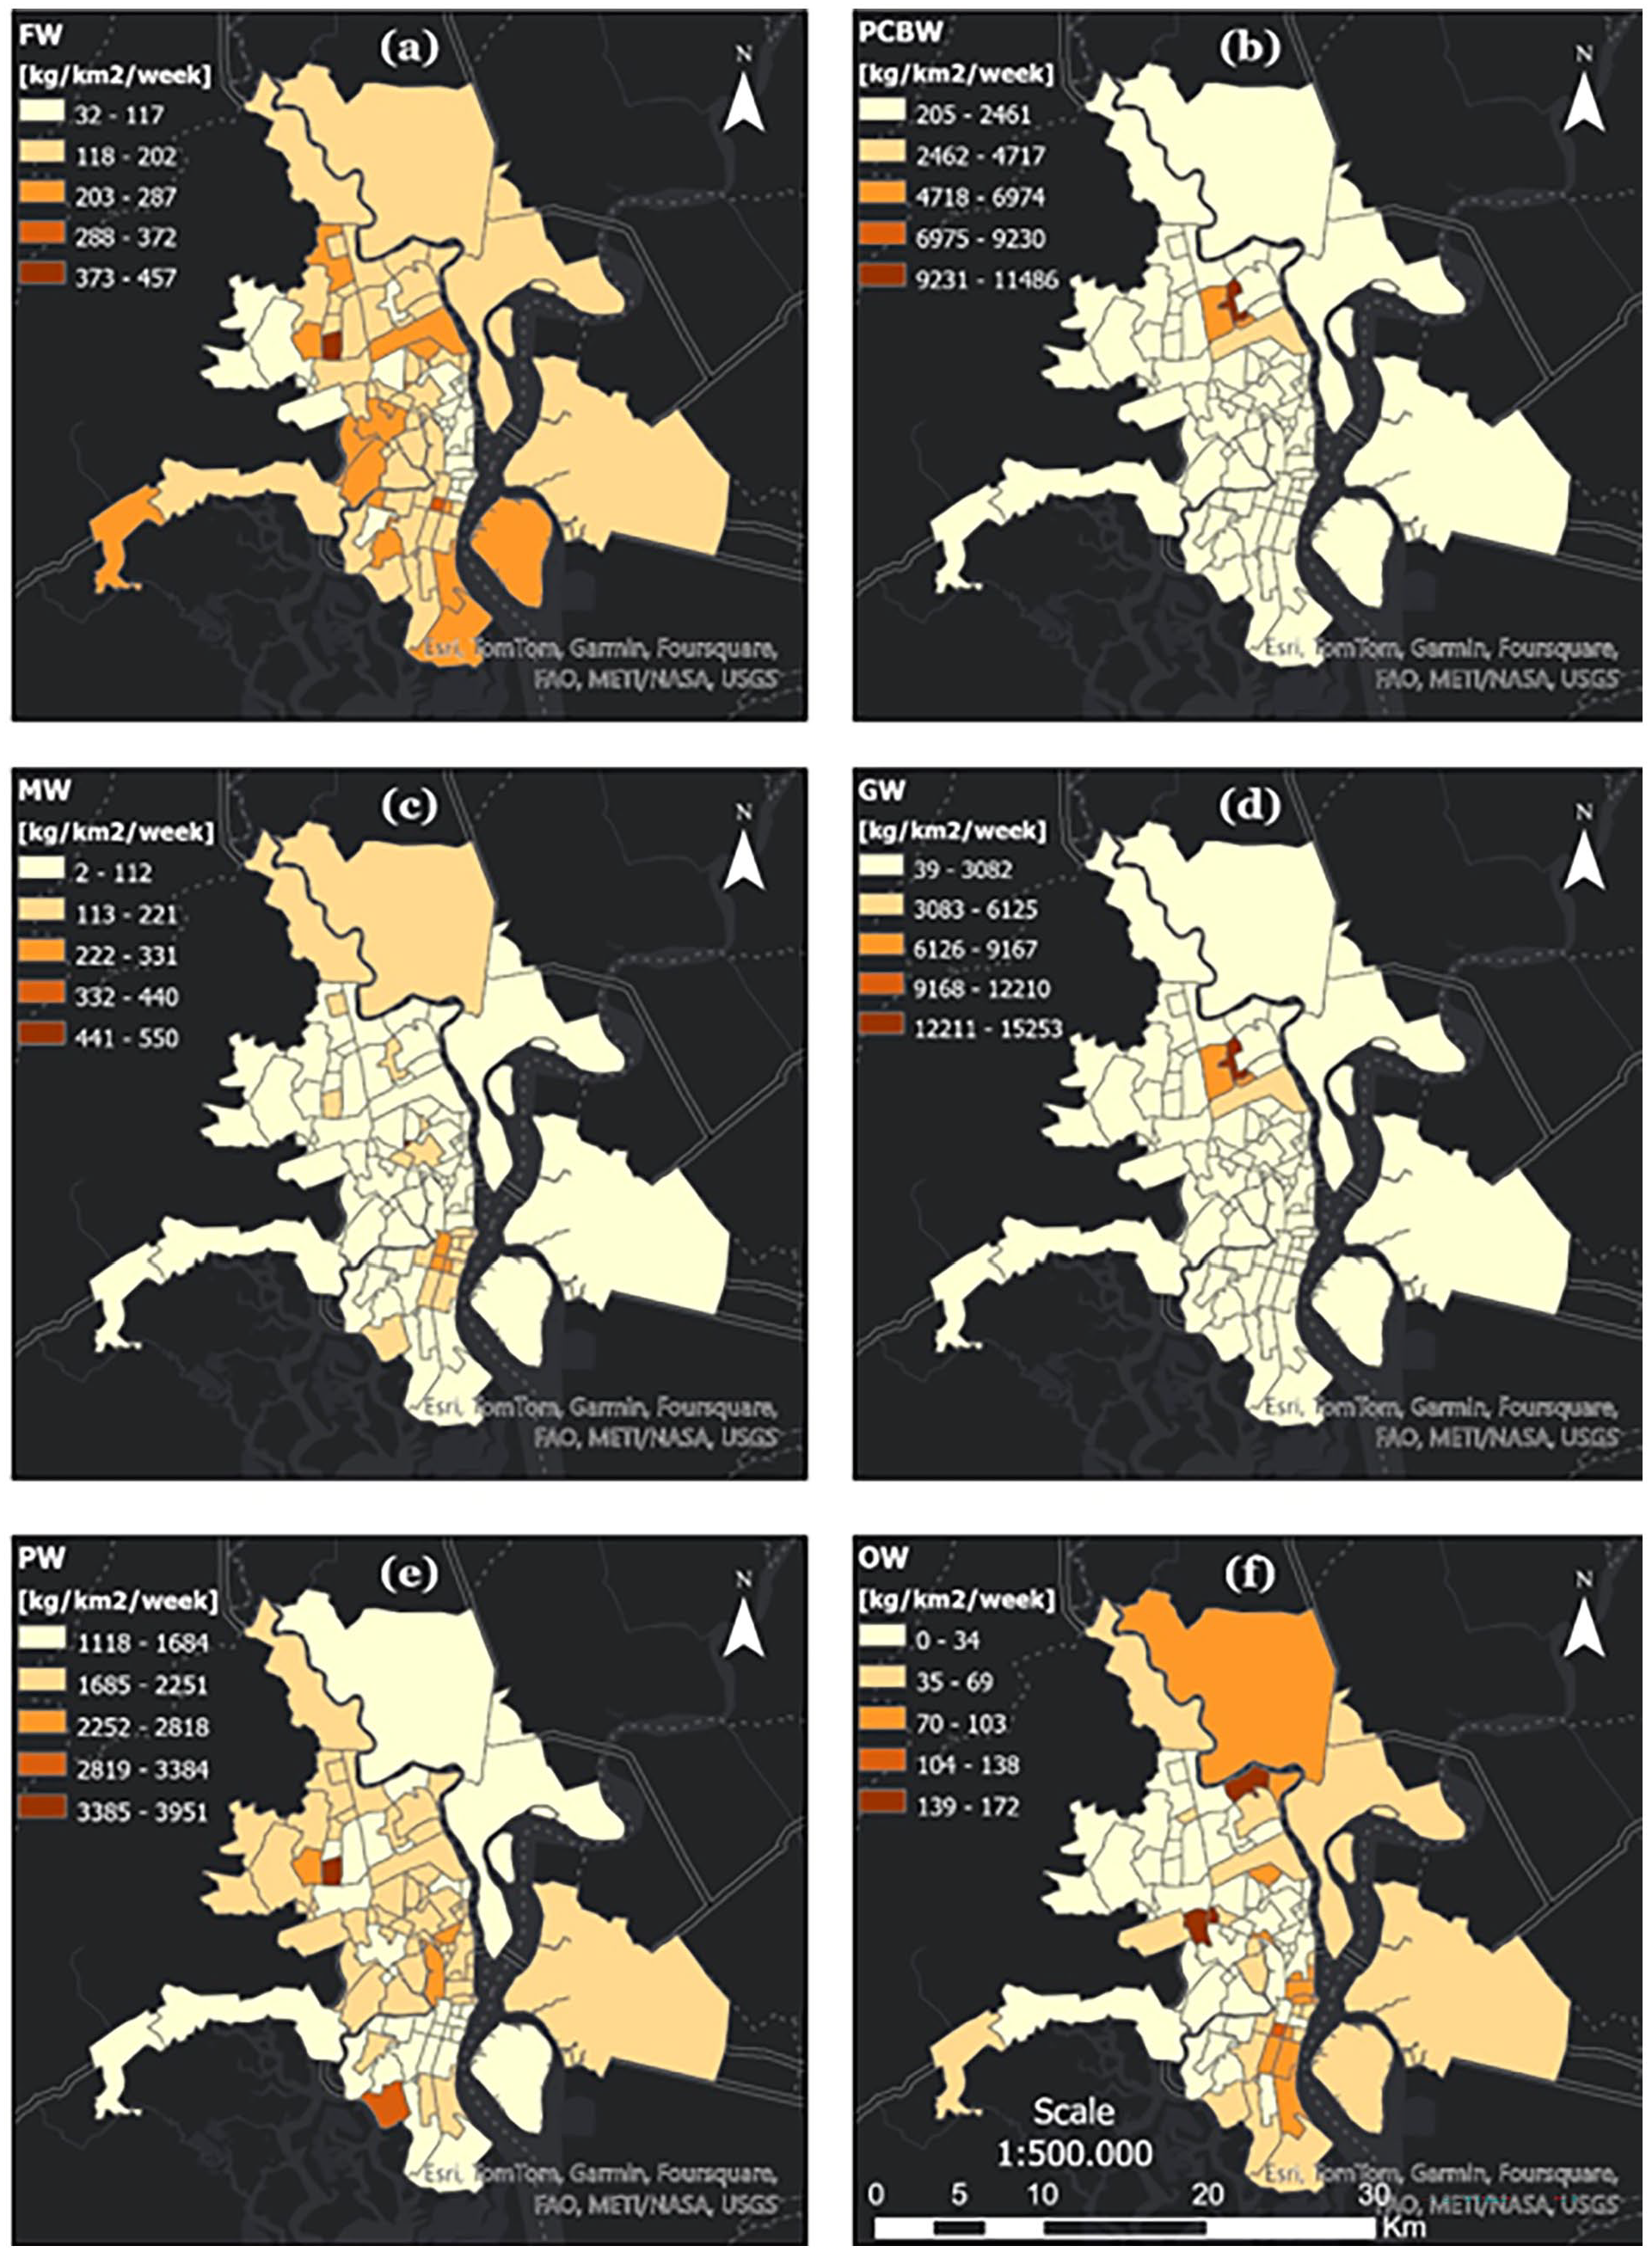
General waste density (kg/km2/week) : (a) FW – Fabric Waste, (b) PCBW – Paper and Cardboard Waste, (c) MW – Metal Waste, (d) GW – Glass Waste, (e) PW - Plastic Waste, OW – Other Waste.
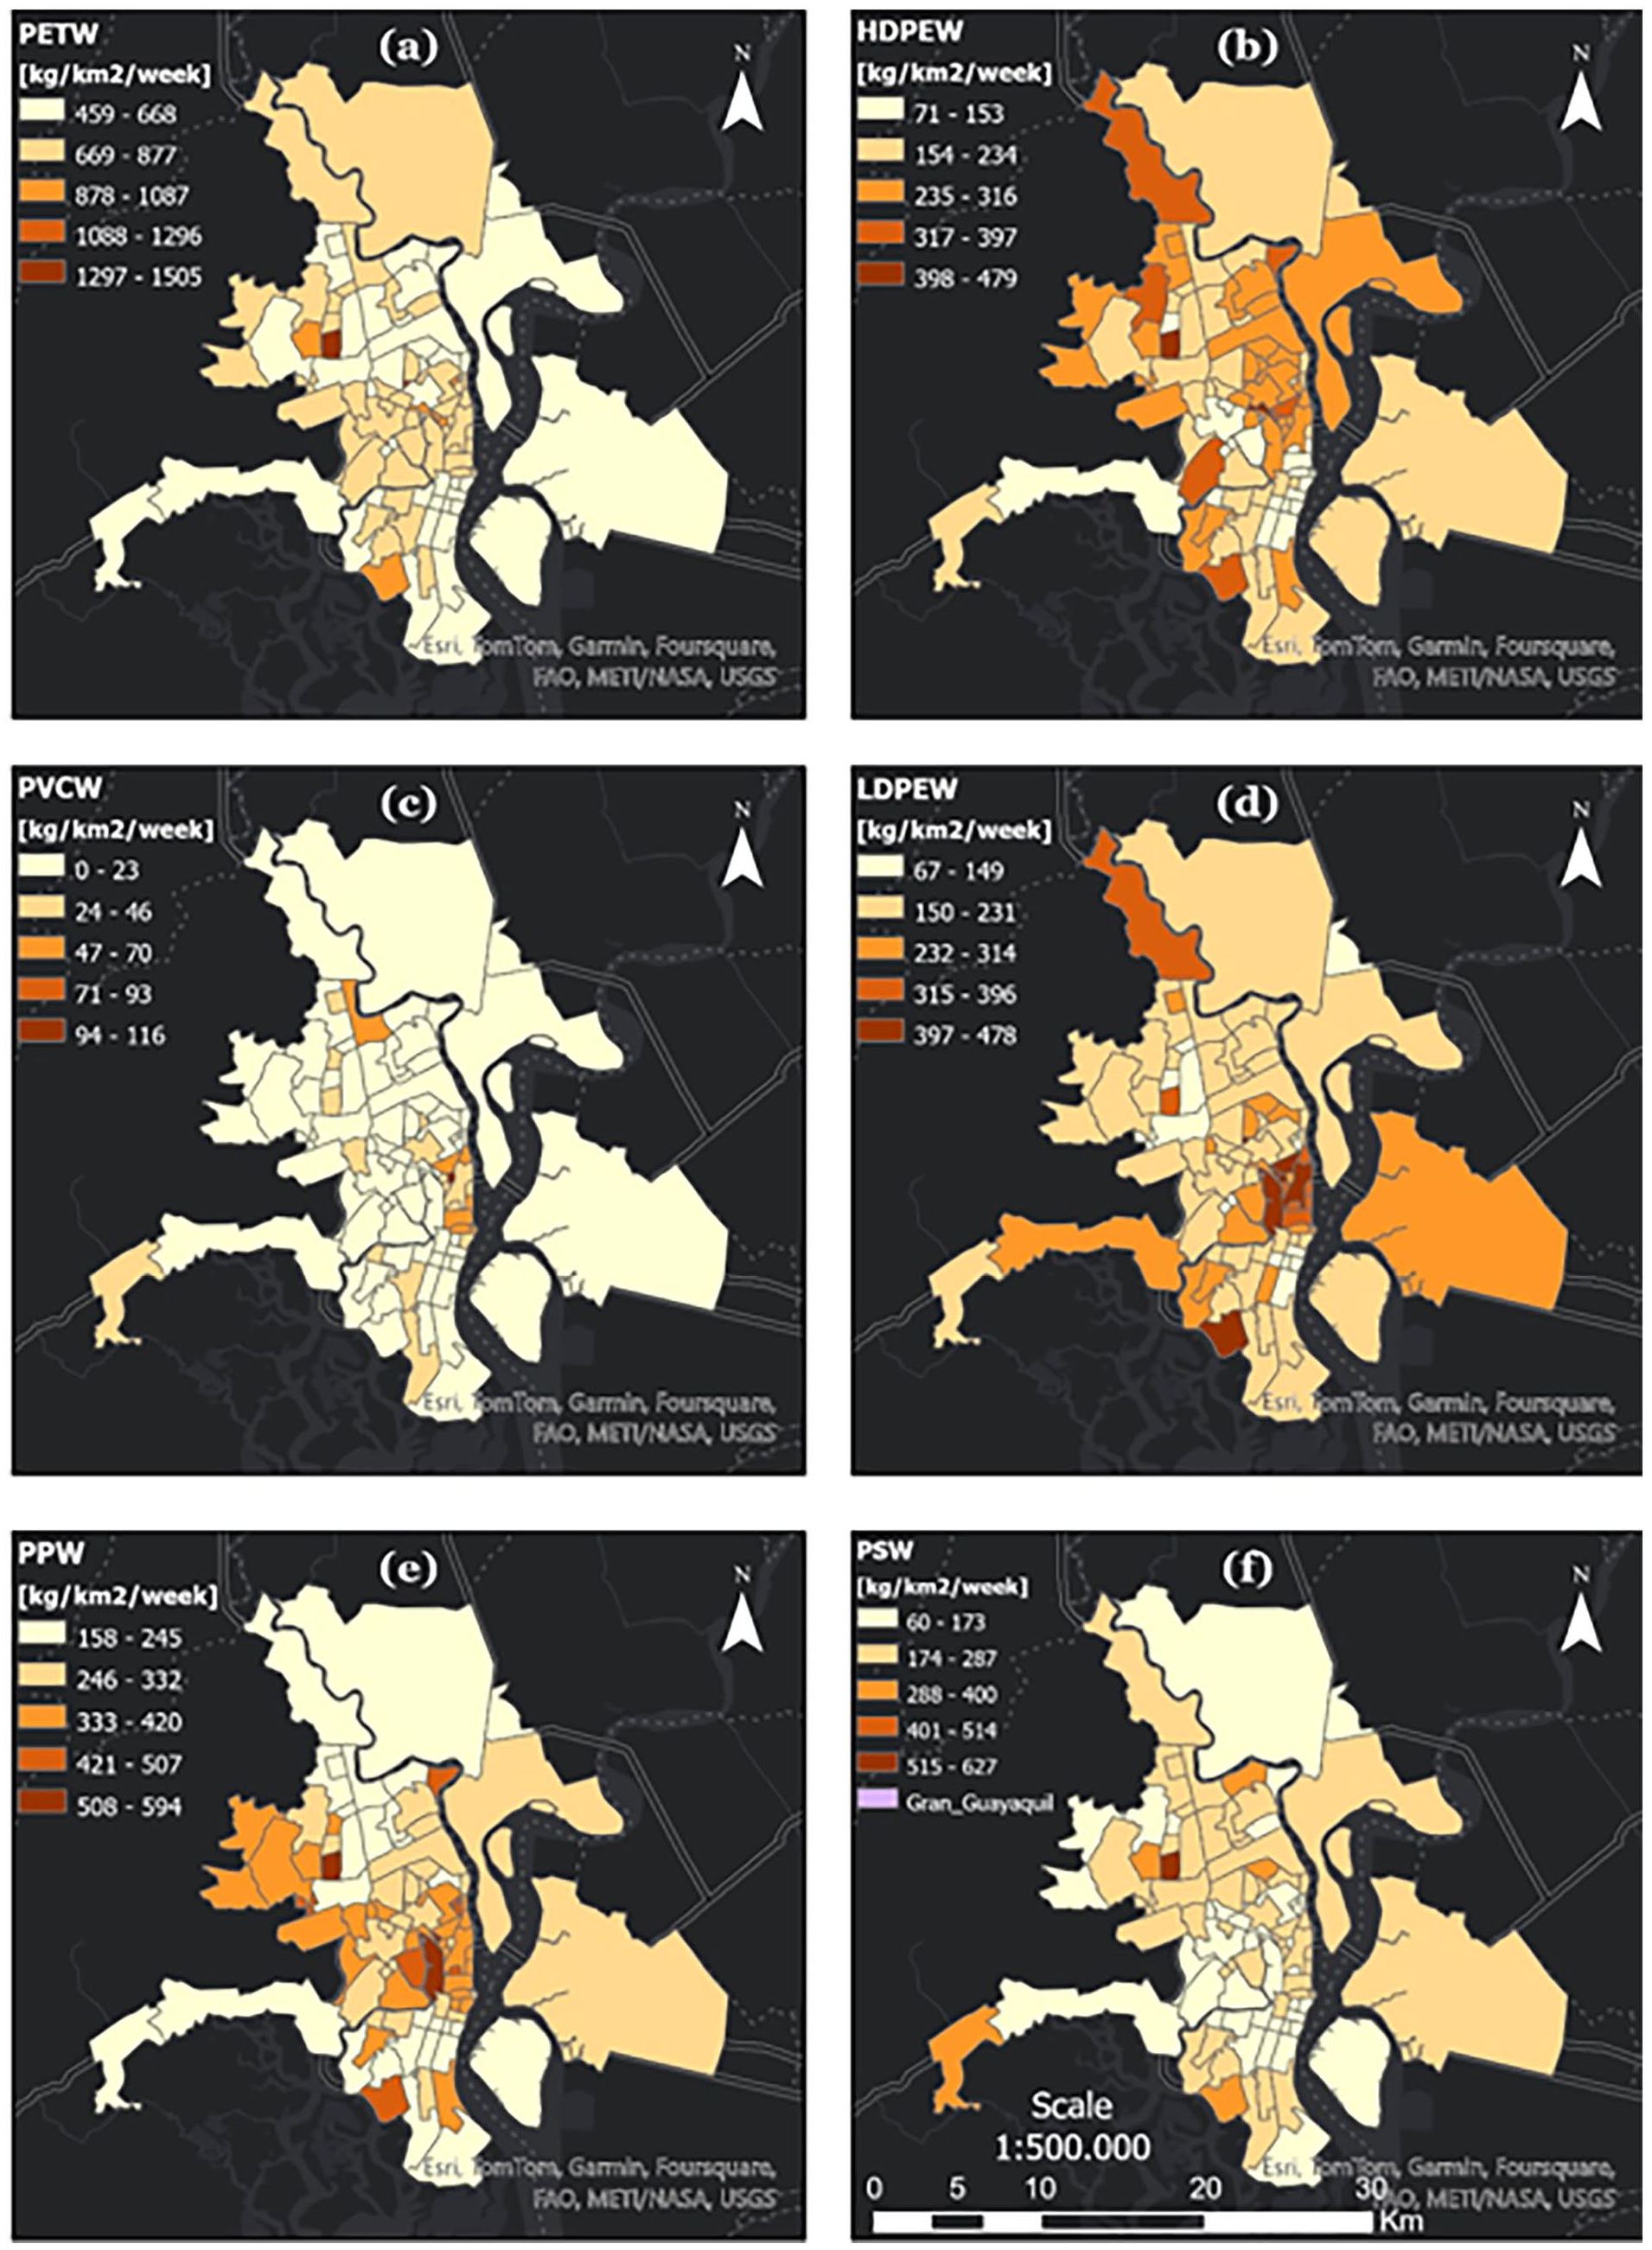
Plastic waste density (kg/km2/week) : (a) PETW – Polyethylene Terephthalate Waste, (b) HDPEW – High Density Polyethylene Waste, (c) PVCW – Polyvinyl Chloride Waste, (d) LDPEW - Low Density Polyethylene Waste, (e) PPW – Polypropylene Waste, (f) PSW – Polystyrene Waste.
General and plastic waste GIS generation.
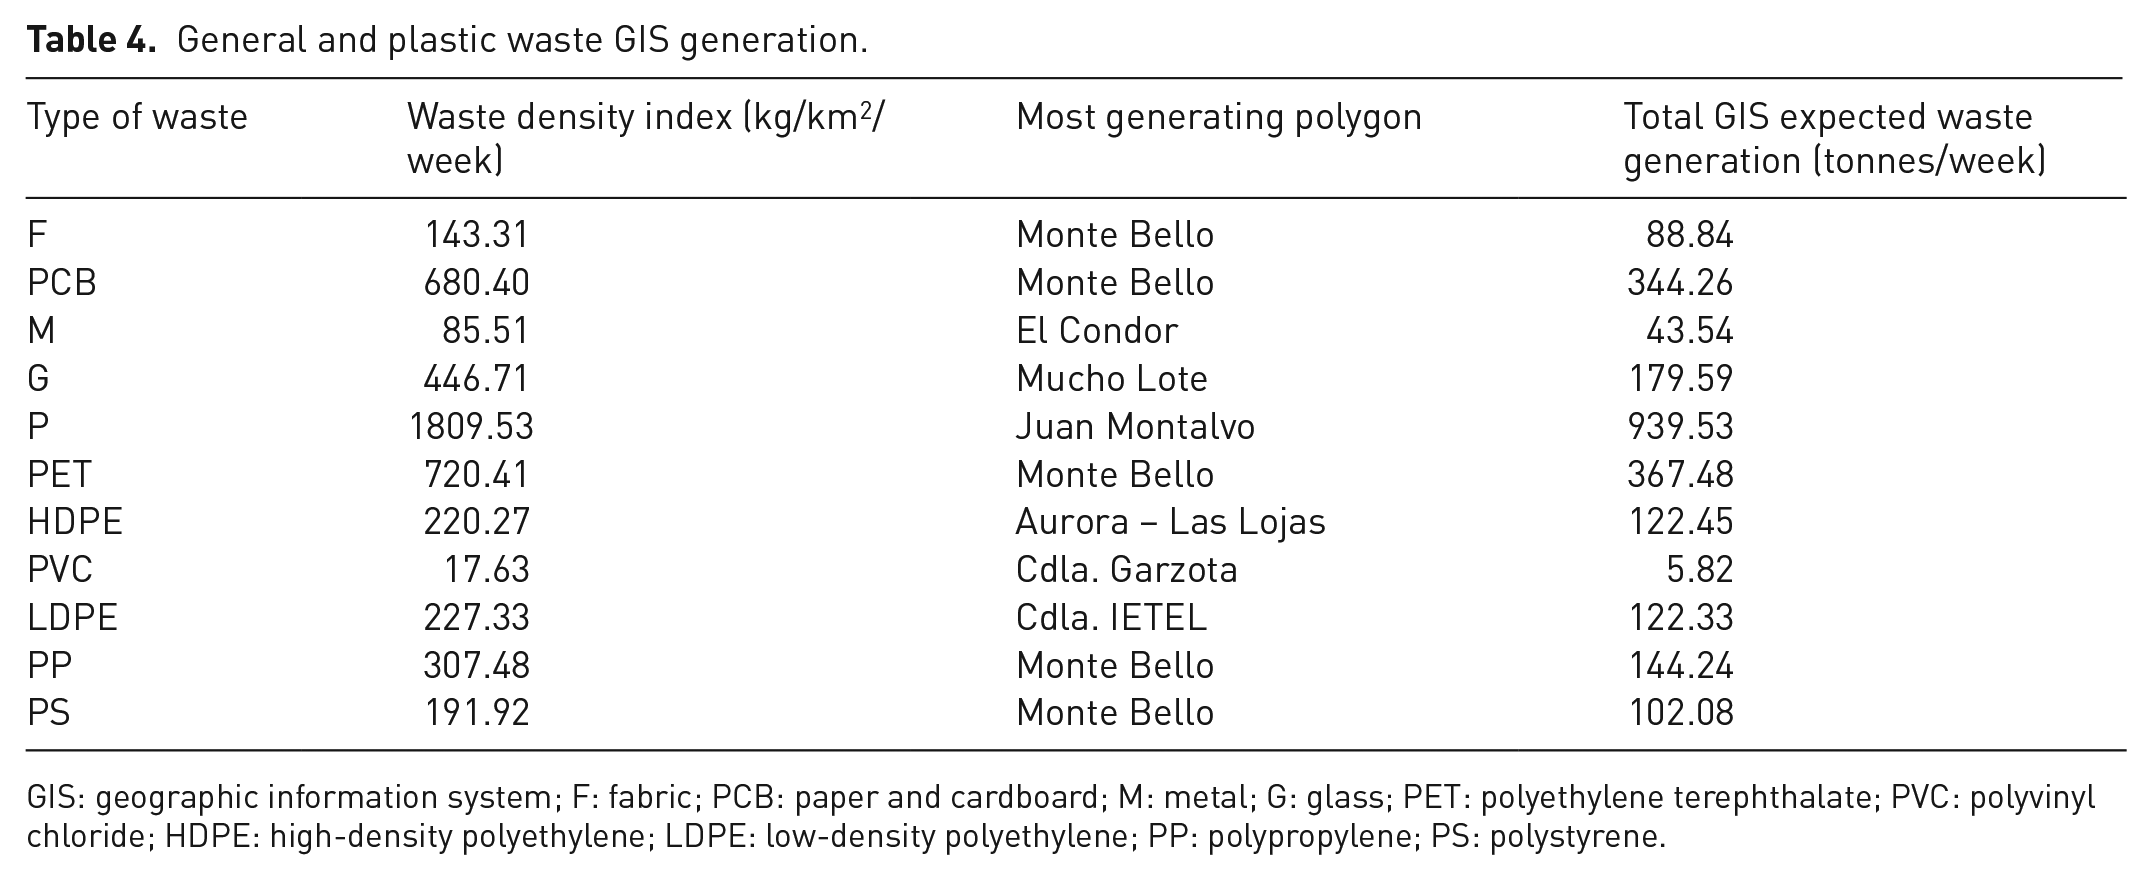
GIS: geographic information system; F: fabric; PCB: paper and cardboard; M: metal; G: glass; PET: polyethylene terephthalate; PVC: polyvinyl chloride; HDPE: high-density polyethylene; LDPE: low-density polyethylene; PP: polypropylene; PS: polystyrene.
Discussion
Daily in Ecuador, a considerable amount of MSW is deposited in local landfills without prior sorting. This deficiency in effective waste management combined with the gradual unavailability of available soil for new landfills poses a potential hazard of environmental pollution. In order to plan and design an integrated waste management system, accurate prediction of solid waste generation is imperative, not only in gross quantities, but also the special distribution of waste must be defined as well (Purcell and Magette, 2009). This specific knowledge makes possible to target different waste prevention strategies to the locations predicted to generate the most quantities per type of waste.
Theoretical implications
Few studies have investigated the spatial distribution of solid waste (Cheniti et al., 2020; Mahmood et al., 2018; Purcell and Magette, 2009), and those mainly rely on governmental databases rather than in situ data collection. The novel aspect of the present research is its integration of in-situ household waste generation data with ArcGIS software to predict the spatial distribution of recyclable waste within a specific study area. A straightforward GIS model was employed to establish generation patterns for each type of household recyclable waste.
This kind of study, which integrates field research, GIS and data evaluation, is highly recommended for other developing regions encountering similar challenges, such as LATAM (Yao et al., 2023). It offers valuable insights to local urban planners and administrators for devising effective waste management systems. Given that logistics can frequently be a substantial impediment to recycling initiatives, GIS is critical for obtaining and evaluating location-based data into the distribution and value of recyclable resources and associated collection systems (Lovrak et al., 2020). Using a GIS tool is the best technique for creating optimal and efficient preliminary designs for transportation routes, as long as the necessary input data is available (Lepetiuk et al., 2023).
The predicted spatial patterns of household recyclable waste distribution, based on generation rates from this research, appeared to confirm the hypothesis about the importance of socio-demographic factors in the generation of recyclable waste (Purcell and Magette, 2009). The more densely populated areas, together with the lowest income areas and the regions of higher commercial activity were found to produce larger quantities of recyclable waste (Ferronato and Torretta, 2019).
Such is the case of fabric and paper and cardboard waste index in Montebello polygon. This area is commonly characterized for having low to middle-low social stratified families. Zones that are known to have a very high commercial activity like El Condor, Mucho Lote and Juan Montalvo and middle to high social status households generated larger quantities of metal, glass and plastic waste. This is in line with previous research that indicate that higher income regions normally have more power to acquire these types of canned and bottled products while lower income regions normally produce more food waste (Monteiro et al., 2017).
Furthermore, recycling and reuse should be promoted through the activity of IWPs and included into the solid waste management system with adequate acknowledgement. They offer a free-of-charge service collecting the recyclable waste from the corners, reducing the costs for the local municipalities. IWPs contribute to the city’s waste collection system uniquely, influencing the environment by lowering GHG emissions by reducing the amount of waste discarded at dumpsites and transportation expenses (Colombijn and Morbidini, 2017; Ghisolfi et al., 2017; Hidalgo-Crespo et al., 2023).
However, household and commercial waste is typically not source-separated in Grand Guayaquil (only 56% of the population reported previously sorting their waste), meaning recyclable materials are often mixed with organic waste and other contaminants. Fine sorting strategies at source require collecting, transporting and the separate treatment of a high number of waste streams, so the development of management procedures and treatment technology will be an essential complement. If these or coordination between the different departments was lacking, the sorted waste was artificially mixed during the transfer process, ruining the advantages of separation at source and exerting a negative impact on citizen participation (Zhang et al., 2022). For this reason, the simplest model of separation at origin is proposed, implying that citizens should previously sort their waste and leave the bags separated, one for food waste and another for all the recyclables: paper and cardboard, metals, glass and plastics.
Practical implications
For the city of Guayaquil, the ‘Las Iguanas’ landfill began operations in 2005 and is expected to last 25 years, or until 2030. According to Plan (2020), Guayaquil creates 3395 tonnes of waste daily (23,765 tonnes weekly), which is delivered to the ‘Las Iguanas’ landfill. According to the current analysis, the area of Guayaquil from the GGA generates roughly 1566 tonnes of household recyclable waste every week. Hidalgo-Crespo et al. (2023) reported that there are 4000 IWPs in Guayaquil, and they estimated that they collected 12.17 kg of the identical waste kinds used in this study each day. This translates into a weekly collection of around 341 tonnes (22% of total generation), implying that the landfill gets 1225 tonnes of domestic recyclable waste (about 5% of total waste received weekly).
The total recycling of these wastes can signify big gains to the city’s municipality. By diverting waste from landfills, the volume of waste is decreased, thereby increasing the lifespan of the landfill and reducing the costs to the city due to the handling and burying of the waste. Considering 52 weeks per year, a total of 63,700 tonnes of waste can be diverted from the landfill (1225 × 52), and according to Hidalgo-Crespo et al. (2023), the cost of handling 1 tonne of waste is 50 USD, meaning that the correct handling of these wastes can represent savings up to 3.19 million USD per year, and increase the life of the landfill by almost 3 weeks more per year.
In addition, the valorization of these wastes due to the recycling business can represent high income for metropolitan areas. Following the research of Hidalgo-Crespo et al. (2023), the price paid per kilogram of recyclable waste by L1 aggregators (waste transfer stations) can represent a potential income of 946,000 USD per week for the city. In addition, if we consider that the total population of the city is 2.7 million (INEC, 2022) and that every family in the city is composed of four members (Hidalgo-Crespo et al., 2021b), we have a total waste generation of 1566 tonnes per week, every household produces an average of 2.32 kg per week of recyclable wastes, and the possible daily income of selling these wastes for each family would be of 1.39 USD (507 USD for a year). However, this would leave 4000 IWPs unemployed, representing almost 175 USD per month (Hidalgo-Crespo et al., 2023).
Limitations and future research
The limitations of this work are twofold. First there is a lack of non-recyclable waste analysed. This was due to the lack of financing options to get an open space outside of the boundaries of the university to deal with the dangers and problems that food and hygienic waste can generate. Second even though the research has a big sample size, we depended on the locations available by the students’ neighbours and families and some polygons ended up with many points and others with none at all.
In future initiatives, it is critical to widen the area of study to include nondomiciliary recyclable waste collection, with an emphasis on waste created at commercial centres, restaurants and public bins. A detailed characterization study of this waste will provide critical information for developing targeted ways to manage it successfully. Gaining insight into the content and volume of nondomiciliary waste is critical for developing personalized recyclable waste management strategies that address each province’s specific issues and requirements. Addressing this component of waste generation allows policymakers and waste management authorities to develop tailored solutions that minimize waste generation, increase recycling rates and promote sustainable behaviours. Furthermore, combining efforts to manage both residential and non-residential waste will make a substantial contribution to making the city cleaner and more environmentally sustainable.
Conclusions
The study conducted in the Grand Guayaquil area aimed to assess households’ waste generation and management practices. Valuable insights were gained through a comprehensive analysis of demographic data, waste generation characteristics and predicted waste generation to inform waste management strategies in the region.
Firstly, the results revealed that plastic waste was the most prevalent recyclable waste, followed by paper and cardboard, and fabric. PET waste was the most common type of plastic waste, with HDPE waste increasing significantly between 2019 and 2022. Second, detailed analyses were conducted on population characteristics and waste generation trends. The study discovered that around 55% of household heads were female, with the majority aged between 26 and 47. The majority of the questioned population had at least a high school diploma, and household sizes typically ranged from three to six persons.
Homemakers and private employees made up the largest occupational groups. The study also found that more than half of the population recycles, reuses and sorts recyclable waste. The average and density heat maps provided important representations of waste creation trends throughout the research area. By interpolating the data, the study anticipated total waste generation and identified neighbourhoods that generated the most.
Finally, this study sheds light on the waste generation characteristics of household in Grand Guayaquil. The data can be used to develop targeted waste management strategies aimed at encouraging recycling and improving regional waste disposal practices. To accomplish successful waste management, it is critical to evaluate the various demographic factors and adjust activities accordingly. The findings of this study can help policymakers, environmental agencies and local communities make educated decisions about waste management concerns and work towards a cleaner, more sustainable environment for the future.
Supplemental Material
sj-pdf-1-wmr-10.1177_0734242X241262714 – Supplemental material for Improving urban waste management: A comprehensive study on household waste generation and spatial patterns in the Grand Guayaquil Metropolitan Area
Supplemental material, sj-pdf-1-wmr-10.1177_0734242X241262714 for Improving urban waste management: A comprehensive study on household waste generation and spatial patterns in the Grand Guayaquil Metropolitan Area by Jose Armando Hidalgo-Crespo, Andrés Velastegui-Montoya, Manuel Soto, Jorge Luis Amaya Rivas, Peggy Zwolinski, Andreas Riel and Pasiano Rivas-García in Waste Management & Research
Supplemental Material
sj-pdf-2-wmr-10.1177_0734242X241262714 – Supplemental material for Improving urban waste management: A comprehensive study on household waste generation and spatial patterns in the Grand Guayaquil Metropolitan Area
Supplemental material, sj-pdf-2-wmr-10.1177_0734242X241262714 for Improving urban waste management: A comprehensive study on household waste generation and spatial patterns in the Grand Guayaquil Metropolitan Area by Jose Armando Hidalgo-Crespo, Andrés Velastegui-Montoya, Manuel Soto, Jorge Luis Amaya Rivas, Peggy Zwolinski, Andreas Riel and Pasiano Rivas-García in Waste Management & Research
Footnotes
Declaration of conflicting interests
The authors declared no potential conflicts of interest with respect to the research, authorship, and/or publication of this article.
Funding
The authors received no financial support for the research, authorship, and/or publication of this article.
Supplemental material
Supplemental material for this article is available online.
References
Supplementary Material
Please find the following supplemental material available below.
For Open Access articles published under a Creative Commons License, all supplemental material carries the same license as the article it is associated with.
For non-Open Access articles published, all supplemental material carries a non-exclusive license, and permission requests for re-use of supplemental material or any part of supplemental material shall be sent directly to the copyright owner as specified in the copyright notice associated with the article.