
Abstract
A large amount of agricultural waste is produced annually. Producing biochar is an excellent solution for waste management, resource recovery, emission reduction, energy production, reduction in transportation and enhancing carbon sequestration. This study was done to investigate the aeration status of biochar-based growth media as compared with the commercial soilless medium of cocopeat-perlite. Biochars from oven-dried residues were produced by slow pyrolysis at 300 (B300) and 500°C (B500) with a rate of 2°C min−1 and using a continuous inflow of nitrogen. Sawdust (Sd), wheat straw (WS), rice hull (Rh), palm bunches (Plm) and sugarcane bagasse (SC), their biochars, vermiculite (V) and zeolite (Z) were used to prepare 13 mixed growth media. Oxygen diffusion coefficient (Dp) of media was measured at six matric potentials (h) of −5, −10, −15, −20, −40 and −60 hPa. Troeh et al. (1982) model was fitted to Dp/D0 versus air-filled porosity (AFP) data. Although AFP was more than 0.1 m3 m−3 for some media, the Dp/D0 was very low. Considering optimum Dp/D0 (i.e. 0.010–0.015) for growth substrates at h = −8 hPa, aeration status of four media (cocopeat-perlite, Rh-SCB300-Z, Sd-SCB300-Z and WSB500-Rh-V) was optimum. Highest Dp/D0 at h = −8 hPa was observed for Rh-SCB300-Z. The AFP at h = –10 hPa was highest for Rh-SCB300-Z, cocopeat-perlite and WSB500-Rh-V. Biochar-based media with good aeration status and water retention can be a suitable substitute for commercial soilless culture in greenhouse production. Overall, WSB500-Rh-V is a suitable substitute for cocopeat-perlite.
Introduction
Greenhouse soilless culture is given much attention because of its high water use efficiency and proper water and nutrient management in crop production (Mendez-Cifuentes et al., 2020). It is also essential regarding climate change and water scarcity, especially in arid and semiarid regions (Martinez-Mate et al., 2018). A plant growth medium used in soilless culture has four main functions: (1) mechanical support of the plant roots, (2) providing water and oxygen for root growth, (3) water storage in small capillary pores and (4) transferring mineral nutrients towards plant roots (Grunert et al., 2016; Jacobs et al., 2009). Container capacity, air capacity and nutrient storage capacity are among the most important indices for describing growth media’s physical and chemical conditions (Schmitz et al., 2013). Raviv et al. (2019) indicated that oxygen deficiency might be a common limiting factor for plant root growth in the limited volume of soilless media.
Soilless growth media usually contain several organic and inorganic components. Biochar, produced by slow pyrolysis of organic materials, may be used as an appropriate additive or a replacement for plant growth media (Banitalebi et al., 2019, 2021). The biochar manufacturing industry aims to produce high-quality C-rich materials for agricultural and horticultural purposes at reasonable price (Fornes et al., 2015). Biochar has many valuable applications for environmental issues, such as climate change mitigation and reduced nutrient leaching (Campion et al., 2023). Many studies have evaluated the feasibility of using biochar in soilless growing media to replace environmentally unfriendly substrates such as peat, vermiculite and perlite (Guo et al., 2018; Kaudal et al., 2016). Incorporating biochar could significantly improve the physical properties, including the aeration status of growth media (Huang and Gu, 2019). The effect of biochar depends on the feedstock and its production conditions, application rate and other substrates used in the growth medium (Tan et al., 2018). Sarauer and Coleman (2018) reported that incorporating biochar with peat increases air space, water holding capacity and total porosity. Generally, biochar has low oxygen demand for decomposition. It is a suitable property for growth media because it reveals that biochar is poorly degradable, decreasing the need for additional nitrogen sources and lowering the rooting medium’s shrinkage risks because of low microbial degradation of biochar (Blok et al., 2017).
Water and oxygen supply affects plant growth in closed hydroponic systems with limited space of root zone and low buffering capacity (Blok et al., 2017). In these systems, the water and air contents change noticeably with time, primarily due to the irrigation events, narrow pore size distribution, rapid release of water (as quantified by the high slope of water retention curve, WRC) and restricted growth medium volume, and could rapidly lead to stressful conditions (Anlauf and Rehrmann, 2013; Naasz et al., 2005). The hydroponic system type and the physical properties of the substrates generally control available oxygen. Furthermore, the substrate properties may change upon plant growth, mainly due to the decomposition of organic substrates and boosting root mass (Mohammadi-Ghehsareh, 2015; Wever and van Leeuwen, 1995).
A good growing medium is expected to have optimal physical properties, including low bulk density (BD), high water holding capacity (WHC), desirable particle size and high air-filled porosity (AFP) (Kaudal et al., 2016; Patil et al., 2020). High total porosity (TP) and low BD are required to create an appropriate rhizosphere environment in the limited containerised plants than field-grown plants because of restricted liquid-vapour interfacial boundaries in spatially constrained volumes (Deepagoda et al., 2013b). The supply and storage of air and water in growth media are also affected by pore size distribution, pore continuity and tortuosity, air space, container height and media settlement (Allaire et al., 1996; Argo, 1998). Plants grow rapidly and have a high oxygen demand in growth media; therefore, greenhouse producers need a growth medium with good aeration status (Jacobs et al., 2009). The aeration status and oxygen concentration in the growth media can vary due to different oxygen consumption levels and diffusion rates of atmospheric oxygen into the substrates. An ideal growth medium must have AFP in the range of 0.10–0.45 m3 m–3 depending on plant type, container size and substrate (Raviv et al., 1999). Allaire et al. (1996) showed that media with low AFP mainly resulted in suppressed plant growth.
Plant growth is related to pore size distribution describing air and water storage (aeration and water retention) of growth media (Agarwal et al., 2023). The AFP is an important index for characterising oxygen availability in the growth media. However, this index does not contain information about the gas exchange within the root surrounding atmosphere (Schmitz et al., 2013). Indeed, the gas exchange rate is superior to gas storage characteristics like AFP to quantify the aeration status of growth media (Allaire et al., 1996; Caron et al., 2005). Gas transport in growing media is mainly diffusion-dependent. Gaseous exchanges are controlled by AFP, pore space, pore continuity and tortuosity, gas diffusivity and gas concentration gradient between the atmosphere and the rhizosphere. The gas exchange is mainly determined by the size and shape of air-filled continuous pores (Raviv et al., 2019).
The gas diffusion coefficient, Dp (m2 s−1), is the key parameter controlling the diffusion of gases within soilless substrates. The aeration status of growth media for plants is better represented by relative coefficient or gas diffusivity (Dp/D0), as scaled to its value in the free air (D0), than AFP (Allaire et al., 1996; Deepagoda et al., 2013). Gas exchange takes place in the macropores of the growth media. Particle and pore size distributions mainly affect the air and water relations (e.g. air:water ratio) in the root growth media after drainage. The pores in the growth media are grouped into capillary pores and macropores. Smaller particle sizes and greater capillary pores would decrease the medium’s air:water ratio after irrigation (Argo, 1998).
The Dp is not a structure-dependent parameter but depends on the air-filled pores at a given matric potential (Masis-Melandez et al., 2014). An ideal growing medium contains a high percentage of macropores and a good supply of oxygen through macropores towards healthy roots (Sahoo et al., 2023). Therefore, the evaluation of both storage properties, including air and water contents, and exchange properties (pore tortuosity and gas diffusivity) is important. The effect of AFP on Dp is usually modelled by an exponential function (Wever et al., 2000). Numerous predictive–descriptive models for Dp as a function of AFP are available (Raviv and Leith, 2008), including those of Penman (1940), Millington and Quirk (1961), Campbell (1974), Troeh et al. (1982) and Moldrup (1997). Schimez et al. (2013) reported that the Moldrup model (1997) with the tortuosity parameter of m = 6 was the best for modelling the Dp as a function of AFP. Relevant models for predicting gas diffusivity (e.g. Millington and Quirk, 1961; Moldrup et al., 2001) were mainly developed for homogeneous soils, and their ability must be evaluated for the growth media.
There are limited studies evaluating the aeration status of biochar-based mixtures as soilless growth media. Therefore, this study was carried out to (1) investigate the aeration status (i.e. air content and oxygen diffusion) of biochar-based mixtures as soilless growing media and (2) model and interpret the oxygen diffusion versus air content data of these mixtures and recommend the good-aerated mixtures as substitute(s) for the cocopeat-perlite as the reference medium.
Materials and methods
Sampling and preparation of growth media
Criteria for selecting the individual organic and inorganic substrates are presented in detail by Banitalebi et al. (2019). Biochars of the oven-dried agricultural wastes (<2 mm) were produced by slow pyrolysis. Residues were placed in a pyrolysis chamber, and the temperature was gradually increased up to the final temperatures of 300°C and 500°C with a rate of 2°C min−1 and using a continuous inflow of nitrogen. The final temperature was maintained for 2 hours.
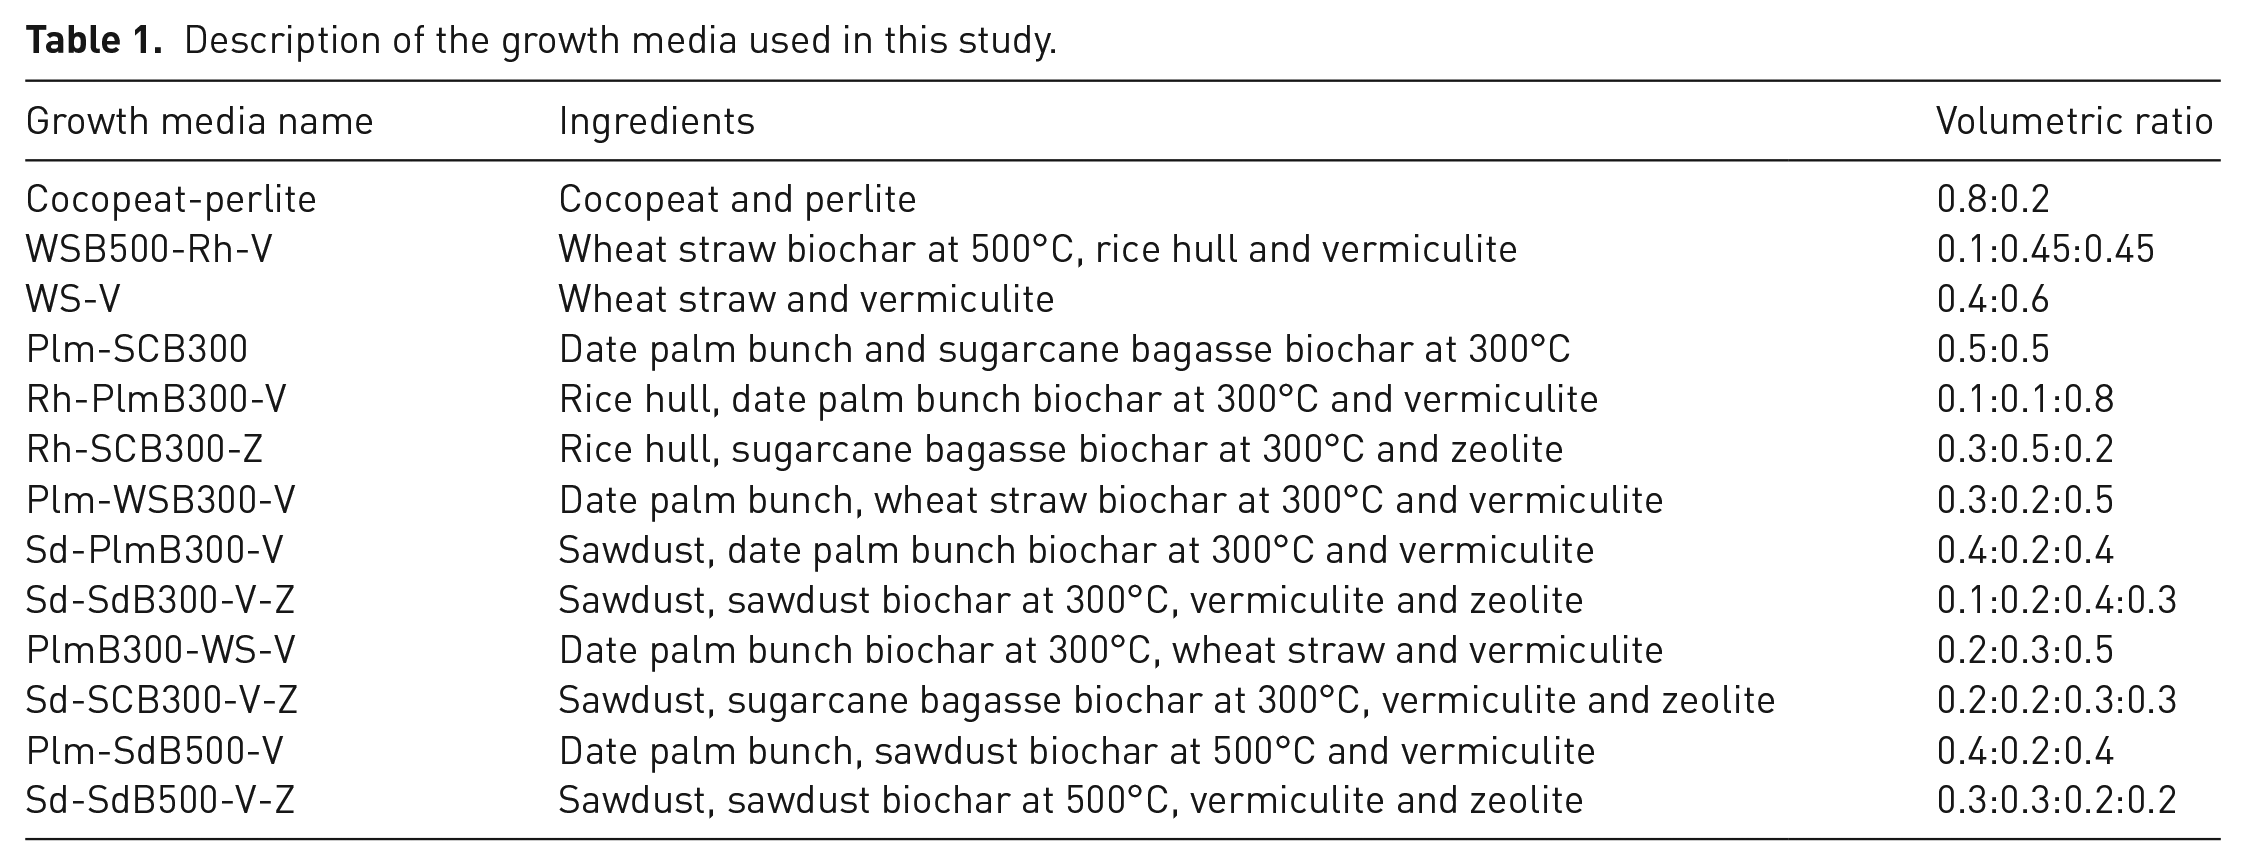
Based on the well-known criteria for selecting suitable growth media and a proportional (not interactive) behaviour of substrates, 13 growth media, including cocopeat-perlite (as the reference medium), were prepared with different volumetric ratios from organic/biochar and inorganic substrates (see Banitalebi et al., 2021). The individual substrates were mixed to produce appropriate growth media (Table 1). The details of time, sampling location and applied ratios of different inorganic and organic substrates are explained in Banitalebi et al. (2019, 2021).
Description of the growth media used in this study.
Oxygen diffusivity measurement in the growth media
A cylindrical one-chamber diffusion apparatus (Schjønning et al., 2013) with volume of 779 cm3 was constructed and used to measure the oxygen diffusion coefficient (Dp) in the mixed growth media in the laboratory (Figure 1). The prepared samples of growth media were poured into stainless-steel cylindrical rings (5.1 cm diameter and 4.5 cm height) and were gently saturated from the bottom to prevent air entrapment. The samples were then compressed with a confined axial stress of 20 kPa (Raviv and Leith, 2008) and were re-saturated from the bottom. In this method, each sample was attached to the air-tight chamber, and its lower boundary surface was in contact with the ambient air. The diffusion chamber was purged with the continuous flow of oxygen-free N2 gas to remove all oxygen, afterward allowing oxygen to diffuse from the ambient air through the sample into the chamber. The O2 removal of the chamber was performed very slowly to ensure that water was not translocated through and/or squeezed out of the growth media. The concentration of O2 at the top of the chamber was continuously measured by an oxygen sensor of the KE-50 series (Figaro Engineering Inc., Osaka, Japan) every 5 seconds. A temperature sensor was also located at the top of the chamber. A data acquisition system simultaneously recorded the O2 concentration and air temperature for 2 hours.
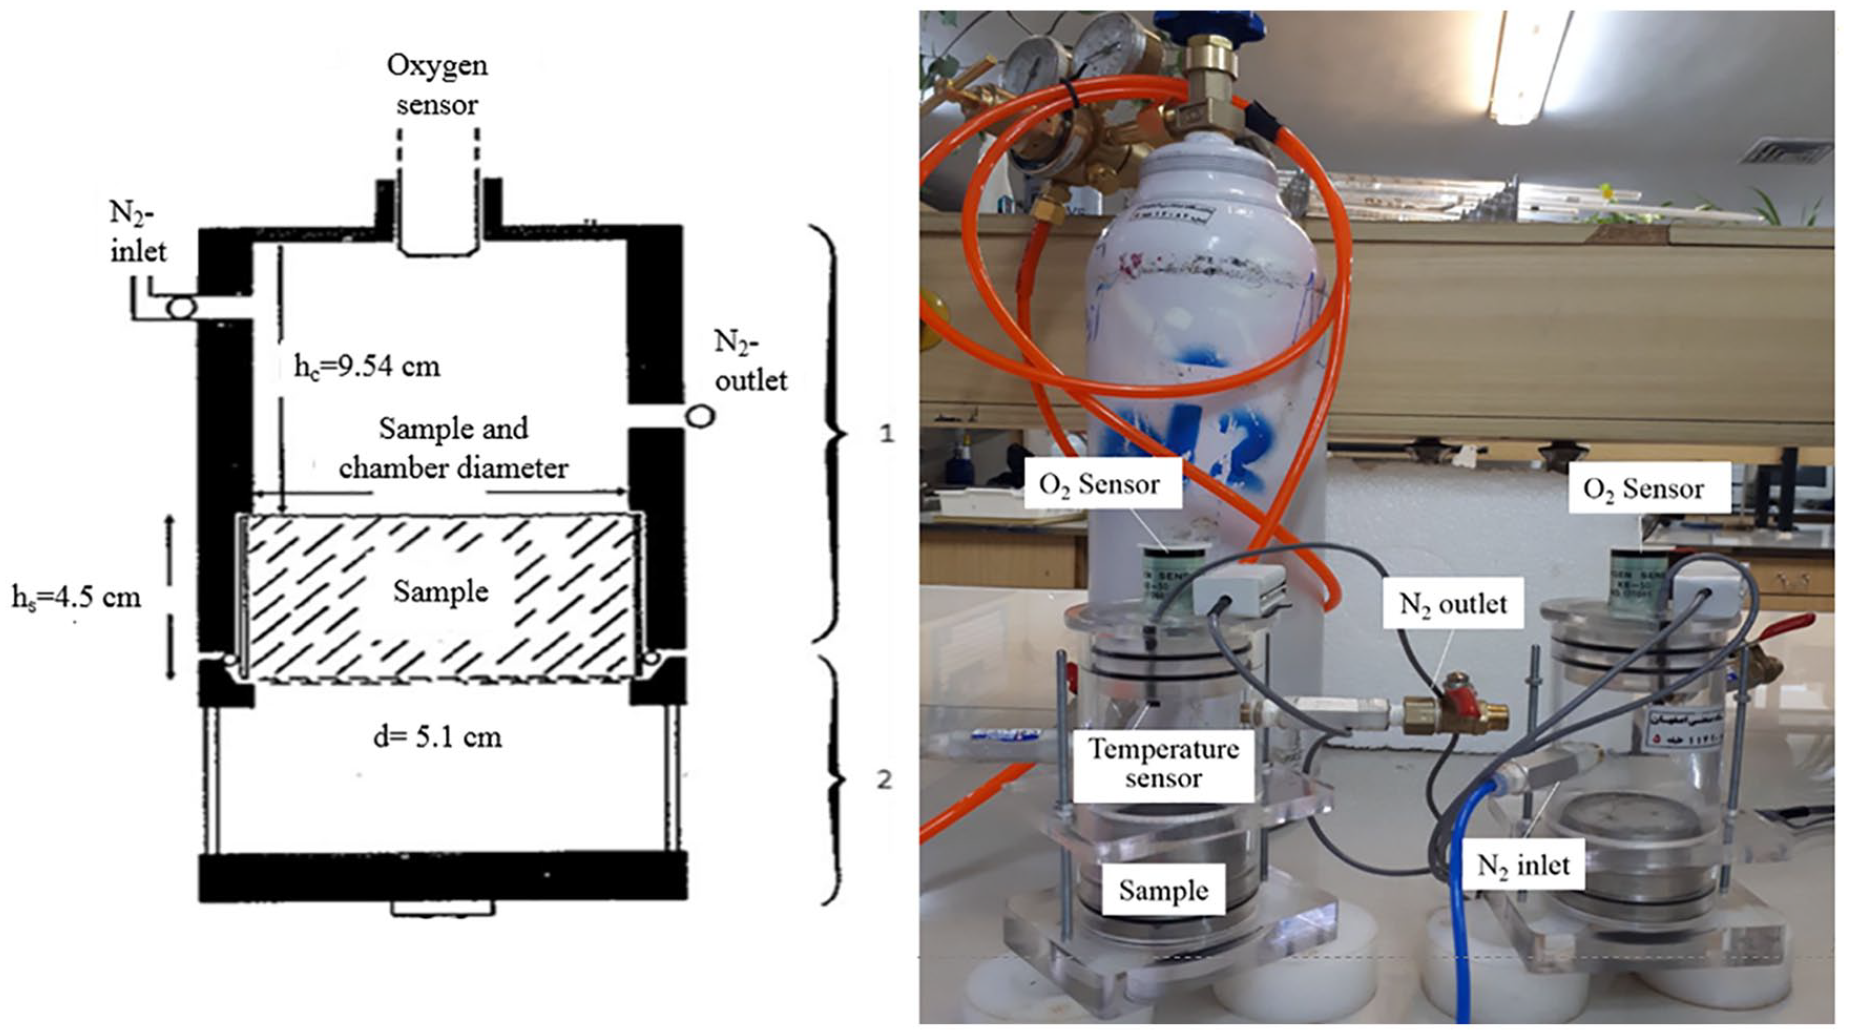
One-chamber diffusion apparatus; hc: height of the cylindrical diffusion chamber and hs: height of the growth medium sample (adopted from Schjønning et al., 2013).
The oxygen diffusion in the growth media was measured in the wet range at six matric potentials (h) of −5, −10, −15, −20, −40 and −60 hPa with three replicates. Before the oxygen diffusion measurements, the samples of growth media were equilibrated at the mentioned h values in a sand box (Eijkelkamp, Giesbeek, The Netherlands). The oxygen diffusion coefficient (Dp) was calculated by the non-steady-state method of Rolston (1986) as follows. The Dp was then scaled with its value in the free air, D0 (i.e. 2.05 × 10⁻⁵ m2 s−1 at 25°C) to determine gas diffusivity (Dp/D0). Assuming the transient diffusion process being approximated by steady-state diffusion under the specific measurements in this study, Fick’s first law can be expressed as:
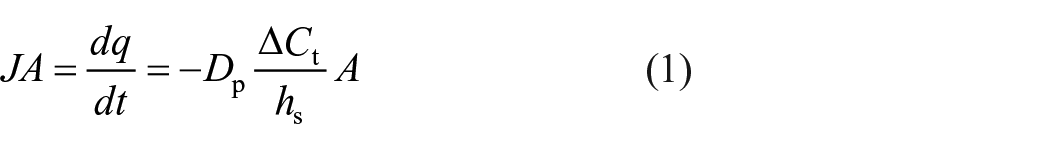
where J is the diffusive flux (g m−2 s−1), dq is the amount of gas (g) diffusing in the time interval dt (s), Dp is the diffusion coefficient (m2 s−1), ΔCt is the O2 concentration difference between the two ends of the sample (g m−3) at time t (s), A is the cross-sectional area of the sample (m2) and hs is the sample length (m). The relation between concentration change in the diffusion chamber and the amount of gas diffusing through the sample is given by:
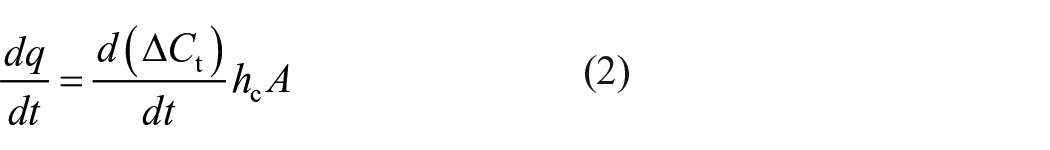
where hc is the height of the cylindrical diffusion chamber (cm). By combining equations (1) and (2) and then integrating [equation (3), ΔCt = ΔC0 at t = 0, ΔCt = ΔCt at t = t], the following equation [equation (4)] is obtained for the calculation of diffusion coefficient (Dp):
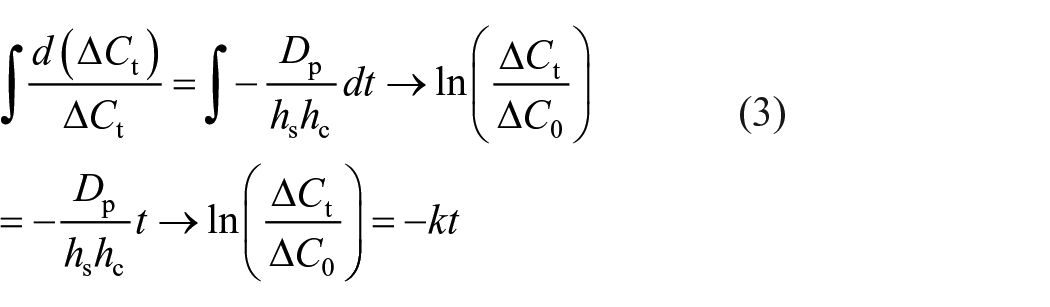
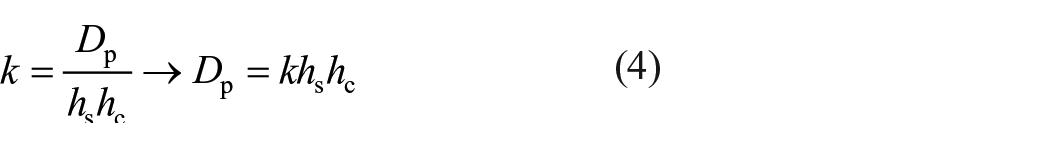
where k is the slope of the linear part of the logarithmic relation of the relative oxygen concentration
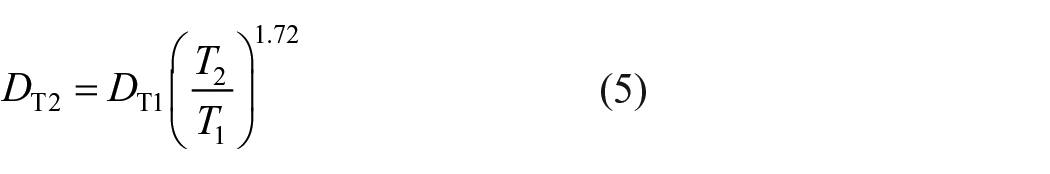
where DT2 and DT1 are the diffusion coefficient values at two temperatures of T2 and T1 (°K), respectively.
Raviv et al. (1999) indicated that container-grown plants require minimum AFP of 0.15 m3 m−3. They also mentioned that an ideal substrate must have AFP values in the range 0.1–0.3 m3 m−3. Thus, the tortuosity coefficient of the air-filled pores (ε) was calculated at three AFP values of 0.10, 0.15 and 0.20 m3 m−3 by the following equation:
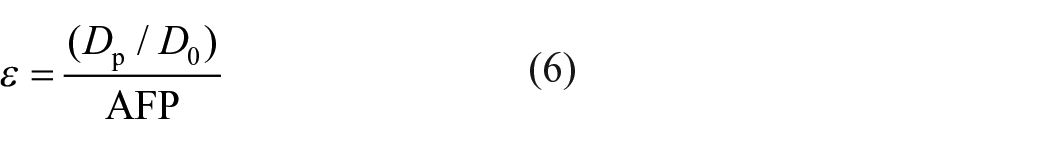
where Dp, Do and AFP are defined before.
As mentioned earlier, the AFP values corresponding to the six h values were obtained from the van Genuchten (1980) function fitted to the water retention data (Banitalebi et al., 2021) as the difference between the saturated water content and the volumetric water contents at those h values. Then, the Dp/D0 values were plotted versus corresponding AFP data for each plant growth medium.
Modelling of oxygen diffusivity data
Numerous predictive–descriptive equations for modelling Dp as a function of AFP are available in the literature. It is necessary to evaluate the efficacy of these models in plant growth media (Raviv and Leith, 2008). Raviv and Leith (2008) represented different model groups used to describe gas diffusivity, including (1) water content (θ)-based models, (2) empirical non-linear models that take into account both water content and TP [such as Millington and Quirk (1961) model], (3) WRC-based models [such as Buckingham–Burdine–Campbell model or Moldrup et al. (2001)], (4) power-law models [such as Troeh et al. (1982) model] and (5) two- or three-region D(θ) models considering different pore spaces (i.e. available and non-available pore spaces).
Because of the uni-modal pore size distribution and WRC of the studied growth media (Banitalebi et al., 2021), four models, including Millington and Quirk (1961), Troeh et al. (1982), Buckingham–Burdine–Campbell and modified Buckingham–Burdine–Campbell (1999), were fitted to the measured Dp/D0 versus AFP data. These models were used with both suggested constant parameters and best-fitted parameters. The equations and parameters/constants of the selected models are shown in Table 2. Solver tool in MS Excel was used to fit and optimise the parameters of the gas diffusivity models by non-linear optimisation (Wraith and Or, 1998).
The fitted oxygen diffusion equation, formula and their parameters.*
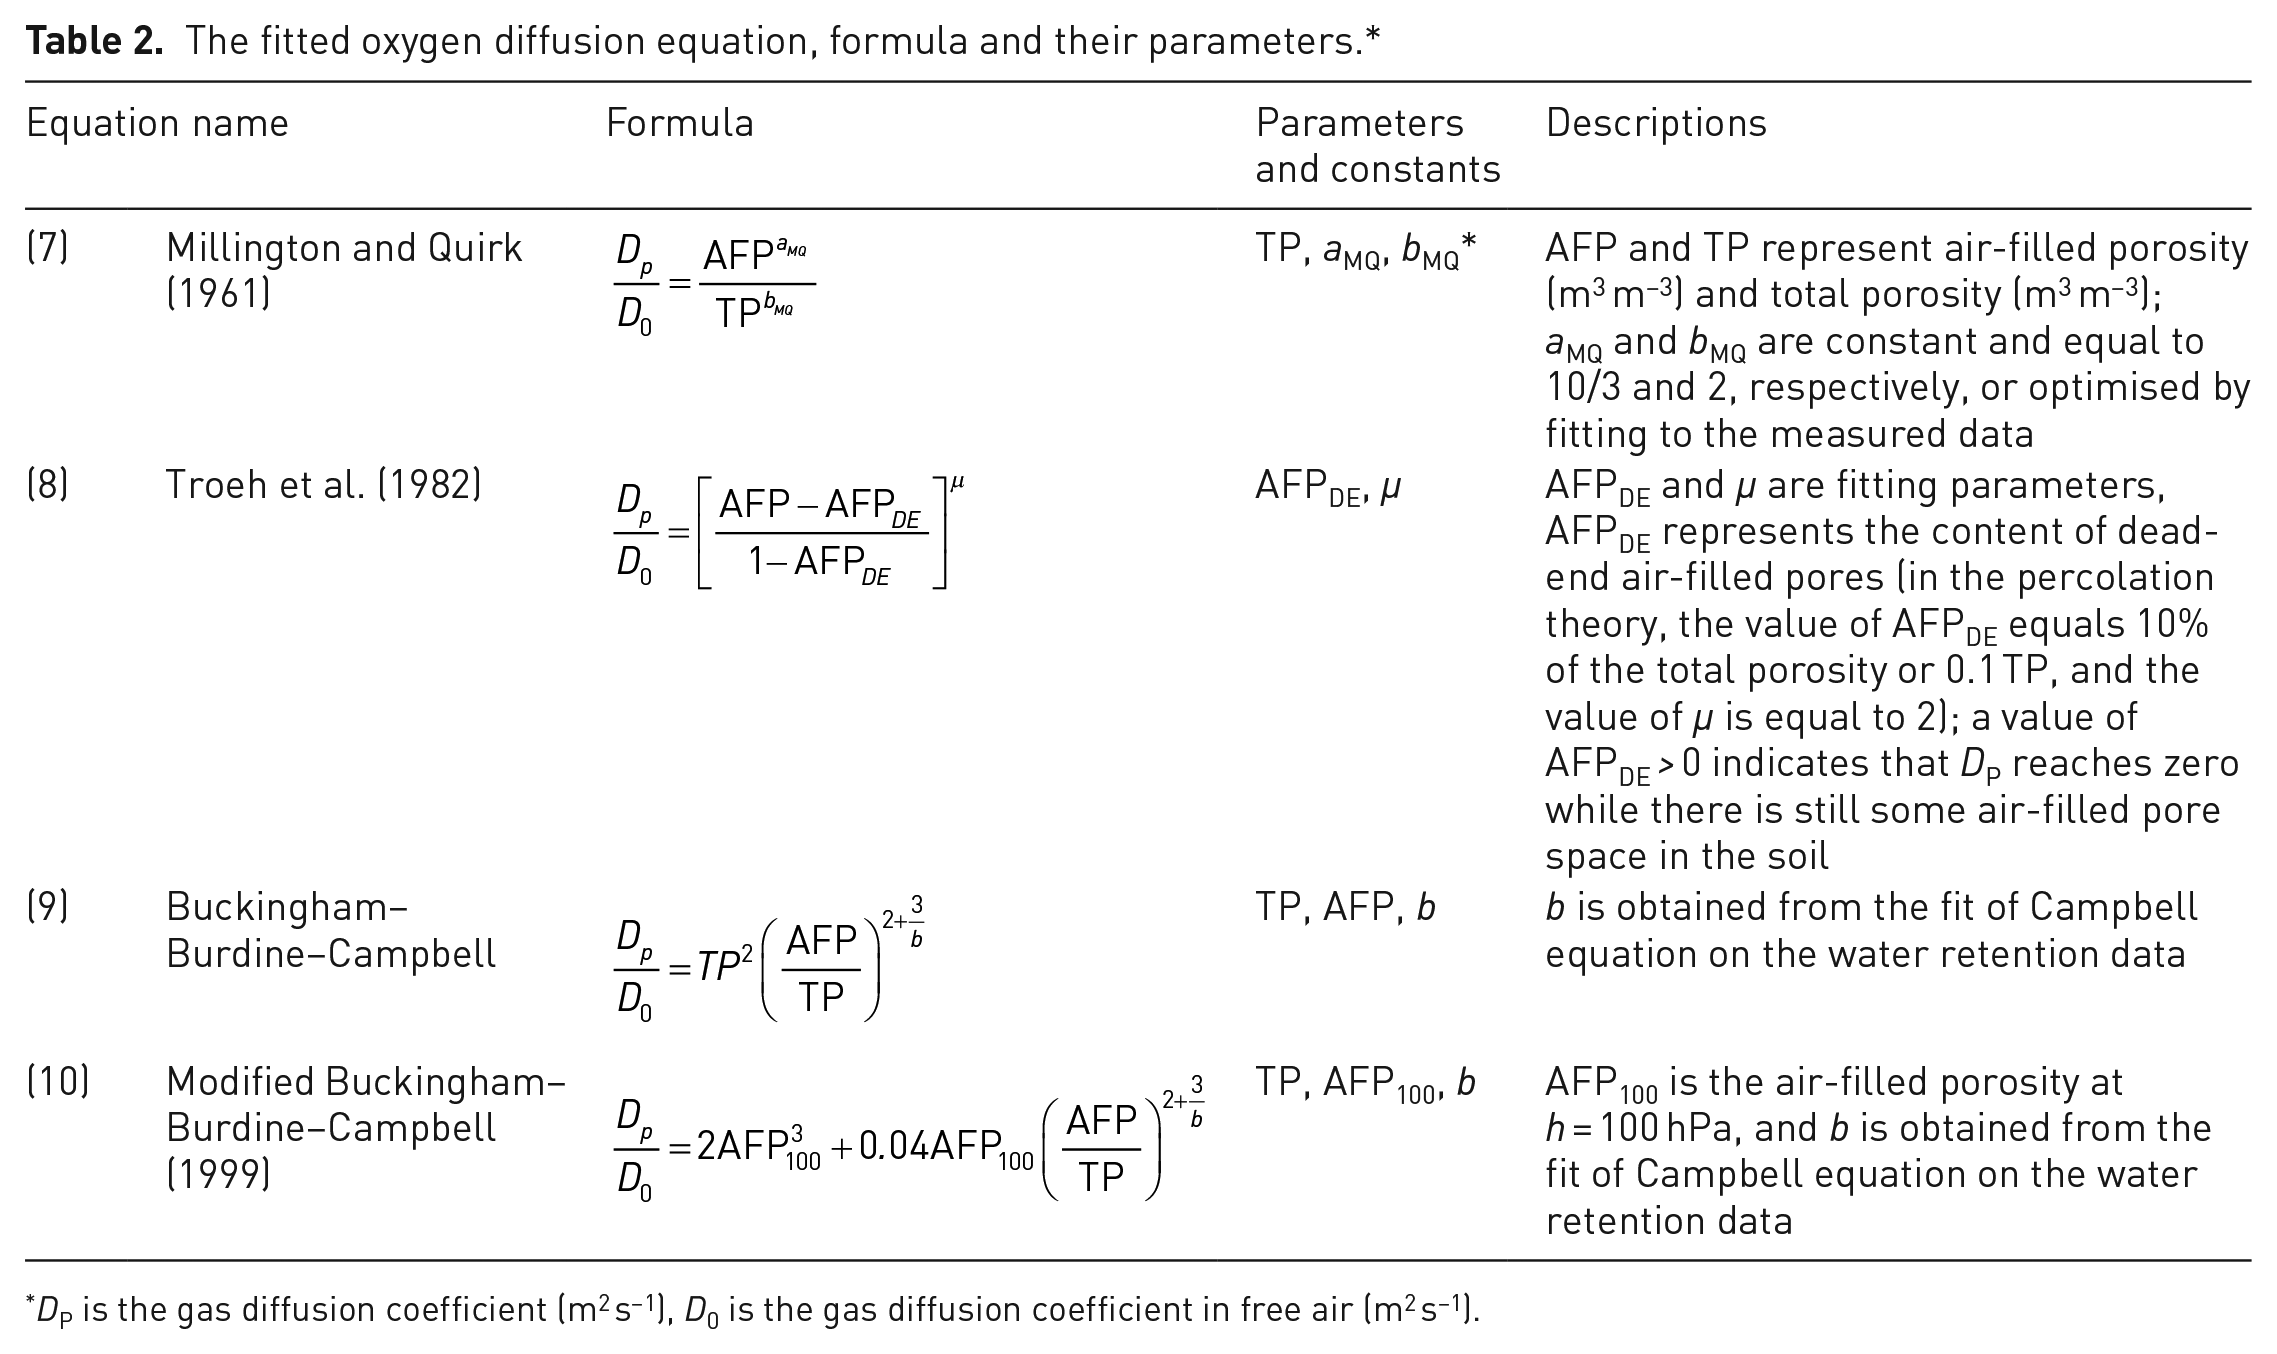
DP is the gas diffusion coefficient (m2 s−1), D0 is the gas diffusion coefficient in free air (m2 s−1).
According to Caron et al. (2015), the relative gas diffusivity (Dp/D0) in suitable growth media must be in the range 0.010–0.015 at h of −8 hPa. An ideal growth medium must have AFP of 0.10 (Joiner and Conover, 1965) or 0.15 m3 m–3 (Penningsfeld, 1978). The h values corresponding to these AFP values were also calculated by the inverse of van Genuchten (1980) function fitted to the water retention data (Banitalebi et al., 2021). In addition, the container capacity of the growth media is usually considered as the water content at h of −10 hPa. Since this is usually considered the upper limit of plant available water in the growth media, we also derived the AFP and Dp/D0 corresponding to this limit. Therefore, the Dp/Do values were derived from the fitted equations and compared with the critical Dp/D0 (i.e. 0.010–0.015) as Caron et al. (2015) suggested.
Statistical analyses
Statistical analyses were done based on a completely randomised design with three replicates. One-way analysis of variance (ANOVA) was done, and the mean comparisons were carried out with the least significant difference (LSD) test at the 0.05 probability level using the SAS software v. 9.1 (SAS, 2001). Figures were depicted using Microsoft Excel® 2013 (Microsoft Corporation, Redmond, WA, USA).
Results and discussion
Oxygen diffusivity in the growth media
The measured Dp/D0 versus AFP data are presented in Figure 2. The oxygen diffusion coefficient decreased with increasing water content (or matric potential) in all growth media. In other words, the Dp/D0 increased exponentially with an increase in the AFP because more interconnected air-filled pores become available as air space increases. This finding agrees with the results of other studies (Chamindu et al., 2019; Deepagoda et al., 2011; Schmitz et al., 2013). Differences in the Dp/D0 data could be related to variations in the pore size distribution (as inferred from the WRC) and pore tortuosity of the growth media. Indeed, differences in the particle size and shape of individual substrates mainly determine the water retention and oxygen diffusion at different matric potentials in the produced mixtures (Banitalebi et al., 2021). The particle size distribution has a vital role in the pore size distribution of the growth media and, consequently, in shaping both WRC and hydraulic conductivity functions (Prasad et al., 2018). Incorporating biochar can affect the physical properties of growth media, which are mainly related to their particle size distribution (Huang and Gu, 2019).
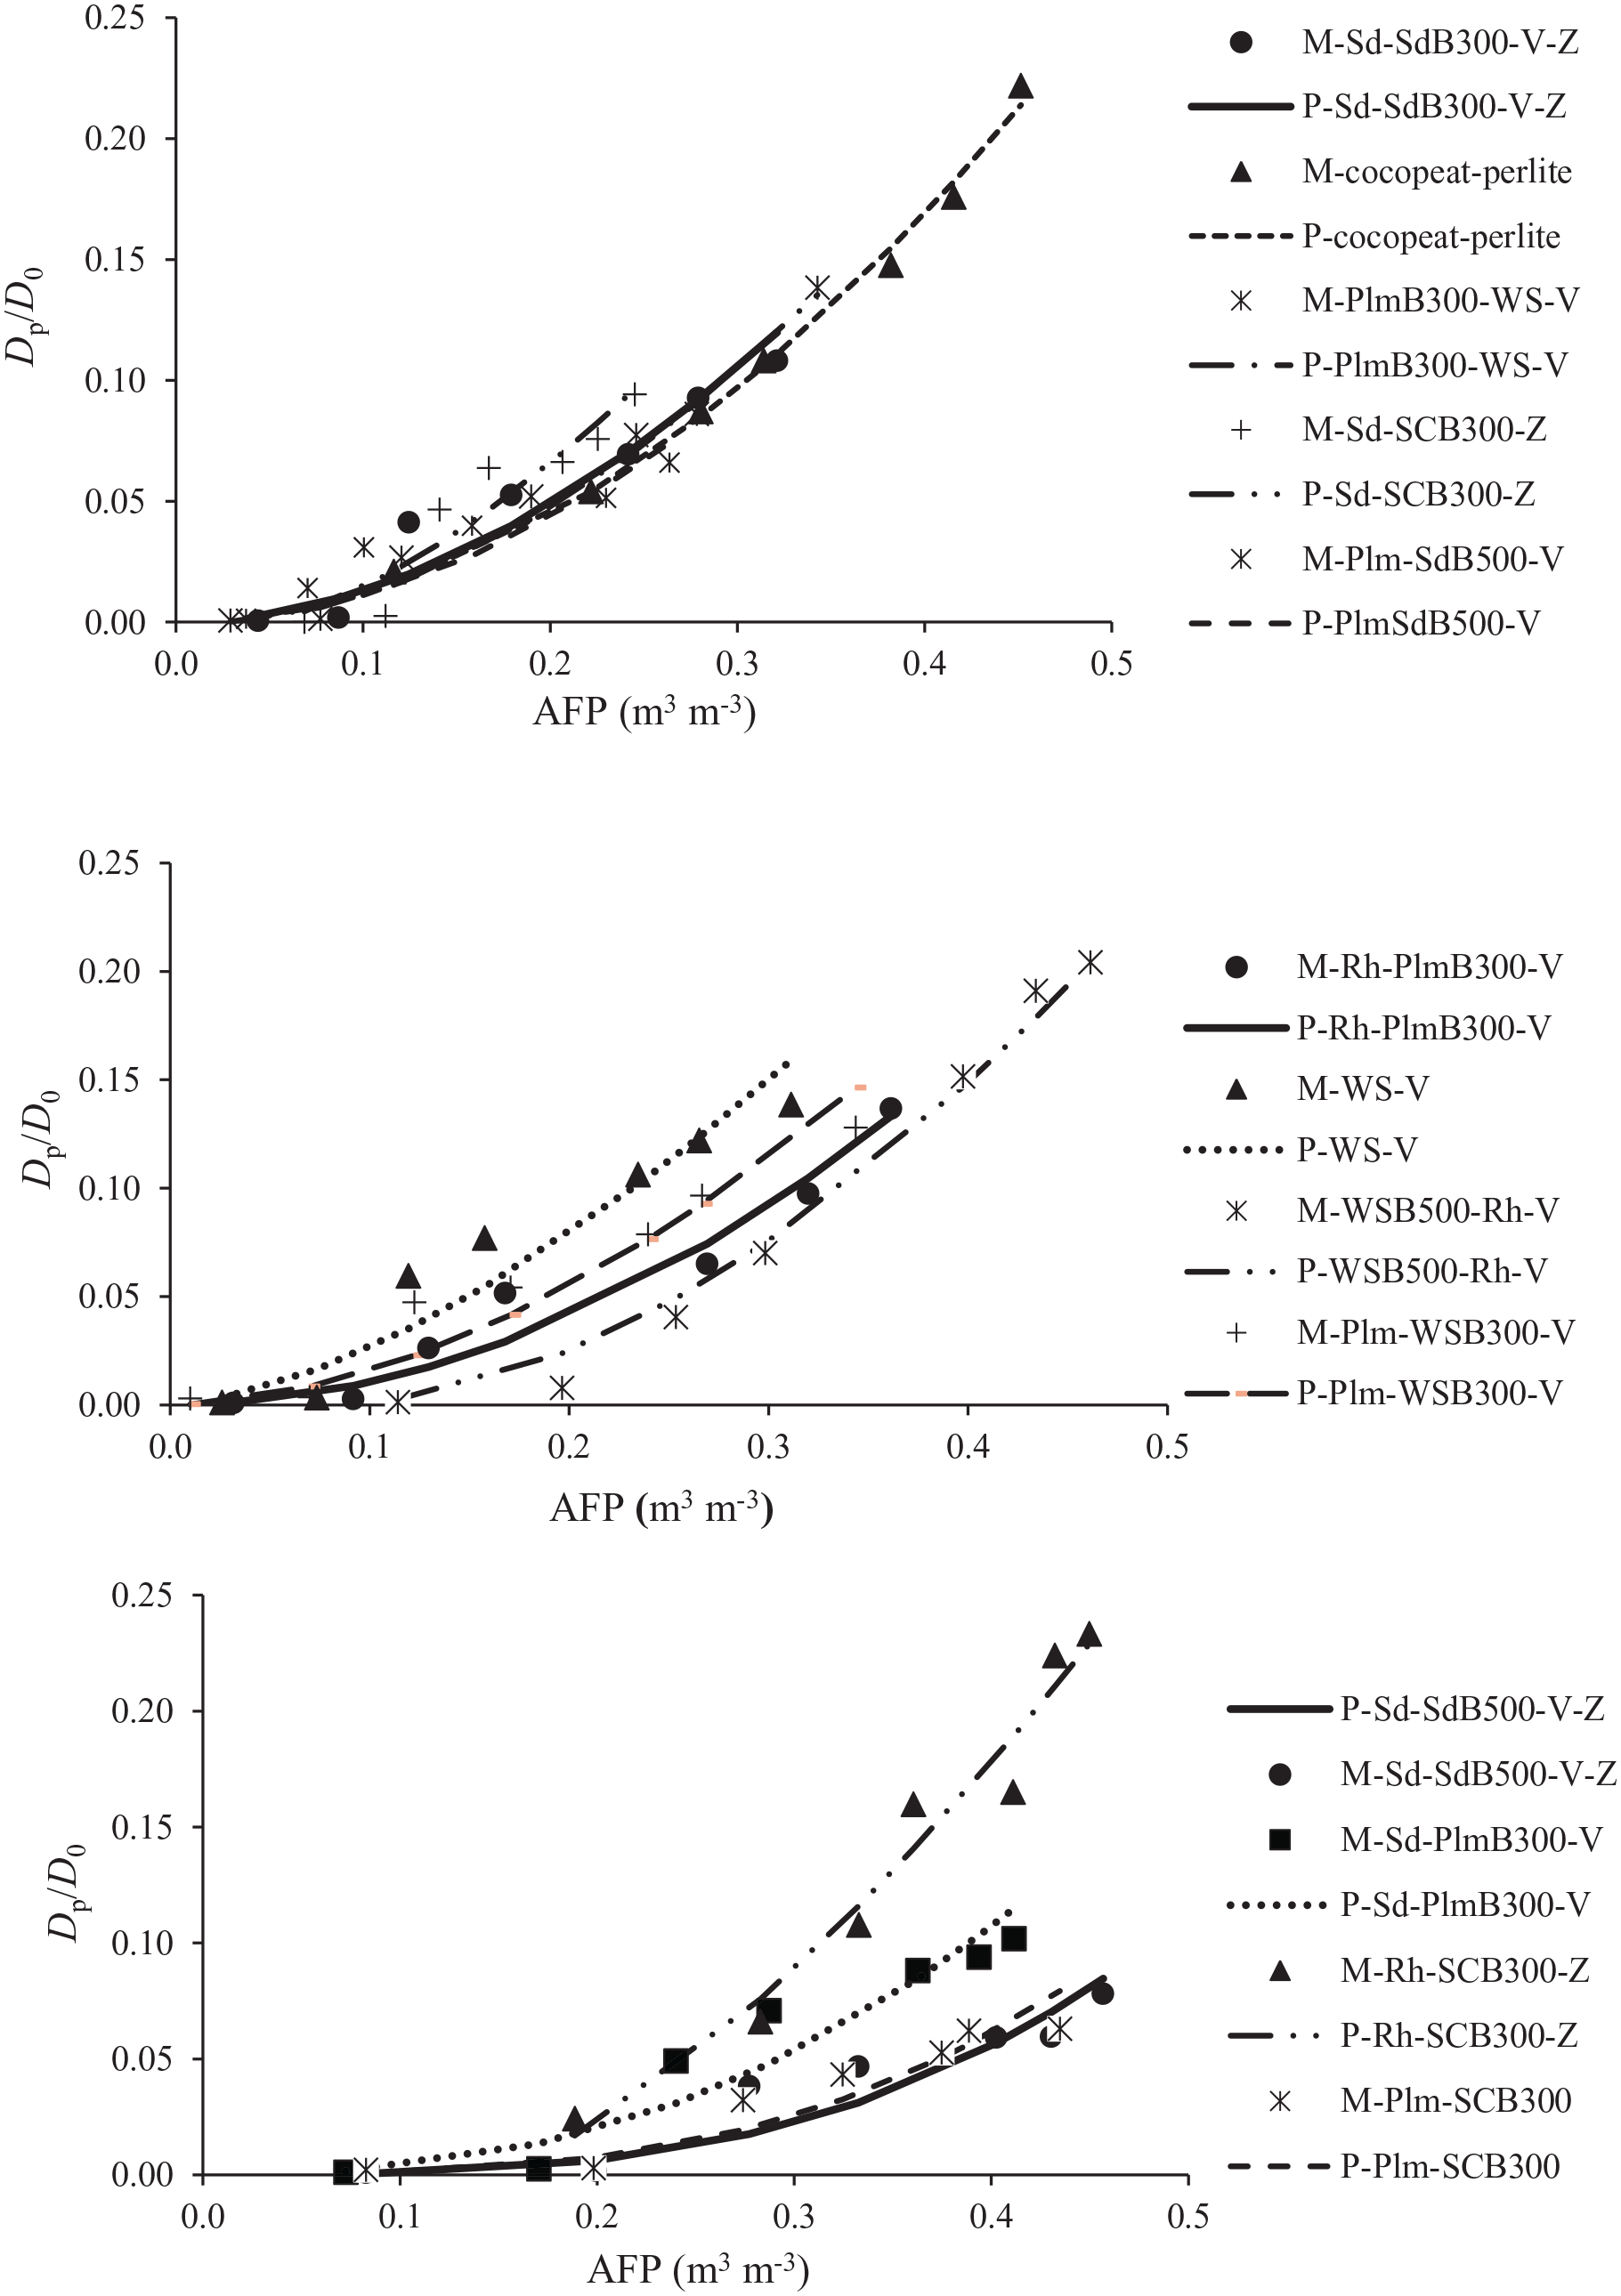
Relative oxygen diffusivity coefficient (Dp/D0) versus the AFP data in the studied growth media and fitting of Troeh et al. (1982) model on the measured data in growth media. WSB500-Rh-V: wheat straw biochar produced at 500°C, rice hull and vermiculite; WS-V: wheat straw and vermiculite; Plm-SCB300 date palm bunches and sugarcane bagasse biochar produced at 300°C; Rh-PlmB300-V rice hull, date palm bunches biochar produced at 300°C and vermiculite; Rh-SCB300-Z rice hull, sugarcane bagasse biochar produced at 300°C and zeolite; Plm-WSB300-V date palm bunches, wheat straw biochar produced at 300°C and vermiculite; Sd-PlmB300-V sawdust, date palm bunches biochar produced at 300°C and vermiculite; Sd-SdB300-V-Z sawdust, sawdust biochar produced at 300°C and vermiculite; PlmB300-WS-V date palm bunches biochar produced at 300°C, wheat straw and vermiculite; Sd-SCB300-V-Z sawdust, sugarcane bagasse biochar produced at 300°C, vermiculite and zeolite; Plm-SdB500-V date palm bunches, sawdust biochar produced at 500°C and vermiculite; Sd-SdB500-V-Z sawdust, sawdust biochar produced at 500°C, vermiculite and zeolite.
Differences in the Dp/D0 versus AFP curves are closely related to variations in the pore size distribution, pore tortuosity (Raviv and Leith, 2008) and the WRC (Banitalebi et al., 2021) of growth media. Caron et al. (2005) observed that gas diffusivity was the highest when intermediate (2–4 mm) bark fragments were used as the largest fraction in a growth mixture. They supposed air space is created with coarser, impermeable fragments, resulting in poorly connected pore space than intermediate-size fragments. Thus, particle size distribution has a vital role in the pore size distribution and pore connectivity of growth media and, consequently, in shaping the water release, hydraulic conductivity functions and soil aeration (Prasad et al., 2018). The Dp/D0 of the studied growth media varied in the range 0–0.25. Increment in the AFP highly increased oxygen diffusivity in three substrates, including Plm-SCB300, Rh-SCB300-Z and Sd-PlmB300-V. These media had higher AFP values at h of 10 hPa than other media. However, the lowest increments in oxygen diffusivity with AFP increase were observed for Plm-SdB500-V and Sd-SCB300-Z-V.
The size distribution and arrangement of particles mainly affected the TP and AFP. The effect of biochar on TP is related to its mutual effects on air space and container capacity. The minimum values of TP were recorded for Sd-SdB300-V-Z and Sd-SCB300-V-Z (Banitalebi et al., 2021). These media have lower n (i.e. shape parameter in the van Genuchten model) than all other growth media. The n parameter is related to the pore size distribution of a growth medium, and a greater n indicates a higher slope of the WRC. Besides coarse fragments of vermiculite and zeolite, these two media had low TP and AFP values (0.643 and 0.087 m3 m−3, respectively), resulting in low pore connectivity and pore space. These results suggest combining large fragments with different sizes would produce mixtures with low pore space.
Components with large particle sizes are often added to improve the aeration properties, including air space and gas exchange in a growth medium. Bunt (2012) described that coarse-graded growing media had a high oxygen diffusion rate, and a growing medium with an AFP of 0.25−0.30 m3 m−3 provided optimal oxygen diffusion. Verhagen (2011) revealed that optimal oxygen diffusion occurs when the AFP is at least 0.20−0.35 m3 m−3. It became clear that the structure of fragments and the WRC can affect this threshold. Nevertheless, some large fragments that are coarse, platy or disc-shaped and impermeable to gases may create barriers, reduce pore connectivity, and limit gas diffusion even if they improve air storage of the growth media (Caron et al., 2001).
Oxygen diffusivity modelling results
The measured gas diffusivity data (Dp/D0 vs AFP) were fitted to the four models [equations (7)–(10)]. The fitting efficacy of all the examined models was evaluated based on the root mean square error (RMSE) and coefficient of determination (R2). It was observed that the Millington and Quirk (MQ) and Troeh et al. (T) models fitted the data better than the other two models. The T model fitted better than the MQ model due to higher R2 and lower RMSE. The fitting of the T model on the measured Dp/D0 versus AFP data was excellent. Since the R2 values of the T model were higher than those of the MQ model, only the fitted curves of the T model are shown in Figure 2. The T model was successfully used in several studies to fit and represent the measured Dp data for gas transport in porous media (Ghanbarian and Hunt, 2014; Petersen et al., 1994, 1996; Raviv and Leith, 2008). As a power function, this model fits the Dp/D0 versus AFP data. The AFPDE can be interpreted as a threshold AFP where gas diffusion ceases due to interconnected water films interrupting continuous air-filled pores. Parameter µ is an index of pore tortuosity related to the slope of Dp/D0 versus AFP. Values of µ greater than one resulted in a non-linear increase (first a lesser increase and then a greater increase) in Dp/D0 with an increment in AFP.
Mean comparisons of the fitting parameters of the MQ and T models among the growth media are presented in Table 3. The R2 values (0.753–0.993) indicated that the model fitted well to the measured data, although the T model fitted better than the MQ model. Millington and Quirk’s (1961) model was developed for coarse and unstructured material with particles of uniform size (Levintal et al., 2019). The highest values of aMQ and bMQ in the MQ model were obtained for Rh-SCB300-Z. The variation of Dp/D0 with AFP was low (i.e. 0–0.15) for some growth media and large (i.e. 0–0.25) for others. The maximum slopes of Dp/D0 versus AFP curves were obtained for Plm-SCB300, Rh-SCB300-Z and Sd-PlmB300-V. However, the lowest slopes were observed in Plm-SdB500-V and Sd-SCB300-V-Z. Millington and Quirk (1961) related the gas diffusivity of a porous medium to the pore size distribution and pore connectivity. In this model, the coefficient aMQ is a dimensionless parameter related to the particles’ shape.
The tortuosity coefficient (ε) and fitting parameters of Troeh et al. (1982) and Millington and Quirk (1961) models on the measured gas diffusivity data in the studied growth media.*
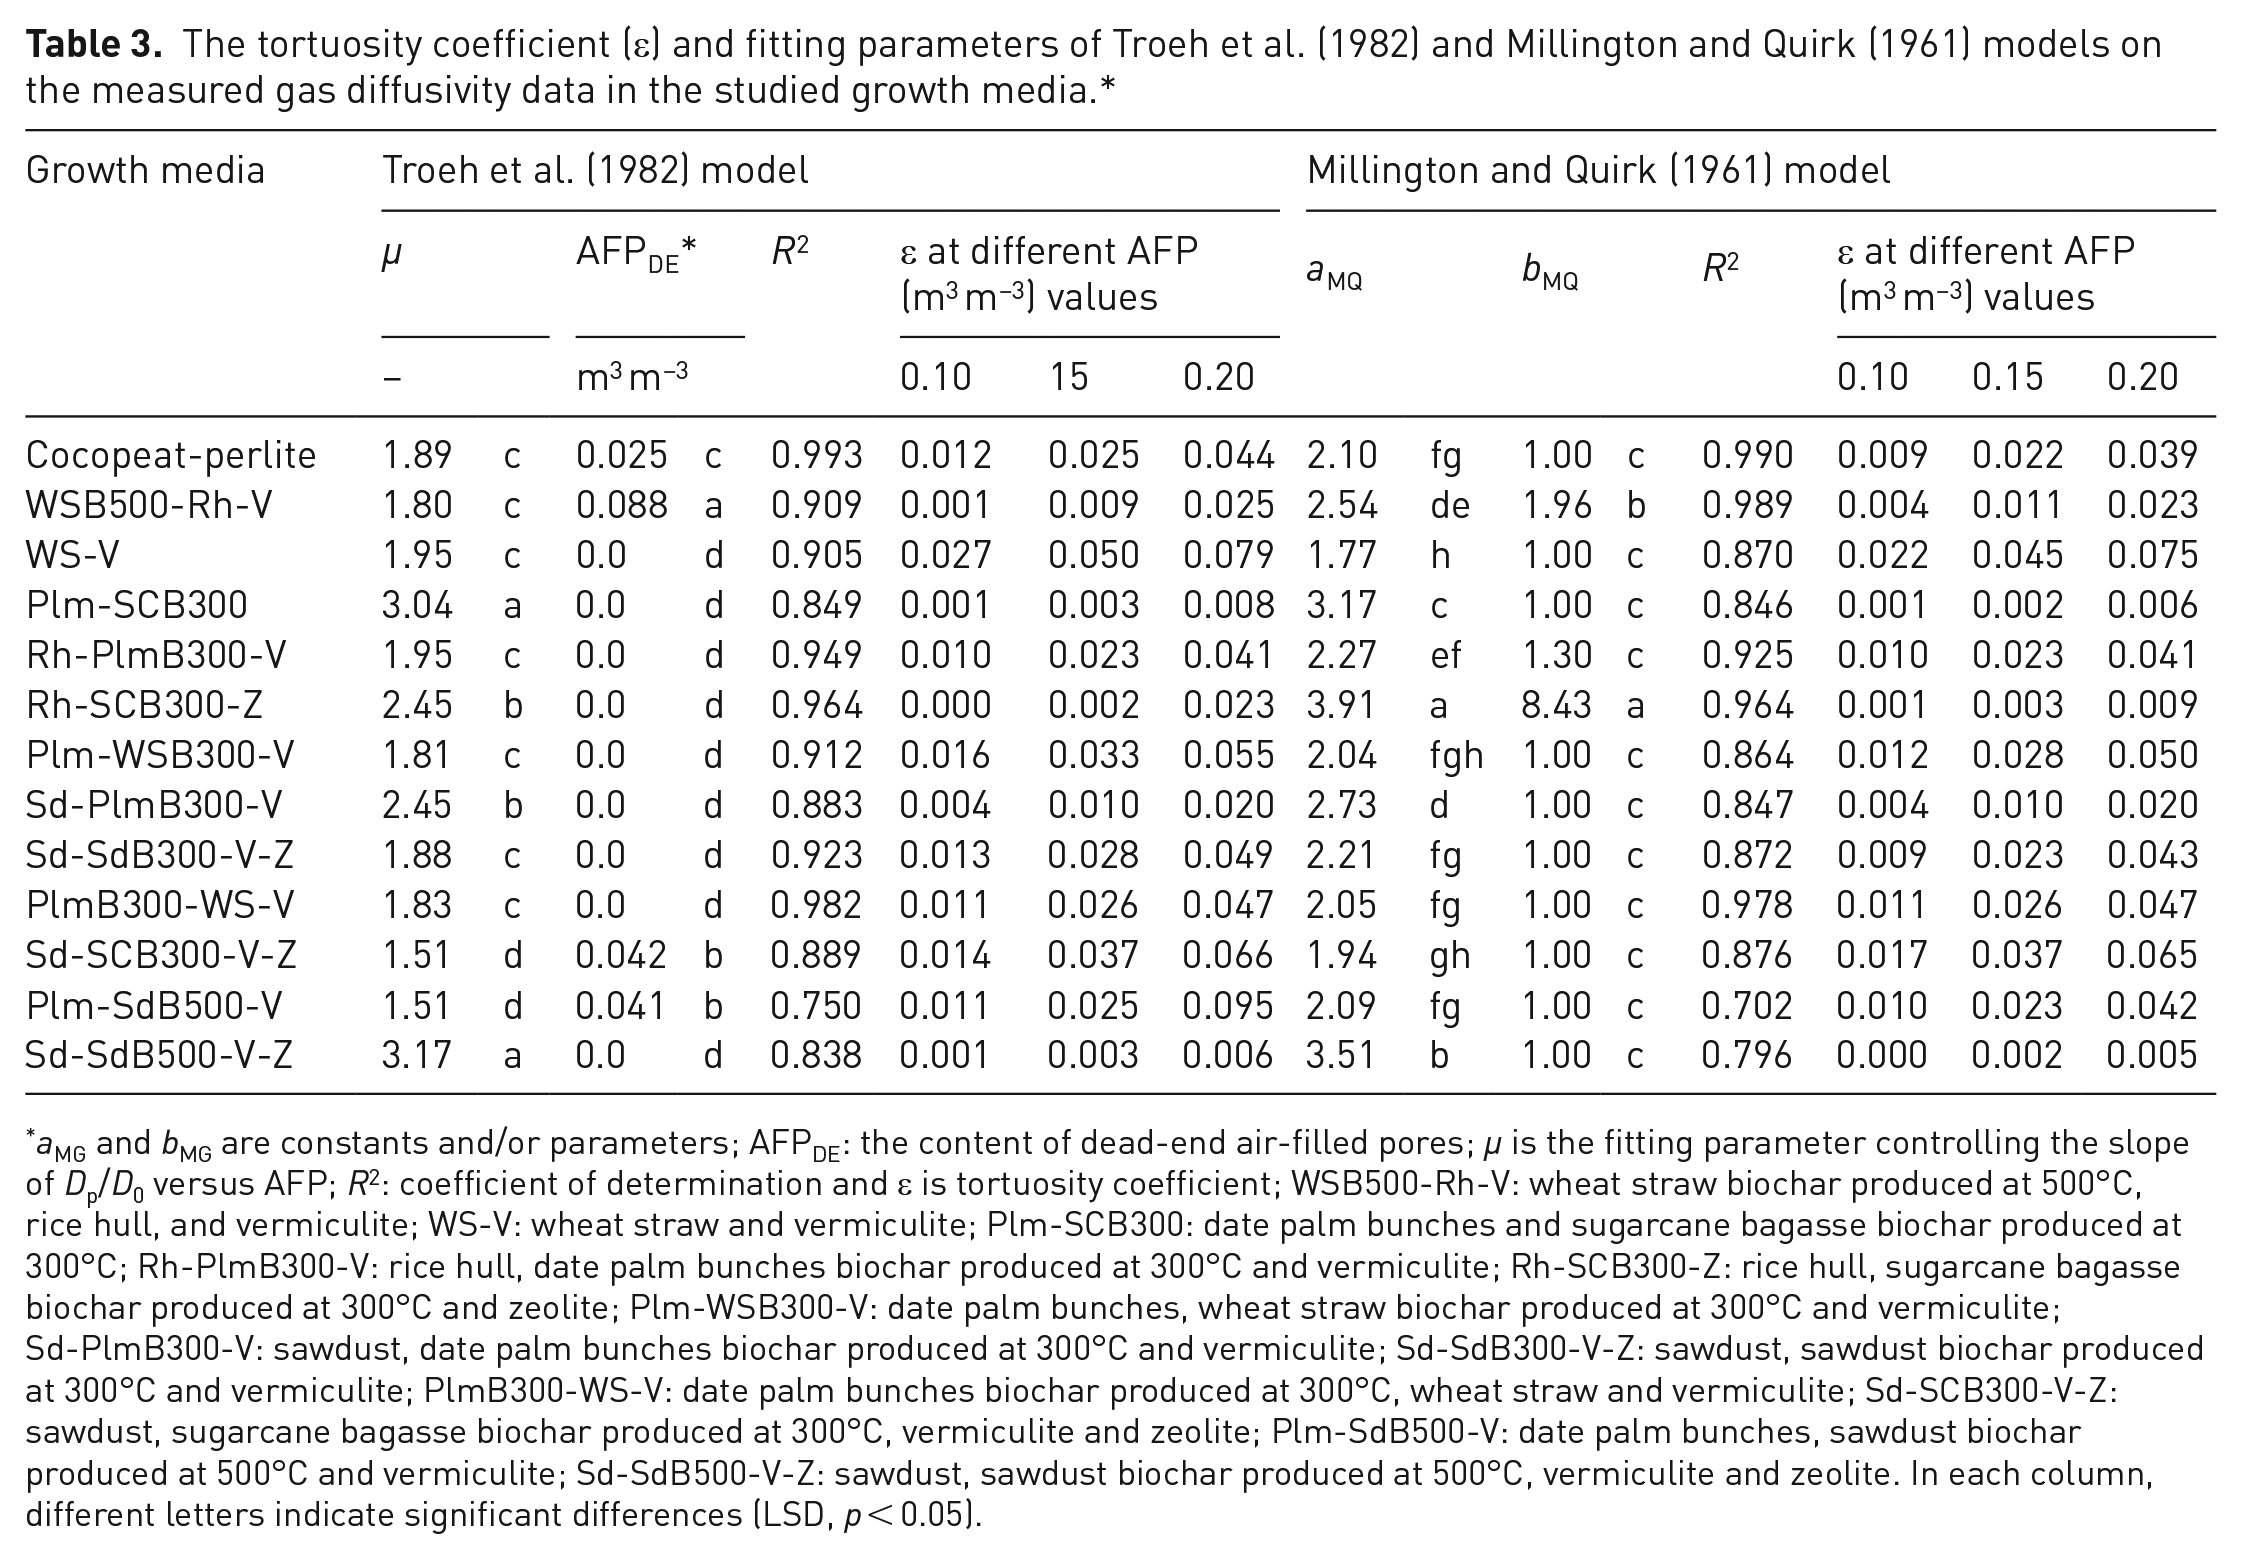
aMG and bMG are constants and/or parameters; AFPDE: the content of dead-end air-filled pores; μ is the fitting parameter controlling the slope of Dp/D0 versus AFP; R2: coefficient of determination and ε is tortuosity coefficient; WSB500-Rh-V: wheat straw biochar produced at 500°C, rice hull, and vermiculite; WS-V: wheat straw and vermiculite; Plm-SCB300: date palm bunches and sugarcane bagasse biochar produced at 300°C; Rh-PlmB300-V: rice hull, date palm bunches biochar produced at 300°C and vermiculite; Rh-SCB300-Z: rice hull, sugarcane bagasse biochar produced at 300°C and zeolite; Plm-WSB300-V: date palm bunches, wheat straw biochar produced at 300°C and vermiculite; Sd-PlmB300-V: sawdust, date palm bunches biochar produced at 300°C and vermiculite; Sd-SdB300-V-Z: sawdust, sawdust biochar produced at 300°C and vermiculite; PlmB300-WS-V: date palm bunches biochar produced at 300°C, wheat straw and vermiculite; Sd-SCB300-V-Z: sawdust, sugarcane bagasse biochar produced at 300°C, vermiculite and zeolite; Plm-SdB500-V: date palm bunches, sawdust biochar produced at 500°C and vermiculite; Sd-SdB500-V-Z: sawdust, sawdust biochar produced at 500°C, vermiculite and zeolite. In each column, different letters indicate significant differences (LSD, p < 0.05).
The air-filled porosity threshold (AFPDE) was zero for most growth media. The highest AFPDE (i.e. 0.088 m3 m–3) was observed for WSB500-Rh-V, which indicated that Dp/D0 in this substrate would be zero for the AFP smaller than 0.088 m3 m–3.
The results showed that while the AFP was more than 0.1 m3 m–3 for some growth media, the Dp/D0 values were very low (close to zero); an example is Sd-SdB500-V-Z substrate (Figure 2). Sd-SdB500-V-Z had AFP greater than 0.1 m3 m−3 (i.e. 0.192 m3 m−3) which is suitable for hydroponic growth media. Therefore, an AFP of 0.1 m3 m−3 may not necessarily be used alone to evaluate the aeration status of greenhouse growth media. The results of various studies indicated that plant performance, regardless of the high value of AFP, mainly depends on gas exchange characteristics such as gas diffusivity, oxygen concentration or oxygen diffusive flux in the growth media. Therefore, it is important to study the aeration status using various characteristics, such as gas diffusion and pore tortuosity, to examine the response/yield of plants grown in growth media (Caron et al., 2005).
There was no significant difference for μ parameter among WSB500-Rh-V, WS-V, Rh-PlmB300-V, Plm-WSB300-V, PlmB300-WS-V and Sd-SdB300-V-Z and cocopeat-perlite as a reference. The μ is the fitting parameter controlling the slope of Dp/D0 versus AFP curve. The highest values of μ were observed for Plm-SCB300 and Sd-SdB500-V- Z. These two media also had high AFP at h = −10 hPa (>0.1 m3 m−3), whereas the lowest μ values were observed for Plm-SdB500-V and Sd-SCB300-V-Z.
Two substrates of Sd-SdB300-V-Z and Sd-SdB500-V-Z had different μ values (p < 0.05, Table 3). The increasing trend of Dp/D0 with AFP for Sd-SdB500-V-Z was sharper (Figure 2). The Sd-SdB500-V-Z had higher α and n parameters (Table 4), released more water within the h range 0‒10 hPa than Sd-SdB300-V-Z and had better aeration status (Banitalebi et al., 2021). The production conditions of biochar had a significant effect on the µ parameter. Biochars produced at a higher pyrolysis temperature (e.g. 500°C) usually have better physical quality (as quantified by higher specific surface area, porosity and water retention) than those produced at a lower temperature (e.g. 300°C) (Banitalebi et al., 2021; Tomczyk et al., 2020). In these media, the combination of components with large particles, that is, vermiculite (V) and zeolite (Z), with other ingredients (with particle sizes smaller than 2 mm) not only could not improve the aeration status but also reduce pore connectivity and limit gas diffusion. The values of the tortuosity coefficient (
Fitting parameters of van Genuchten (1980) model which was fitted to the measured water release curves of the examined growth media.*
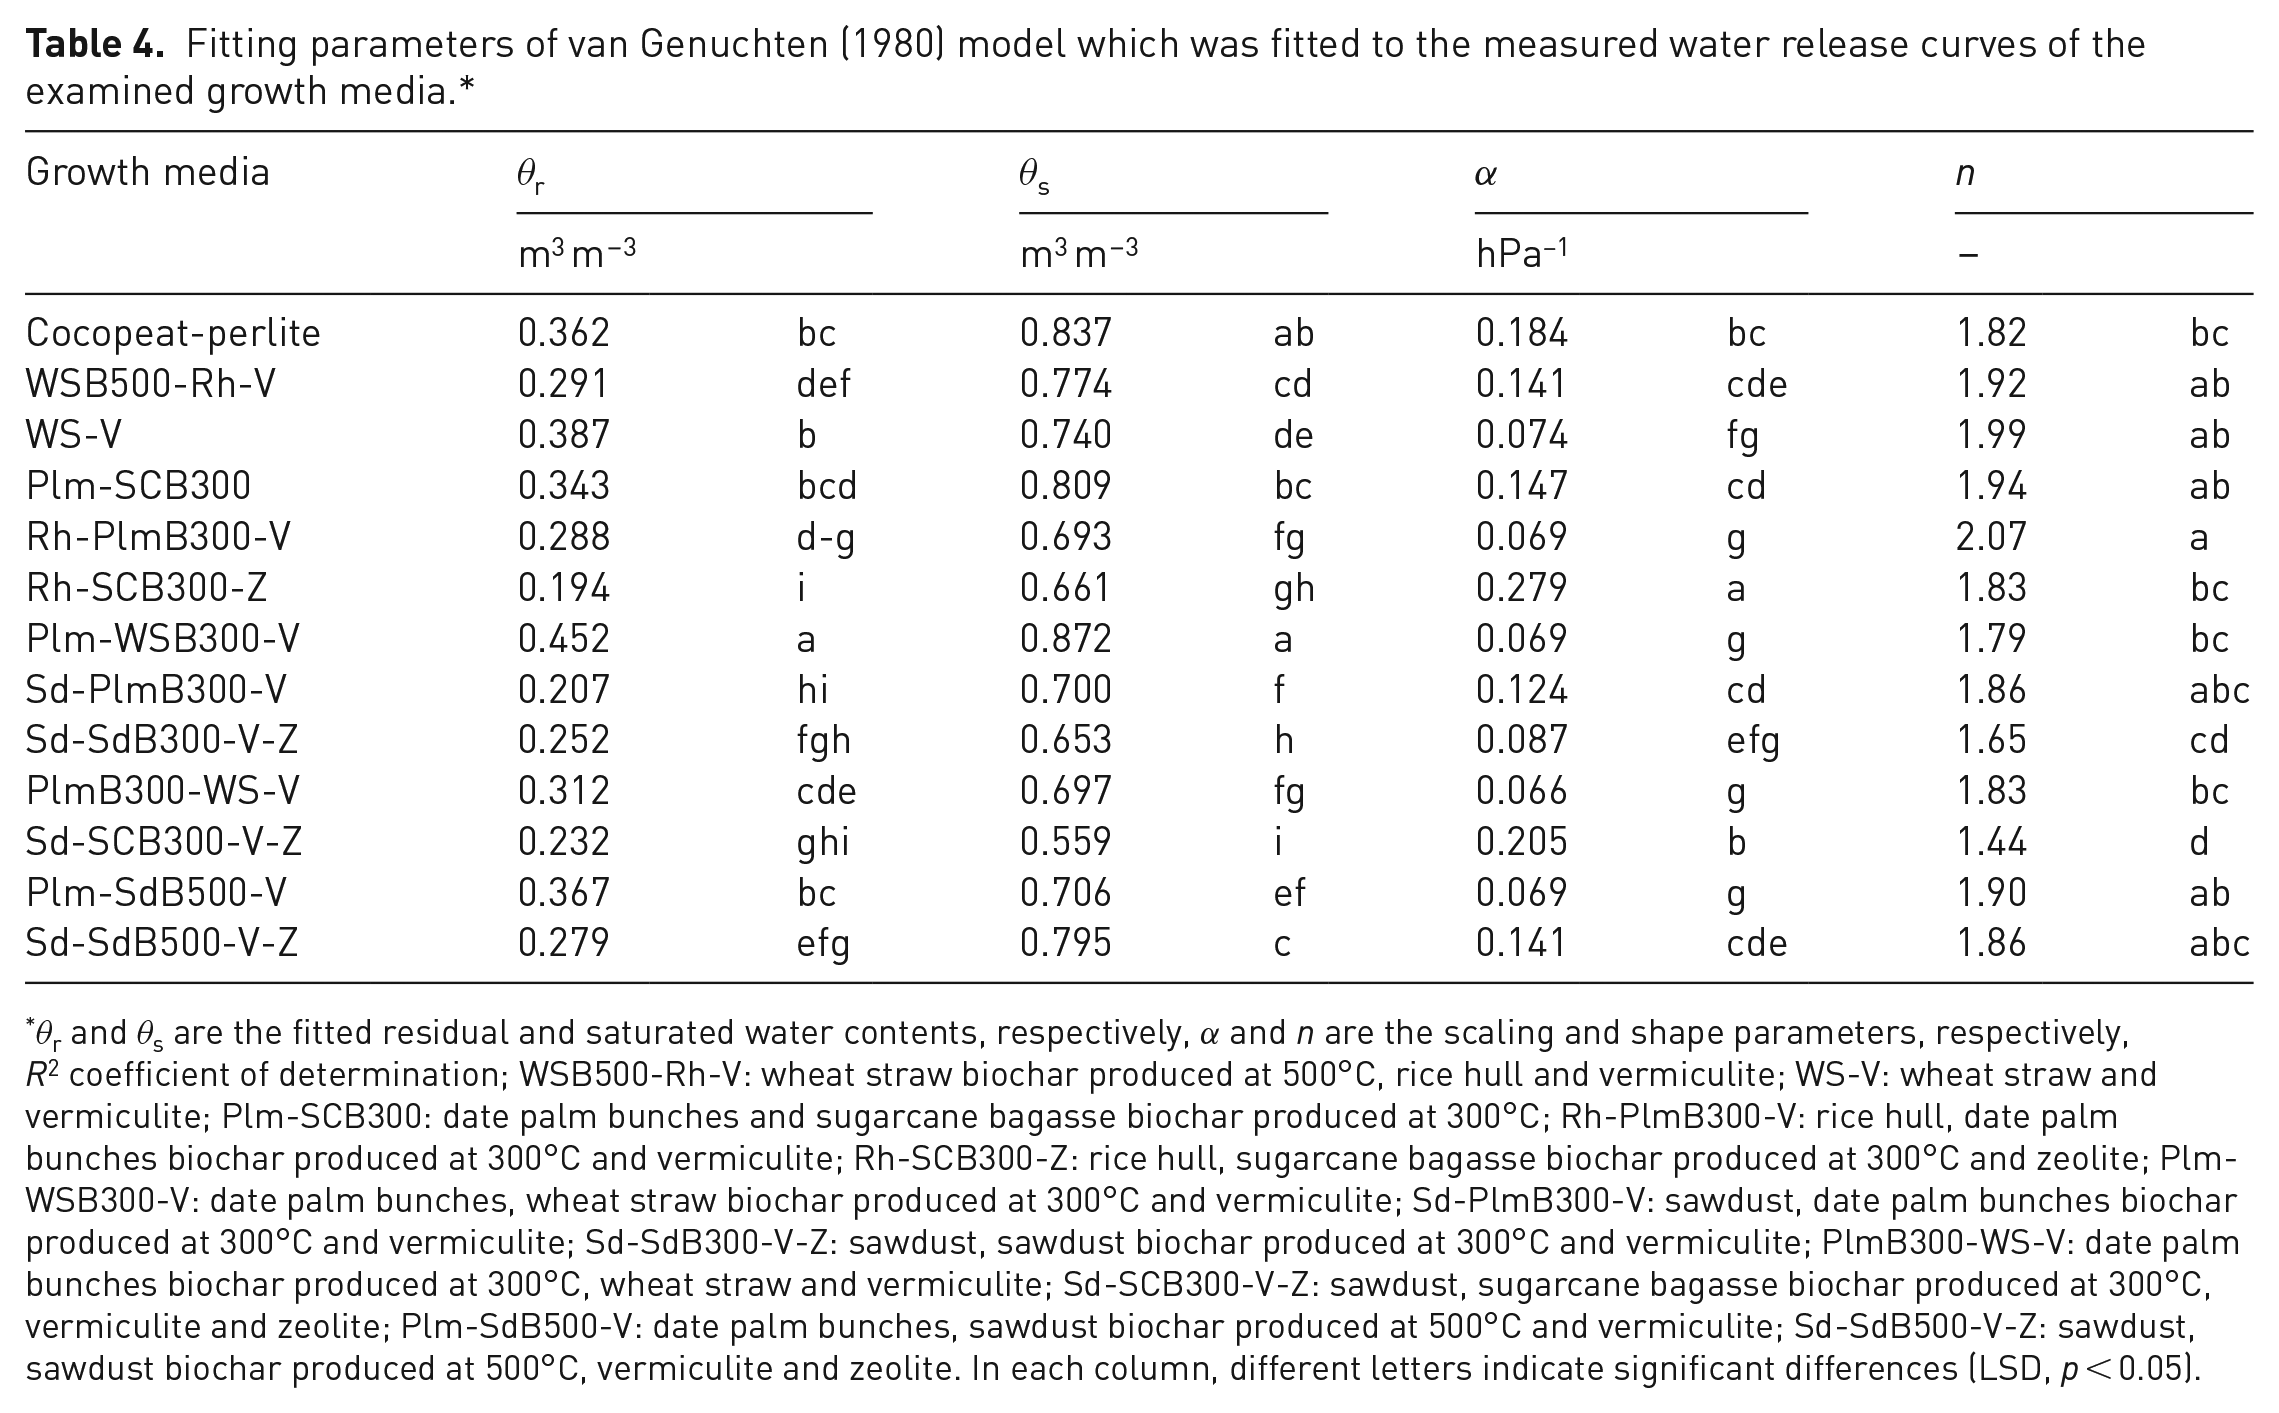
θr and θs are the fitted residual and saturated water contents, respectively, α and n are the scaling and shape parameters, respectively, R2 coefficient of determination; WSB500-Rh-V: wheat straw biochar produced at 500°C, rice hull and vermiculite; WS-V: wheat straw and vermiculite; Plm-SCB300: date palm bunches and sugarcane bagasse biochar produced at 300°C; Rh-PlmB300-V: rice hull, date palm bunches biochar produced at 300°C and vermiculite; Rh-SCB300-Z: rice hull, sugarcane bagasse biochar produced at 300°C and zeolite; Plm-WSB300-V: date palm bunches, wheat straw biochar produced at 300°C and vermiculite; Sd-PlmB300-V: sawdust, date palm bunches biochar produced at 300°C and vermiculite; Sd-SdB300-V-Z: sawdust, sawdust biochar produced at 300°C and vermiculite; PlmB300-WS-V: date palm bunches biochar produced at 300°C, wheat straw and vermiculite; Sd-SCB300-V-Z: sawdust, sugarcane bagasse biochar produced at 300°C, vermiculite and zeolite; Plm-SdB500-V: date palm bunches, sawdust biochar produced at 500°C and vermiculite; Sd-SdB500-V-Z: sawdust, sawdust biochar produced at 500°C, vermiculite and zeolite. In each column, different letters indicate significant differences (LSD, p < 0.05).
Relative gas diffusivity coefficient (Dp/D0) values at h values of (a) −8 and (b) −10 hPa were derived using the Troeh et al. equation for the growth media and are shown in Figure 3. According to Caron et al. (2008), the optimum value of Dp/D0 at h of −8 hPa for greenhouse substrates is in the range of 0.010–0.015 (average 0.013). The Dp/Do must be determined at different water contents (or matric potentials) because the gas diffusion depends on the water status of the growth media (Caron et al., 2008). It is usually recommended to measure gas diffusivity at a matric potential (or water content) near the container capacity (i.e. h of −10 hPa) for assessing the aeration status of growth media (Caron et al., 2008). Based on the Dp/D0 values at h of −8 hPa, the aeration statuses of four growth media, including cocopeat-perlite, Rh-SCB300-Z, Sd-SCB300-V-Z and WSB500-Rh-V, were in the optimum range, and the other media had a much lower Dp/D0 at this h. These media had high AFP at h = −10 hPa (>0.1 m3 m−3) and a low tortuosity coefficient (Table 3). The highest values of α (the van Genuchten scaling parameter) were achieved for Rh-SCB300-V-Z, Sd-SCB300-V-Z and cocopeat-perlite (Table 4). Combining individual ingredients, including SCB300, WSB500, Plm and zeolite, with high values of AFP and n parameter (the slope of WRC) and greater/faster water release led to higher Dp/D0 at h = −10 hPa. The highest Dp/D0 (at h of −8 hPa) was observed in Rh-SCB300-Z when compared with other growth media; this medium had the highest value of van Genuchten scaling parameter α (i.e. the highest matric potential corresponding to the most-frequent pores) and AFP. The values of AFP at h = −10 hPa were highest for Rh-SCB300-Z, cocopeat-perlite and WSB500-Rh-V. Similarly, based on essential physical and chemical properties, our previous study (Banitalebi et al., 2021) indicated that biochar-based mixtures such as WSB500-Rh-V could be suitable substitutes for cocopeat-perlite. Using biochar and biochar-based media has many valuable applications for environmental issues and can be suitable substitutes in greenhouse productions.
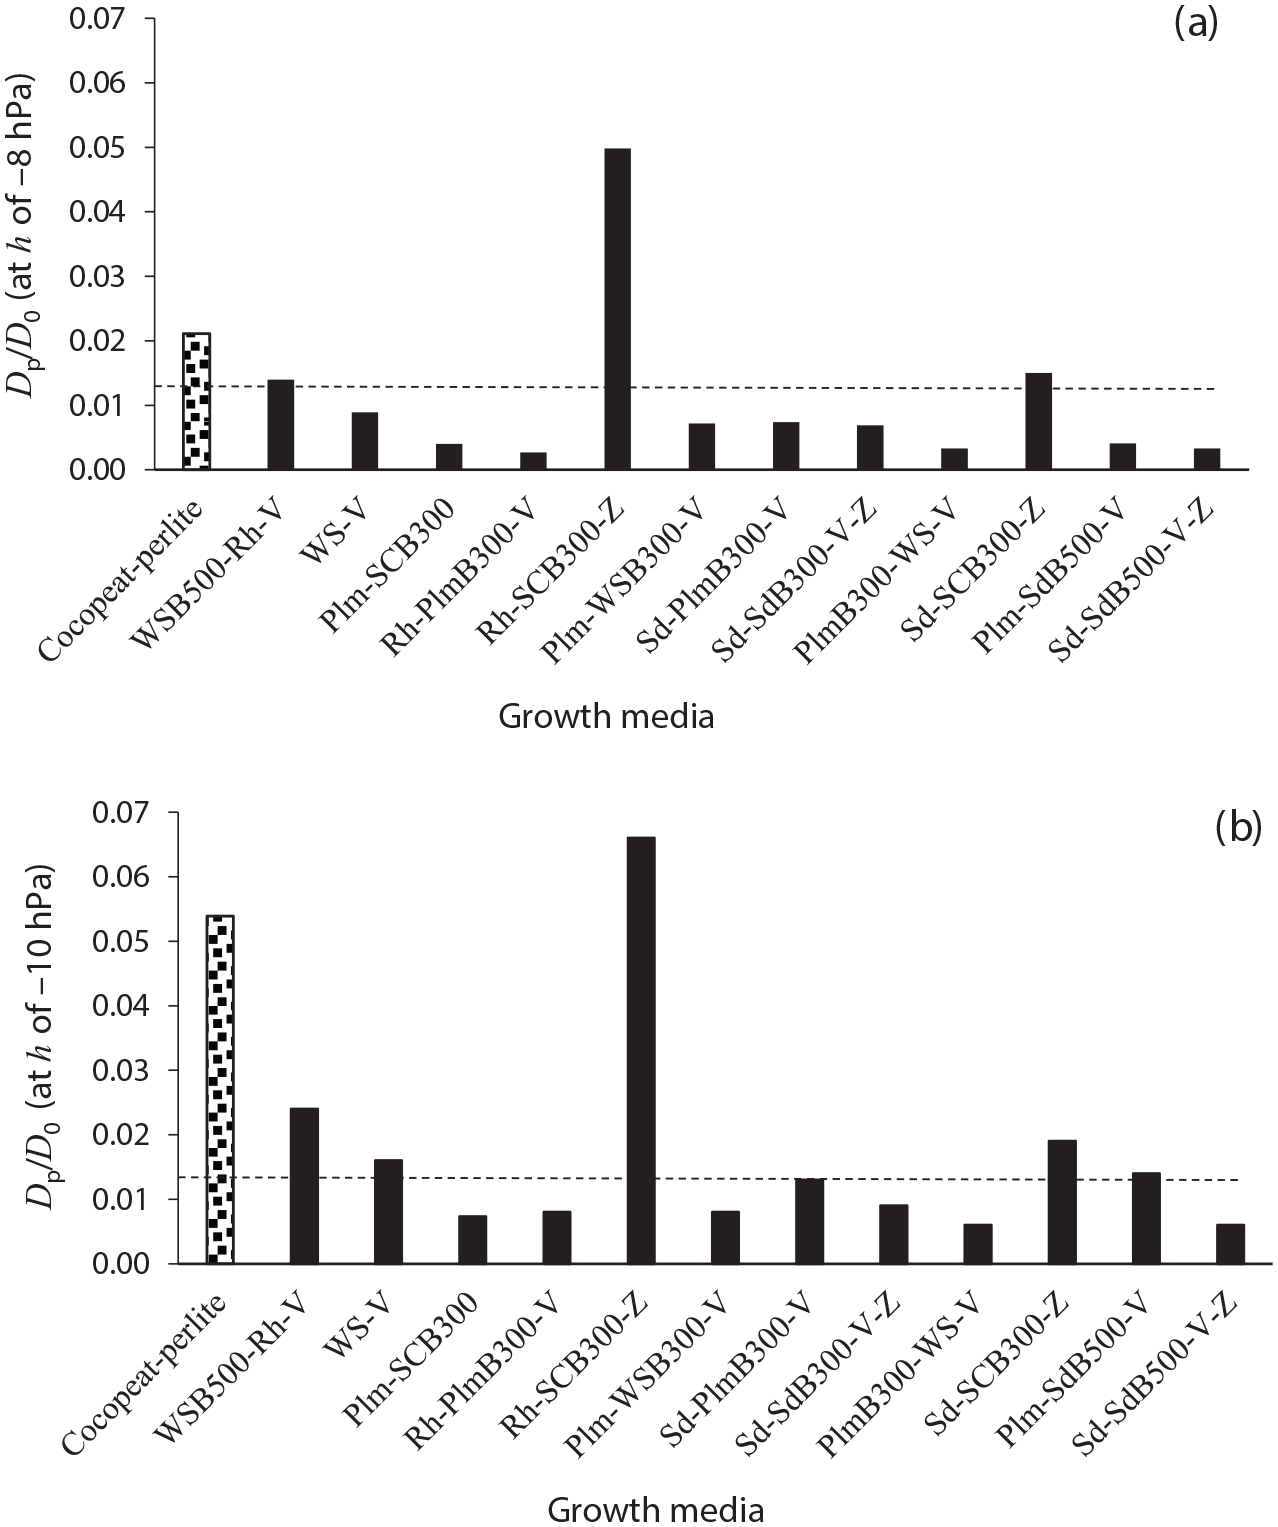
Relative oxygen diffusivity coefficient (Dp/D0) at matric potentials (h) of (a) −8 hPa and (b) −10 hPa among the growth media. The dashed line shows the optimum relative gas diffusion coefficient value (i.e. 0.013) for the growth media. WSB500-Rh-V: wheat straw biochar produced at 500°C, rice hull and vermiculite; WS-V: wheat straw and vermiculite; Plm-SCB300: date palm bunches and sugarcane bagasse biochar produced at 300°C; Rh-PlmB300-V: rice hull, date palm bunches biochar produced at 300°C and vermiculite; Rh-SCB300-Z: rice hull, sugarcane bagasse biochar produced at 300°C and zeolite; Plm-WSB300-V: date palm bunches, wheat straw biochar produced at 300°C and vermiculite; Sd-PlmB300-V: sawdust, date palm bunches biochar produced at 300°C and vermiculite; Sd-SdB300-V-Z: sawdust, sawdust biochar produced at 300°C and vermiculite; PlmB300-WS-V: date palm bunches biochar produced at 300°C, wheat straw and vermiculite; Sd-SCB300-V-Z: sawdust, sugarcane bagasse biochar produced at 300°C, vermiculite and zeolite; Plm-SdB500-V: date palm bunches, sawdust biochar produced at 500°C and vermiculite; Sd-SdB500-V-Z: sawdust, sawdust biochar produced at 500°C, vermiculite and zeolite.
Besides the four mentioned media, two growth media, including WS-V and Plm-SdB500-V, had Dp/D0 values at container capacity (i.e. h of −10 hPa) higher than the optimum range (i.e. 0.010–0.015).
Generally, AFP was greater in the mixtures with coarser substrates such as vermiculite (1–3 mm) and zeolite (1–2 mm), in agreement with Caron et al. (2005). The shape of WRCs can influence optimal oxygen diffusivity, which occurs when the AFP is in the range 0.20–0.35 m3 m−3 (Verhagen, 2011). Gas diffusivity can be linked and predicted by the shape of the WRC and saturated hydraulic conductivity (Caron et al., 2008). Growth media with high Dp/D0 (at h of −8 hPa) have high parameters of n and α of the van Genuchten (1980) model (Banitalebi et al., 2021). There was a positive correlation between aMQ and bMQ with the α parameter of the van Genuchten (1980) model (r of 0.52 and 0.62, respectively, p < 0.01). It means that growth media with high α, including Rh-SCB300-Z and Sd-SCB300-Z-V, had high Dp/D0 compared to other media with lower α at similar AFP values (Figure 2). The aMQ and bMQ coefficients also had positive correlations with AFP (at h = 10 hPa) (r of 0.73 and 0.56, respectively, p < 0.05). It indicates that media with higher AFP have larger pores, releasing water sooner/quicker at higher matric potential, and have minimum aeration problems in the wet range. For the Troeh et al. model, positive correlations were observed between μ with saturated water content (θs) and AFP (r of 0.32 and 0.56, p < 0.05 and 0.01, respectively). Plm-SCB300 and Rh-SCB300-Z had high values of AFP (i.e. 0.283 and 0.198 m3 m−3, respectively, see Banitalebi et al., 2021) and μ, and as a consequence, high values of Dp/D0 (Table 3, p < 0.05).
Particle size distribution has a vital role in the pore size distribution of the growth media and consequently, in shaping both the water release and hydraulic conductivity curves. The hydraulic properties and pore size distribution of all the studied mixtures differed, especially from cocopeat-perlite (Banitalebi et al., 2021). Caron et al. (2005) showed that the plant growth limitations imposed by large particles (>10 mm) at high matric potential might be due to their particle shape. The Dp/D0 (at h of −8 hPa) for cocopeat-perlite was high, and the highest TP was recorded in this substrate. The size distribution and arrangement of particles mainly affect the TP and aeration status. Individual substrates have different shapes, such as porous (e.g. vermiculite), spherical (e.g. perlite, sand and gravel) or threadlike structure (e.g. wood fibres, coco fibres and some plant residues). Biochar particles comprise two main structural fractions: stacked crystalline graphene sheets and randomly ordered amorphous aromatic structures (Mansoor et al., 2021). The results indicated that the combination of components with threadlike structures with biochar (such as Plm-SCB300) or a combination of threadlike, aromatic, spherical and porous structures (such as Rh-WSB500-V, and Rh-SCB300-Z) led to the production of mixtures with good aeration. The volume ratios of used components are also important and can affect the final mixture properties. In this situation, evaluating these media by considering properties such as water retention, particle size distribution and aeration status can be helpful. Therefore, it is essential to recognise substrate components that reduce pore effectiveness and are obstacles to gas diffusion. This helps growth media producers identify potential growth limitations linked to poor aeration (Caron et al., 2005).
Despite the high AFP, the Dp/D0 for the Plm-SCB300 (i.e. 0.0073) was lower than the optimum range proposed by Caron et al. (2015). This result suggests that the AFP cannot be a good indicator for evaluating aeration status. Schmitz et al. (2013) indicated that AFP is not the best aeration index in the growing media. It only describes the air storage capacity of growing media at container capacity. A quantity such as the oxygen diffusion coefficient would accurately describe the oxygen supply in the growing media. Oxygen diffusion is a critical process for root development in the growth media (Verhagen, 2011).
Conclusions
This study was carried out to investigate the aeration status of biochar-based growth media as quantified by the air content and oxygen diffusion. The AFP threshold (AFPDE) value was zero for most growth media. Although the values of AFP (as an extensive index of aeration) were greater than 0.1 m3 m−3 in some growth media, the oxygen diffusivity (Dp/D0) values (as an intensive index of aeration) were very low (near zero).
Using the AFP of 0.1 m3 m−3 as a criterion may not adequately quantify the aeration status of greenhouse growth media. The oxygen diffusivity (Dp/Do) may be a better indicator than AFP alone to be used by growing medium manufacturers and determine the potential problems of growth media. The Dp/Do as an aeration index should be measured and cannot be predicted solely based on the AFP. The Dp/Do must be determined at different water contents/matric potentials because this substrate property is water content dependent. The model of Troeh et al. (1982) was the best and recommended for modelling the Dp/Do versus AFP data. Based on the slope of Dp/D0 vs. AFP (i.e. μ), the media with higher μ had lower tortuosity coefficient.
Based on the optimum value of Dp/D0 for plant growth substrates at h of −8 hPa (i.e. 0.010–0.015), the aeration status of four growth media, including cocopeat-perlite, Rh-SCB300-Z, Sd-SCB300-Z and WSB500-Rh-V was in the optimum range. Biochar-based mixtures such as WSB500-Rh-V can be suitable substitutes for cocopeat-perlite.
Footnotes
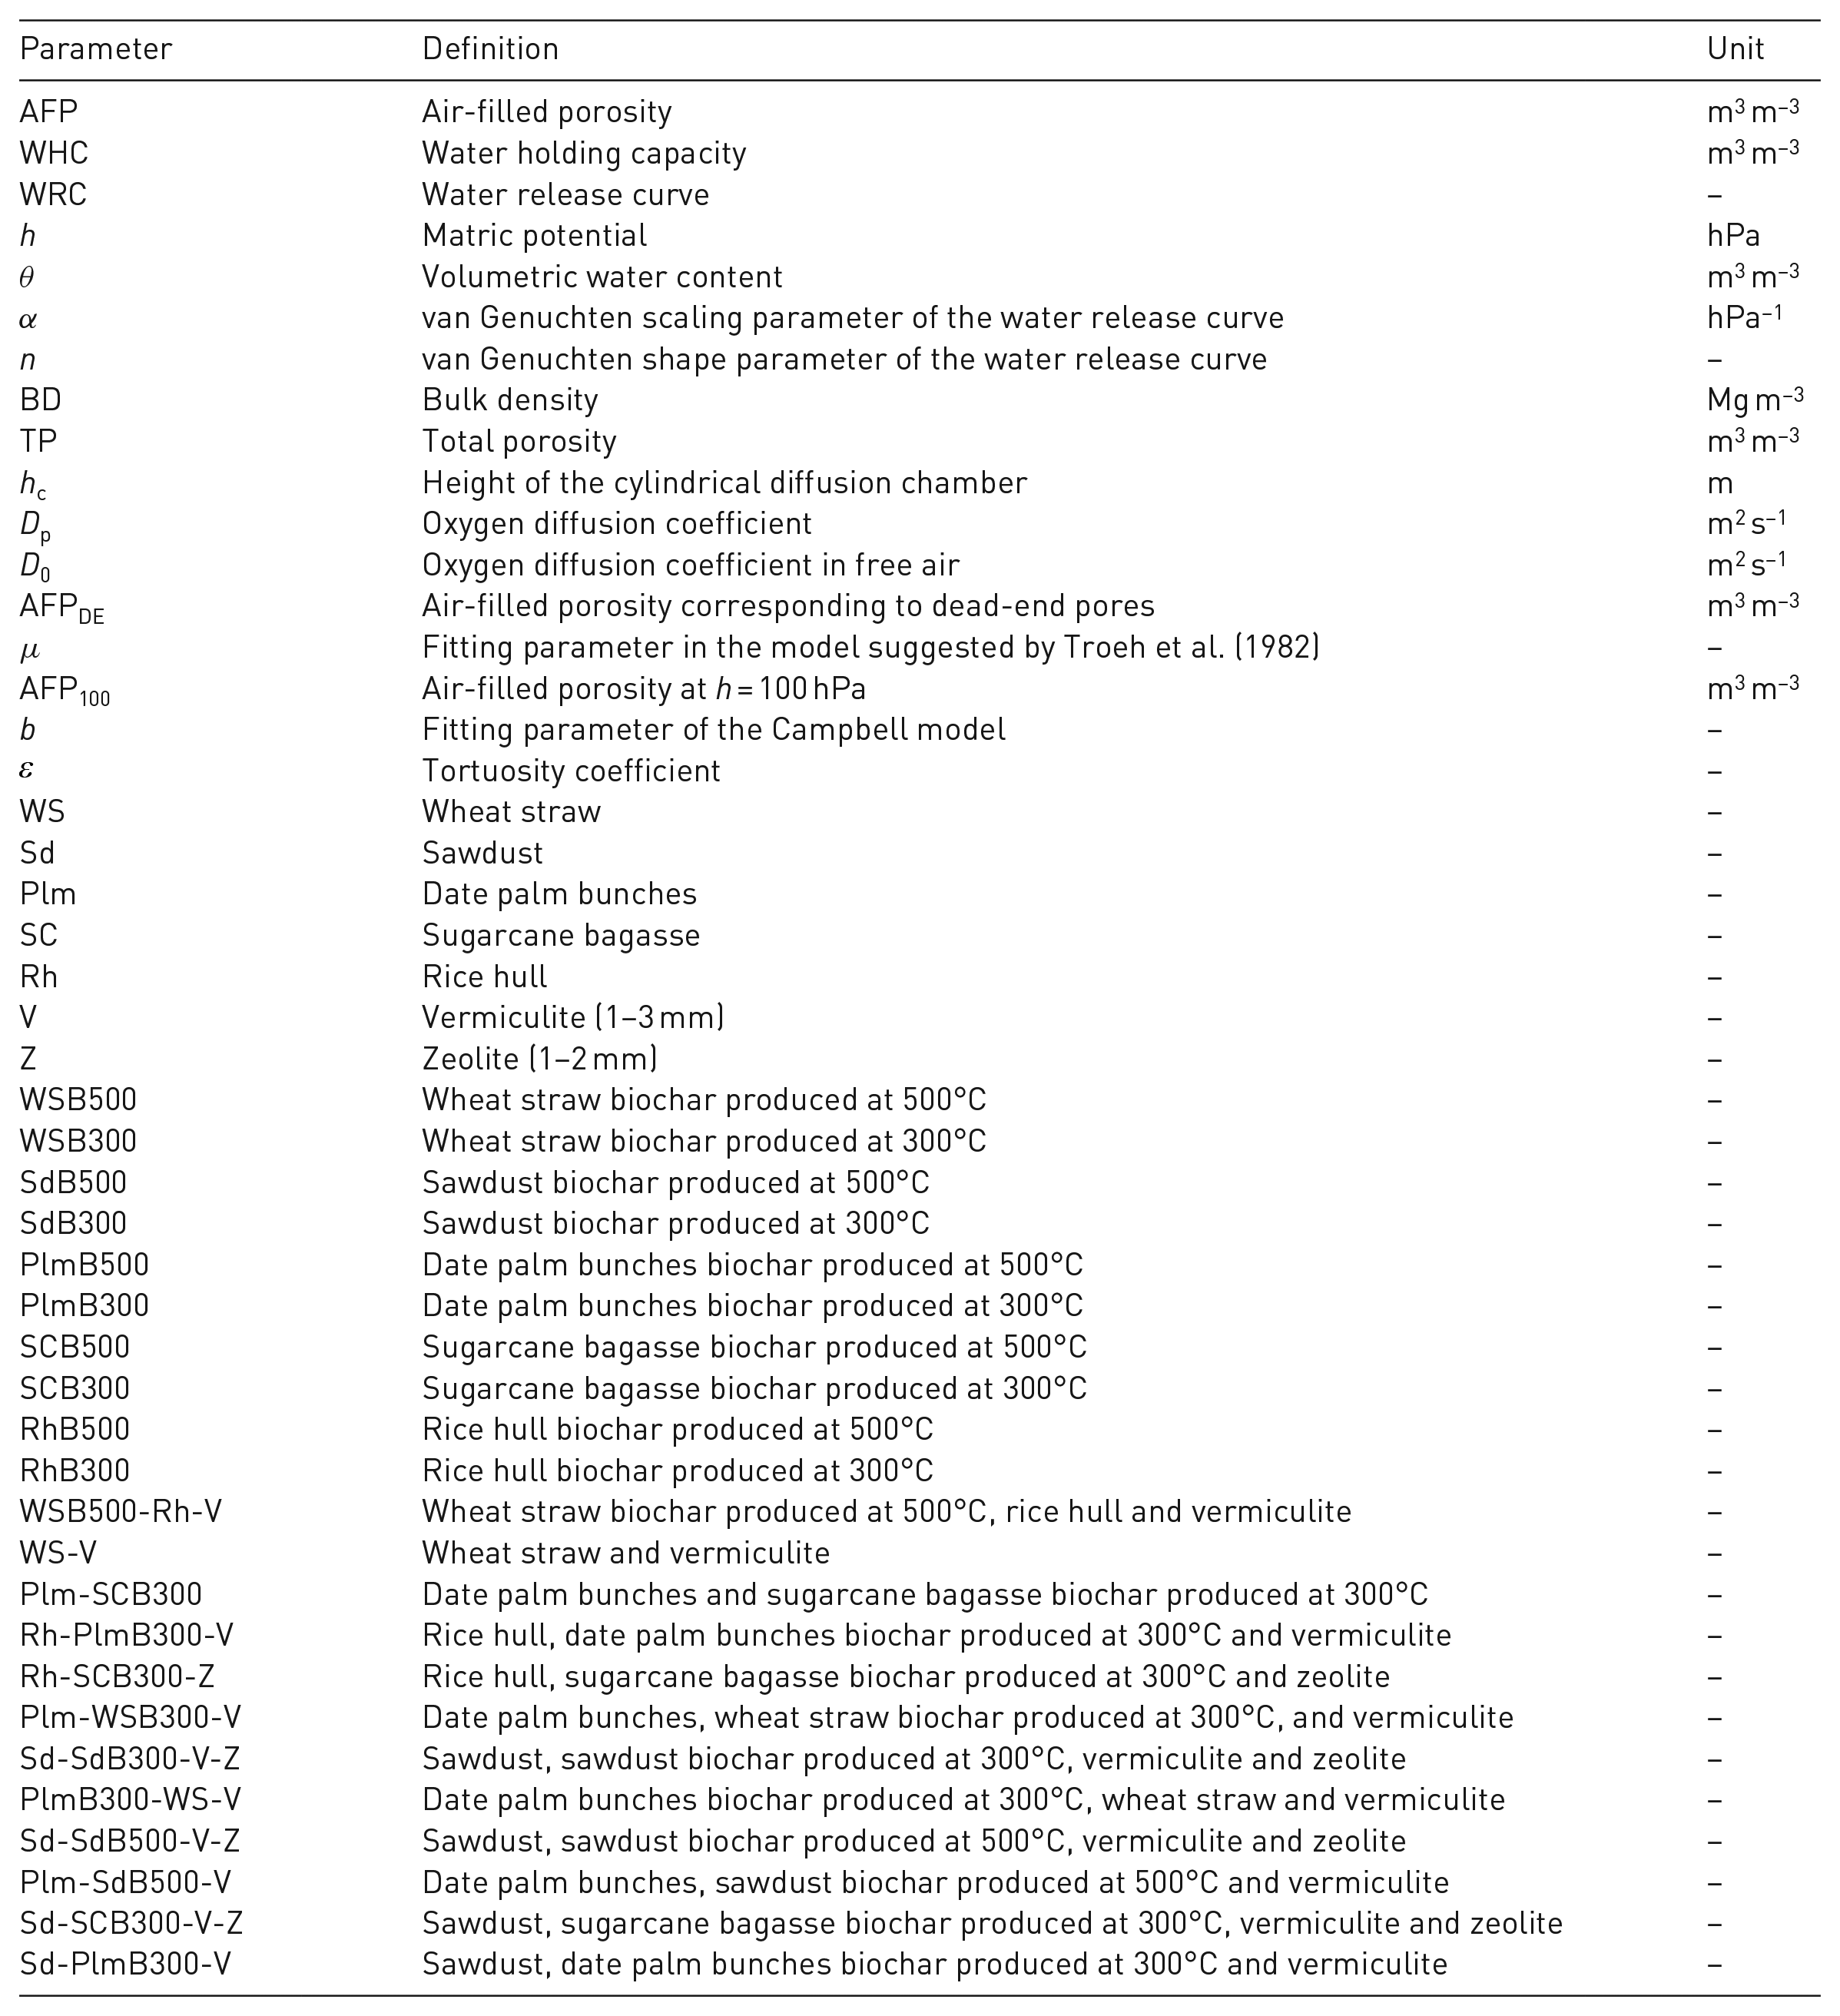
Appendix: List of symbols,abbreviations and units
| Parameter | Definition | Unit |
|---|---|---|
| AFP | Air-filled porosity | m3 m−3 |
| WHC | Water holding capacity | m3 m−3 |
| WRC | Water release curve | – |
| h | Matric potential | hPa |
| θ | Volumetric water content | m3 m−3 |
| α | van Genuchten scaling parameter of the water release curve | hPa−1 |
| n | van Genuchten shape parameter of the water release curve | – |
| BD | Bulk density | Mg m−3 |
| TP | Total porosity | m3 m−3 |
| h c | Height of the cylindrical diffusion chamber | m |
| D p | Oxygen diffusion coefficient | m2 s−1 |
| D 0 | Oxygen diffusion coefficient in free air | m2 s−1 |
| AFPDE | Air-filled porosity corresponding to dead-end pores | m3 m−3 |
| µ | Fitting parameter in the model suggested by Troeh et al. (1982) | – |
| AFP100 | Air-filled porosity at h = 100 hPa | m3 m−3 |
| b | Fitting parameter of the Campbell model | – |
| Tortuosity coefficient | – | |
| WS | Wheat straw | – |
| Sd | Sawdust | – |
| Plm | Date palm bunches | – |
| SC | Sugarcane bagasse | – |
| Rh | Rice hull | – |
| V | Vermiculite (1–3 mm) | – |
| Z | Zeolite (1–2 mm) | – |
| WSB500 | Wheat straw biochar produced at 500°C | – |
| WSB300 | Wheat straw biochar produced at 300°C | – |
| SdB500 | Sawdust biochar produced at 500°C | – |
| SdB300 | Sawdust biochar produced at 300°C | – |
| PlmB500 | Date palm bunches biochar produced at 500°C | – |
| PlmB300 | Date palm bunches biochar produced at 300°C | – |
| SCB500 | Sugarcane bagasse biochar produced at 500°C | – |
| SCB300 | Sugarcane bagasse biochar produced at 300°C | – |
| RhB500 | Rice hull biochar produced at 500°C | – |
| RhB300 | Rice hull biochar produced at 300°C | – |
| WSB500-Rh-V | Wheat straw biochar produced at 500°C, rice hull and vermiculite | – |
| WS-V | Wheat straw and vermiculite | – |
| Plm-SCB300 | Date palm bunches and sugarcane bagasse biochar produced at 300°C | – |
| Rh-PlmB300-V | Rice hull, date palm bunches biochar produced at 300°C and vermiculite | – |
| Rh-SCB300-Z | Rice hull, sugarcane bagasse biochar produced at 300°C and zeolite | – |
| Plm-WSB300-V | Date palm bunches, wheat straw biochar produced at 300°C, and vermiculite | – |
| Sd-SdB300-V-Z | Sawdust, sawdust biochar produced at 300°C, vermiculite and zeolite | – |
| PlmB300-WS-V | Date palm bunches biochar produced at 300°C, wheat straw and vermiculite | – |
| Sd-SdB500-V-Z | Sawdust, sawdust biochar produced at 500°C, vermiculite and zeolite | – |
| Plm-SdB500-V | Date palm bunches, sawdust biochar produced at 500°C and vermiculite | – |
| Sd-SCB300-V-Z | Sawdust, sugarcane bagasse biochar produced at 300°C, vermiculite and zeolite | – |
| Sd-PlmB300-V | Sawdust, date palm bunches biochar produced at 300°C and vermiculite | – |
Declaration of conflicting interests
The authors declared no potential conflicts of interest with respect to the research, authorship, and/or publication of this article.
Funding
The authors disclosed receipt of the following financial support for the research, authorship, and/or publication of this article: We would like to thank the Isfahan University of Technology for the financial support of the study. We would like to thank Prof. A.F. Mirlohi (Department of Agronomy and Plant Breeding, College of Agriculture, Isfahan University of Technology) for improving the English of the manuscript.