
Abstract
Implementation of municipal solid waste (MSW) source segregation leads to a more convenient recycle of combustible MSW components. Textiles, plastics and papers are commonly available combustible components in MSW. Their shredding is conducive to resources recovery. But these components usually have high tensile strengths and are difficult to shred. To understand their mechanical strength changes in their early pyrolysis stage will help to address this problem. In this study, a universal electronic testing machine was used to determine the breaking strengths of the materials including cotton towel, polyethylene glycol terephthalate (PET), ivory board (IB), kraft paper (KP) and wool scarf in the temperature range of 30–250°C under N2 atmosphere, and the mechanisms of their strength changes were explored. The reaction force field molecular dynamics (ReaxFF-MD) simulation was used to explain the decomposition behaviours of different sugar groups of hemicellulose in cotton and paper and the change of van der Waals energy of wool during their early pyrolysis stages. The results showed that breaking strengths of all the combustible MSW components reduced as the temperature increased. The breaking strength of PET was found to have the highest descent rate with increasing temperature, then the descent rates of wool and cotton came as the second and third, respectively. Compared with cotton, the breaking strengths of KP and IB decreased more slowly. As the temperature increased, the breaking strength of cotton reduced mainly due to the decomposition of the glucuronic acid in hemicellulose, and the reduction was characterized by CO2 release. The breaking strength reduction of PET was caused by its molecular chain being relaxed. The breaking strength reduction of wool was firstly caused by the decrease in the van der Waals energy between its molecules, and then caused by molecular chain breaking. In addition, in order to understand the influence of material size on the breaking strength change during thermal treatment, the breaking strengths of cotton yarn bundles were correlated with their yarn number and temperature. This study lays the foundation for understanding changes in mechanical strengths of combustible MSW components during their early pyrolysis stage.
Keywords
Introduction
Municipal solid wastes (MSWs) are currently generated in a huge amount of 1.9 billion tonnes annually in the world, and it was predicted to reach 3.4 billion tonnes (Nanda and Berruti, 2021) by year 2050. China is advocating MSW source segregation collection, which provides a prerequisite for wastes recycling and utilisation (Qureshi et al., 2020). During source segregation collection, the MSW are classified into four categories including dry wastes (mainly consisting of combustibles), wet wastes (kitchen wastes and rotten fruits), recyclables and hazardous wastes. The energy contained in the combustible MSW components (CMSWCs) can be recovered through pyrolysis, gasification and producing a refuse derived fuel or a solid refuse fuel. All these alternatives to incineration are cleaner and more efficient. Size reduction and homogenisation of the combustible wastes are necessary for all these recovery methods and important to improve pyrolysis products (Mlonka-Mędrala et al., 2019). Moreover, size reduction is important to prevent twining and blocking in a screw conveyer for shipping MSW. Most of the CMSWCs including plastics, textiles and paper tend to induce entanglement and blockage in a shredder, conveyer or a reactor, especially for textiles (Campuzano et al., 2019). For example, the keratin contained in wool has a high mechanical strength. The elastic modulus of keratin ranges within 1~4 GPa (Chou and Buehler, 2012). The Young’s modulus and tensile strength of polyethylene glycol terephthalate (PET) are much higher than those of other plastics (Agunsoye and Aigbodion, 2013; Etaati et al., 2014; Fraternali et al., 2011; Mahl et al., 2017; Nonato and Bonse, 2016). Cotton towel mainly consists of cellulose and hemicelluloses. They have high mechanical strengths at the ambient temperature (Batuer et al., 2020). Textiles have high tensile strengths at the ambient temperature (Gu, 2007) too. However, when they are heated, their mechanical strengths would decrease due to molecule decomposition (Batuer et al., 2021); this phenomenon can be used to improve their size reduction or shredding technology. However, the mechanical strength data of CMSMCs are available only at the room temperature (Liu et al., 2019), few studies had been carried out at elevated temperatures, especially in the initial stage of pyrolysis treatment. Additionally, the predominant component holding the highest mechanical strengths at elevated temperatures is unknown. To understand the changes in mechanical properties of CMSWCs during the early pyrolysis stage is necessary to optimise the pyrolysis technologies, including the shredding step.
Batuer et al. (2020) investigated the mechanical strength change of cotton in its early pyrolysis stage and proposed a correlation model between the mechanical properties of cotton and its CO2 release during the stage; it also found that the decrease in mechanical strength was caused by the decomposition of hemicellulose in cotton. Hemicellulose is a branched polymer, which is composed of glucose, mannose, xylose, arabinose and methylglucuronic acid. The hydrogen bonds between the cellulose surface and the hemicellulose branched sugars such as glucuronic acid and arabinose can enhance the strength of the cell wall (Silveira et al., 2013). Hemicellulose branched sugars are also closely related to the mechanical strength of cellulose products such as cotton and paper. Yang et al. (2007) observed that more CO2 emitted from hemicellulose than that from cellulose in the early pyrolysis stage. But pyrolysis mechanism of hemicellulose-branched sugars has not been studied in detail and the causes for CO2 emission are not fully understood; and definite support to the correlation of CO2 emission with the mechanical strength changes is still pursued. A simulation method combining the reaction force field (ReaxFF) and molecular dynamics (MD), namely, ReaxFF-MD developed by Van Duin et al. (2001), can be used to describe the fracture and formation of molecular bonds in a complex system such as pyrolysis system, providing the hope to explore the mechanism of CO2 emission from hemicellulose and proving the correlation between CO2 and the mechanical strengths.
Wastes’ size is another important factor influencing their mechanical strength. Compared to the thickness alone, the relationship between a single fibre and its bundle represents a more comprehensive size change, as the change in fibre number of textiles can change the thickness and width of the textiles at the same time. Batuer et al. (2020) investigated the influence of the cotton fibre number on the mechanical strength of cotton at the ambient temperature and provided the correlation formula; similar relationship for the wool fibres has been set up also at room temperature (Yu et al., 2003). However, none reports are available at elevated temperatures, which is more important for understanding mechanical changes of CMSWCs in the early pyrolysis stage.
In this article, firstly, the changes in mechanical strength of typical combustibles including cotton, PET, textiles and paper, which determine the mechanical strengths of the CMSWCs, will be studied at their earlier pyrolysis stages to find the predominant component that corresponds to the highest mechanical strengths. Secondly, the influence of wastes’ size on their mechanical strength is investigated at elevated temperatures and relationship will be set up using cotton as an example. Thirdly, the reason or mechanism for the mechanical strength changes will be explored for each individual component.
An electromechanical universal testing machine instrumented with a furnace for increasing the temperature was used to apply uniaxial tensile loads to waste samples including cotton, PET, ivory board (IB), kraft paper (KP) and wool at the temperature range of 30–250°C in this article. The tensile strength is linked with the volatile compounds emitted from Thermogravimetric analysor coupling with Fourier-Transform-Infrared (TG-FTIR) spectroscopy analysis and ReaxFF-MD simulation is adopted to investigate the mechanism for the mechanical strength changes. The relationship between the cotton yarn number on the breaking strength of cotton fibre is adopted to provide a comprehensive understanding on the influence of waste size.
Materials and methods
Materials
The CMSWCs samples used in the experiments including wool scarf, PET, IB, KP, cotton towel and yarn made from 100% cotton were prepared from daily sundries. To explore the influence of size on the mechanical strengths when the temperature increases, the cotton yarn as a convenient sample was used. Its thread density dtex, namely, mass of 10,000 m of the yarn, was measured according to the ASTM D1577-07 (ASTM, 2018).
All of the clean CMSWC samples were shredded into fragments less than 2 mm. Their approximate analysis was performed according to standard ASTM D3172-13 (ASTM, 2013) and their volatiles’ content (V), moisture content (M), ash content (A) and fixed carbon content are shown in Table 1. Their ultimate analysis was performed according to ASTM D5373-08 (ASTM, 2008), the results are also shown in Table 1.
Properties of typical CMSWCs.
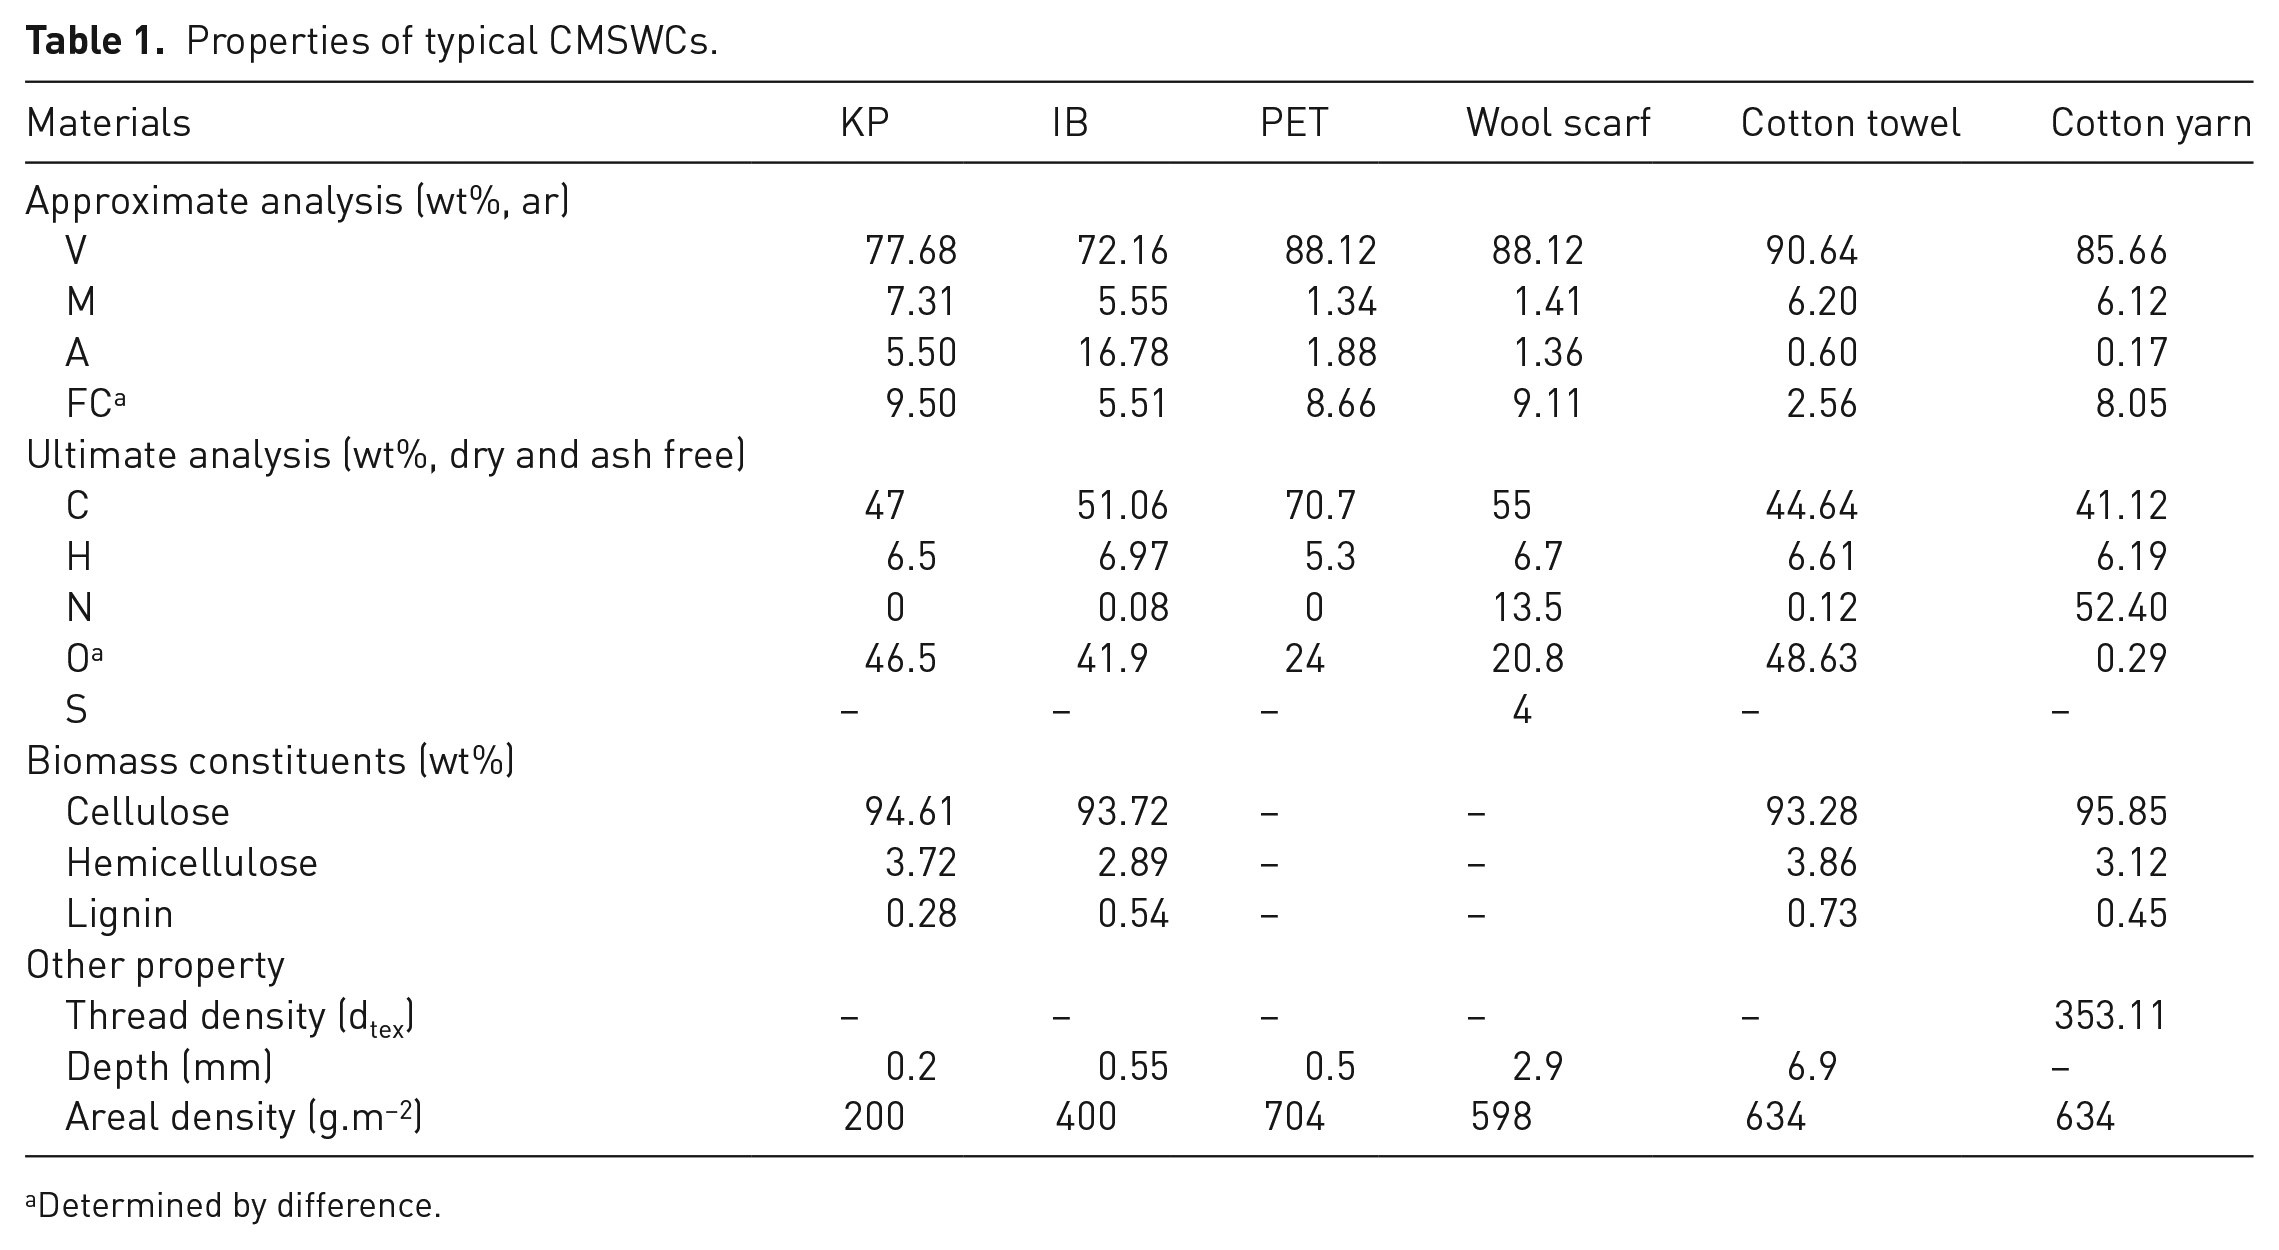
Determined by difference.
Uniaxial tensile test
The experimental setup used in this article is similar to that reported by Batuer et al. (2020). An a CTM2100 type electromechanical universal testing machine (Xieqiang Instrument, China) was equipped with a furnace and three pairs of thermocouples to monitor the temperatures. The apparatus was used to apply uniaxial tensile loads to the waste samples within the temperature range of 30–250°C under N2 atmosphere. Under isothermal conditions, after the temperature difference between the three thermocouples was kept within 3°C, the tensile tests were then carried out. The tests included two groups. The purpose of the first group was to obtain the breaking strengths of different dry waste components including wool scarf, PET, cotton towel, IB and KP. The samples were prepared in a slice of 120 mm × 25 mm by length × width, but their thicknesses were different. Although there were differences in their thickness dimensions, their length and width dimensions remained the same. The samples were clamped with a pair of clamps at both ends, and the distance between the upper and lower clamps was controlled to be 75 mm. The samples were heated from the room temperature to 30, 50, 70, 90, 110, 130, 150, 170, 190, 210, 230 and 250°C at a heating rate of 20°C/min. N2 gas was charged into the heating furnace, and its flow rate was kept at 1 L/min to maintain an inert atmosphere. The temperature was held for more than 10 minutes at the desired level to ensure a uniform temperature distribution inside the sample, after that the tensile load was applied to the sample. Therefore, the heating rate of the sample did not affect the final results. The load and the corresponding strain were recorded simultaneously during the test.
The cotton products usually had high tensile strengths, but their sizes varied greatly. The products having different sizes had different tensile strengths. Therefore, the purpose of the second group of tests was to compare the tensile strengths of cotton yarn bundles of different numbers. Different quantities of standard cotton yarns (1, 2, 4, 6, . . ., 20, 30, 40, . . ., 100) were heated at a rate of 20°C/min from the ambient temperature to elevated temperatures (30, 100, 150, 200 and 250°C). The tensile loads were applied to test their breaking strengths at different temperatures. The frequency of tensile stretching was the same as that in the first group of tests.
TG-FTIR experiments
TG-FTIR experiment was designed to study the release behaviours of small molecule volatiles from cotton, IB and KP in their early pyrolysis stages (30–250°C), so that the changes in mechanical properties could be related to the volatiles’ emission behaviours. A STA409 C/PC-type thermogravimetric analyser (TGA, NETZSCH, Germany) was used with argon as a carrier gas at a flow rate of 20 mL/min and a heating rate of 10°C/min. The sensitivity of the TGA was less than ±0.1 mg, and the temperature accuracy was ±0.5°C. The initial sample mass in the crucible in the TGA was 30 ± 0.5 mg. The buoyancy and weight reduction effect of the crucible were calibrated before the experiment. The real-time identification of volatiles was performed with a Nicolet TM iSTM 10 type FTIR spectrometer (Thermo Fisher Scientific, USA) coupled to the TGA with a transfer pipeline whose temperature was maintained at 215°C to prevent condensation. The absorption bands were in the range of 4000–650 cm−1 with a 4 cm−1 resolution.
ReaxFF-MD simulation
Pyrolysis simulation of hemicellulose glycosyl branches
Chen et al. (2017) simulated the pyrolysis process of hemicellulose with ReaxFF-MD, but the hemicellulose monomer model they established had only one conformation, and no CO2 was generated in the early-stage pyrolysis with this conformation. Glucuronic acid and arabinose have important impacts on mechanical strength (Silveira et al., 2013). To explore the reason for CO2 generation during pyrolysis of hemicellulose, glucuronic acid and arabinose were selected to represent hemicellulose in this article. The co-pyrolysis of 50 glucuronic acids and 50 arabinose molecules was simulated using ReaxFF-MD. The model contained 2150 atoms, 50 glucuronic acids and 50 arabinose molecules. The model had a density of 1.11 g/cm3 after geometric optimization, annealing calculation, compression and decompression. Due to the large number of atoms, the pyrolysis simulation would take a long time; to speed up ReaxFF-MD simulation, researchers usually adopted a method of increasing the reaction temperature. For example, Zhao et al. (2018) used a temperature above 2000 K for their isothermal simulation of polycarbonate pyrolysis. In this study, the pyrolysis of glucuronic acid and arabinose were simulated at 1500 K, and other parameters used in the ReaxFF-MD simulation comes from Mattsson et al. (2010). The NVT ensemble and periodic boundary conditions were adopted in the simulation. The time step was 0.25 fs (femtosecond). The cutoff was 0.3, meaning that when the bond level is greater than or equal to 0.3, the bond is formed. The software AutoRMA (He et al., 2021) was used to process the simulation results. Based on the bond levels’ information and trajectory files, the detailed information and the sources of molecules were detected to further understand the chemical reactions.
Simulation of wool pyrolysis
The main component of wool scarf was keratin, which contained many cystine residues. The dimer of keratin formed tetramer through disulphide bonds. Chou and Buehler (2012) constructed a tetramer model with the disulphide bonds cross-linking each other. They also developed an ordinary dimer model. They found that the tetramer model with the disulphide bond cross-linking gave higher strength and toughness. In this study, the non-isothermal pyrolysis simulation was conducted at 50–280°C with a heating rate of 1 K/ps (ps: picosecond) using the aforementioned tetramer keratin model (Chou and Buehler, 2012). The balancing and calculation methods the same as those used for hemicelluloses. Density of the keratin model after balancing was 1.09 g/cm3. The change in the keratin van der Waals energy was analysed after the simulation.
Results and discussion
Change in mechanical strength of CMSWCs with temperature
The breaking strengths of KP, IB, cotton towel, PET and wool scarf under different temperatures are shown in Figure 1. A strength ratio change is provided in Figure 1(b), here the strength ratio is defined as the ratio of breaking strength at a certain temperature to the breaking strength at 30°C.
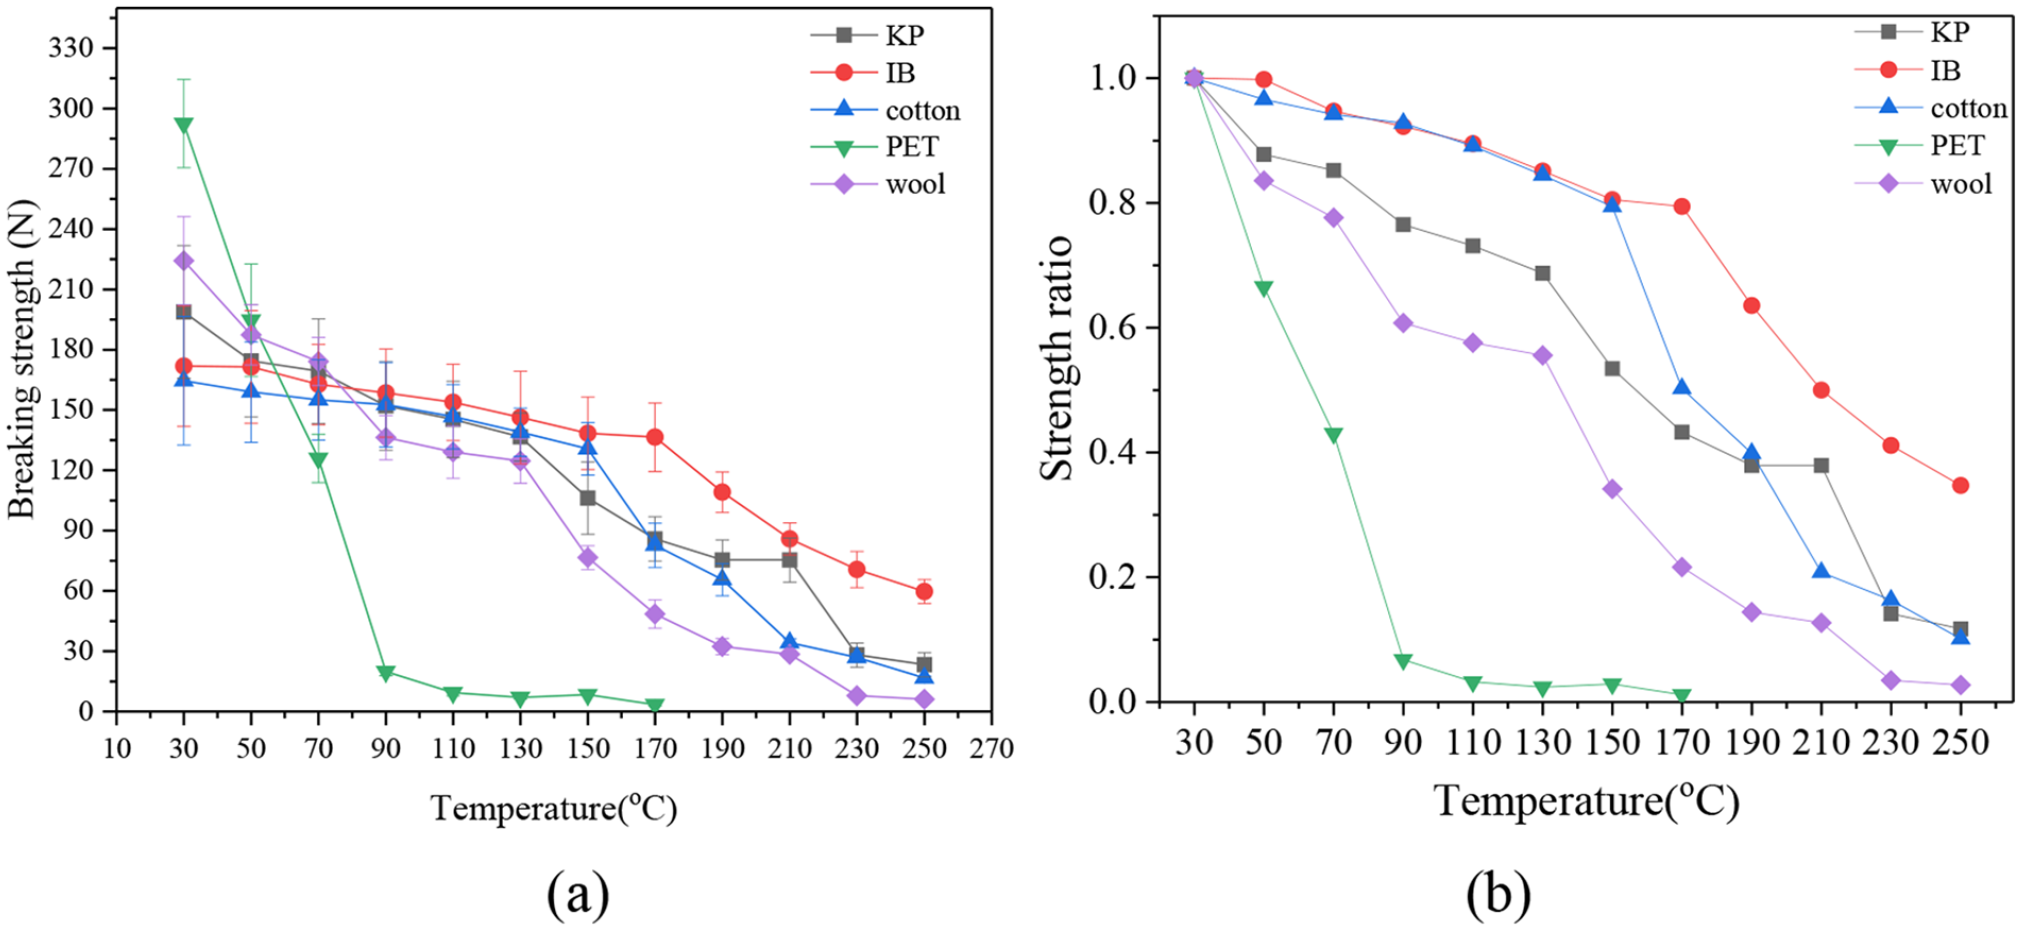
Breaking strengths and strength ratios of typical CMSWCs. (a) breaking strength and (b) strength ratio.
It can be seen that all of breaking strengths decreased with temperature. When the temperature reaches 250°C, the tensile strengths of these components decrease to very low levels. Therefore, the temperature range of 30–250°C is reasonable for investigating the changes in the tensile strengths of CMSWCs. As the temperature increases, the tensile strength of PET decreases sharply, and it completely vanishes at 90°C. The tensile strength of wool scarf also decreases quickly and vanishes at 230°C. The changes in the tensile strengths of cotton towel, KP and IB have a similar pattern: at the beginning their tensile strengths decrease slowly and then decrease more quickly after 130–150°C. Even at 250°C the IB paper still retains approximately 40% of its original tensile strength at the ambient temperature. Cotton and the KP paper also keep residue tensile strengths at 250°C as shown in Figure 1(b). Although cotton is much more difficult to be shredded than paper, Figure 1 shows that paper has a higher tensile strength than cotton does. In the screw conveyor where transportation is constrained by the tensile strength, paper can generate a big problem. The tensile strengths of these five components cannot be directly compared each other because their cross-sectional areas are different.
Figure 1(b) shows that as the temperature increases, the tensile strength reduction rates ranks in a sequence of PET, wool, KP, cotton and IB from fast to slow. If these CMSWCs are shredded at the ambient temperature, the strong tensile strengths of PET and wool require much energy consumption. However, if they are shredded at an elevated temperature (e.g. greater than 150°C), the energy consumption can be greatly reduced. Especially, above 170°C only the residue tensile strength of IB needs to be overcome so that the power requirement of the shredder of the wastes can be greatly reduced.
Changes in breaking strengths of yarn and its bundle at elevated temperatures
The breaking tensile strengths for a single cotton yarn and its bundle with different yarn numbers have been tested. The results are shown in Figure 2.
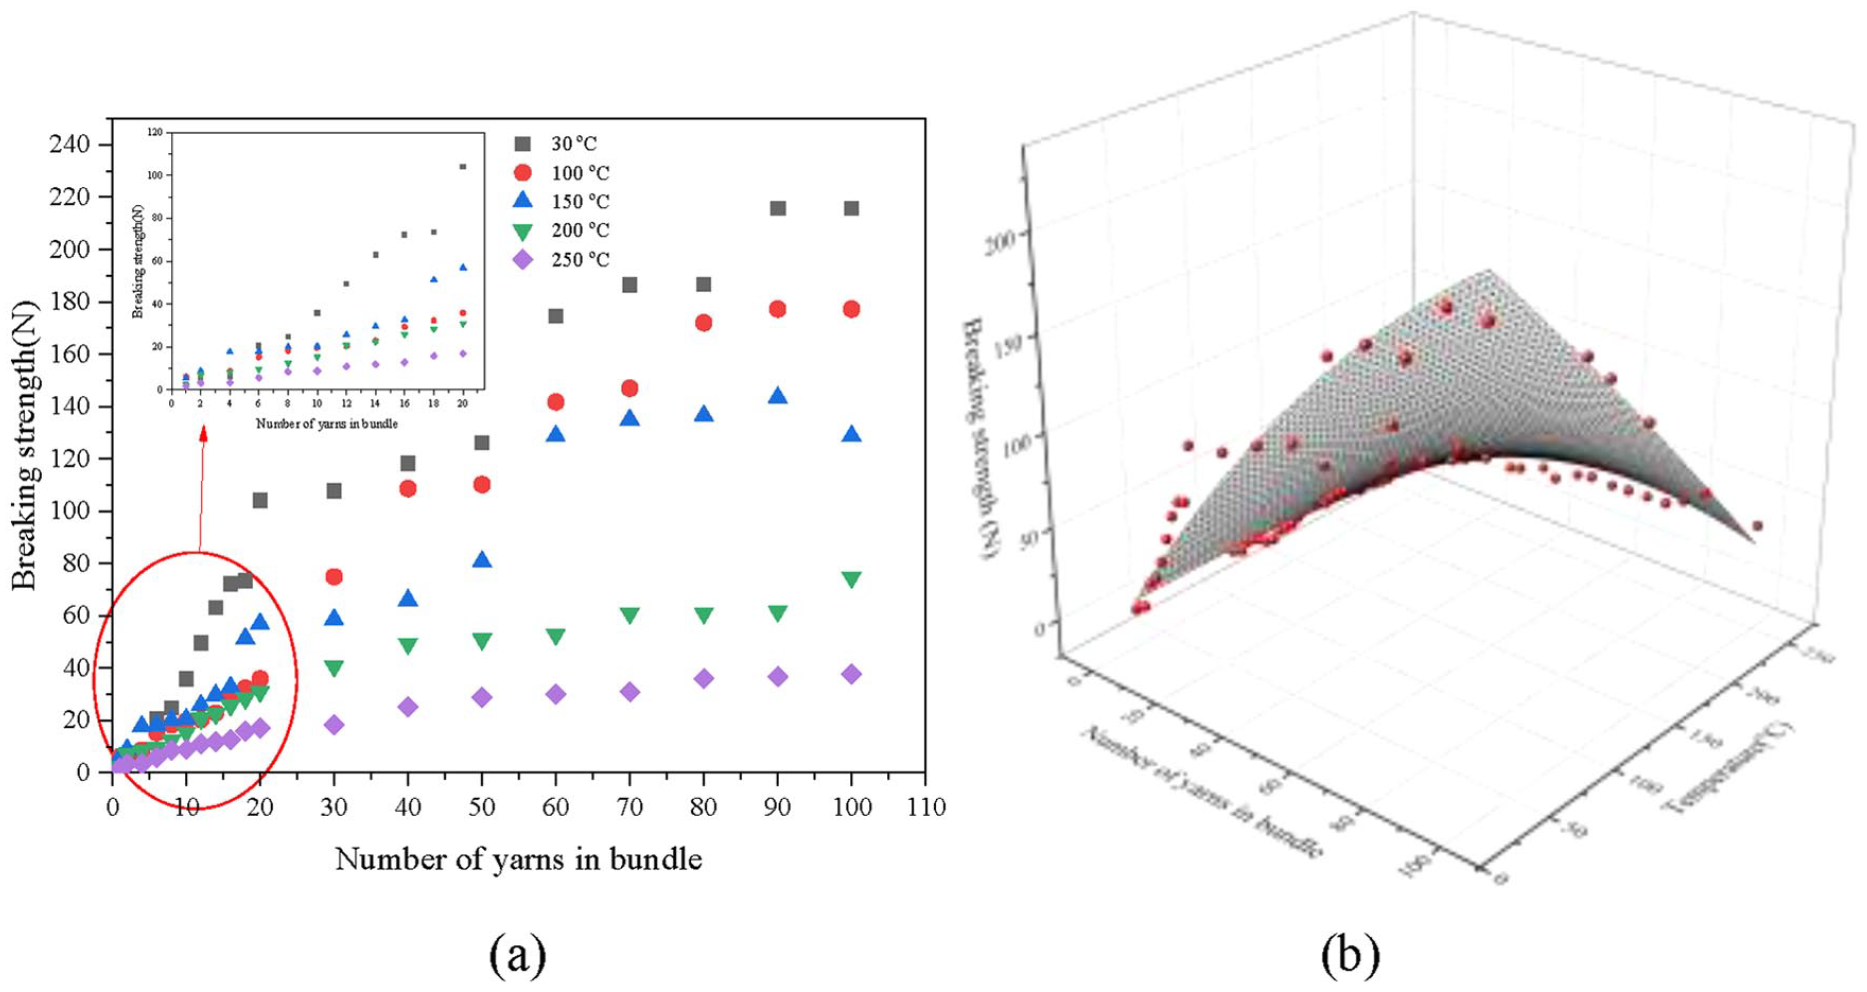
Breaking strengths of cotton yarn and its bundle at different temperatures. (a) scatter plot and (b) response surface plot.
Figure 2 shows that the breaking tensile strengths of the bundles reduced at the higher temperatures. The breaking strengths of the yarn bundles increases nonlinearly with yarn number at a constant temperature. When the yarn number is less than 20, the breaking strength difference is not significant as the temperature increases. However, as the yarn number is larger, the difference becomes greater as the temperature increases, especially in the range of 150–200°C. The breaking strength reduction may be due to the onset of decomposition of hemicellulose and cellulose beyond 150°C. When the temperature is higher than 200°C, the breaking strength of the yarn bundles decreases dramatically due to the decomposition of hemicellulose and cellulose in cotton. Based on the data shown in Figure 2, a correlation has been established between the breaking strength of the cotton bundles, temperature and yarn number, as shown in equation (1):
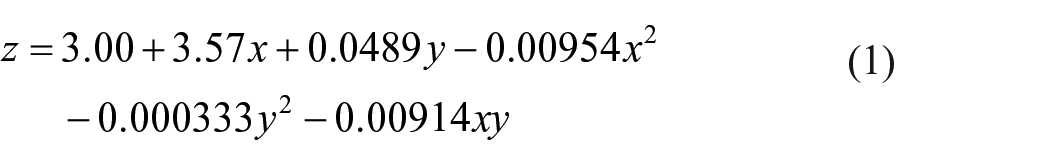
where
Mechanism analysis on tensile strength changes of cotton products
TG-FTIR analysis
The data in Table 1 shows that cotton, IB and KP mainly consist of cellulose, hemicelluloses and a small amount of lignin. Figure 1 shows that the cotton products’ breaking strengths begin to decrease quickly at approximately 150°C. As the temperature is higher than 200°C, the breaking strengths all decrease to very low levels. TG-FTIR analyses can explain the reasons for the decreases in break strengths. Figure 3(a)–(c) shows that CO2 appears in the FITR spectra with a wavenumber of 2347 cm−1 (Yao et al., 2017) and is the most abundant gas emitted below 250°C. CO appears around a wavenumber of 1725 cm−1 (Yao et al., 2017) and grows considerably only when the temperature is higher than 300°C. The H2O vapor emitted without a regular rule.
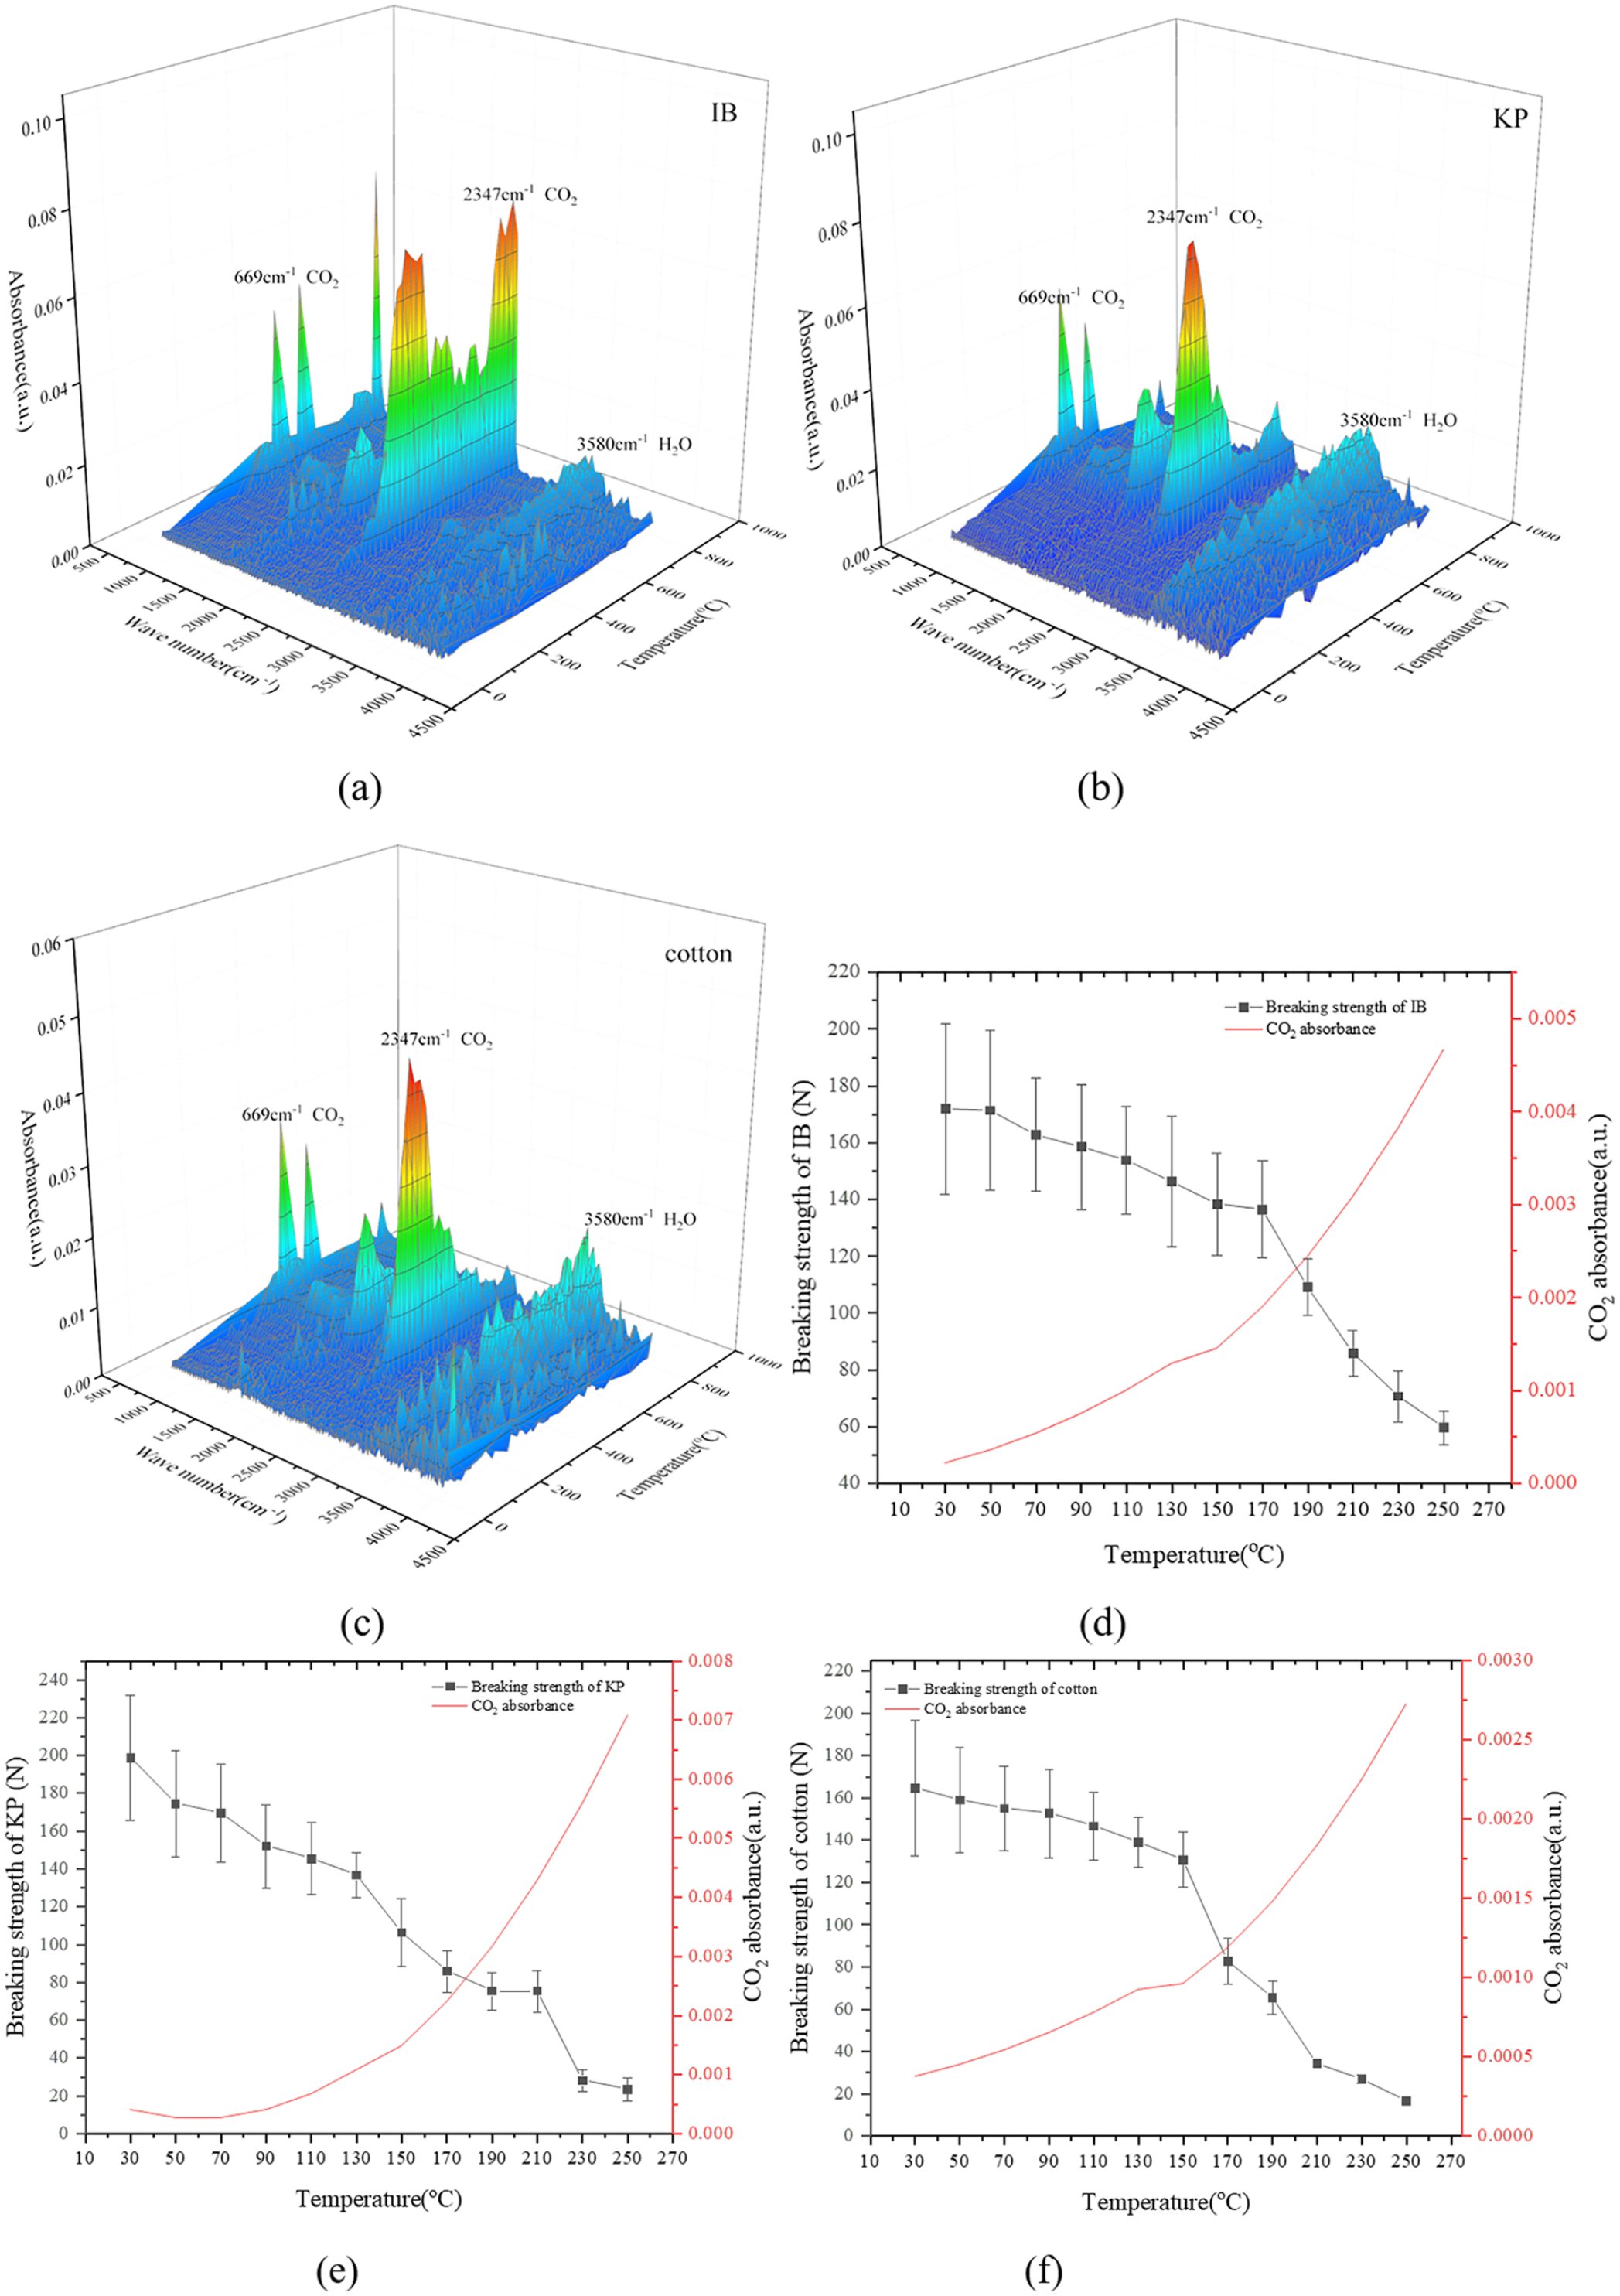
Volatiles’ FITR analysis results of IB (a), KP (b) and cotton (c) at their earlier pyrolysis stages and the relationships between their breaking strengths and CO2 absorbance (d–f).
The decreases in breaking strength are closely related to CO2 emission. As shown in Figure 3(d)–(f), the CO2 absorbance in the FTIR spectra of cotton, IB and KP increases steadily while their breaking strengths decrease. Especially, when the temperature is higher than 150°C, the CO2 absorbance increases faster and the breaking strength decreases more quickly. It can also be deduced that the reasons for the breaking strength decrease are the same for cotton, IB and KP because their relations between the CO2 absorbance and the breaking strength are similar. Therefore, the reaction causing CO2 emission is the cause for the strength decrease. It was reported that the glucuronic acid in the hemicellulose began to decompose beyond 150°C (Zhao et al., 2017), and the amorphous cellulose decomposed when the temperature reached 200°C (Zhang et al., 2018) with hydrogen bond fracture happening (Leng et al., 2018; Wang et al., 2013). Therefore, the decomposition of hemicellulose occurs first at the early pyrolysis stage and its decomposition may destroy the structure of the fibres. Data in Figure 1 also prove that the breaking strengths of cotton, IB and KP start to decrease before 150°C. So, decomposition of hemicellulose is more important than that of cellulose at the early pyrolysis stage although its content is low. To prove the effects of these potentially relevant reactions, decompositions of the hemicellulose branches including glucuronic acid and arabinose are investigated via the ReaxFF-MD simulation.
ReaxFF-MD simulation of hemicellulose branches
Decomposition behaviours of typical hemicellulose components are simulated with the ReaxFF-MD method. It is found that glucuronic acid and arabinose are the compounds producing CO2, and they are important branched sugar of hemicellulose. Figure 4 shows the decomposition reactions of glucuronic acid and arabinose during their co-pyrolysis. The decomposition of glucuronic acid is much faster than that of arabinose. Most importantly, CO2 and H2O are the main products, and this fact is consistent with the results shown in Figure 3. At the beginning, the generation of CO2 and H2O is almost the same. After 60 ps the generation of H2O is much faster. This fact is because glucuronic acid produces the same amount of CO2 and H2O, whereas arabinose only produces H2O. Tracing of their atomic traces indicates that only glucuronic acid decomposes at the beginning, and the decomposition of arabinose starts after 60 ps and only produces H2O. This is the reason why the CO2 emission almost stops after 60 ps due to the almost completion of glucuronic acid decomposition while H2O increases steadily. Therefore, it is believed that CO2 comes from glucuronic acid decomposition, and this finding is consistent with Zhou et al.’s (2019) report. It is then concluded that the breaking strength decreases is mainly caused by glucuronic acid decomposition for hemicellulose.
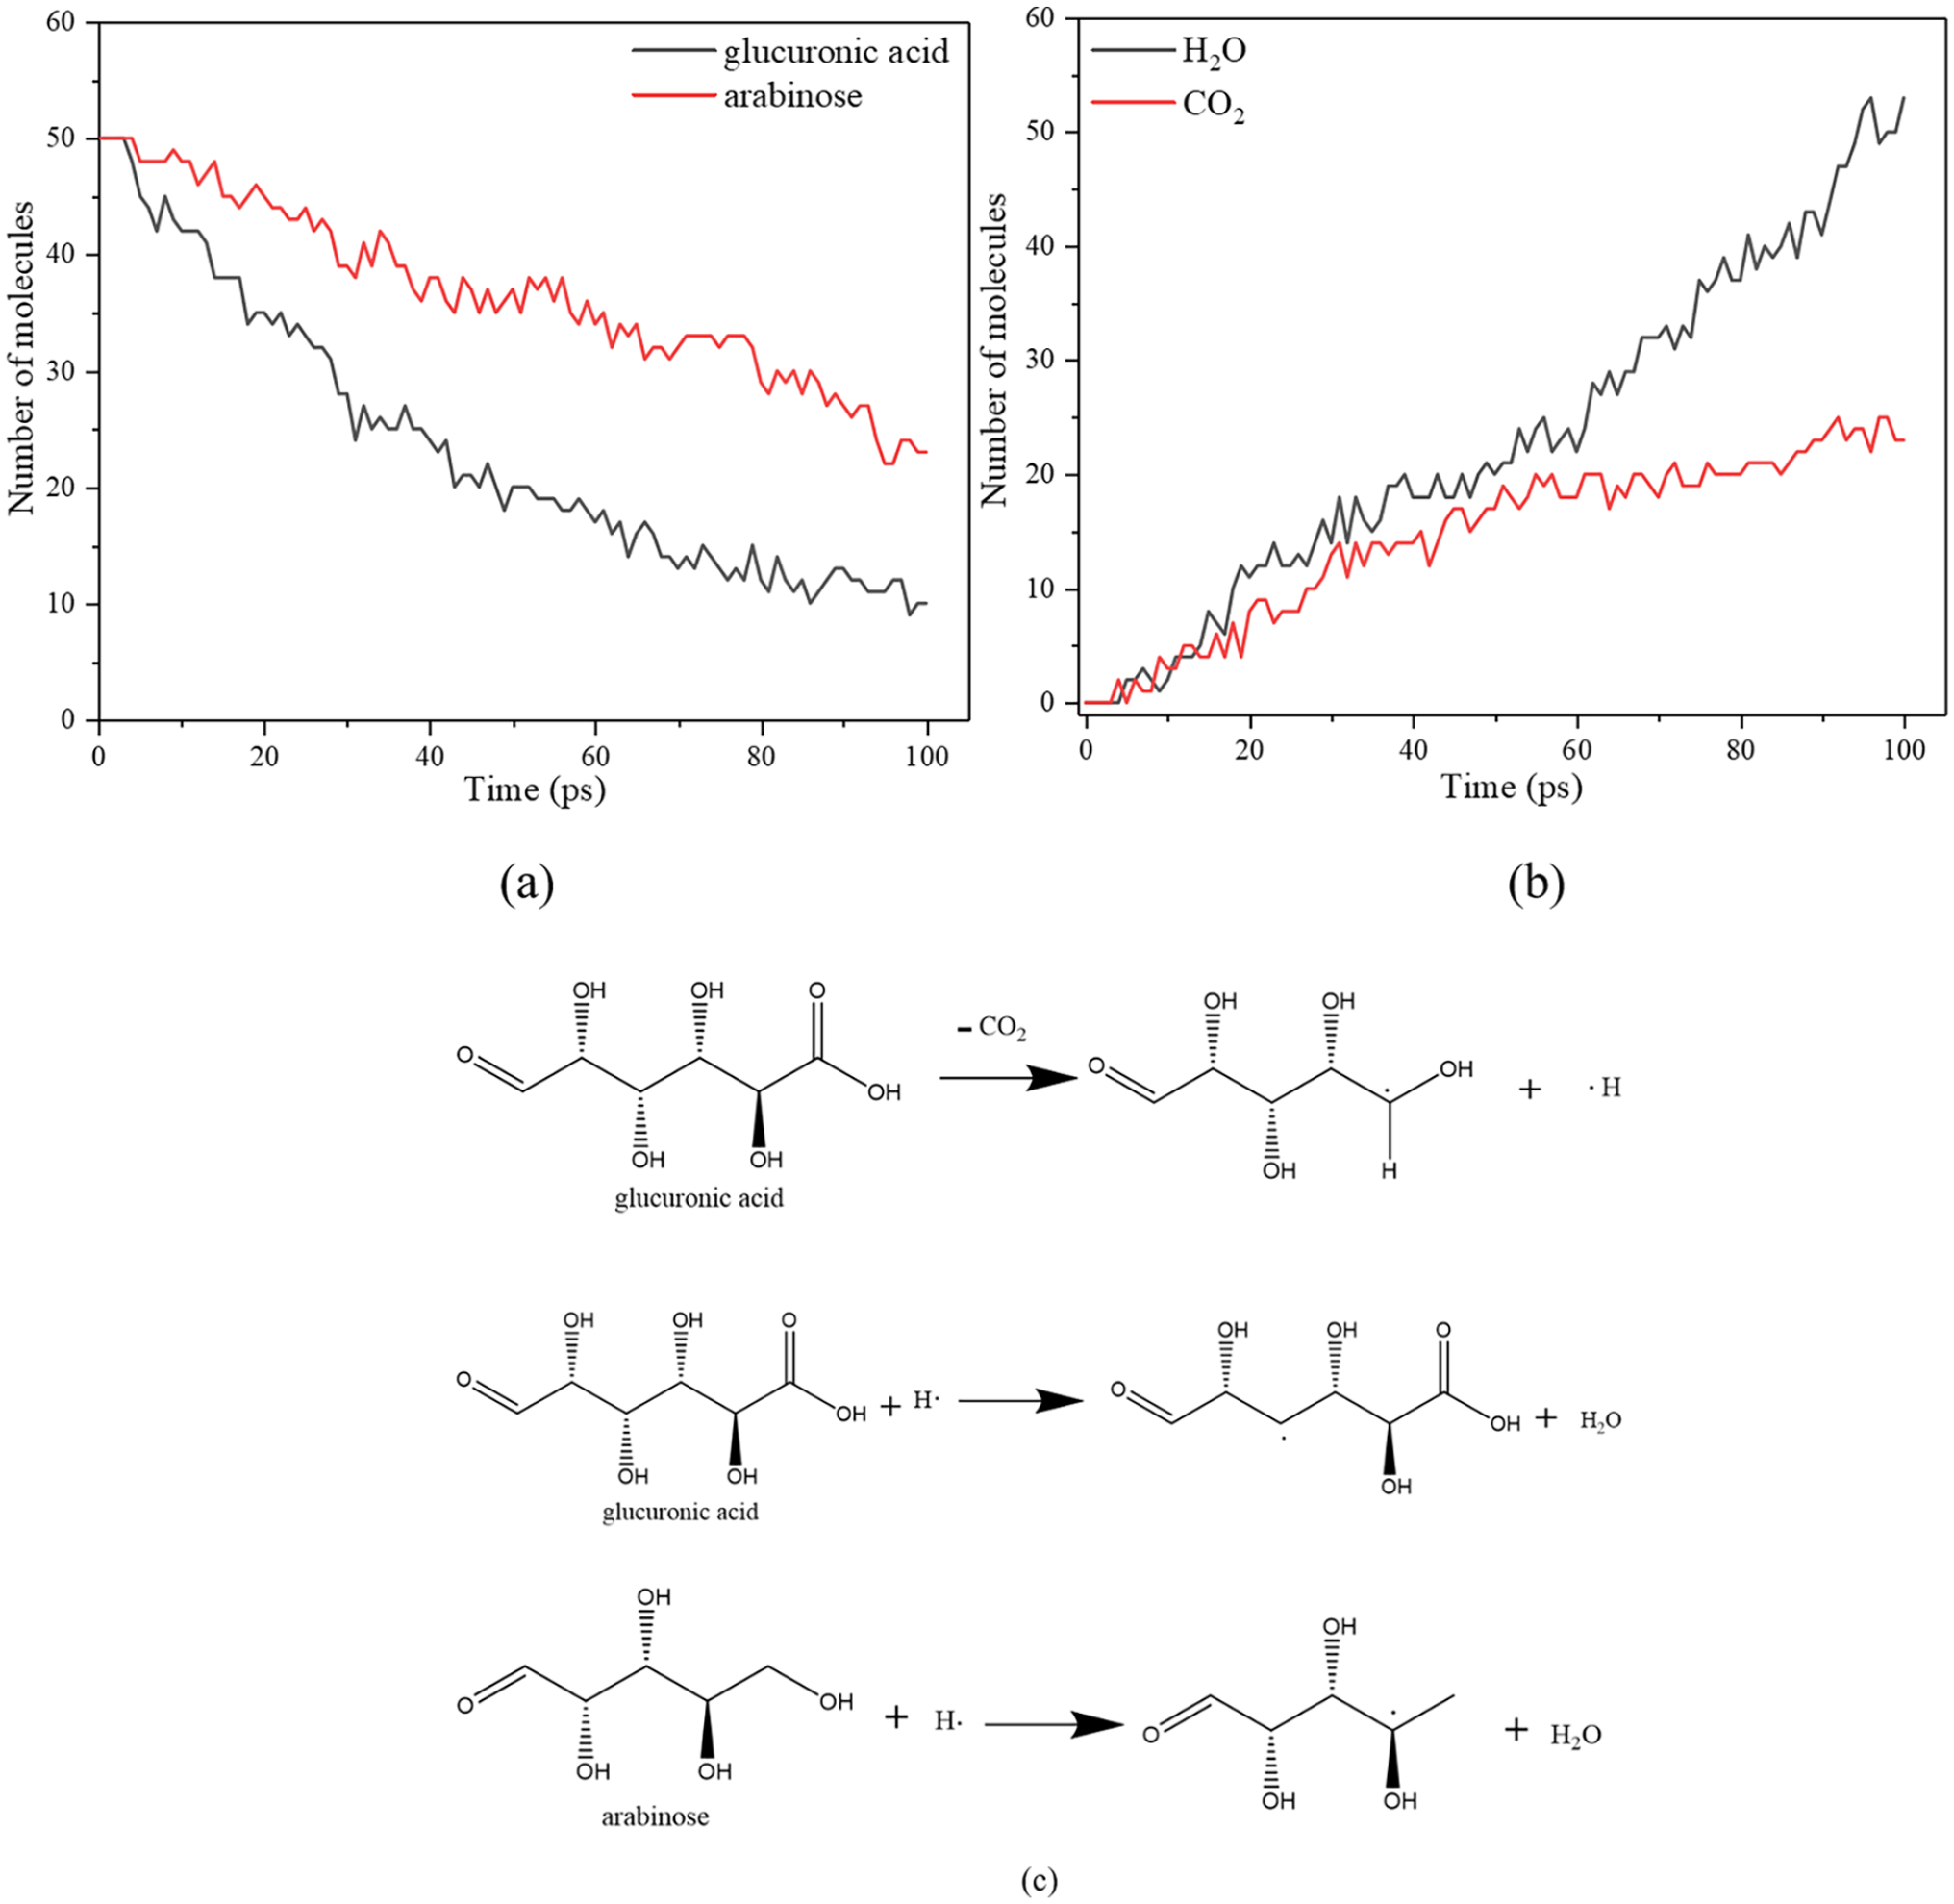
Number of molecular changes of glucuronic acid and arabinose (a) during pyrolysis and generation of CO2 and H2O (b), their decomposition reactions (c).
It should be noted that the hydroxyl groups are broken randomly. According to the ReaxFF-MD simulation results, the arabinose is more likely to break at the end of the chain. However, it is easier for the glucuronic acid decomposition to break in the second hydroxyl near the aldehyde group. This analysis explains the reason why the glucuronic acid decomposition starts earlier, and that of arabinose is slower. H2O generation consumes free radicals of H•, whereas carboxyl breaking in glucuronic acid generates CO2 and H• radicals. The H• radicals enhance the decomposition of both glucuronic acid and arabinose. It can be concluded that the CO2 emission mainly comes from decomposition of the carboxy-containing sugars such as glucuronic acid. Although arabinose could not produce CO2 at the beginning, and H2O generation is more intensive than CO2 generation, however, H2O cannot be used as an index of the mechanical strength changes due to the fact that H2O can be largely generated from evaporation of the absorbed substances and the crystal water in the materials. The amount of the evaporating water may be even higher than that of the water emitting from the decomposition. Therefore, it is difficult to correlate the H2O absorbance with the breaking strength.
Mechanism of PET’s breaking strength change
Figure 1 shows that when the temperature is at the room temperature (30°C), the PET’s mechanical strength is the highest. It decreases rapidly in the temperature range of 30–80°C. When the temperature is higher than 80°C, the PET’s breaking strength approaches to zero. At 79°C the PET’s molecular structure changed from ‘cis’ conformation to ‘trans’ conformation (Di Lisio et al., 2020), and such a change resulted in a decrease in the mechanical strength. Previous PET pyrolysis experiments (Çit et al., 2009; Kenny et al., 2008; Sovová et al., 2008) proved that its ester group broke and generated CO2 during pyrolysis. Brems et al. (2011) found through TGA experiments that the PET’s weight loss was negligible when the temperature was below 300°C. Singh et al. (2020) found from TG-FTIR experiments that the PET’s pyrolysis volatile appeared in the temperature range of 455–505°C. Therefore, it could be deduced that the decrease in the PET’s mechanical strength was not caused by decomposition and volatile release, rather by its molecular structure change.
Figure 5 shows the breaking strength and strain of PET as functions of temperature, where strain is defined as the ratio of elongation corresponding to breaking strength to the original length of PET. The breaking strength and the strain change in opposite trends. The PET’s breaking strength decreases to a negligible level (almost zero) at 90°C, indicating that the PET’s mechanical strength almost lost entirely after the glass transition at 79°C. Meanwhile, the PET’s strain increases greatly. The strain is related to the elastic properties of the polymer (Wang et al., 2016).
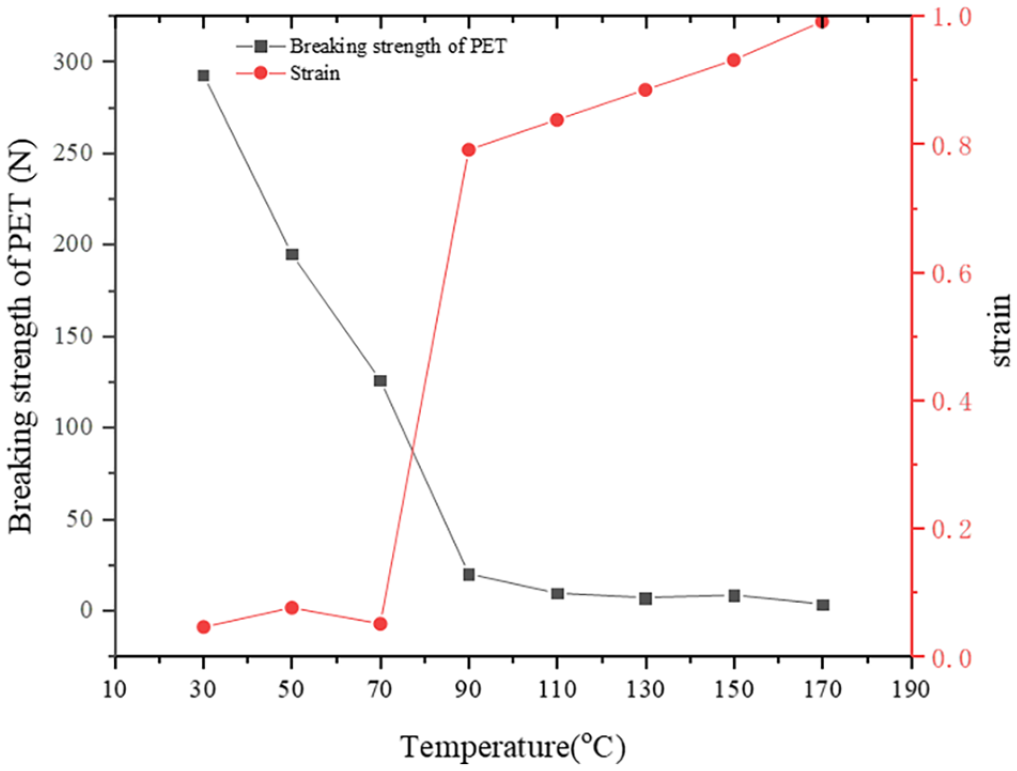
Breaking strength change and strain of PET with an increasing temperature.
The PET’s chain segments begin to move and the material shows high elasticity when the temperature reaches 90°C. Therefore, the breaking strength reduces sharply and the strain increases greatly within the temperature range of 70–90°C.
Mechanism analysis of wool’s mechanical strength change
Figure 1 shows the mechanical strength’s change as a function of temperature. Within the temperature range of 30–90°C, the breaking strength of wool decreases rapidly to 60% of its original level. When the temperature is at 90–130°C, the breaking strength decreases slowly. Then the breaking strength decreases rapidly again beyond 130°C and reaches a very low level at 230°C. Brebu and Spiridon (2011) reported that during the wool pyrolysis an ammonia gas was detected only when the temperature reached to 167°C, and then ammonia began to generate in a large amount when the temperature was around 220–230°C. Senoz et al. (2012) reported that when the wool was pyrolyzed with a heating rate of 2°C/min, the ion fragments containing disulphide bonds were detected at 180°C, then other sulphur-containing ion fragments started to appear around 190–200°C and some of them reached a peak around 230°C, which was caused by the decomposition of peptide bridges, side chains and the entire α helix structure of wool. Therefore, the change in wool’s breaking strength below 150°C had little relation with the release of the volatile matter, and it may be attributed to the change of the van der Waals force. Figure 6 shows the change in the van der Waals energy during wool’s pyrolysis at 50–280°C based on the ReaxFF-MD simulation.
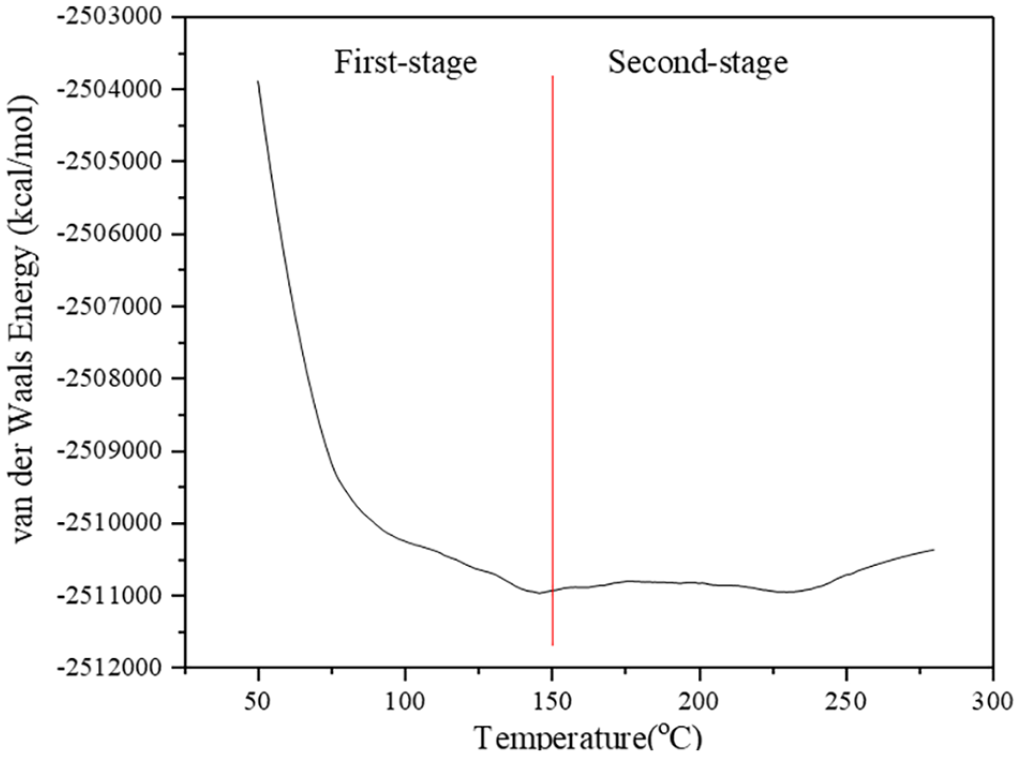
Van der Waals energy change of wool during pyrolysis.
Figure 6 shows that the van der Waal energy of wool decreases dramatically in the temperature range of 30–90°C and then it decreases slowly when the temperature reaches 150°C. That is because raising temperature leads to a fracture of hydrogen bonds and disruptions of the intermolecular forces within the wool keratin. The change in the van der Waals energy correlates well with the change in the breaking strength when the temperature increases. Therefore, wool’s strength decreases can be divided into two stages: in the first stage below 150°C, the rapid reduction in the van der Waals energy led to the wool’s strength decrease; in the second stage within 150–230°C, the wool’s pyrolysis starts and the release of the volatile matter results in further decrease in the wool’s strength. The decomposition of wool’s molecular leads to the destruction of wool’s fibre structure and the complete loss of wool’s mechanical strength, as shown in Figure 6.
Conclusions
A universal testing machine equipped with a furnace has been used to investigate the mechanical property changes of CMSWCs during their early pyrolysis stages. Their reaction mechanisms are also explored. Main conclusions can be drawn as follows.
(1) The mechanical strengths of different CMSWCs decrease when the temperature increases. The descending rate depends on the characteristics of the component material. The descent rates from fast to slow are in order of PET, wool, cotton towel, KP and IB.
(2) A correlation between the number of cotton yarn, temperature and breaking strength has been proposed based on experimental results. The correlation can be used to predict the mechanical strength of fibre wastes of different sizes at different temperatures.
(3) PET has a great mechanical strength at the room temperature. However, as the temperature increases, its breaking strength decreases rapidly and it reduces to almost zero at 90°C. Meanwhile, the PET’s strain greatly increases. These facts are due to its molecular segments becoming relaxed after its glass transition.
(4) The wool’s mechanical strength reduction is caused by the rapid decrease of the van der Waals energy when the temperature is below 130–150°C. When the temperature is above 150°C, the emission of volatiles such as NH3 and sulphur-containing ion fragments lead to the complete loss of its mechanical strength at 230°C.
(5) Cotton, IB and KP consist of cellulose and hemicelluloses. They have high mechanical strengths at the ambient temperature. Their mechanical strengths decrease more slowly compared to PET and wool when the temperature increases. When the temperature is higher than 150°C, the decreases in their breaking strengths become more significant due to the decomposition of the glucuronic acid in hemicelluloses. Moreover, the reduction in their breaking strengths is closely related to CO2 absorbance in the TG-FTIR analysis.
The above findings describe the changing behaviours of typical CMSWC’s mechanical strengths with an increasing temperature. The related mechanisms are revealed. This study provides a useful reference for improving shredding and conveying of MSW in a thermochemical process.
Footnotes
Declaration of conflicting interests
The authors declared no potential conflicts of interest with respect to the research, authorship, and/or publication of this article.
Funding
The authors disclosed receipt of the following financial support for the research, authorship, and/or publication of this article: This work was supported by the fund from Shanghai Municipal Science and Technology Commission under (Grant No. 20230712900) and Chinese national key research programme (Grant No. 2018YFC1901200).