
Abstract
COVID-19 pandemic has changed several aspects in human behaviour, whereas population mobility patterns have been strongly affected by social distancing. In parallel, changes in solid waste generation patterns have been reported worldwide. This work assessed the influence of the COVID-19 pandemic on waste generation and collection in São Paulo city, Brazil, the largest city of Latin America. Data on nine types of wastes collected between 2013 and 2021 were obtained, and the quantities of wastes collected before and during the pandemic were compared. These data were also discussed in light of data on COVID-19 cases and rates of social distancing and mobility. An increase in the amount of recyclables collected during the first wave of COVID-19 (March to September 2020) was observed. Decreases in the quantities of construction, demolition and bulky wastes (first wave of COVID-19) and farmers market wastes (second wave – October 2020 to February 2021) were also evidenced. The quantities of medical wastes collected during the pandemic significantly increased. The amount of residential wastes was lower than the mean for the pre-pandemic period during the first months of COVID-19. Thus, changes in lifestyle and consumption patterns of the population of São Paulo city seem to have affected solid waste generation during the pandemic, which reinforces the need of implementing solid waste management policies based on a diagnostic that characterise and consider these changes.
Keywords
Introduction
In Brazil, solid waste generation has been increased considerably in the last decades, a fact resulting from a rapid and disorderly expansion of the Brazilian cities, as well as an increase in the consumption of industrialised and disposable products (Brasil, 2020b; Dadario, 2019). In parallel, the development of policies covering waste management is not enough to solve waste-related problems. According to Cetrulo et al. (2018), despite the legal importance and quality, the law’s enactment per se does not guarantee improvements in solid waste management.
In this context, in 2010, the Law nº 12,305 instituted the National Solid Waste Policy (PNRS) in Brazil, which is the main regulatory framework for the waste sector in the country. The PNRS established several objectives, guidelines, instruments and goals for a sustainable solid waste management in Brazil (Brasil, 2010). Since then, some advances for the universalisation of services, eradication of dumps and the promotion of initiatives of selective collection and reverse logistics have been observed as a result of the PNRS (Alfaia et al., 2017; Costa and Ferreira Dias, 2020). Despite this, in Brazil, the area of basic sanitation is still facing several challenges. This reality has been worsened by the COVID-19 pandemic, which has been affecting waste collection, treatment and final disposal services (Pugliesi et al., 2020).
As outlined in the Basel Convention on the control of transboundary movements of hazardous wastes and their disposal, solid waste management is an essential and urgent instrument to reduce impacts on the environment and public health (Singh et al., 2020a). Notwithstanding, according to the Decree nº 10,329 (Brasil, 2020a) of 28 April 2020, which regulates the Law nº 13,979 of 6 February 2020, basic sanitation (including solid waste management) was not considered an essential service during the COVID-19 pandemic in Brazil. This prerogative associated with suspending non-essential activities has a huge potential to impact the dynamics of solid waste management in the country.
The maintenance of selective waste collection during the pandemic was not a consensus both in Brazil and in other locations (Pugliesi et al., 2020). In the European Union, New Zealand, United Kingdom and United States, selective waste collection was considered an essential service. However, some organisations involved in the recycling chain in these countries recommended a temporary suspension of the activities due to the hazards of handling potentially contaminated wastes. In Mexico and Uruguay, other organisations recommended the continuity of selective waste collection services and/or a quarantine for recyclable materials (Pugliesi et al., 2020). In Singapore, there was a decrease in the collection of recyclables, whereas in Wuhan, China, waste management services were not considered essential and were suspended (Kulkarni and Anantharama, 2020). Brasília, Belo Horizonte, São Luís, João Pessoa, Palmas and Campo Grande are among the state capitals that suspended the selective waste collection in Brazil (Abes Saneamento, 2020).
Until 2019, about 61.9% of the Brazilian municipalities did not have a selective collection programme (Snis, 2019), and the collected waste was delivered to sanitary landfills or even to improper sites such as dumps or controlled landfills (Pugliesi et al., 2020). With the pandemic, this scenario became worse. Most of the municipalities that had a programme of selective waste collection suspended manual collection and sorting, which may decrease citizen involvement in recycling and increase the volume of wastes sent to landfills (Urban and Nakada, 2021).
In the city of São Paulo, the most populous city in Brazil with 12.2 million inhabitants (IBGE, 2020; Urban and Nakada, 2021), a contingency plan for solid waste management during the COVID-19 pandemic was proposed. In case of lockdown, the collection of residential and medical wastes is considered essential. Furthermore, the plan also established a temporary suspension of manual sorting to reduce workers’ exposure to contaminated materials (AMLURB, 2020).
Given the global socioeconomic impacts of COVID-19, there is a great interest in investigating the effects of SARS-CoV-2 pandemic in the context of solid waste management (Behera, 2021; Everitt et al., 2021; Fan et al., 2021; Hantoko et al., 2021; Haque et al., 2021; Kulkarni and Anantharama, 2020; Leal Filho et al., 2021; Naughton, 2020; Richter et al., 2021; Singh et al., 2020b). However, only a few studies have assessed these impacts in Brazil (Penteado and Castro, 2021; Pugliesi et al. 2020; Schmitt et al. 2021; Urban and Nakada 2021), and none of these studies have conducted qualitative–quantitative analyses about possible changes in solid waste generation patterns caused by the COVID-19 pandemic, especially in the context of São Paulo city. This fact is probably associated with a lack of data on waste management in the country since the available information is often from large cities (such as the case of São Paulo). Thus, this type of analysis is still needed as it can provide a deeper understanding of the impacts of a severe public health event (e.g. a pandemic) on solid waste generation, serving as a basis for planning strategies.
In view of this, this work aimed at assessing the impacts of the COVID-19 pandemic on solid waste management in the city of São Paulo, SP, Brazil, by means of a comparison between the amount of waste collected before and during the pandemic. Furthermore, the effects of changes in population mobility patterns and social distancing on solid waste generation and collection in São Paulo city were also discussed.
Materials and methods
Study area
São Paulo is the largest city of Latin America, with an area of about 1500 km² and a population of over 12 million people. It is located in the Brazilian state of São Paulo (Figure 1) and has the largest gross domestic product (GDP) in Brazil, corresponding to about US$130 billion and US$10,670 per capita (IBGE, 2020; Urban and Nakada, 2021). The service sector is the main economic activity in the city of São Paulo. This sector moves about US$88 billion yearly in the city of São Paulo, which means 68% of the municipal GDP. Furthermore, the industry sector represents US$10.5 billion of the São Paulo city’s GDP, whereas administration, defence, public education, public health and social security sectors correspond to a yearly income of approximately US$8 billion (IBGE, 2020).
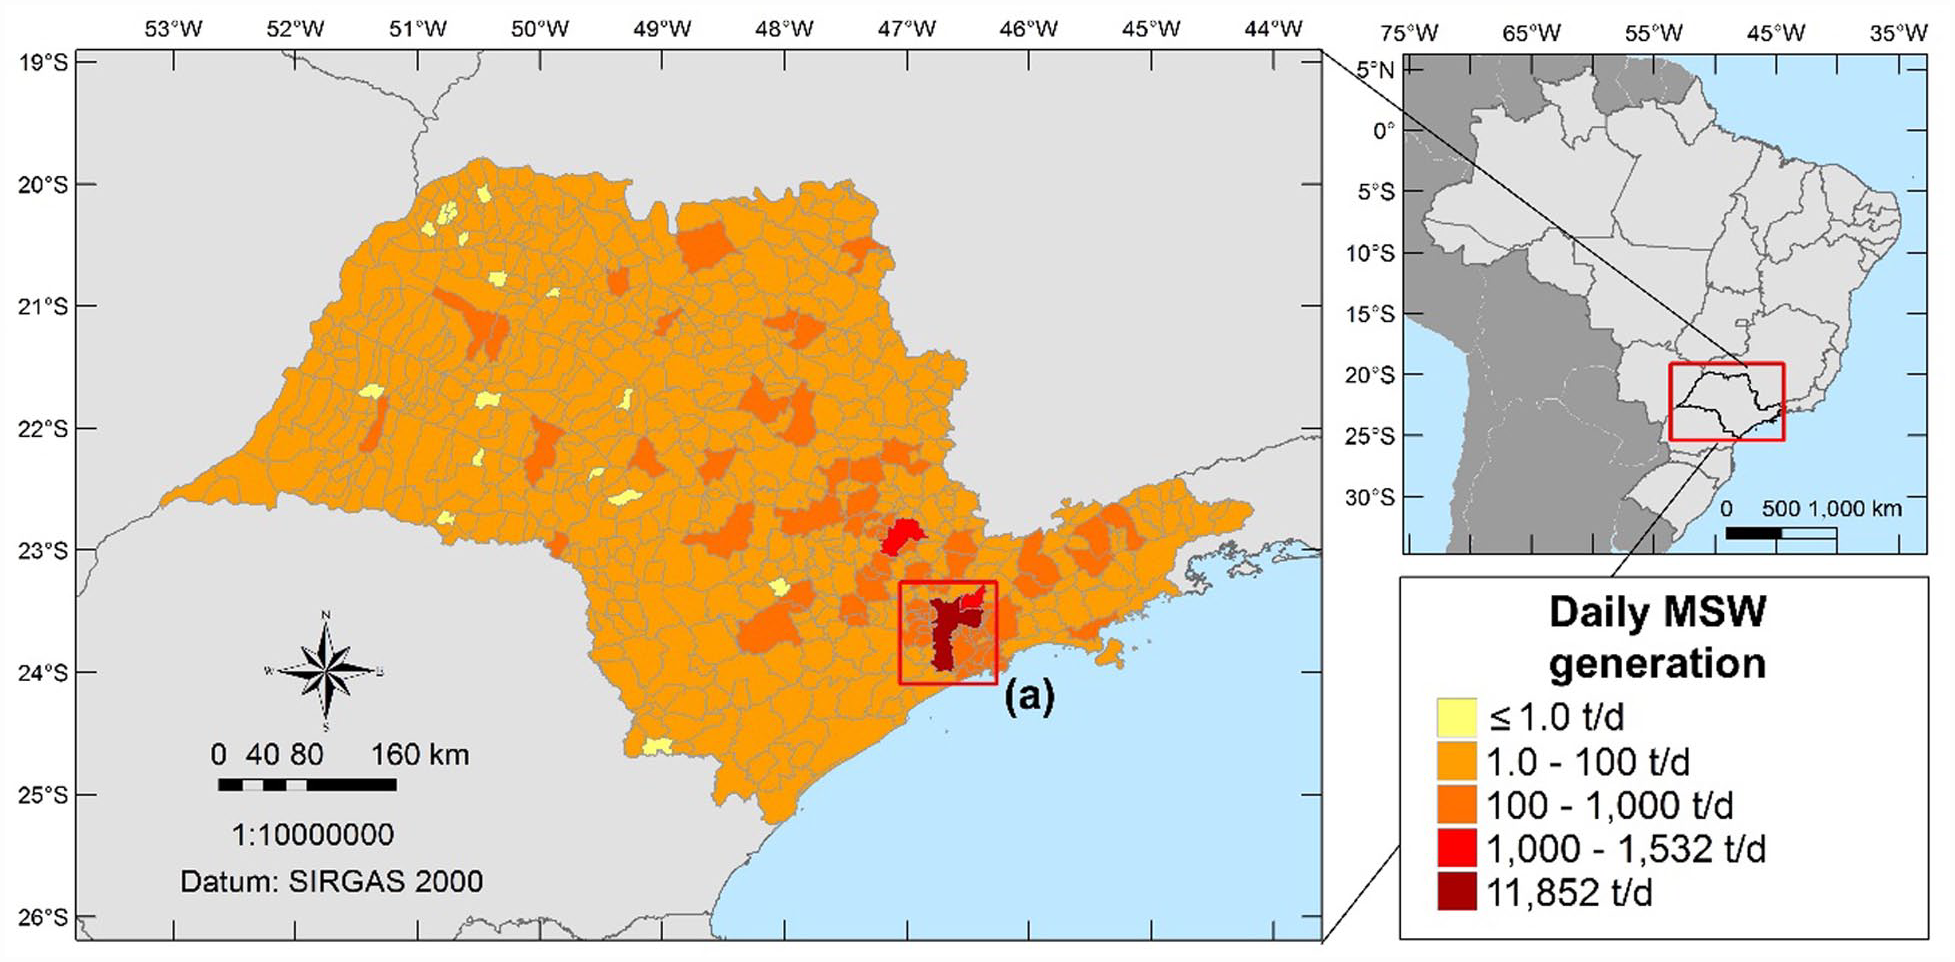
Location map of São Paulo city in the state of São Paulo (SP), Brazil, and daily municipal solid waste (MSW) generation in the municipalities of São Paulo state: (a) São Paulo city.
As shown in Figure 1, the city of São Paulo also has the largest waste generation in the state of São Paulo. It is estimated that 11,852 tonnes of municipal solid waste are generated per day in the city of São Paulo (Cetesb, 2021). According to the information made available by the state government of São Paulo, approximately 98.8% of the amount of residential waste generated in São Paulo city is collected (São Paulo, 2020b). Moreover, selective collection of recyclable materials is offered in 76% of the streets of São Paulo city (São Paulo, 2021b).
Data collection
Currently, the Municipal Authority for Urban Cleaning (AMLURB, acronym in Portuguese) provides data regarding the amount of solid waste collected by the public service providers in the city of São Paulo between 2013 and 2021 (AMLURB, 2021a). These data are made available monthly and are categorised according to the type of waste (e.g. residential waste, selective collected waste, bulky waste, waste from small or large quantity generators of medical waste and wastes from Ecopoints, which are voluntary delivery points that receive different types of wastes, such as recyclables, small volumes of construction and demolition wastes, bulky wastes and garden wastes).
In this work, data on the quantities of wastes collected in São Paulo city before (between January 2013 and February 2020) and during (covering March 2020 to February 2021) the pandemic were obtained (AMLURB, 2021a, 2021b). These periods were defined according to the data availability (AMLURB, 2021a, 2021b).
It is worthwhile to mention that this data set comprises only wastes collected by the public service and does not include wastes from the private sector and reverse logistics systems. Furthermore, according to the Municipal Law nº 13,478/2002, the collection of medical waste in the city of São Paulo is only attributed to the public sector (São Paulo, 2002). Due to this, data regarding medical wastes obtained in this work reflect the total amount collected in the city of São Paulo. The types of solid wastes studied in this work are listed in Table 1.
Categories and types of wastes analysed in this work.
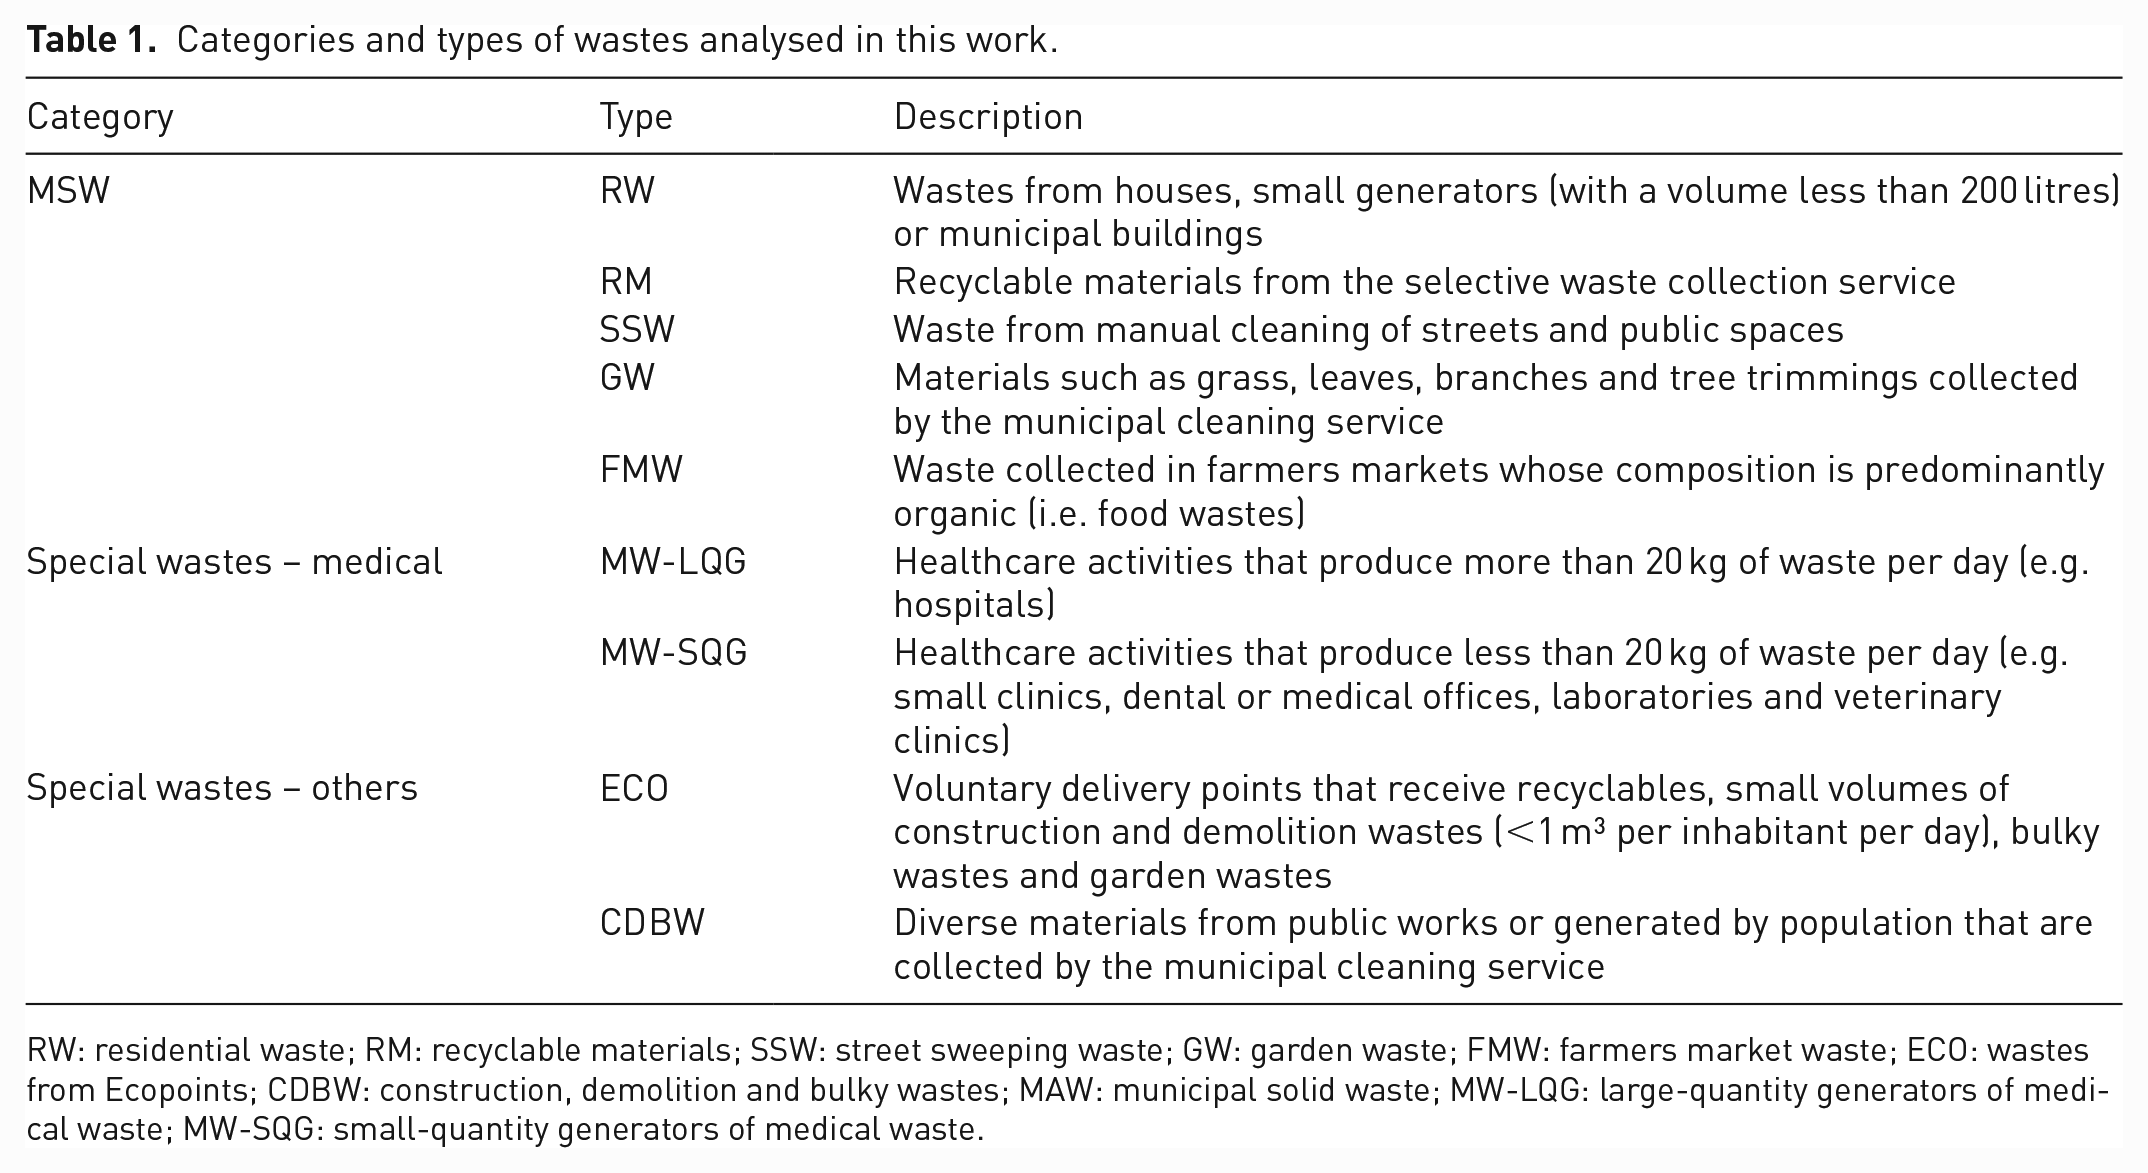
RW: residential waste; RM: recyclable materials; SSW: street sweeping waste; GW: garden waste; FMW: farmers market waste; ECO: wastes from Ecopoints; CDBW: construction, demolition and bulky wastes; MAW: municipal solid waste; MW-LQG: large-quantity generators of medical waste; MW-SQG: small-quantity generators of medical waste.
Data about the evolution of COVID-19 cases in the city of São Paulo between March 2020 and February 2021 were obtained from the São Paulo State Data Analysis System (Seade, 2021a). The different COVID-19 waves were used as parameters to analyse the scenarios of waste generation during the pandemic.
Additionally, daily data regarding the rate of social distancing (São Paulo, 2021a), as well as the rates of population mobility (Google, 2021), in São Paulo city during the pandemic were collected. The rate of social distancing has been evaluated and has been made available by the state government of São Paulo since March 2020 (São Paulo, 2021a). The rates of population mobility are made available in global mobility reports provided by Google exceptionally during the pandemic (Google, 2021).
These reports describe changes in population mobility during the pandemic in comparison to a pre-pandemic baseline (3 January to 6 February 2020). Basically, the rates of population mobility measure the variation in time spent visiting a given place in a day. Thus, the following mobility rates were obtained:
(i) residential;
(ii) workplaces;
(iii) places of retail and recreation, such as cafes, shopping centres, theme parks, museums, libraries and movie theatres;
(iv) grocery markets, food warehouses, farmers markets, specialty food shops, drug stores and pharmacies;
(v) parks, including national parks, public beaches, marinas, dog parks, plazas and public gardens and
(vi) places related to public transport, such as taxi stands, subway and bus and train stations.
Raw data are found in Supplemental Material 1.
Data analysis
Basic descriptive statistics for the amounts of each type of waste selected for this work and collected in São Paulo city were computed to better understand the dynamics of waste generation and collection before and during the COVID-19 pandemic (Supplemental Table S1). Furthermore, the amounts of each type of waste collected before and during the pandemic were compared, as schematised in Figure 2.
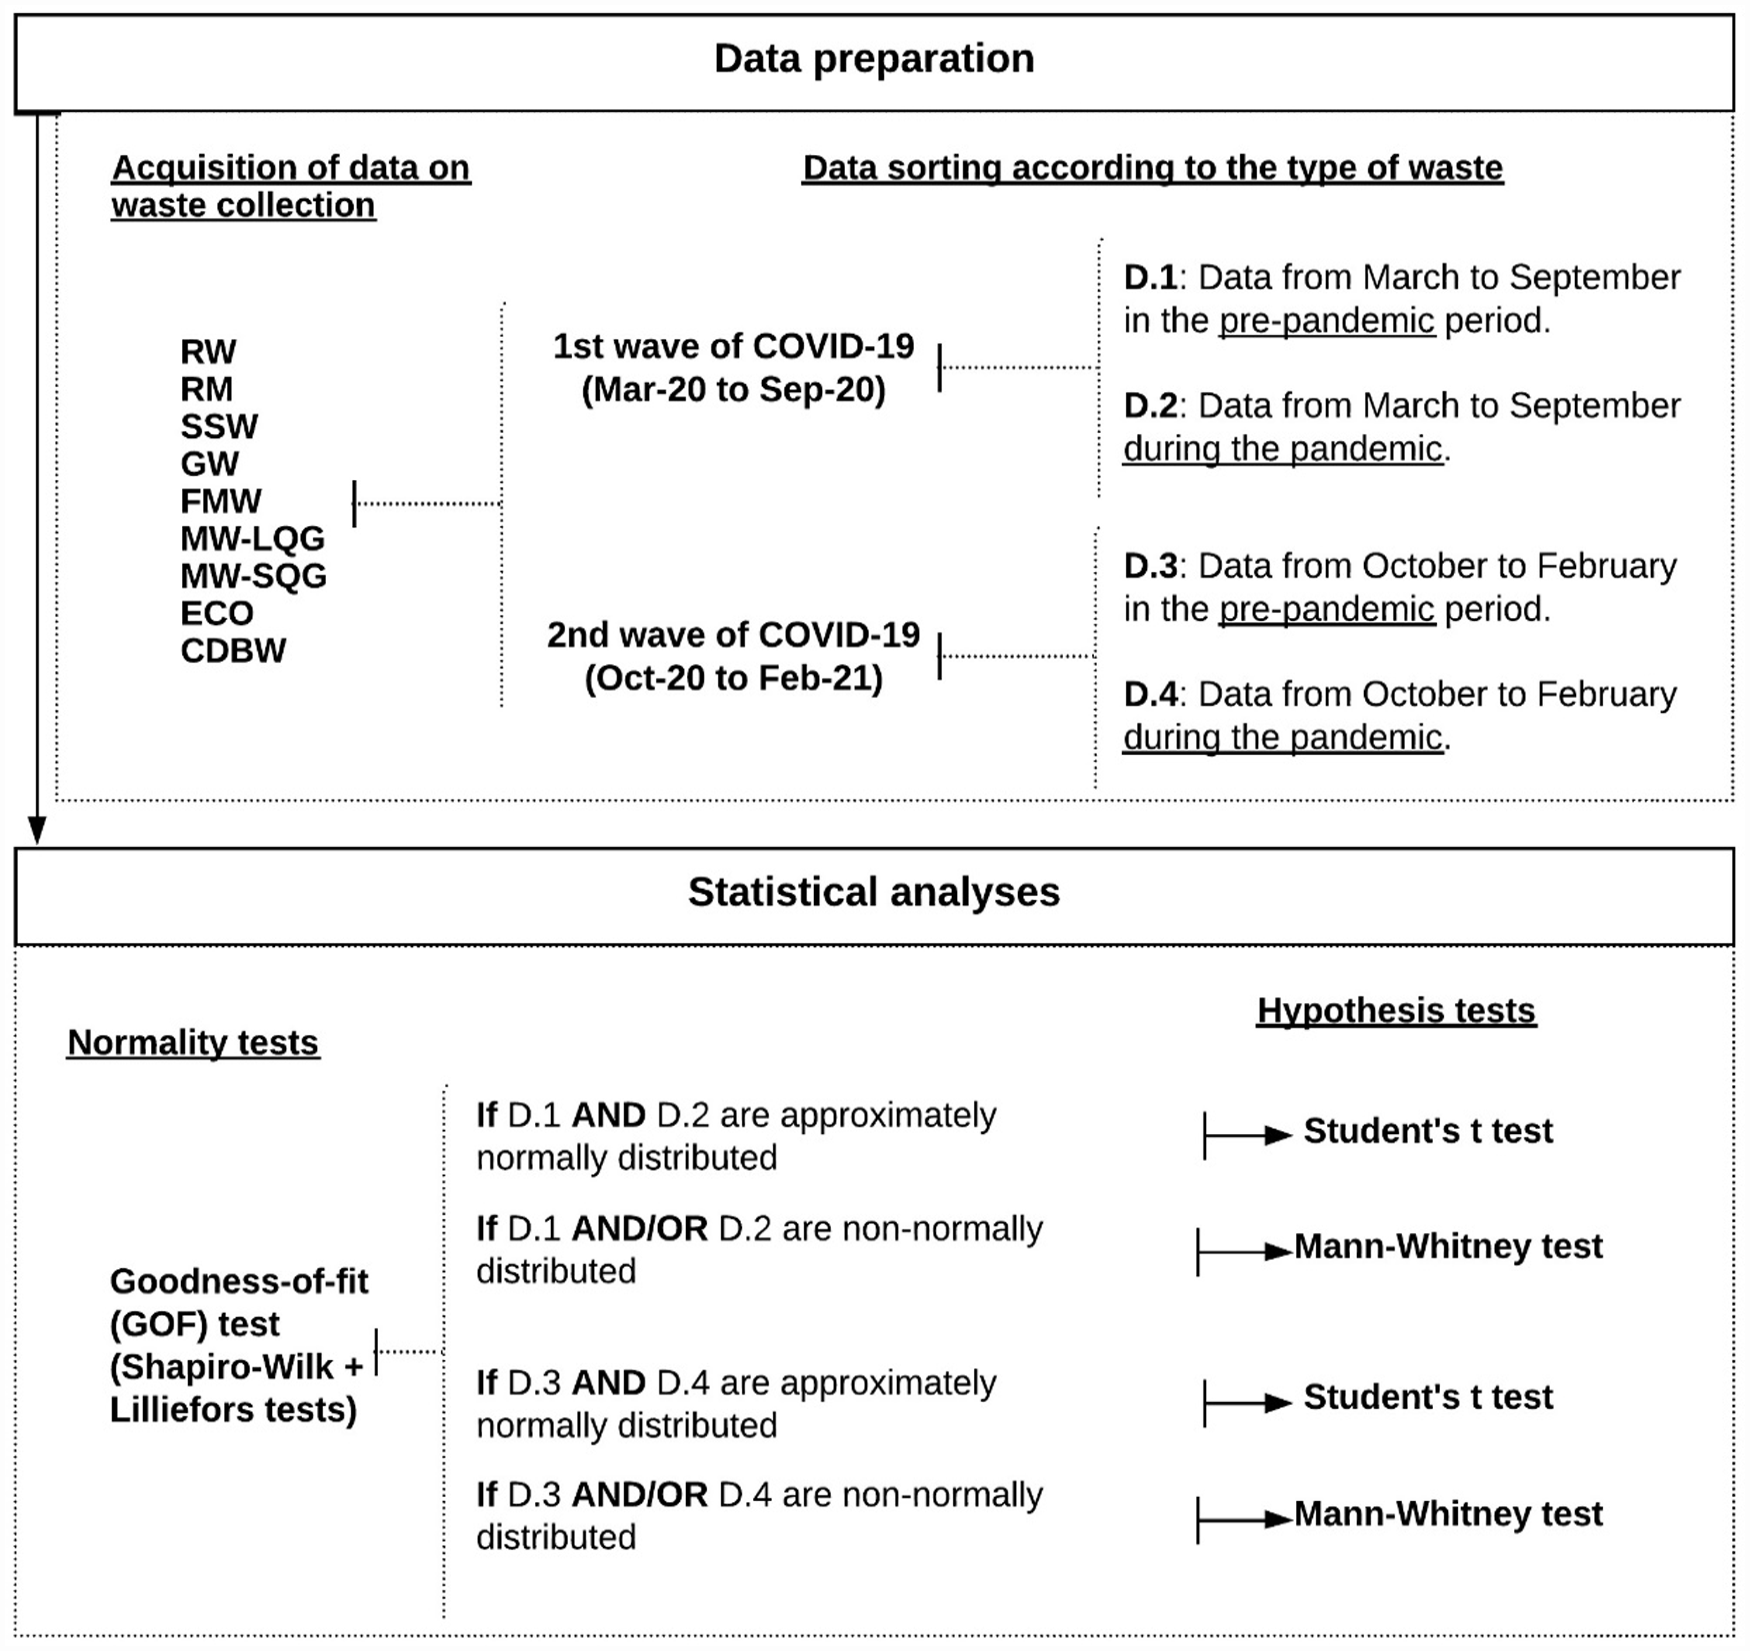
Flow chart of the statistical analyses conducted in this work.
The goodness-of-fit (GOF) tests (Shapiro–Wilk and Lilliefors tests) were used to assess if the data sets fit the normal distribution at a 95% confidence level (United States Environmental Protection Agency, 2016). Subsequently, the presence of statistically significant differences at 5% significance level was tested through Student’s t (Kalpić et al., 2011) and Mann–Whitney (Mann and Whitney, 1947) tests. These analyses were performed in the USEPA’s ProUCL software (United States Environmental Protection Agency, 2021).
Results and discussion
COVID-19 pandemic, social distancing and their reflections on population mobility in the city of São Paulo
Until 30 November 2021, 1,550,551 cases and 39,241 deaths related to COVID-19 were confirmed in the city of São Paulo. By the end of February 2021, which is the period in study, the city had already registered 631,724 cases and 18,583 deaths due to SARS-CoV-2 (Seade, 2021a).
Figure 3 depicts the evolution of COVID-19 cases as well as the rates of social distancing and populational mobility in São Paulo city in the period in study (from March 2020 to February 2021).
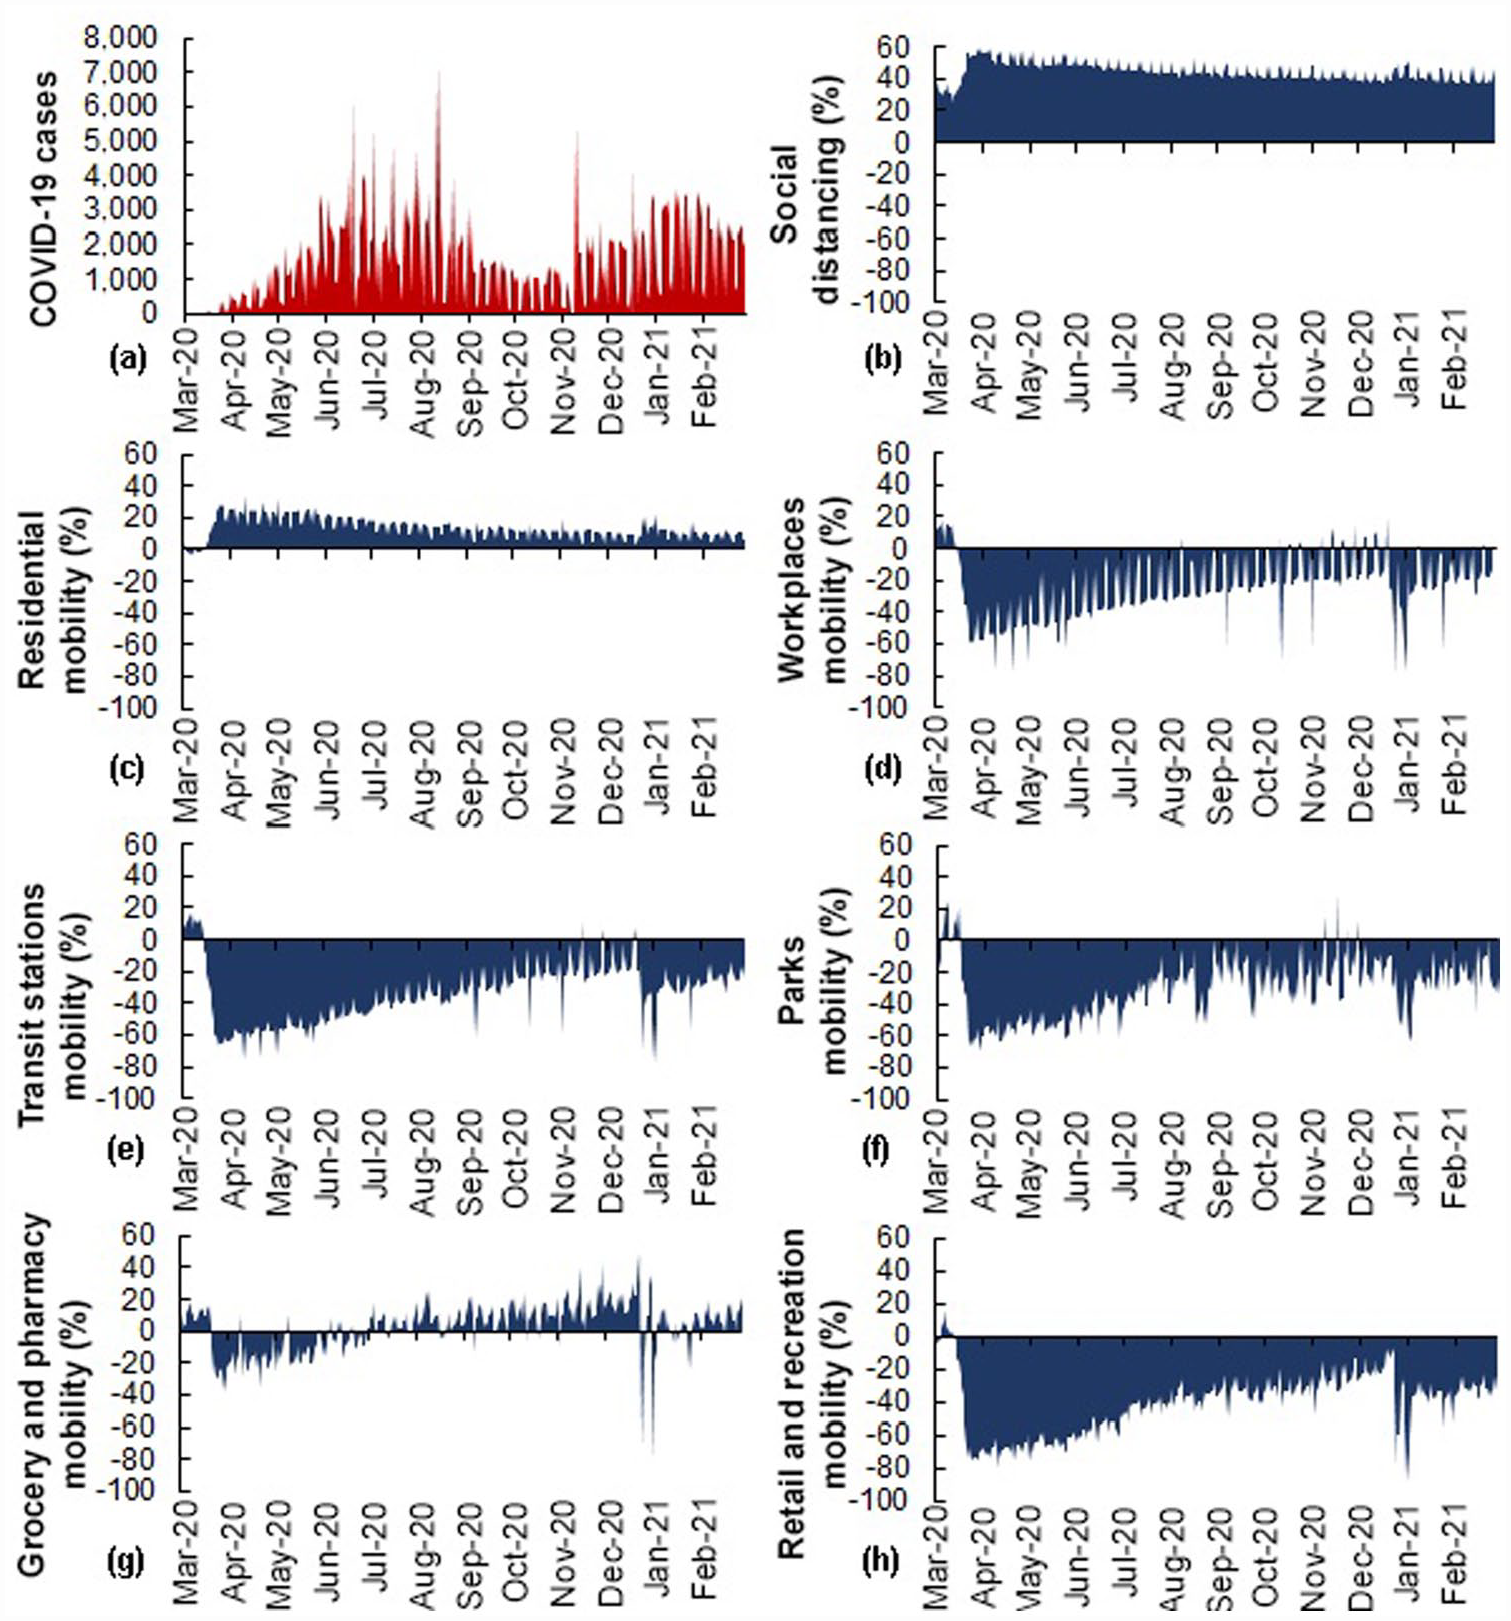
Daily evolution of (a) new COVID-19 cases, (b) social distancing rate, (c) residential, (d) workplaces, (e) transit stations, (f) parks, (g) grocery and pharmacy and (h) retail and recreation mobility rates in São Paulo city.
Figure 3(a) evidences the occurrence of two waves of COVID-19 infections in São Paulo city during the period from March 2020 to February 2021. In São Paulo, the first registered cases occurred in late February (26) and March 2020 (Seade, 2021a). The first infection curve had an ascension until June 2020. From June to August 2020, the number of cases remained high. Finally, a downward trend in COVID-19 cases can be observed between August and September 2020. The second wave of SARS-CoV-2 infection can be observed between October 2020 and February 2021. This curve was characterised by an ascension until mid-January 2021 and a decline in February 2021.
As shown in Figure 3, in parallel to the COVID-19 outbroke, there was an increase in the rate of social distancing in São Paulo city (Figure 3(a) and (b)). In addition, population mobility data evidenced an increase in the time spent at home (Figure 3(c)) and a decrease in the time spent at workplaces (Figure 3(d)), transit stations (Figure 3(e)) and leisure places (Figure 3(f) and (h)), mainly during the first wave of COVID-19 contagion.
On the other hand, data regarding grocery and pharmacy mobility (essential services) fluctuated throughout the evolution of COVID-19 cases (Figure 3(g)). Data suggest a great demand for grocery and pharmaceutical products immediately after the declaration of a pandemic situation by the World Health Organization (2020). After the emergence of the first COVID-19 cases in São Paulo city, the rate of grocery and pharmacy mobility was predominantly lower than usual. As can be seen in Figure 3(g), this rate increased again at the end of the first wave and the beginning of the second wave of COVID-19 infection. These aspects evidence potential impacts of the pandemic on the behavioural patterns of the population of São Paulo city.
Municipal solid waste generation and collection during the COVID-19 pandemic
The GOF tests indicated that all data sets concerning the quantities of municipal solid waste (residential waste, recyclable materials, street sweeping waste, garden waste and farmers market waste) collected in São Paulo city in the time frames related to the first and second waves of COVID-19 contagion before and during the pandemic fitted the normal (or approximately normal) distribution (see Figure 2) (results are found in Supplemental Table S2). Given the above, the occurrence of statistically significant differences between the quantities of municipal solid wastes collected before and during the pandemic was assessed through Student’s t-test at a significance of 5%. Student’s t-test results are presented in Supplemental Figure S1 (Supplemental Material 2).
At a 95% confidence level, no statistically significant differences between the amounts of residential wastes collected before and during the pandemic were evidenced (p value for the first wave COVID-19: 0.110, p value for the second wave COVID-19: 0.147) (Supplemental Figure S1). Despite this, the quantities of residential wastes collected in São Paulo city, particularly from March to June 2020, were markedly lower than the mean for the pre-pandemic period (Figure 4(a)).
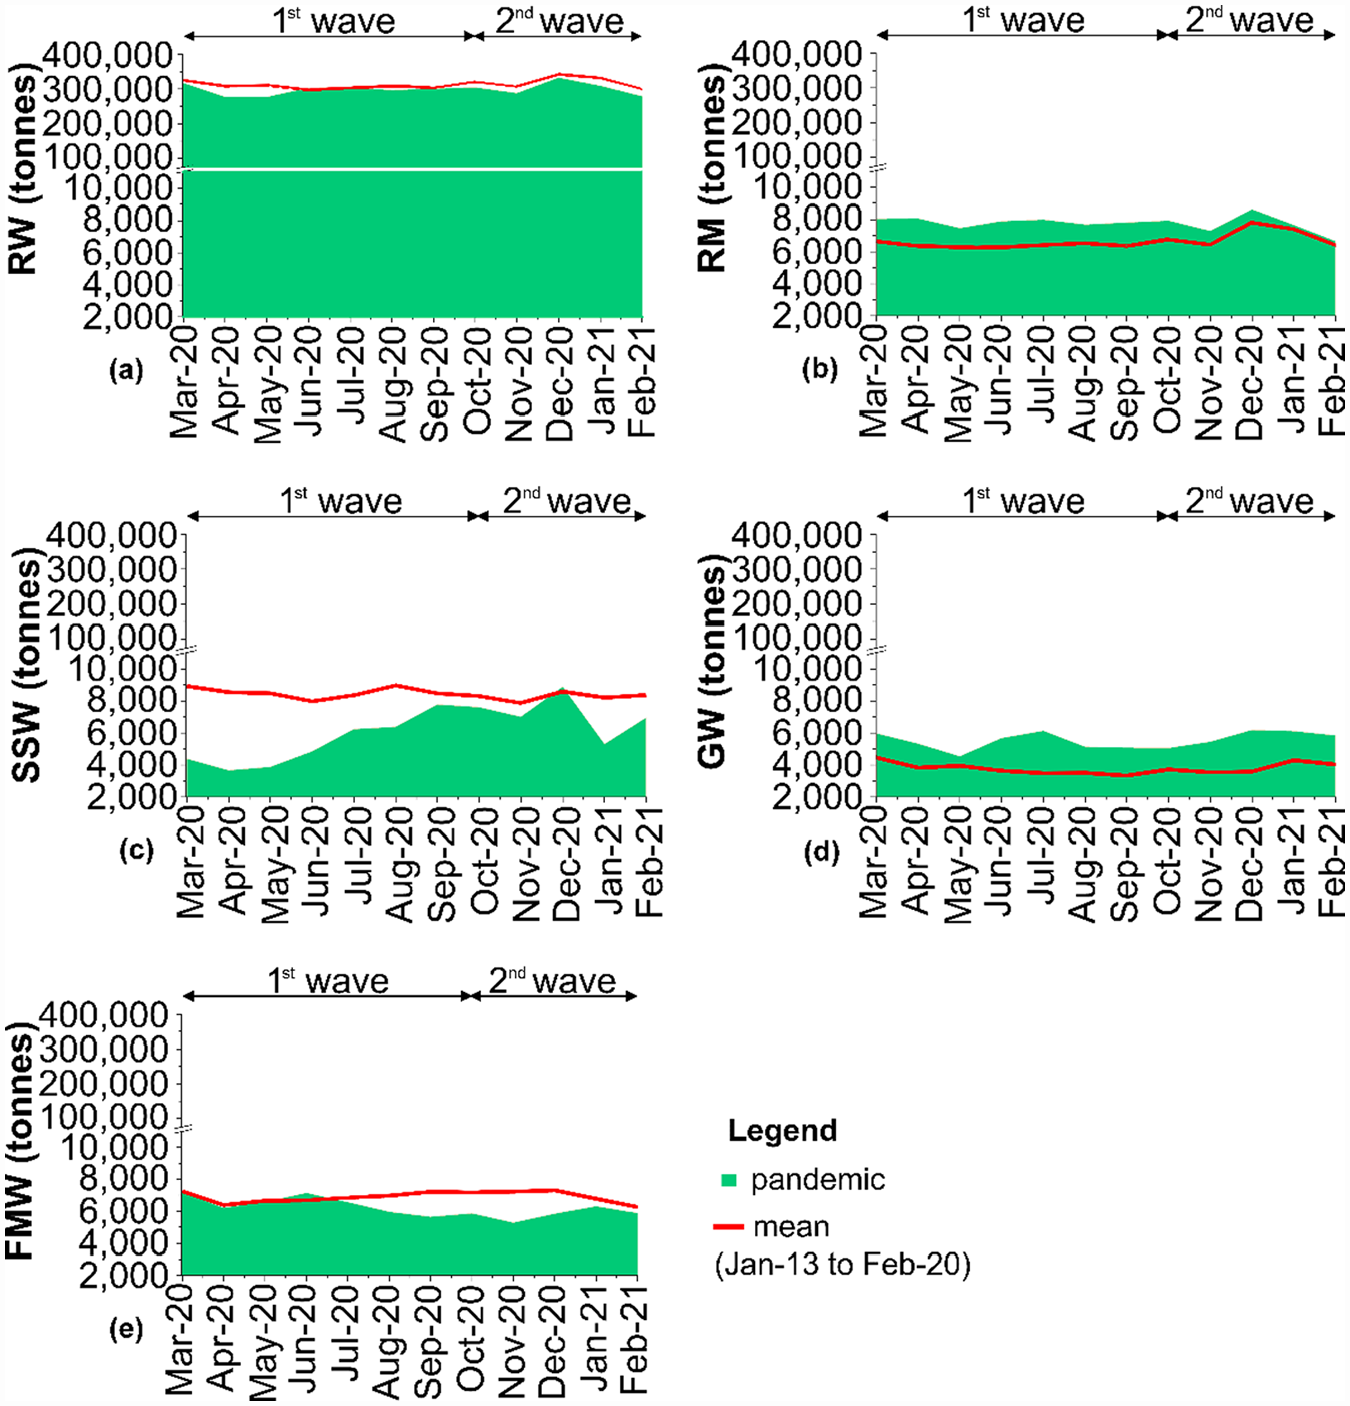
Quantities of municipal solid wastes generated in São Paulo city during the COVID-19 pandemic in comparison to the pre-pandemic period. (a) Residential waste (RW), (b) recyclable materials (RM), (c) street sweeping waste (SSW), (d) garden waste (GW) and (e) farmers market waste (FMW).
As the conventional waste collection was not altered during the COVID-19 pandemic in São Paulo city (AMLURB, 2020), this result can indicate a decrease in residential waste generation in this period. As reported by Urban and Nakada (2021), April 2020 had one of the lowest quantities of residential wastes collected in São Paulo registered in the last 11 years (276.684 tonnes).
One of the possible explanations of this decrease during the first contagion wave may be related to a reduction in the population mobility in groceries and pharmacies (Figure 3(g)). This may be associated with a reduction in consumption, which may have contributed to a drop in the amount of residential wastes generated during this period.
On the other hand, the quantity of recyclable materials collected by the municipal selective collection programme increased during the pandemic (Figure 4, Supplemental Figure S1). This increment was statistically significant (p = 9.0 × 10⁻⁶) during the first wave of coronavirus disease in São Paulo city, which occurred from March to September 2020. It is worth to mention that the municipal recycling and selective waste collection program of São Paulo city has not been suspended, but manual sorting was paralysed until November 2020 (São Paulo 2020a; São Paulo, 2021b).
The Brazilian Association of Sanitary and Environmental Engineering (ABES) reported decreases in waste generation during the first week of April 2020 in some of the main Brazilian cities as follows: −16% in Rio de Janeiro – RJ, −12% in Brasília – DF, −12% in Porto Alegre – RS, −10% in Fortaleza – CE and −10% in Manaus – AM. A decrease varying from 22% to 50% in the central region (commercial area) of the city of Belo Horizonte – MG during 30 days of lockdown was also noticed (Abes Saneamento, 2020). In the city of Campinas – SP, waste generation reduced by 15% during the first month of partial lockdown, although the municipal waste recycling programme was temporarily suspended, and recyclable materials were collected by the conventional residential waste collection (G1, 2020).
Different responses in residential waste and recyclable material generation and collection were observed in other places of the world. In Singapore, there was an increase in municipal solid waste generation by 3%, whereas in Shanghai, there was a reduction of 23.2% (Fan et al., 2021). Furthermore, in a comparison between 2019 and 2020, an increase of 3.3% in municipal solid waste generation and an increment of 13.3% in organic waste generation were registered in New York (Naughton, 2020).
Some reasons for an increase in recyclable materials and a decrease in residential waste generation and collection may include the following: (i) an increase in the time spent at home, as shown in Figure 3, which expanded by up to 35% in the first half of March 2020, reaching a peak on 10 April 2020, (ii) the routine of household cleaning and disinfecting has become more frequent, (iii) a large consumption of processed foods and plastic packaging from delivery products (Leal Filho et al., 2021), and (iv) an increase in unemployment (Seade, 2021b).
A survey carried out by Leal Filho et al. (2021) in 23 countries evidenced increases of 53% in plastic packaging and 45% in food waste generation. Results shown in Figure 4 and Supplemental Figure S1 may be related with the change in purchase and consumption habits reported by Leal Filho et al. (2021). First, an overbuying or panic buying stage was observed at the beginning of the COVID-19 pandemic (as shown in Figure 3(g)) since the consequences of the virus were still unknown. This situation was observed in different locations worldwide. Increases in the demand for frozen and packaged food since were observed in March 2020 in the United States and some European countries. Online shopping and food delivery substantially increased in these countries during the lockdown, whereas in-store shopping decreased (Leal Filho et al., 2021). Data shown in Figure 3 also suggest these aspects in São Paulo city, mainly from April to July 2020.
It is worth remembering that increasing online shopping and packaged food consumption directly results in increasing packaging waste generation (Leal Filho et al., 2021; Naughton, 2020). In Singapore, for example, takeaway and home delivery grocery services led to an additional plastic waste generation of 1400 tonnes during an 8-week lockdown (Bengali, 2020).
As shown in Figure 4 and Supplemental Figure S1, garden waste generation in São Paulo city increased significantly both in the first and second waves of COVID-19 (p = 1.4 × 10⁻⁷ and p = 2.2 × 10⁻⁵) in comparison to the same months in the pre-pandemic years. On the other hand, the quantity of street sweeping waste collected during the first wave (p = 3.1 × 10⁻⁷) was significantly lesser than that collected before the coronavirus pandemic. Similarly, the amount of farmers market waste collected during the second wave of COVID-19 infection in São Paulo city was significantly lower (p = 0.038) than that collected in the same months of the pre-pandemic period.
Special waste generation and collection during the COVID-19 pandemic
Ecopoints, construction, demolition and bulky wastes
The GOF tests evidenced that the data sets regarding the quantities of wastes delivered to Ecopoints as well as construction, demolition and bulky wastes collected in the months equivalent to the first wave of COVID-19 (March to September 2020) in the years that preceded the pandemic did not follow the Gaussian distribution (Supplemental Table S2).
Thus, the assessment of statistically significant differences in the quantities of wastes from Ecopoints and construction, demolition and bulky wastes collected in the first wave of COVID-19 was carried out using the Mann–Whitney test at a 95% confidence level. For the case of the wastes collected in the months corresponding to the second wave, the Student’s t-test at a 95% confidence level was used.
There was a statistically significant increase in the quantity of wastes delivered to Ecopoints during the first wave of the coronavirus pandemic in comparison to the same months of 2013 to 2019 (p = 0.005) (Figure 5, Supplemental Figure S2).
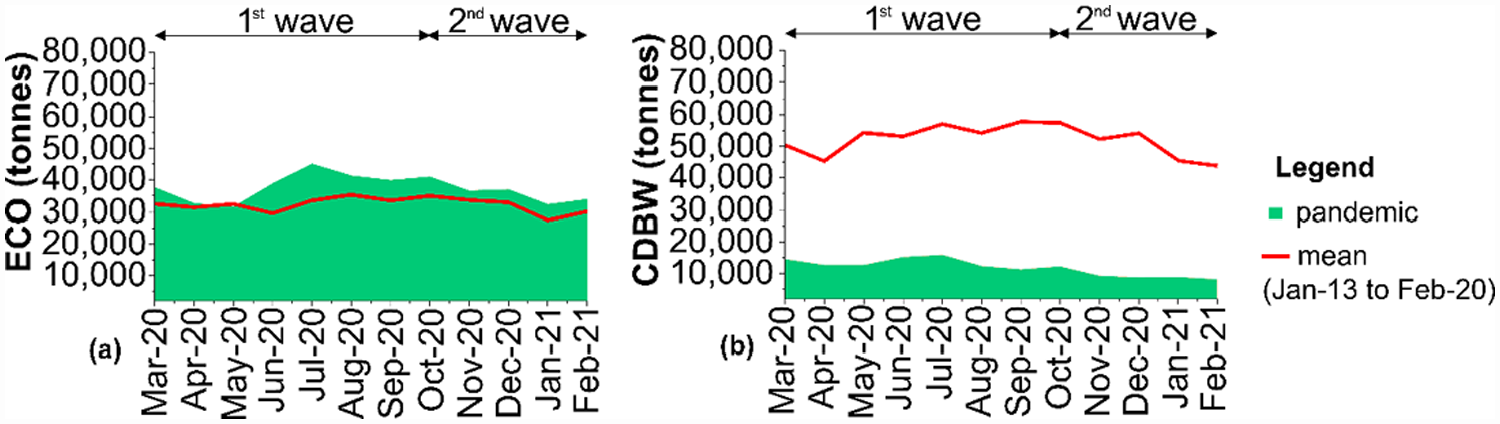
Quantities of diverse special wastes collected in São Paulo city during the COVID-19 pandemic in comparison to the pre-pandemic period: (a) wastes from Ecopoints1 (ECO) and (b) construction, demolition and bulky wastes (CDBW).
Figure 3(c) and (d) evidence increases in the permanence of people at home and a decrease in the time spent in workplaces, whereas Figure 3(c) shows a growth of 20% in the population residential mobility, and this rate remained high during the whole study period. According to Figure 3(d), workplace mobility reached a reduction of 60% at the beginning of the COVID-19 pandemic and also remained low in the whole study period.
Thus, home office (Figure 3(d)) and social distancing (Figure 3(b) and (c)) together with a reduction in out-of-home leisure activities (Figure 3(f) and (h)) during the first wave of COVID-19 cases may also have contributed to increasing the volume of waste delivered to Ecopoints. This increase may be therefore associated with aspects such as increases in the sales of home office and distance learning related electronics (ABINEE, 2021) and in the number of small reforms motivated by improving comfort at work and adapting to remote work. In this sense, from 19 to 25 July 2020, a growth of 33.1% in the revenue of the Brazilian building materials industry was reported (Folha De São Paulo, 2020).
On the other hand, the quantity of construction, demolition and bulky wastes collected by São Paulo’s municipal waste collection programme significantly reduced in both the first (p = 2.3 × 10⁻⁵) and second (p = 0.001) waves of coronavirus infection (Figure 5, Supplemental Figure S2). The suspension of public works due to the pandemic may be one of the reasons of these results. From January 2020 to the middle of 2021, 152 public works were paralysed, and the number of finished public works dropped from 575 in the third quarter of 2019 to 293 in the same period of 2020, representing a reduction of 50% (São Paulo, 2021d). It is worth remembering that the data used in this work were from the municipal solid waste agency (AMLURB) and represent only construction and demolition wastes collected by the municipal service (i.e. only those from public works).
Medical waste
All data sets regarding small- and large-quantity generators of medical wastes fit the normal distribution (Supplemental Table S2). Thus, the Student’s t-test at a 95% confidence level was used for assessing the existence of statistically significant differences between the quantities of wastes collected before and during the COVID-19 pandemic.
As expected, during the pandemic, the amount of medical waste collected from large-quantity generators was significantly higher than the pre-pandemic period (first wave: p = 1.6 × 10⁻⁴ and second wave: p = 1.6 × 10⁻¹⁴). For the case of the small-quantity generators, the amount of medical waste collected during the second wave (October 2020 to February 2021) was significantly larger than that collected in the same months before the coronavirus pandemic (p = 4.7 × 10⁻⁵) (Figure 6, Supplemental Figure S3).
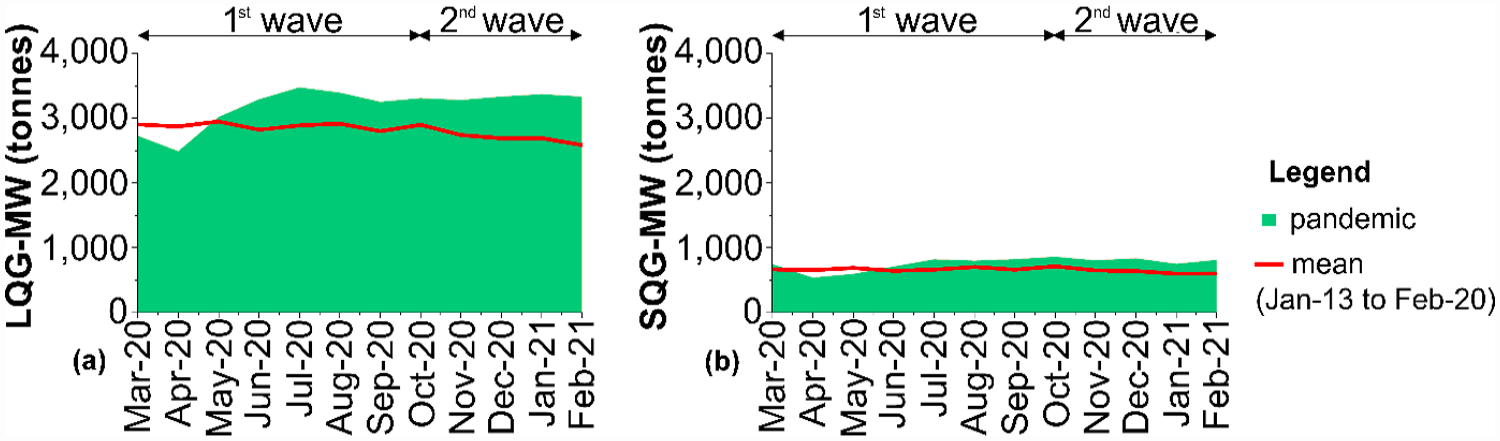
Quantities of medical wastes collected in São Paulo city during the COVID-19 pandemic in comparison to those collected during the pre-pandemic period: (a) large-quantity generators of medical waste (MW-LQG) and (b) small-quantity generators of medical waste (MW-SQG).
This scenario was not only noticed in São Paulo. Similar effects were reported in several locations around the world. Before the COVID-19 outbreak, the city of Wuhan, China, had a medical waste disposal capacity of about 50 tonnes per day and an average daily generation of 45 tonnes. The emergence of coronavirus disease in Wuhan increased daily medical waste generation to 110–150 tonnes in the middle of February 2020. During the peak of COVID-19 cases in the city (from mid-February to mid-March 2020), medical waste generation reached 240 tonnes per day, which corresponds to a six-fold increase in comparison to the pre-pandemic levels (Singh et al., 2020a; Wei, 2020). Similarly, increases in medical waste generation varying from 154 to 280 tonnes per day were reported during the pandemic in the cities of Manila, Jakarta, Kuala Lumpur, Hanoi and Bangkok (ADB, 2020).
Increases in medical waste generation may be associated with a substantial increase in the use of personal protective equipment, for example face masks, gloves, rubber boots, laboratory coats, hand sanitisers and other medical supplies such as syringes, COVID-19 test kits, plastic containers, bandages, tissues, etc. (Haque et al., 2021).
Furthermore, the number of intensive care unit beds occupied by COVID-19 patients increased by 143% during the pandemic in São Paulo state, raising from 3500 to 8839 only in the public health system (São Paulo, 2021c), which may have contributed to medical waste generation in São Paulo city.
As can be seen in Figure 3(g), an expressive growth in grocery and pharmacy mobility rate occurred during the second wave of coronavirus in São Paulo city, reaching an increase of up to 40% at the end of 2020. This fact may be related to a great consumption of medications, personal protection equipment and other medical supplies, increasing the amount of medical waste from small-quantity generators.
The increase in medical plastic generation also affect the final in-place density of these wastes. Furthermore, in the long term, the unsafe medical waste disposal is believed to cause an environmental crisis, mainly by increasing pollution by hazardous environmental pollutants such as dioxins and toxic metals (Haque et al., 2021; Naughton, 2020; Singh et al., 2020a). According to Urban and Nakada (2021), more than 35% of medical wastes generated in Brazil have not been properly treated in Brazil during the coronavirus pandemic.
It is worthwhile to mention that not only medical but also residential wastes can also present characteristics of hazardous waste. During social distancing, many infected people can contaminate their waste. According to Haque et al. (2021), a person infected by COVID-19 can generate about 3.40 kg of hazardous waste per day. A notorious example is China, the Hubei province, which had an increase of about 600% in hazardous waste generation as a consequence of coronavirus disease (ADB, 2020; Haque et al., 2021). Due to this, recommended special measures to reduce contamination risks also include avoiding manual sorting and waste storage before collection (Hantoko et al., 2021). Furthermore, one of the recommendations to minimise health risks is to use hazardous waste treatment technologies (e.g. autoclave, steam sterilisation and incineration) to treat wastes from facilities used for housing patients (Hantoko et al., 2021). Thus, it is fundamental to prepare the waste management system to properly handle potentially hazardous wastes from a public health crisis such as a pandemic.
Considerations
Solid waste management in Brazil is a municipal responsibility. Despite the fact that the PNRS, the Law nº 12,305/2010, establishes guidelines for a decentralised waste management, the integration of federal, state and municipal government is often not a reality (Brasil, 2010; Pugliesi et al., 2020).
Furthermore, the Brazilian solid waste sector has not a frequently updated national database on waste generation, collection and management, which compromises the execution of similar studies due to a lack of available information. This highlights the importance of establishing publicly available databases on waste management in a municipal or regional sphere.
It became evident that the COVID-19 pandemic changed global waste generation, causing different responses worldwide (Fan et al., 2021; Naughton, 2020; Pugliesi et al., 2020). Unexpectedly, there was a decrease in waste generation in the principal Brazilian cities, as was the case of São Paulo city, possibly due to a reduction in commercial activities and the global economic downturn induced by coronavirus (Seade, 2021b; Urban and Nakada, 2021).
As emphasised in previous researches (Fan et al., 2021; Leal Filho et al., 2021), it is worthwhile to mention that this period can be a moment of questioning the effectiveness of management and planning strategies for adverse or emergency situations.
Conclusions
This work assessed the influence of the COVID-19 pandemic on generation and collection of nine types of solid wastes in the city of São Paulo – SP, to investigate possible changes in generation and collection patterns caused by the SARS-CoV-2 outbreak, social distancing and alterations in population mobility, based on data from pre-pandemic (January 2013 to February 2020) and pandemic (March 2020 to February 2021) periods.
During an unusual moment such as a pandemic, each location adopted different control measures for COVID-19. In this context, social distancing seems to have caused distinct population responses regarding waste generation. Results evidenced several changes in solid waste collection/generation patterns, including increases in the amount of recyclable wastes and decreases in the quantities of residential wastes collected during the period of peak of COVID-19 transmission in São Paulo (March to September 2020). The quantities of medical wastes collected during the whole pandemic period analysed (March 2020 to February 2021) were significantly higher than in the background period. In addition, decreases were evidenced for the quantities of construction, demolition and bulky wastes (first wave of COVID-19) and farmers market wastes (second wave – October 2020 to February 2021).
As previously discussed, these changes may be related to an economic crisis, in parallel to the reduction of population mobility, an increase in the consumption of package materials, a temporary suspension of non-essential activities, an increment in the number of small reforms, a rise in the occupancy of healthcare facilities and an increase in the use of personal protective equipment.
Given the above, it has become clear that solid waste managers should take account of the eminent impacts of public health events in the cities, to plan adequate management actions and minimise possible negative effects on environment and health. It is also recommended that similar studies based on a robust data analysis on the generation and collection of solid waste during atypical scenarios be applied to other cities to provide indicators to support management and public policies.
Supplemental Material
sj-docx-2-wmr-10.1177_0734242X231175817 – Supplemental material for Reflections on COVID-19 pandemic and waste management in developing countries: A case study in São Paulo city, Brazil
Supplemental material, sj-docx-2-wmr-10.1177_0734242X231175817 for Reflections on COVID-19 pandemic and waste management in developing countries: A case study in São Paulo city, Brazil by Isabela Salgado Vargas, Fernanda Bento Rosa Gomes and Samuel Rodrigues Castro in Waste Management & Research
Supplemental Material
sj-xlsx-1-wmr-10.1177_0734242X231175817 – Supplemental material for Reflections on COVID-19 pandemic and waste management in developing countries: A case study in São Paulo city, Brazil
Supplemental material, sj-xlsx-1-wmr-10.1177_0734242X231175817 for Reflections on COVID-19 pandemic and waste management in developing countries: A case study in São Paulo city, Brazil by Isabela Salgado Vargas, Fernanda Bento Rosa Gomes and Samuel Rodrigues Castro in Waste Management & Research
Footnotes
Data availability statement
All data generated or analysed during this study are included in the manuscript and its supplementary information files.
Declaration of conflicting interests
The authors declared no potential conflicts of interest with respect to the research, authorship and/or publication of this article.
Funding
The authors received no financial support for the research, authorship and/or publication of this article.
Supplemental material
Supplemental material for this article is available online.
References
Supplementary Material
Please find the following supplemental material available below.
For Open Access articles published under a Creative Commons License, all supplemental material carries the same license as the article it is associated with.
For non-Open Access articles published, all supplemental material carries a non-exclusive license, and permission requests for re-use of supplemental material or any part of supplemental material shall be sent directly to the copyright owner as specified in the copyright notice associated with the article.