
Abstract
Green building rating systems (GBRS) propose sets of indicators to measure the level of sustainability of buildings, and include waste as one of the categories to be assessed. Yet, both the number of indicators and their aim, as well as the waste fraction they refer to, vary greatly from one system to another. This study identifies the waste-related indicators included in 10 global GBRS. They are classified on the basis of different criteria (waste fraction assessed, stages of the life cycle of the building, waste hierarchy and stages that make up the waste management system) so as to make it possible to subsequently analyse the importance given to each indicator through the specific weightings of each GBRS. Finally, the indicators are implemented in the case study of a building located in Colombia, in order to quantify the current level of sustainability achieved in the waste category of each system and to propose improvement actions that allow this score to be improved. In this way, it is shown that proper waste management can increase the level of sustainability of a building.
Introduction
The building sector, which is constantly growing, consumes a large part of the natural resources available and is responsible for the generation of a huge amount of waste. According to the European Commission, in Europe, buildings are responsible for 30% of all construction and demolition waste (CDW) generated in the European Union (COM445, 2014) and in Latin America, specifically in Colombia, this figure rises to 40% (Tecnalia, 2017). CDW is mainly generated during the construction stage and, to a lesser extent, during the use stage of the building, in building rehabilitation and maintenance activities. Yet, the daily activities of the occupants also generate waste that is categorised as municipal solid waste (MSW). The management of both types of waste, CDW and MSW, should be integrated into the life cycle management of the building in order to recover them (Lopez-Yamunaqué and Iannacone, 2021) and promote the sustainability of buildings (García-Valerio and Adame Martínez, 2020)
The regulatory framework relating to waste management promotes waste prevention, minimisation and recovery strategies, as opposed to final disposal. At the European level, it is established by Directive 2008/98/EC (Parlamento Europeo, 2008) and Directive 2018/851/EU (Parlamento Europeo, 2018). As regards Colombia, it is established by Resolution 0472/2017 (Ministerio de Ambiente y Desarollo Sostenible, 2017), which aims to establish the guidelines for the integrated management of waste generated in construction and demolition activities, and whose lines of action are consistent with the hierarchy levels formulated in the European regulations and Resolution 1257/2021 (Ministerio de Ambiente y Desarrollo Sostenible, 2021) which updates Resolution 0472/2017, in terms of requirements for: CDW generation, municipalities and environmental authorities, and modifications of the percentages of CDW that each municipality must fulfil.
Powell et al. (2018) analysed the strategies adopted by the 174 countries that take part of the Paris Climate agreement on waste management framework, in which only 67 countries include waste management strategies in their policy, also varying greatly in the scope and level of detail. For instance, landfill and energy recovery strategies are the most frequently formulated strategies by the countries. In the Latin American context, according to Colorado et al.(2022), in most countries with the exception of Brazil, the available information on CDW waste management system is very scarce. Even though, with the available information it is evident that unlike in developed countries, waste minimisation strategies are rarely implemented.
A number of studies focused on analysing waste management evaluation indicators can be found in the literature. Turcott Cervantes et al. (2018) identified the MSW management system evaluation indicators proposed over the period 1980–2018 and classified them according to the stage of the system they affect, the conclusion being that, for the most part, they are linked to the collection stage, followed by recovery and treatment, and finally disposal. Concerning CDW management systems, Menegaki and Damigos (2018) identified a total of 36 factors that have both positive and negative effects on the generation and efficient management of CDW, as well as the statistical correlation between them. They also concluded that factors such as the lack of specific CDW legislation, noncompliance with legislation or the absence of good practices, among others, have a negative influence on the generation of CDW.
Furthermore, Shi and Xu (2021) concluded that for a correct evaluation of CDW management systems, it is important to incorporate indicators that evaluate parameters such as the distance to the final disposal site, the amount of CDW generated, the potential for recycling or transport. Wang et al. (2014) identified six key factors that have a positive influence on CDW minimisation strategies as of the building design stage and include the use of building elements such as large-panel metal formworks and prefabricated components, carrying out fewer design modifications and using modular design, or, from a bureaucratic perspective, boosting waste reduction investment and promoting economic incentives. However, in the literature reviewed, the indicators found have a top-down approach, and are usually evaluated with macroeconomic data about the country or region in which they are implemented and, therefore, they do not provide a bottom-up view of the strategies that can be implemented at the building and user levels.
On the other hand, in the field of building, there are systems of indicators that are aimed at assessing the sustainability performance of buildings. These systems are grouped under the generic name of green building rating systems (GBRS) and the best known are, among others, BREEAM (BRE Global, 1990), LEED (US GBC, 2009) or CASBEE (JaGBC, 2014). Generally, each GBRS is accommodated to the context-specific features of the region under which it was developed (De Góes et al., 2021) and evaluates several aspects clustered in topic categories such as energy, water, pollution, use of material resources, transport, etc., as well as waste (Luangcharoenrat and Intrachooto, 2018). The importance of each of these aspects varies from one system to another, although the energy and occupant well-being categories are the most recurrent (Lee, 2013). According to Varma and Palaniappan (2019); however, the waste category is one of the least present in the GBRS, as the indicators related to it only represent between 2.7 and 14.7% of the total score.
According to Wu et al. (2016), on analysing the waste indicators included in different GBRS, it was found that these indicators are oriented towards fulfilling the principles of the 3Rs (reduce, reuse and recycle), and are mostly linked to reuse and recycling strategies, neglecting to some extent reduction strategies, which is the first that should be given priority, according to the waste hierarchy. More recently, Lu et al. (2019) concluded that GBRSs do not greatly promote superior CDW performance and the causes, as informed by the experts interviewed, include the design of rating systems themselves, developers’ biases and lack of legal and economic incentives to improve CDW. Legal and economic incentives are more decisive drivers of responsible CWM.
From the literature review, it is observed that there is no study specifically focused on the analysis of the indicators included in the GBRS applicable worldwide that are related to waste management, waste fractions or stages of the life cycle of the building on which they are focused, for example. Neither does the literature appear to contain any studies that analyse these indicators from the perspective of relating them to potential strategies to be implemented in a building in order to improve its waste management system, at the user level and throughout the life cycle of the building, with the ultimate aim of increasing its sustainability performance.
Taking this context into account, the aim of this article is to identify the indicators that address waste management in the main GBRS at the international level and in the specific case of Colombia and to analyse them from different points of view, such as the stages of the life cycle of the building, the waste hierarchy and the stages of the management system. It also aims to analyse the level of importance given to these indicators through their weighting within each GBRS and how they can be implemented in a building to improve its level of sustainability. To this end, the following research questions (RQ) are posed, to which this study aims to provide answers:
RQ1: What and how many indicators exist in the GBRS to assess waste management?
RQ2: What kind of waste management indicators are they and what do they assess?
RQ3: What weighting is given to waste management indicators in the assessment of sustainability in the GBRS?
Method
In order to carry out this study, a four-phase procedure was followed, as described below. Each of the first three phases answers one of the three RQ posed.
In Phase I (Selection and review of GBRS indicators), different GBRS were selected to assess the level of sustainability of residential buildings. GBRS that are applicable worldwide were selected, with the aim of extracting as many indicators as possible that cover the international context, together with GBRS specifically applicable to Colombia, since this study involves the application to a dwelling located in that country. For each GBRS, all the sustainability assessment indicators included were identified and classified according to the thematic categories proposed by Braulio-Gonzalo et al. (2015), including the waste category.
In Phase II (Cluster of indicators), the indicators belonging to the waste category were classified according to the following four criteria:
The waste fraction assessed: MSW or CDW.
The stages of the life cycle of the building process according to the Royal Institute of British Architects Plan of Work (RIBA, 2020) – design, construction, use and end of life – and the information modules for the different stages of the life cycle of a building proposed by EN 15978 (2012) and EN 15804 (2013) – product stage (A1–A3), construction stage (A4–A5), use stage (B1–B7), end-of-life stage (C1–C4) and benefits and loads beyond the system boundary (D).
The waste hierarchy proposed by Directive 2008/98/CE (Parlamento Europeo, 2008): prevention, preparation for reuse, recycling, other forms of recovery and disposal.
The stages that make up the waste management system are as follows (Tchobanoglous et al., 1994) pre-collection, collection and transport, treatment and disposal.
Phase III (Weighting analysis) analysed and compared the weighting given to indicators related to waste management for those quantitative GBRS that have a weighting/scoring system.
Finally, in Phase IV (Case study), the set of indicators identified are applied to a case study of a dwelling located in Mosquera (Colombia), as a means of validating the results; after evaluating the indicators, a proposal for improvements to the dwelling is developed.
Results and discussion
Phase I: Selection and review of GBRS indicators
Ten GBRS with global coverage were selected. Eight of them have an international scope: LEED (US GBC, 2019) developed in United States and with versions adapted to more than 160 countries around the world (Doan et al., 2017); BREEAM (BRE Global, 2016) developed in United Kingdom and also with versions adapted to more than 77 countries; CASBEE (IBEC, 2007) developed in Japan; Green Star (GCBA, 2003) developed in Australia, Green Globes (ECD, 2019) developed in Canada; Level(s) (Dodd et al., 2021) recently developed as a common European framework indicator system; DGNB (DGNB, 2018) developed in Germany and adapted to Denmark, Austria, Switzerland and Spain; and Verde (GBCe, 2017) developed in Spain. The other two GBRS analysed have a specific scope of application in Colombia: CASA (CCCS, 2016) and the Sustainable Construction Policy of the Metropolitan Area of Valle de Aburrá (La Política de Construcción sostenible del Área Metropolitana del Valle de Aburrá) (AMVA-UPB, 2015). All the GBRS are quantitative and allow a score to be obtained for the level of sustainability of the building, with the exception of level(s) and AMVA-UPB, which are qualitative and, although they allow the indicators to be assessed independently, they do not give the building an overall score or establish a weighting system.
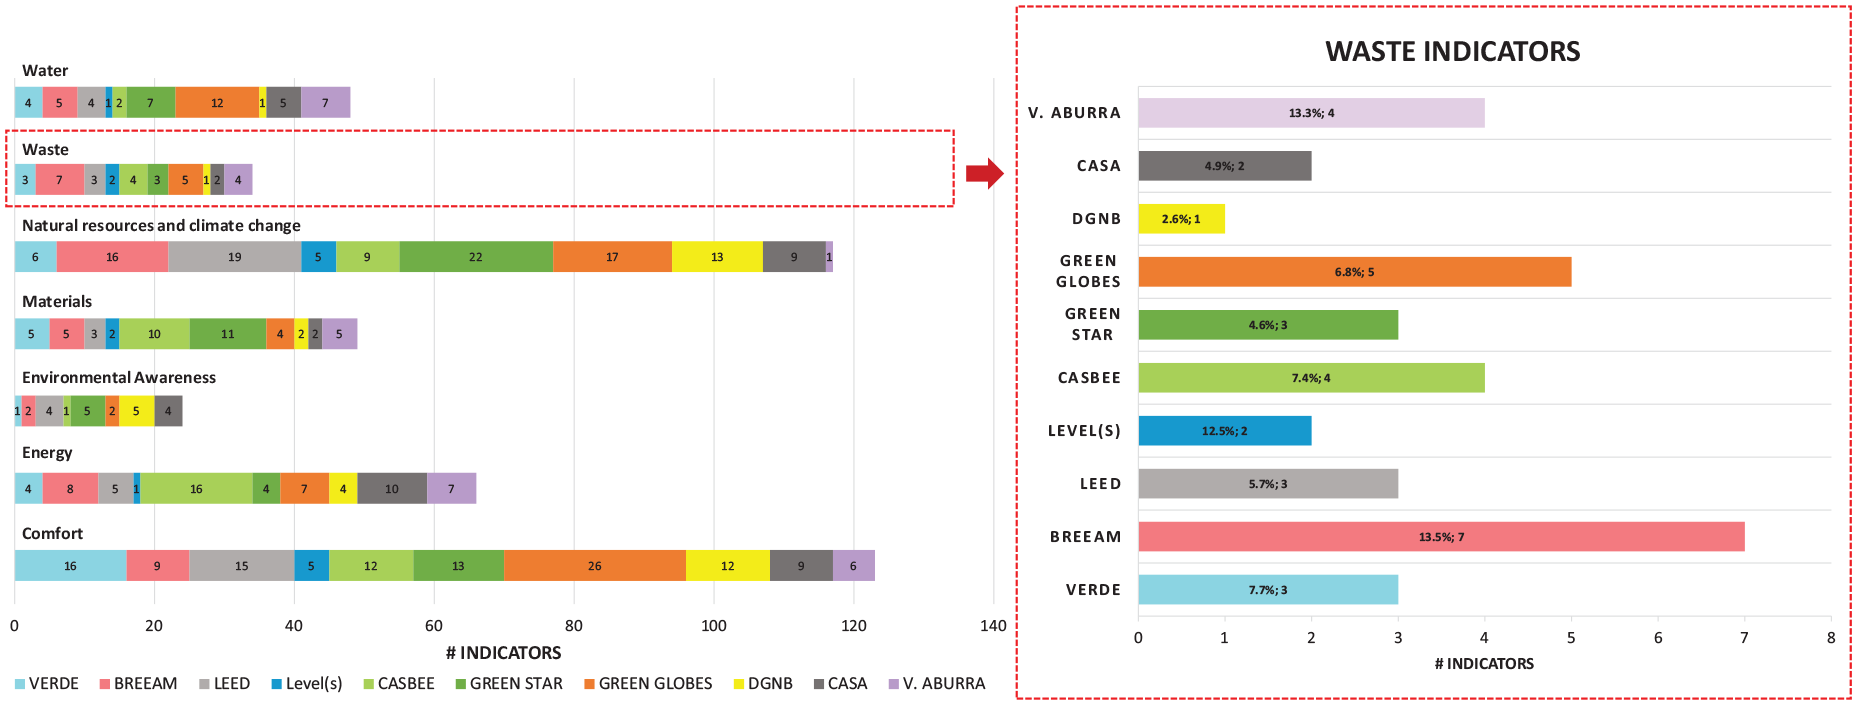
The GBRS selected represent a total of 461 indicators: Verde (39), Building Research Establishment Environmental Assessment Methodology (BREEAM) (49), Leadership in Energy and Environmental Design (LEED) (53), Level(s) (16), Comprehensive Assessment System for Built Environment Efficiency (CASBEE) (57), Green Star (65), Green Globes (73), Deutsche Gesellschat für Nachhaltiges Bauen (DGNB) (38), CASA (41) and AMVA-UPB (30). The Supplemental Material provides an exhaustive list and the codings of the indicators included in each GBRS, although each of them classifies its indicators according to its own system of categories. In order to be able to compare them, the indicators have been classified according to the following common categories: water, nature and climate change, materials, environmental awareness, energy, comfort and waste, proposed by Braulio-Gonzalo et al. (2015). Figure 1 shows, on one hand, the number of indicators present in each of these categories, thereby identifying a total of 34 indicators related to waste. On the other hand, for each of the 10 GBRS, it shows the number of waste-related indicators and the percentage that this represents in relation to the total number of indicators included. Figure 1 shows that the categories with the most indicators are comfort (123 indicators), nature and climate change (117 indicators) and energy (66 indicators), and those with the least are waste (34 indicators) and environmental awareness (24 indicators). Thus, on average, the waste category makes up only 7.9% of the GBRS indicators. It can also be seen that the GBRS with the highest number of indicators related to waste management is BREEAM, with a total of seven indicators that account for 13.5% of the total number of indicators included in the system. The GBRS that gives the lowest level of importance to this category is the DGNB system, with only one indicator (2.6% of the total number of indicators in the system).
Indicators related to waste management.
The 34 indicators belonging to the waste category were analysed in depth in order to unify their nomenclature depending on the objective they pursue. Table 1 lists all the indicators identified in the GBRS and associates them with a common terminology.
GBRS indicators included in the category waste and standardised nomenclature.
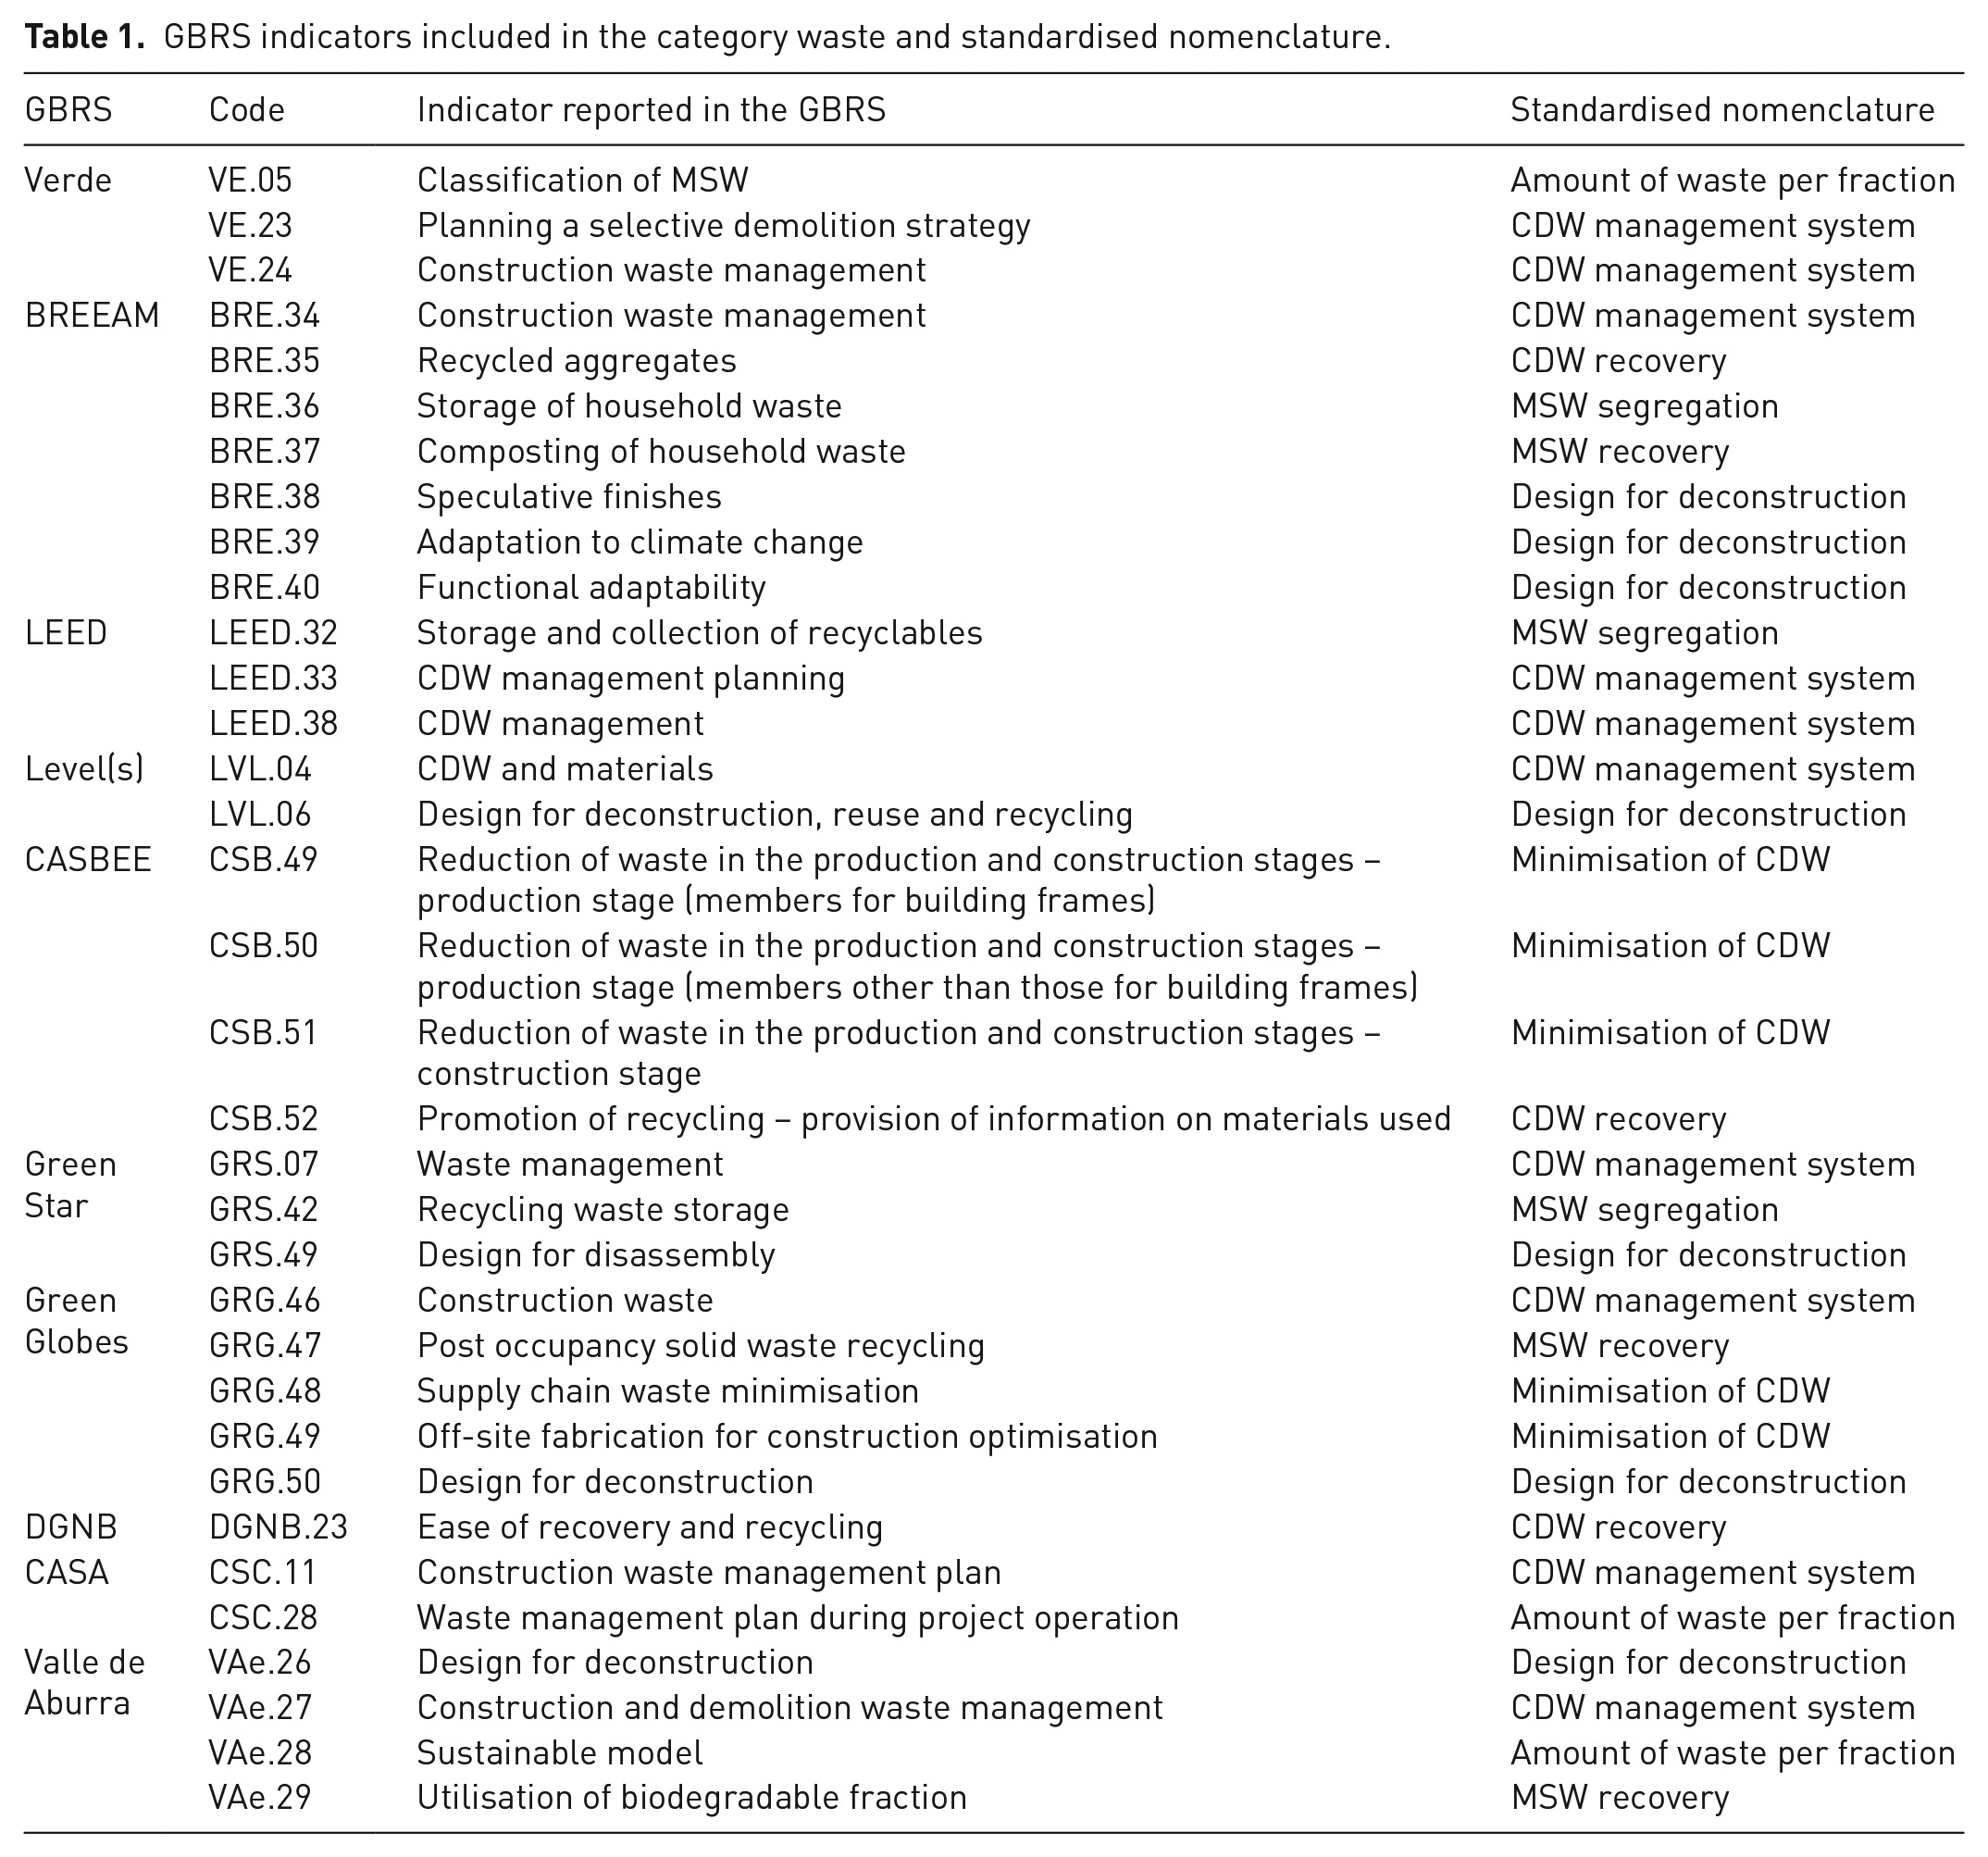
From the identification of the indicators, it can be seen that CDW management system appears in all the GBRS analysed, except for CASBEE and DGNB, and includes a total of 10 indicators, making it the one with the highest number. It is followed by Design for deconstruction, encompassing seven indicators from five GBRS, the BREEAM system being the one that addresses this indicator with the greatest emphasis. CDW minimisation comprises five indicators, collected in the CASBEE and GREEN GLOBES systems. CDW/MSW recovery, amount of waste per fraction and MSW segregation each comprise three indicators. It should be noted that design for deconstruction is gaining strength among the GBRS, mainly due to the fact that the new version of BREEAM includes three specific indicators for this purpose.
Phase II: Cluster of indicators
According to the life cycle stage of the building
The indicators belonging to the waste category have been classified according to the life cycle stage they refer to: design, construction, use or end-of-life. Figure 2(a) shows the distribution of the number of indicators by stage and by GBRS, differentiating between CDW and MSW. The percentage corresponds to the distribution of the number of indicators of each classification in relation to each GBRS. Thus, for example, in the AMVA-UPB GBRS of Colombia, 25% of the waste indicators evaluate the management of CDW in the design phase, 25% address the management of CDW in the construction phase and 50% consider the management of MSW in the use phase.
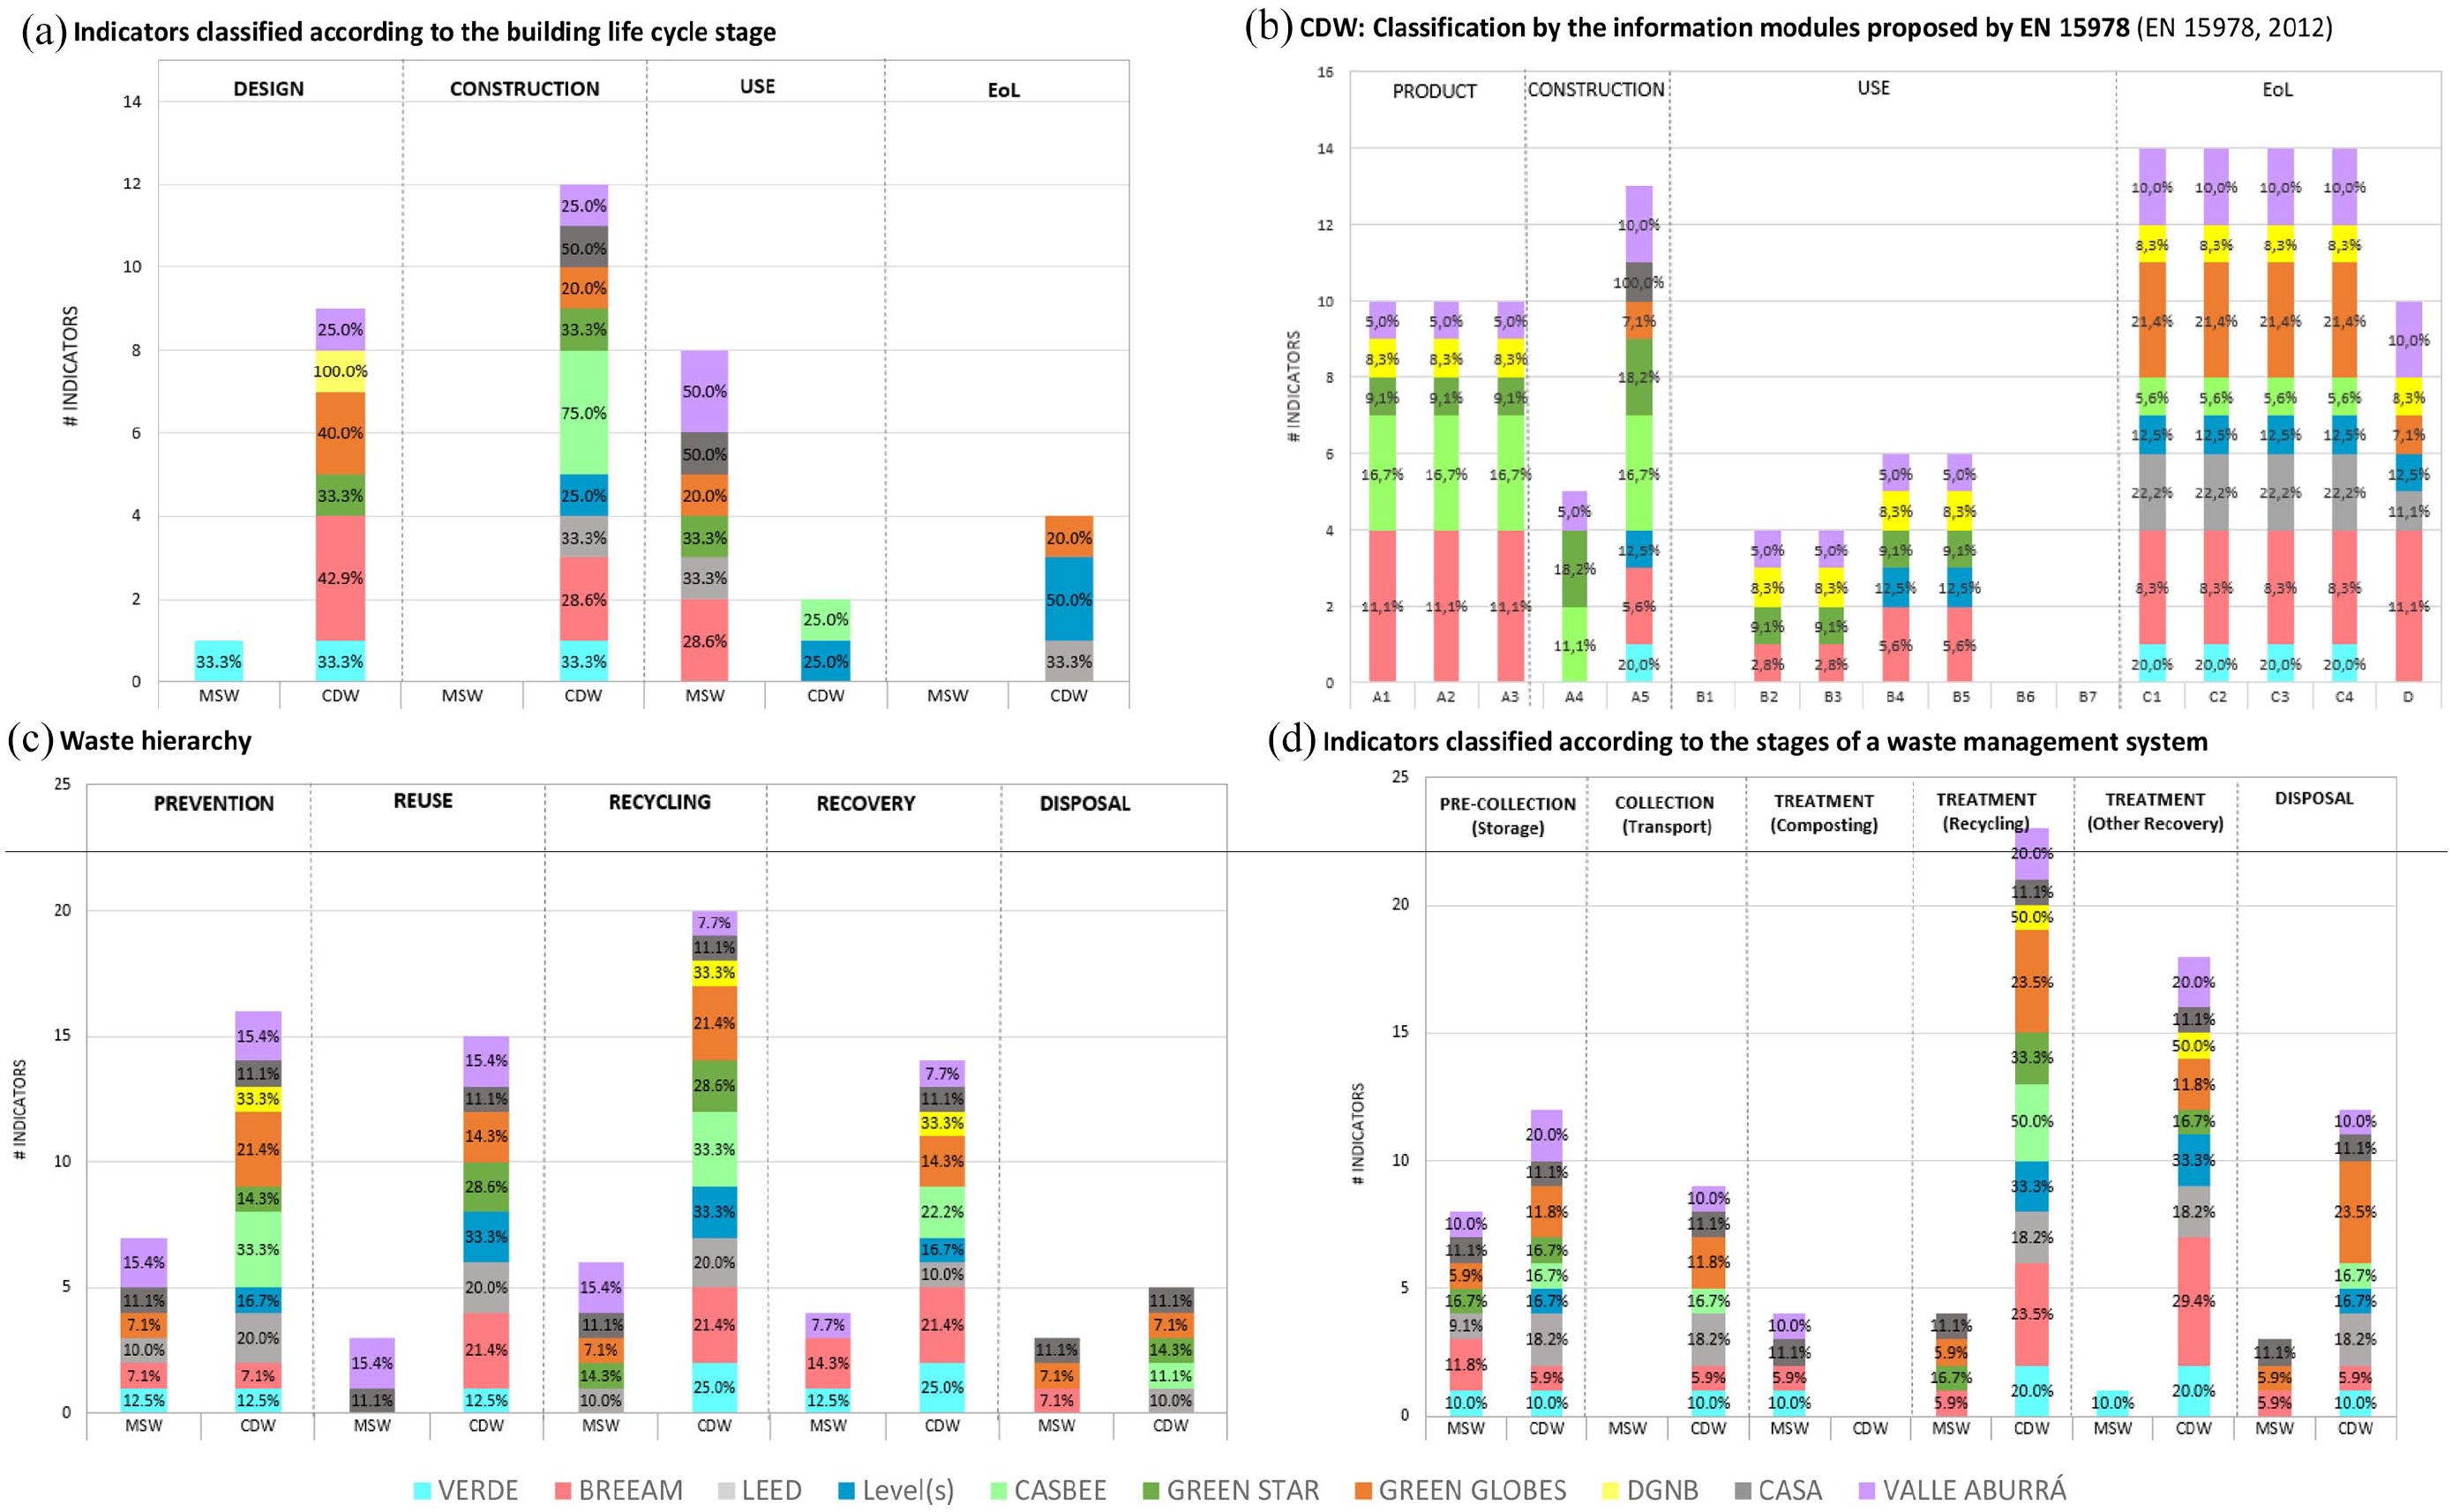
Cluster of waste management indicators: (a) indicators classified according to the building life cycle stage, (b) CDW: classification by the information modules proposed by EN 15978 (EN 15978, 2012), (c) waste hierarchy and (d) indicators classified according to the stages of a waste management system.
Regarding the indicators linked to MSW, in Figure 2(a) it can be seen that the indicators are clearly more related to the use stage of the building, which is when this waste fraction is produced. The BREEAM and AMVA-UPB systems are the ones that consider this waste fraction the most, as both segregation and recovery. In the design phase of the building, only Verde considers the MSW fraction in terms of a collection and segregation site for this type of waste at the design stage. None of the systems consider indicators related to MSW management during the construction and end-of-life stages.
With regard to CDW-related indicators, Figure 2(a) shows that there are indicators related to all the stages of the life cycle of the building. In the construction stage, there is a greater number of indicators (related to CDW storage on-site or its use, among others), mainly in the CASBEE and BREEAM systems, although with the exception of DGNB, the remaining GBRS analysed have at least one indicator related to this stage. Next in importance is the design stage, with indicators related to the carrying out studies on CDW management studies and design for deconstruction, for example. The GBRS that stands out for having the highest number of indicators linked to this stage is BREEAM (42% of the total), and the only indicator of DGNB relates to this stage. The number of indicators related to the end-of-life (with indicators such as the CDW management system) and use (with indicators related to maintenance and minor work that may be carried out in the dwelling) stages is reduced compared to the rest of the stages of the life cycle of the building.
Hence, while MSW can only be associated with the use stage, CDW is present in all stages of the life cycle of the building. Because of this, and also in view of the importance given by the GBRS to CDW indicators, the CDW is also classified in a more detailed manner according to the reporting modules set out in EN 15978 (2012). Figure 2(b) shows the distribution of the number of indicators per information module, together with the percentage represented in each module in relation to the total number of indicators in the waste category of each GBRS. It should be noted that the same indicator can refer to/assess more than one information module.
It can be seen that, unlike in the classification by stages, the modules most frequently addressed are those assessing the end-of-life (C1-C4), which encompasses the entire CDW management system (transport, treatment, disposal), followed by module A5 (construction), modules A1–A3, which represent the manufacture of construction products and, finally, other limits beyond the system boundary (D). It can also be observed how CDW management is hardly assessed at the use stage of the building in modules B2–B5, as these modules correspond to operations related to the maintenance or rehabilitation of the building.
According to the strategies of the waste hierarchy
In accordance with Directive 2008/98/EC and Directive 2018/851/EC, the indicators were classified according to the hierarchy level they assess (prevention, reuse, recycling, recovery and disposal). Figure 2(c) shows the distribution of the different waste management indicators in relation to the hierarchy levels and the percentage of indicators belonging to each hierarchy level in relation to the total number of indicators in the waste category. It is important to note that some indicators may cover more than one hierarchy level.
On analysing the indicators related to the MSW fraction, it can be seen that they are mostly linked to the prevention strategy and that the system that most promotes this aspect is AMVA-UPB, with indicators such as waste storage. This is followed by the recycling strategy, where AMVA-UPB also stands out with indicators such as MSW separation. The recovery strategy is less well represented, with BREEAM placing the greatest emphasis on it. To a lesser extent, recovery and disposal strategies are found, with indicators such as the use of the biodegradable fraction, which is represented with the highest percentage by AMVA-UPB.
On analysing the indicators related to the CDW fraction, it can be seen that the indicators are mostly linked to the recycling strategy, with DGNB, Level(s) and CASBEE standing out with indicators such as the ease of recycling materials. The prevention strategy is the second most frequently addressed, with DGNB and CASBEE standing out once again, with indicators such as minimisation, incorporating a management system and design for deconstruction. The recovery and reuse strategies, with indicators such as the possibility of reusing the material, are poorly represented, with DGNB being the system that places the greatest emphasis on them. The disposal strategy includes indicators such as minimising the amount of CDW that eventually ends up in landfill, and Green Star is the system that is most closely linked to this strategy.
According to the stages of the waste management system
In the same way as the previous criteria, the indicators in the waste category were classified according to the stages of a waste management system: pre-collection, collection and transport, treatment and disposal, as proposed by Tchobanoglous et al. (1994).
Figure 2(d) shows that the GBRS indicators are most related to the treatment stage in general (recycling and other recovery), followed by pre-collection. It also shows the percentage of indicators belonging to each stage of the management system in relation to the total number of indicators in the waste category for each system. It is important to note that some indicators may cover more than one stage of waste management.
On analysing the indicators related to the MSW fraction, it can be seen that these are mostly linked to the pre-collection stage, with indicators such as the storage of the different fractions represented in a greater proportion by the GBRS Green Star, followed by the treatment stage where recycling and composting of waste is dealt with, and the GBRS Green Star and CASA which have indicators such as including domestic composting or considering a storage unit for usable waste. The disposal stage is scarcely represented by the GBRS, where CASA stands out with indicators such as having a solid waste manager. Other recovery is only considered by Verde, with an indicator related to energy recovery. The collection stage is not linked to any GBRS, as there are no related indicators such as waste collection, transport or coverage.
An analysis of the indicators related to the CDW fraction shows that the indicators analysed are most closely related to the treatment stage from the point of view of recycling and recovery, with CASBEE and DGNB standing out with indicators such as the reuse of materials and the ease with which materials can be recycled. In second place are the pre-collection and disposal stages, and AMVA-UPB and Green Globes stand out for their more detailed assessment of these stages, with indicators such as on-site waste storage and the percentage of waste that reaches final disposal. In the analysis of the CDW management indicators, it was found that they are related to the collection stage through indicators such as the CDW management plan, which at least all the GBRS evaluate with the exception of DGNB, Green Star and Level(s).
Phase III: Weighting analysis
In this stage, the weight that the indicators belonging to the waste category have on the overall weight of each GBRS is analysed for the quantitative GBRS (all except Level(s) and AMVA-UPB).
Figure 3 shows the distribution of indicators according to the standardised nomenclature in Table 1. It can be seen that the GBRS that give the greatest importance to the waste category are CASBEE and BREEAM, with 7.00 and 6.08% respectively. The other GBRS grant it a level of importance between 3% (DGNB) and 4.55% (CASA). It can also be seen that the indicators that are addressed to a greater extent are those related to the CDW waste management system, as most of the GBRS have at least one related indicator, with the exception of CASBEE and DGNB. In second place is minimisation of CDW, although it is only assessed in CASBEE and Green Globes. Each of these provides a significant number of indicators that assess the CDW minimisation techniques used at the building level. In third place are CDW recovery (in DGNB, CASBEE and BREEAM) and MSW segregation (in LEED, Green Star and BREEAM). To a lesser extent, we also find amount of waste per fraction (in Verde), MSW recovery (in BREEAM and Green Globes) and Design for deconstruction (in Green Globes and BREEAM).
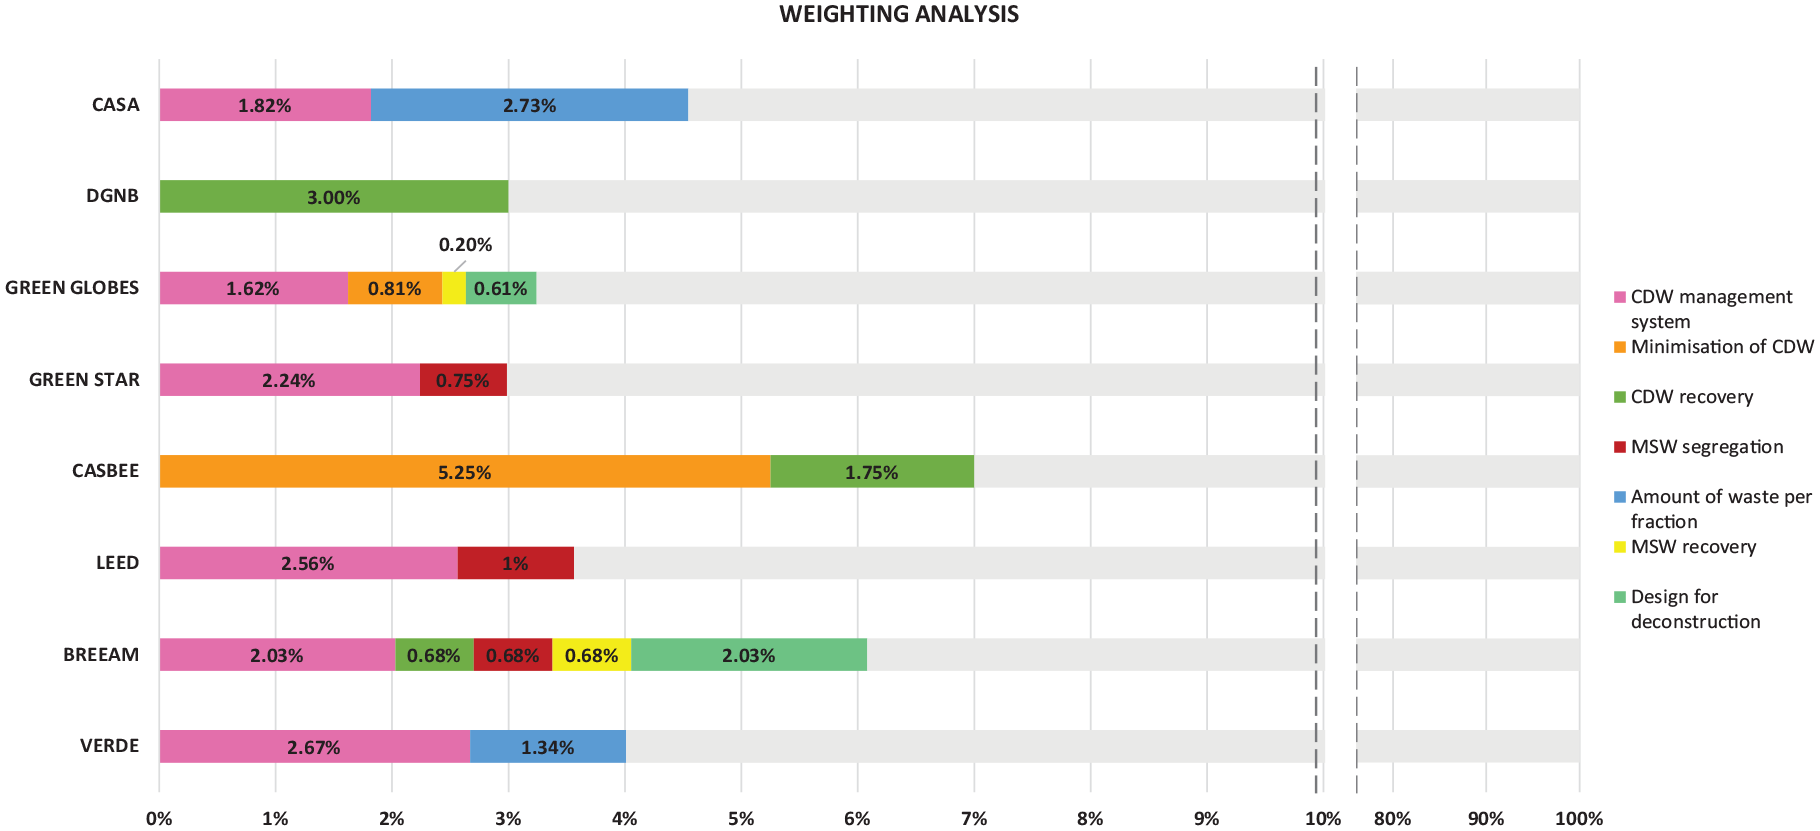
Weighting analysis of waste management indicators by GBRS.
Case study: Mosquera (Colombia)
Description of the case study
The case study chosen to apply the indicators of the different GBRS is a flat in a multi-family residential building located in the urban area of the municipality of Mosquera (Cundinamarca, Colombia). It has a gross internal floor area of 58 m2 (54 m2 usable area) distributed in three bedrooms, two bathrooms, living room, kitchen and laundry room. The building has a common storage room for MSW, which is managed by the municipal company with a collection frequency of 3 days/week and sent to the sanitary landfill ‘Nuevo Mondoñedo’ located 18.8 km away. CDW is also managed by the municipal company and is sent to the municipal tip located 8.1 km away.
Figure 4 shows the distribution of MSW storage space, both in the common areas outside the building and inside the dwelling.
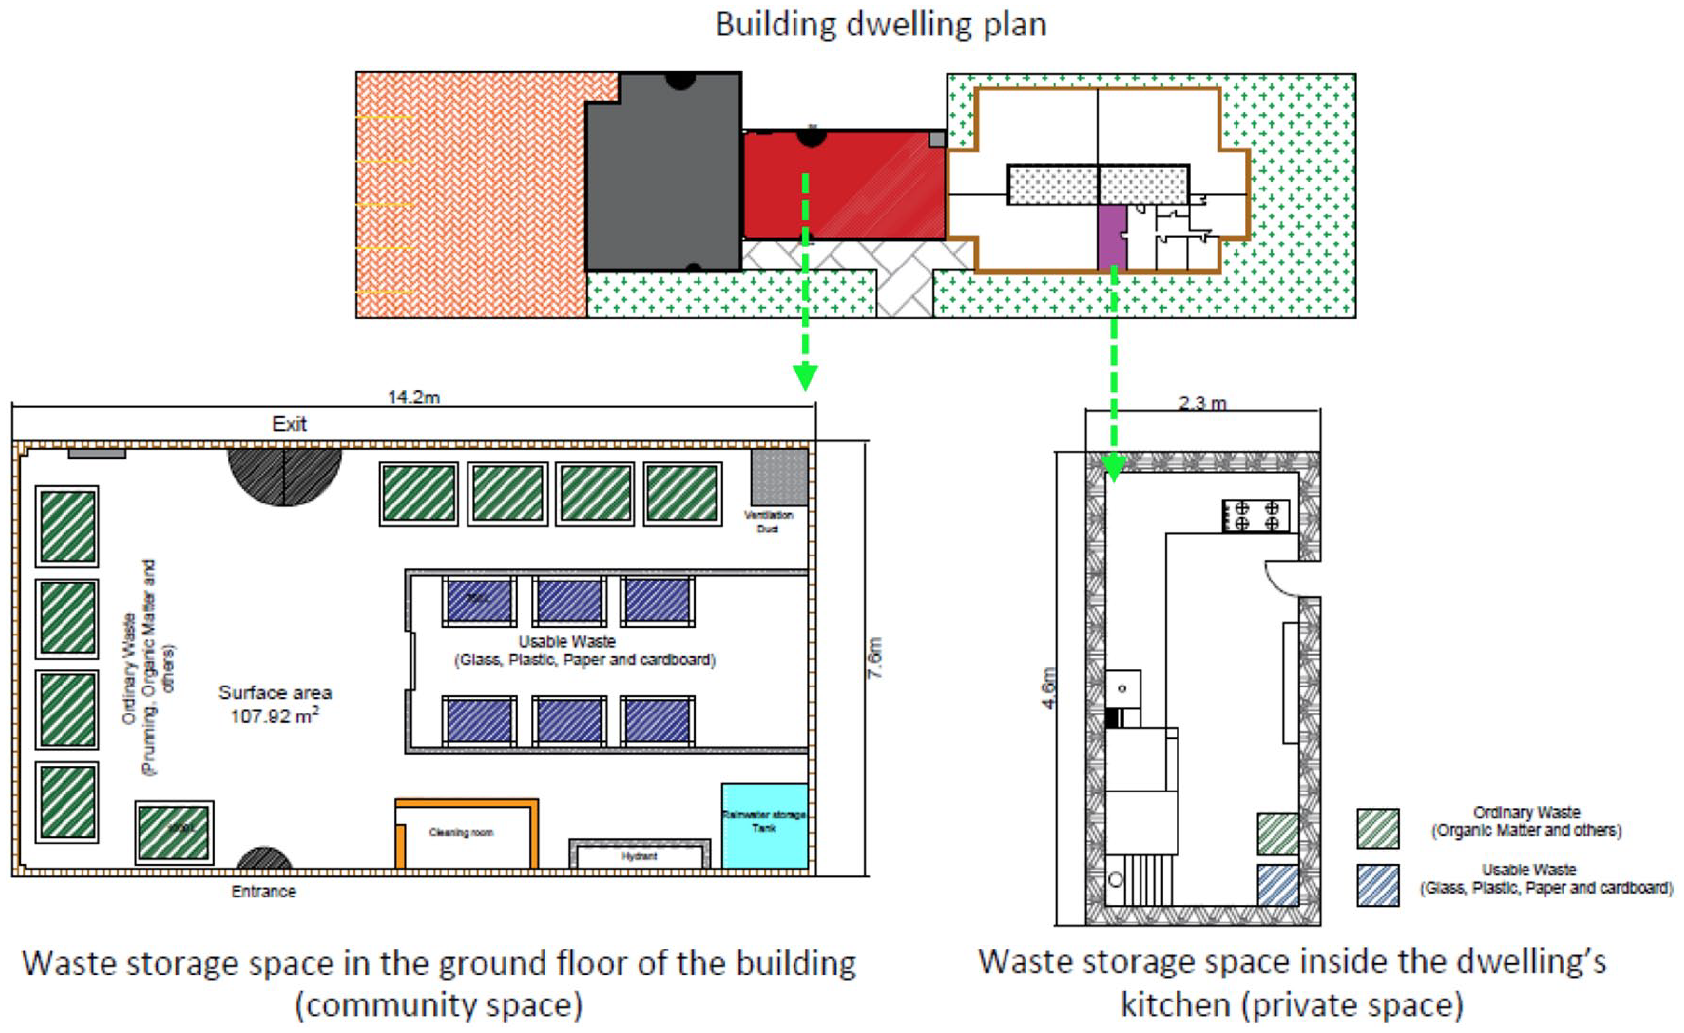
Plan of the waste storage spaces in the building.
Indicators’ evaluation
The indicators related to the waste category belonging to each of the 10 GBRS analysed were applied to the case study. As each GBRS has its own rating system, it is necessary to apply a normalisation of the score in order to be able to compare the results among GBRS. This is performed by using equation (1), which allows the data to be normalised on a scale of 0–100%.

where
NI = normalised index for the waste category in each GBRS (%);
FV = fulfilled value for each indicator (%);
AV = maximum available value for indicators in waste category in each GBRS (%).
The normalised results of the calculation of indicators are shown in Figure 5, grouped by the standardised nomenclature set out in Table 1. The results for each nomenclature showed that for the CDW fraction the building obtained the highest score in Green Star (24.27%), as the dwelling complies with the fact that at least 50% of this waste is recycled or reused, as required by the indicators contained in the system. It is followed by LEED (18.17%), CASA (15.00%), BREEAM (11.8%), Green Globes (9.35%), as the building complies with indicators such as having a CDW management plan, with a bill of quantities, a minimum percentage of CDW that is reused or recycled, having a certified/authorised manager, and a final report on the waste managed during construction, among others.
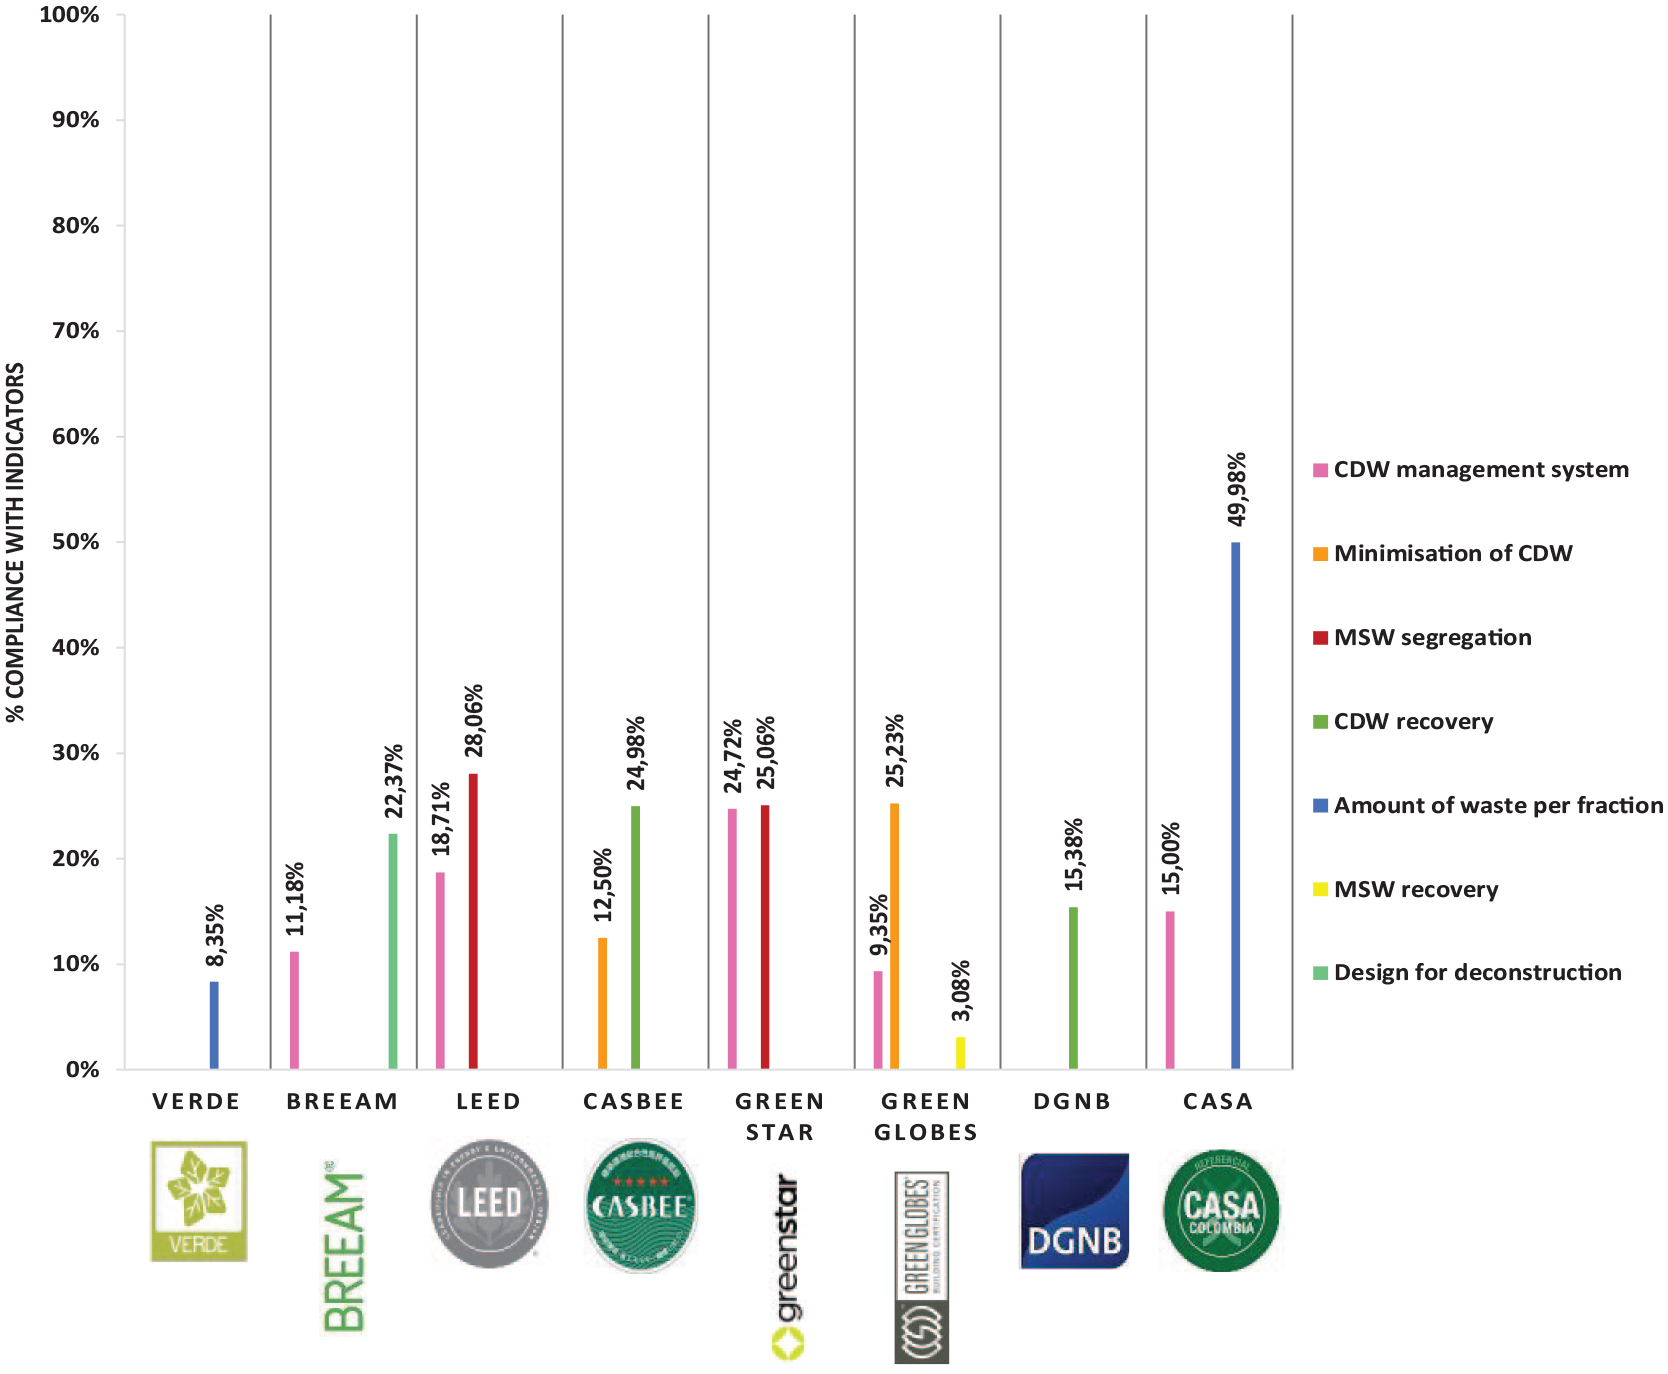
Analysis by indicator of the case study (baseline).
The indicators with the next highest percentage are those related to MSW segregation, where LEED (28.06%) is the GBRS where the building obtains the highest score, complying with indicators such as having a common storage room/space in the building. It is followed by Green Star (25.06%), where the building meets all the criteria established in the indicators, such as complying with the minimum area of storage space and carrying out the separation of waste fractions.
The building, with regard to the indicators related to the CDW minimisation nomenclature, obtained the highest score with the GBRS Green Star (25.23%), followed in second place by CASBEE (12.05%), as the building has prefabricated constructive assemblies and modular parts, both of which are aspects that are taken into high consideration by these GBRS. However, one of the critical points found when evaluating the indicators contained in CDW minimisation is the lack of information on the production process of the companies where the materials come from.
In CDW recovery, the building scored higher in CASBEE (24.98%), as it uses information about the materials and their composition in order to know the recovery potential. These criteria fit better than in DGNB (15.38%), since in the latter it is necessary to fulfil certain criteria, such as the fact that the building incorporates industrialised construction solutions, and this is not the case, since its constructive assemblies are those traditionally used in Colombia.
In terms of amount of waste per fraction, although this is assessed in different GBRS, the building only scored in CASA (46.65%) and Verde (8.35%). In CASA the building complies with criteria such as having waste storage space, but it does not establish any minimum measurements for such spaces. In Verde, criteria such as the minimum required area of storage space and signage are not met. In both GBRS the existence of recovery strategies is evaluated, such as having implemented home composting of waste, which is non-existent in the dwelling.
The MSW assessment for the case study only yielded results in Green Globes with 3.08%, where criteria such as indoor (in the dwelling) and outdoor (in the building) storage space and recyclability are met.
Design for deconstruction is covered by BREEAM and Green Globes. The case study scored only 22.37% with BREEAM, as it meets criteria such as having at least three standardised/industrialised building solutions in all the dwellings and being designed for climate change. However, it is important to note that the building did not obtain any score with Green Globes, as the dwelling does not meet any of the indicators established for its assessment in this GBRS, such as having a deconstruction plan right from the design phase.
As for the GBRS that do not have quantifiable/measurable indicators (AMVA-UPB and Level(s)), Table A1 in Appendix A describes the degree to which the building complies with the indicators proposed by the GBRS.
Proposal for improving
Due to the fact that the dwelling used for the case study scored below 70% in all GBRS, it is considered that there is room for improvement. Therefore, a proposal for improvements is put forward to increase this score. Taking into account the strategies and protocols for sustainable management of CDW and MSW at the building level proposed by the European policies (European Commission, 2016; Parlamento Europeo, 2008) and recent literature (Ortega Acosta et al., 2015; Rondinel-Oviedo, 2021), Table 2 shows those selected as applicable to the case study, together with the indicators concerned and the information module of EN 15978 (2012) to which each proposed strategy relates.
Improvement strategies for the case study.
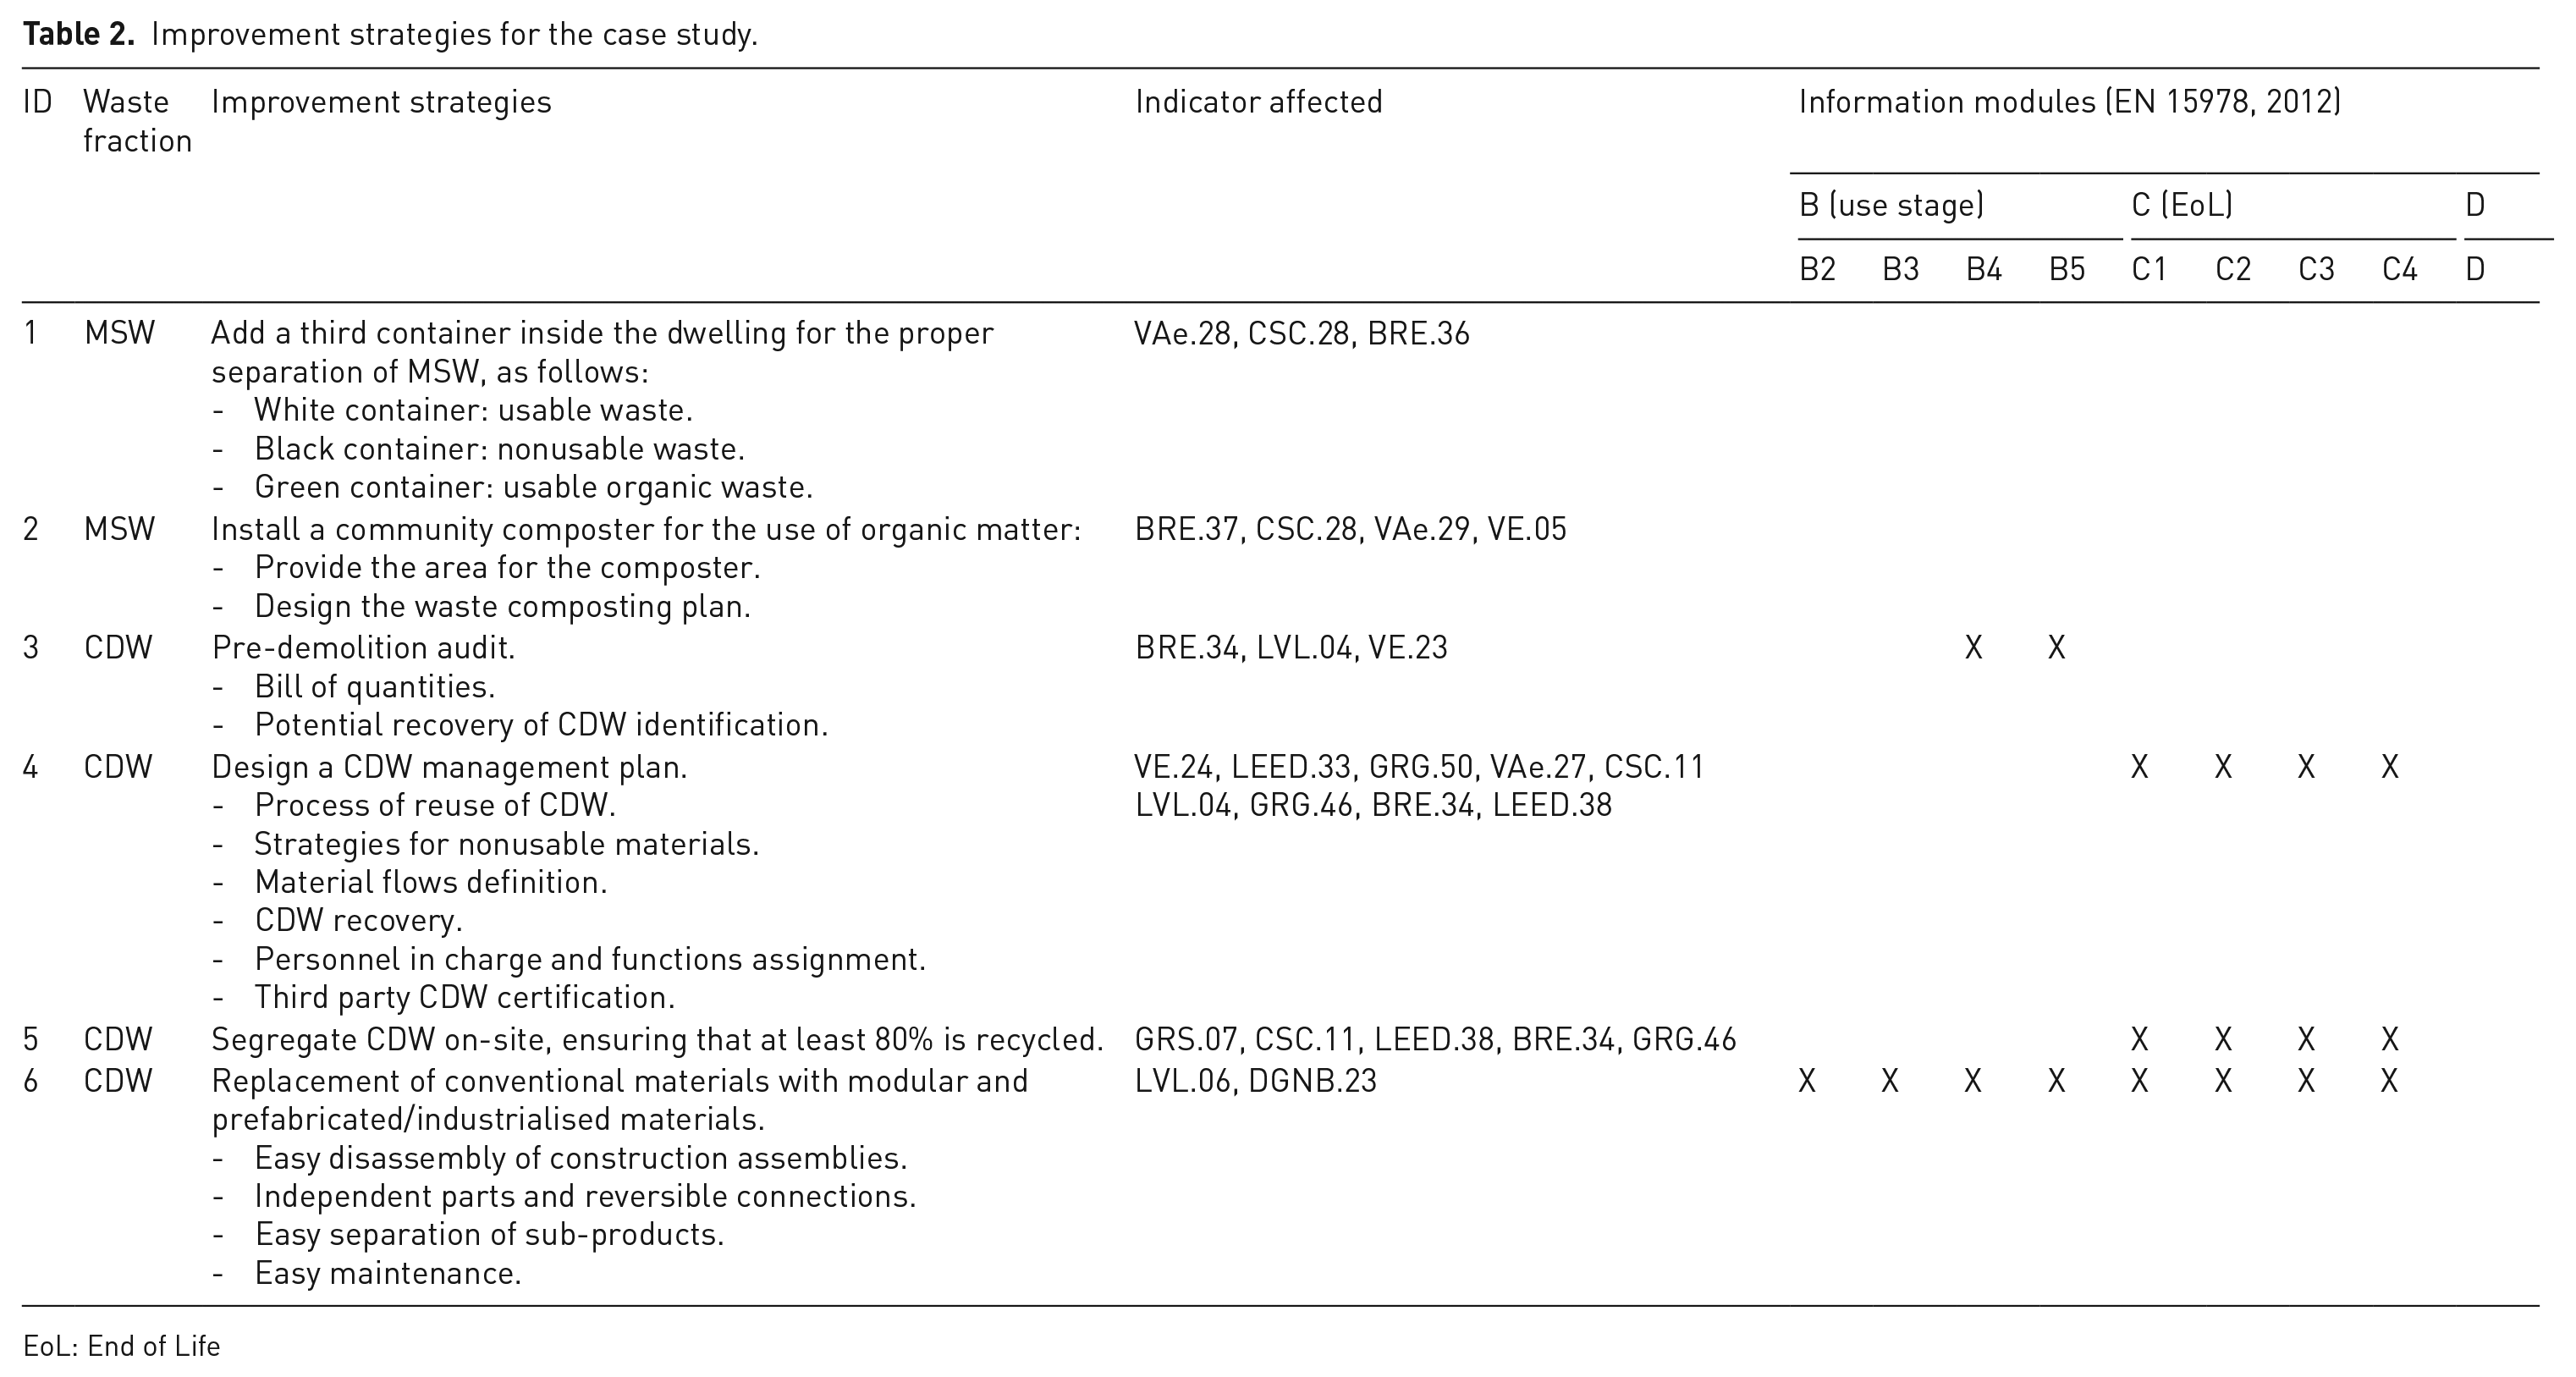
EoL: End of Life
Because the suggested improvement measures are independent of each other, six scenarios were evaluated again, each of which consists in implementing these improvement measures separately and a final scenario where these improvements are implemented together. Figure 6(a) shows the score of the dwelling in each scenario, Figure 6(b) shows the percentage improvement compared to the baseline scenario.
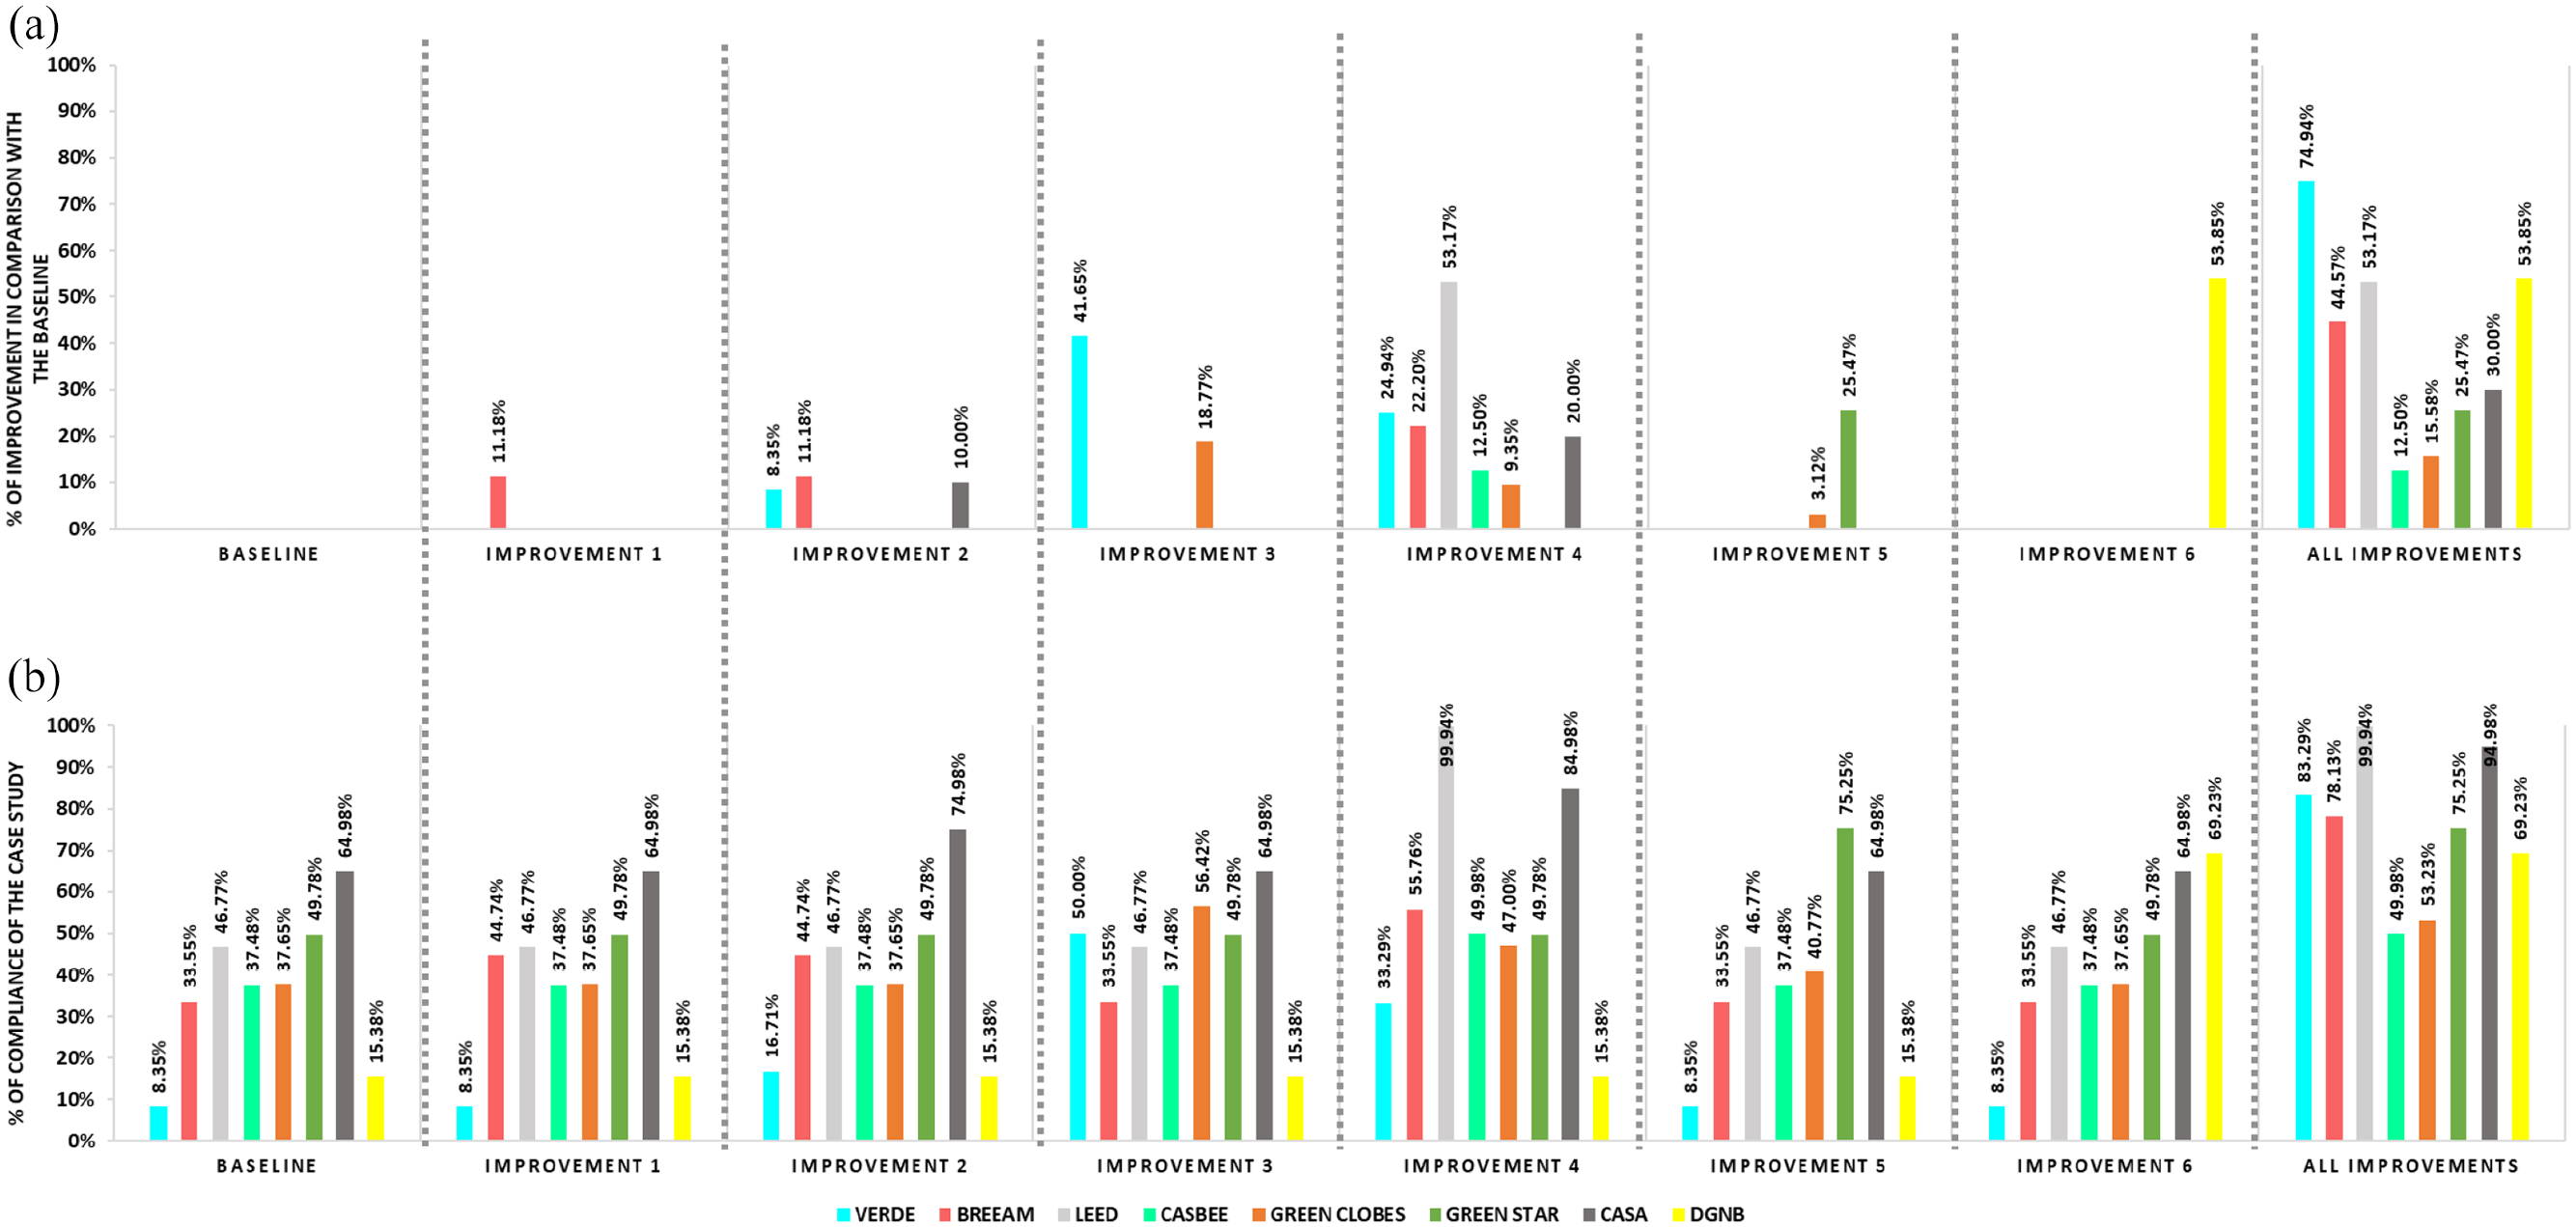
Results of the proposal for improvement: (a) percentage of compliance of the case study and (b) percentage of improvement of the case study in comparison to the baseline.
Figure 6 includes a final scenario in which all improvements are included and implemented simultaneously. By implementing all of them, the waste management in the building would improve significantly, and consequently increase the score above 70% in half of the GBRS (LEED, CASA, Verde, BREEAM and Green Star).
Overall, the following conclusions can be drawn from the results obtained in the evaluation of the possible implementation of the improvement measures in the case study.
Although improvement measures 1 and 2 affect the use stage of the building because they involve improvements in MSW indicators, it is impossible to classify them in more detail as was done for the improvement measures affecting CDW indicators, since there is no module in EN 15978 that addresses the management of MSW during the use stage. The need to include a new information module within EN 15978 to address this aspect is therefore identified. In fact, there are already standards regulating the assessment of the sustainability of buildings (CEN-EN 15643, 2021), which already incorporate a new module B8 addressing this aspect and others related to the user.
With the implementation of all the improvement measures simultaneously, the building’s score would improve by at least 12.5%. The most significant improvement occurs in Verde, where the score increases by 74.94% compared to the baseline, followed by DGNB with 53.85% and CASA with 53.17%.
Implementing all the improvement measures would raise the building’s score to above 70% in half of the GBRS, thereby highlighting the fact that the score for some GBRS comes close to 100% of the weighting proposed for the waste category, as is the case for LEED (99.94%) and CASA (94.98%).
Conclusion
This study investigates the indicators dedicated to waste management in buildings in GBRS. Ten international GBRS were selected, two of which are specifically applicable in the context of Colombia. It was found that the waste category, on average, represents only 7.4% of the total number of indicators contained in the GBRS.
To answer RQ1, regarding what and how many indicators exist in the GBRS to assess waste management, a common nomenclature was established according to the objective of each indicator, and it was concluded that the indicators most addressed, in terms of the number, are: CDW management system, design for deconstruction, CDW minimisation, CDW/MSW recovery, amount of waste per fraction and MSW segregation, in that order.
On the other hand, the waste-related indicators were classified according to various criteria, which made it possible to explore what kind of indicators they are and what they assess, thus answering RQ2. It was observed that the GBRS are mostly oriented to assessing indicators related to CDW management, and these indicators are mainly linked to the design life cycle stage, followed by the construction stage. It is important to stress that the end-of-life stage is one of the least addressed by the GBRS. As for the use stage in the GBRS, indicators are only considered in the case of building rehabilitation.
In terms of the relationship between the indicators of the waste category and the hierarchy established in Directive 2008/98/EC, the CDW indicators are mostly linked to the prevention and recycling strategies. In addition, MSW indicators are mostly linked to the use stage, and most of these indicators are related to the prevention hierarchy level, with the storage and separation at source indicator being the one most addressed by the GBRS. Within the stages of the management system, the indicators are mostly linked to the stage of pre-collection and storage of MSW.
With regard to RQ3, on analysing the weightings attributed to the indicators of the waste category within the GBRS, it was found that they place greater emphasis on the following terminologies, in this order: CDW management system, CDW minimisation, CDW recovery and MSW separation. CASBEE and BREEAM are the GBRS that give the greatest relevance to the waste category, representing an average weighting of 4.4%.
Applying the set of indicators to a case study showed that the highest scores for the building are those obtained in the GBRS that were adapted to the characteristics of the region under study. Furthermore, the case study shows that implementing improvement strategies in a building related to waste management improves its level of sustainability. Finally, it should be noted that in the case of an existing building, there are improvements that cannot be implemented, as these are strategies that should be taken into account in the design stage of the building before it is constructed. This indicates the importance of making decisions from the conception of the building project in the design stage, with a global life cycle approach, as its sustainability performance throughout its useful life will depend on them.
Finally, it can be also concluded that the indicators proposed to evaluate the waste management system, both MSW and CDW, should be able to be adapted to the geographical context and the social and economic specificities of the country where applied. Therefore, as further development and research, it is proposed to widening the scope of the study to other Latin American countries with similar socioeconomic features than Colombia, with the aim of testing if the set of indicators are currently measurable or, otherwise, it is required to improve or adapt the existing sources for data collection.
Supplemental Material
sj-pdf-1-wmr-10.1177_0734242X221143952 – Supplemental material for Exploring how waste management is being approached in green building rating systems: A case study
Supplemental material, sj-pdf-1-wmr-10.1177_0734242X221143952 for Exploring how waste management is being approached in green building rating systems: A case study by Andrea Jorge-Ortiz, Marta Braulio-Gonzalo and María D Bovea in Waste Management & Research
Footnotes
Appendix A
Non-quantifiable GBRS indicators.
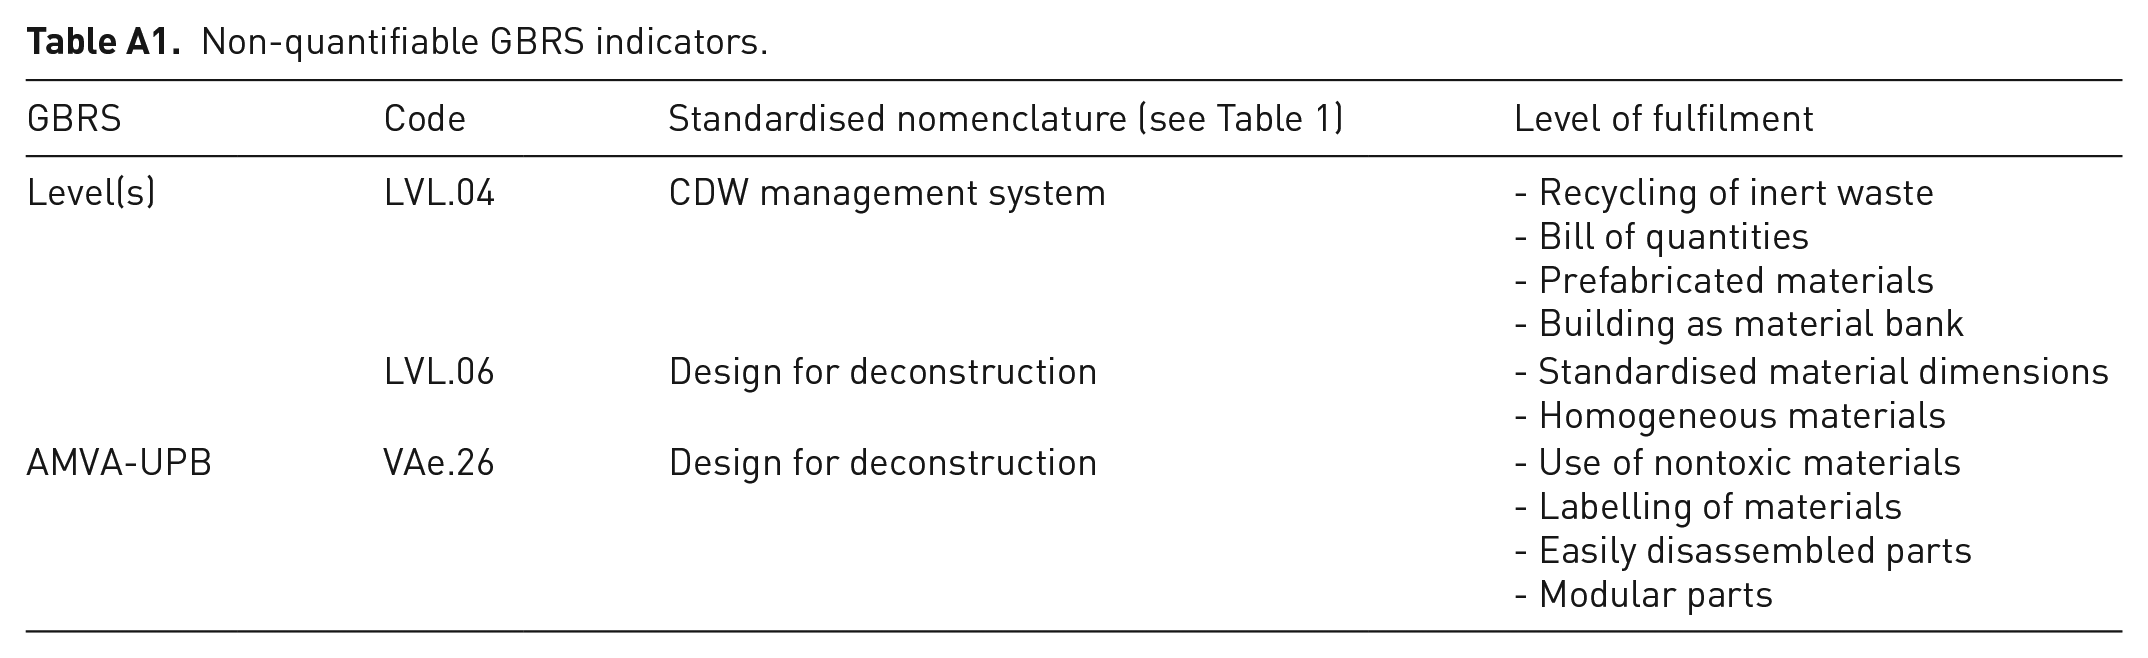
| GBRS | Code | Standardised nomenclature (see Table 1) | Level of fulfilment |
|---|---|---|---|
| Level(s) | LVL.04 | CDW management system | - Recycling of inert waste - Bill of quantities - Prefabricated materials - Building as material bank |
| LVL.06 | Design for deconstruction | - Standardised material dimensions - Homogeneous materials |
|
| AMVA-UPB | VAe.26 | Design for deconstruction | - Use of nontoxic materials - Labelling of materials - Easily disassembled parts - Modular parts |
Declaration of conflicting interests
The authors declared no potential conflicts of interest with respect to the research, authorship, and/or publication of this article.
Funding
The authors disclosed receipt of the following financial support for the research, authorship, and/or publication of this article: The authors would like to thank the Universitat Jaume I of Castellón, Spain, for making this research possible through Project UJI-A2018-11.
Supplemental material
Supplemental material for this article is available online.
References
Supplementary Material
Please find the following supplemental material available below.
For Open Access articles published under a Creative Commons License, all supplemental material carries the same license as the article it is associated with.
For non-Open Access articles published, all supplemental material carries a non-exclusive license, and permission requests for re-use of supplemental material or any part of supplemental material shall be sent directly to the copyright owner as specified in the copyright notice associated with the article.