
Abstract
Technological comparison and system modelling of sewage sludge treatment are important in terms of sustainable development and climate change mitigation. Dewatering and drying are important processes for reducing volume for transportation and often a requirement for further sludge treatment. Inventory data on mass transfers and material and energy consumptions are therefore crucial in improving and understanding sludge management systems. Reviewing the scientific literature (2003–2021) revealed 55 and 21 datasets on dewatering and drying of sewage sludge, respectively. The scarcity of data did not allow for identifying detailed relationships between inputs and outputs for the technologies, but the reviewed data can serve as the first port of call when planning sludge management. The average total solid (TS) content obtained was statistically different for mechanical dewatering (MDW), deep dewatering, bio-drying (BDR) and thermal drying (TDR). Loss of volatile solids (VS) during dewatering is barely described, but a substantial VS loss was observed for TDR (8%) and BDR (27%). The use of chemical agents in MDW showed typical values of 5–15 g kg−1 TS. The use of energy is low for MDW (average of 0.12 and 0.26 kWh kg−1 TS for raw and digested sludges, respectively) but substantially higher for TDR (average of 3.8 kWh kg−1 TS). The justified inventory data for sludge dewatering and drying provide essential support to system modelling and technological comparison in future studies, but additional data from full-scale plants on energy consumption and the composition of removed water are strongly requested to improve the inventory.
Introduction
Sewage sludge is generated daily in large volumes at wastewater treatment plants around the world. It may be managed on-site, but in many cases its management becomes part of the municipal solid waste management system and often takes place at facilities away from the wastewater treatment plant. Sludge management systems normally include technologies of dewatering, anaerobic digestion, composting, drying, incineration and many others. Since large volumes of sewage sludge are generated with high water content, that is, 93–99% according to Chang et al. (2022a), dewatering is thus an acknowledged first step in managing sewage sludge. In some cases, even drying of the sludge may be relevant. Dewatering and drying are both important with regard to not only reducing volume for transportation, but also for further technical handling of sewage sludge.
Globally, there is a need for an improved management of sewage sludge to meet the targets on sustainable development and climate change mitigation. This requires tools such as material flow analysis (MFA) and life cycle assessment (LCA) which allow for comparison of relevant technologies and environmental performance of full systems for treating sewage sludge. System modelling in the form of MFA and LCA has been proposed and applied in many previous works (e.g. Fang et al., 2019; Li and Feng, 2018; Teoh and Li, 2020; Yoshida et al., 2013, 2015), highlighting the importance of providing quantitative reference for planning sludge management. From this point of view, inventory data on the treatment technologies such as thermal, biological and other types are important for proper assessment as described in a few reviews (Chang et al., 2022b, 2023), but also those on dewatering and drying processes, are crucial because they control the fate of sludge fractions to the further technology treatment routes.
A range of dewatering technologies is in place and described in the literature in terms of design parameters (see, e.g. Hu et al. 2021; To et al. 2016; Wei et al. 2018; Wu et al. 2020; Zhang et al. 2019). Additional review papers on dewatering or drying of sludge also summarize the influencing physiochemical properties (Wu et al., 2020), mechanisms and convective models of water removal (Wei et al., 2022) and economic aspects (Zhang et al., 2022). However, in the early phases of planning sewage sludge management and in setting up system models (e.g. Yoshida et al., 2015, 2018), there is a need for information about typical solids content obtainable by alternative dewatering technologies, in terms of the energy input needed and other technology-related parameters. However, in existing studies, these data were reported scattered with various conditions and sources, which make it difficult to use them in comparisons and for generalization. To our knowledge, no compilation of such inventory data exists in the literature. Nonetheless, it would make the initial planning steps, comparisons of technologies and modelling attempts easier and serve as a general reference for assessing a plant-specific sewage sludge dataset.
The purpose of this review is therefore to compile and evaluate available data on inventory parameters describing sewage sludge dewatering (including mechanical dewatering (MDW) and deep dewatering (DDW)) and drying (including bio-drying (BDR) and thermal drying (TDR)). Other dewatering and drying technologies, such as natural evaporation and chemical drying, were not included in this review due to their narrow applications. In particular, the substance transfer coefficients and material and energy consumption during sludge dewatering and drying are analysed from a statistical perspective, to provide relevant generalizable information. Justified data on inventory parameters are crucial in system modelling and thus essential for comparison of alternative sludge dewatering and drying. This review is intended to support future technology comparison and system modelling in sewage sludge management, and inspire researchers and practitioners to report the same consistent data of the same technologies, to further enhance the generalizability and practicality of system modelling on sewage sludge management.
Materials and methods
Web of Science™ was searched for 2003–2021 for papers directly related to sewage sludge dewatering and drying. We identified 108 papers, 51 of which contained 55 datasets on sewage sludge dewatering and 21 datasets on drying. Most of the papers were written within the last decade. The 51 papers are listed in Supplemental Information A2.
The following paragraphs describe our data assessment and define sewage sludge dewatering and drying technologies, including the parameters reviewed. The inventory parameters include total solids (TS) obtained after dewatering and drying of sludge, the consumptions of chemical agents and energy, and the transfer coefficients of TS, volatile solids (VS) and ash (Ash) during the processes.
Data assessment
All of the collected data were compiled in Excel according to sludge type and technology – as defined in the following sections.
The data were checked for an adequate description of the technological features and for plausibility by comparing the values of each parameter within its group and with other relevant parameters. Mass balances were assessed, where possible, and datasets showing large discrepancies were excluded. Not all datasets contained all relevant parameters, but as long as the reported data showed internal consistency, they were included in the assessment.
Intervals, average values, standard deviations and number of datasets were determined for all inventory parameters. Statistical distributions of the main parameters were established, and significance levels were determined. Technically meaningful correlations between data were also identified. The software Origin® was used for the analysis and presentation. The probability density function and the test statistics are described in Supplemental Information A1.
Since the data reported and assessed are of different scales, ranging from laboratory scale and pilot scale to full scale, it is important to be aware of the origin and limitations of the information reviewed herein. Data from full-scale plants report on how the technology is actually performing, but they do not necessarily represent optimal conditions. Data from pilot-scale and laboratory-scale experimental setups may also represent a range of operational conditions to define the best conditions to be used in a prospective full-scale operation. We report all the consistent experimental data, although some of them may not represent optimal conditions or may not become implemented on a full-scale basis. We mark the data presented in this study according to scale, where meaningful and feasible.
Dewatering and drying technologies
Raw sewage sludge may originate from several outlets in the wastewater treatment plant, but it is often mixed and thickened prior to dewatering. This thickened sludge has a TS content of 3.3 ± 1.7% of wet weight, according to Chang et al. (2022a) who summarized data from 58 sewage sludge samples. Dewatering and drying technologies have been described previously (Wakeman, 2007), but herein we consider the following:
MDW is typically done with centrifuges or filter presses, and its efficiency is enhanced using coagulating or flocculating polymers. Dewatering usually takes place early in the management scheme or after the sludge has been anaerobically digested (the latter abbreviated as MDWA). Since anaerobic digestion changes solids and their dewatering characteristics, we address the two situations separately.
DDW is typically done by a plate-frame filter press or by pressurized electro-osmotic dewatering. DDW usually aims to further reduce the water content of dewatered sludge (typically from 15% TS to 40% TS), when needed for the further handling of the sludge. DDW is often used as an alternative to a drying process.
BDR is a partial composting process aiming at removing water rather than mineralizing or stabilizing sludge. Biological drying usually takes 7–20 days in a reactor with high volumes of injected air at temperatures as high as 65°C, caused by microbial activity.
TDR is a common method employed to reduce the water content of dewatered sludge, achieving TS contents of 70–90% in a short time (2–5 hours) as a result of external heating to 100°C–300°C. There are many currently available TDR technologies, such as fluidized bed drying, belt drying, paddle drying, rotary drying and spray drying. Heating methods include direct heating and indirect heating. Direct heating includes electrical heating, microwave heating and solar power heating, with the latter two of these most often being reported for small-scale facilities. Indirect heating uses saturated steam, heat-conducting oil or high-pressure hot water. In some cases, heat used is recovered from the subsequent incineration of dried sludge.
Inventory parameters
The key inventory parameters for sewage sludge dewatering and drying are obtainable TS content, consumables and transfer coefficients, with the latter describing how key components in input sludge are distributed to outputs.
TS: The purpose of dewatering is to reduce the volume of sewage sludge and to ease any further handling. Most technologies remove only part of the water, and so dewatered sewage sludge still contains some water. Thus, a key parameter is the final solid content of sludge (%TS).
Consumables: All sludge dewatering technologies consume energy and coagulating or flocculating agents, while drying technologies use a significant amount of energy.
Transfer coefficients: Ideally, all sludge dewatering and drying technologies only reduce water content and leave all substances in the treated sludge. However, in practice, part of the sludge may be present in removed liquid or lost during the dewatering or drying process. Transfer coefficients expressing how much of the input sludge, in terms of TS, VS and Ash, is found in the dewatered or dried sludge have been compiled or calculated from reported data. Transfer coefficients less than 100% mean that part of the material represented as TS, VS or Ash can be found in the liquid phase or has been volatilized – eventually also partly degraded – during the dewatering or drying process.
Results and discussion
The results are presented in the following sections in terms of TS content achieved by dewatering and drying technologies, consumables and transfer coefficients for the key parameters TS, VS and Ash. Table 1 summarizes the main inventory data for the five technologies reviewed in this paper.
Dewatering and drying of sewage sludge: summary of inventory data for five technologies (details provided in the text, min–max, mean ± SD).
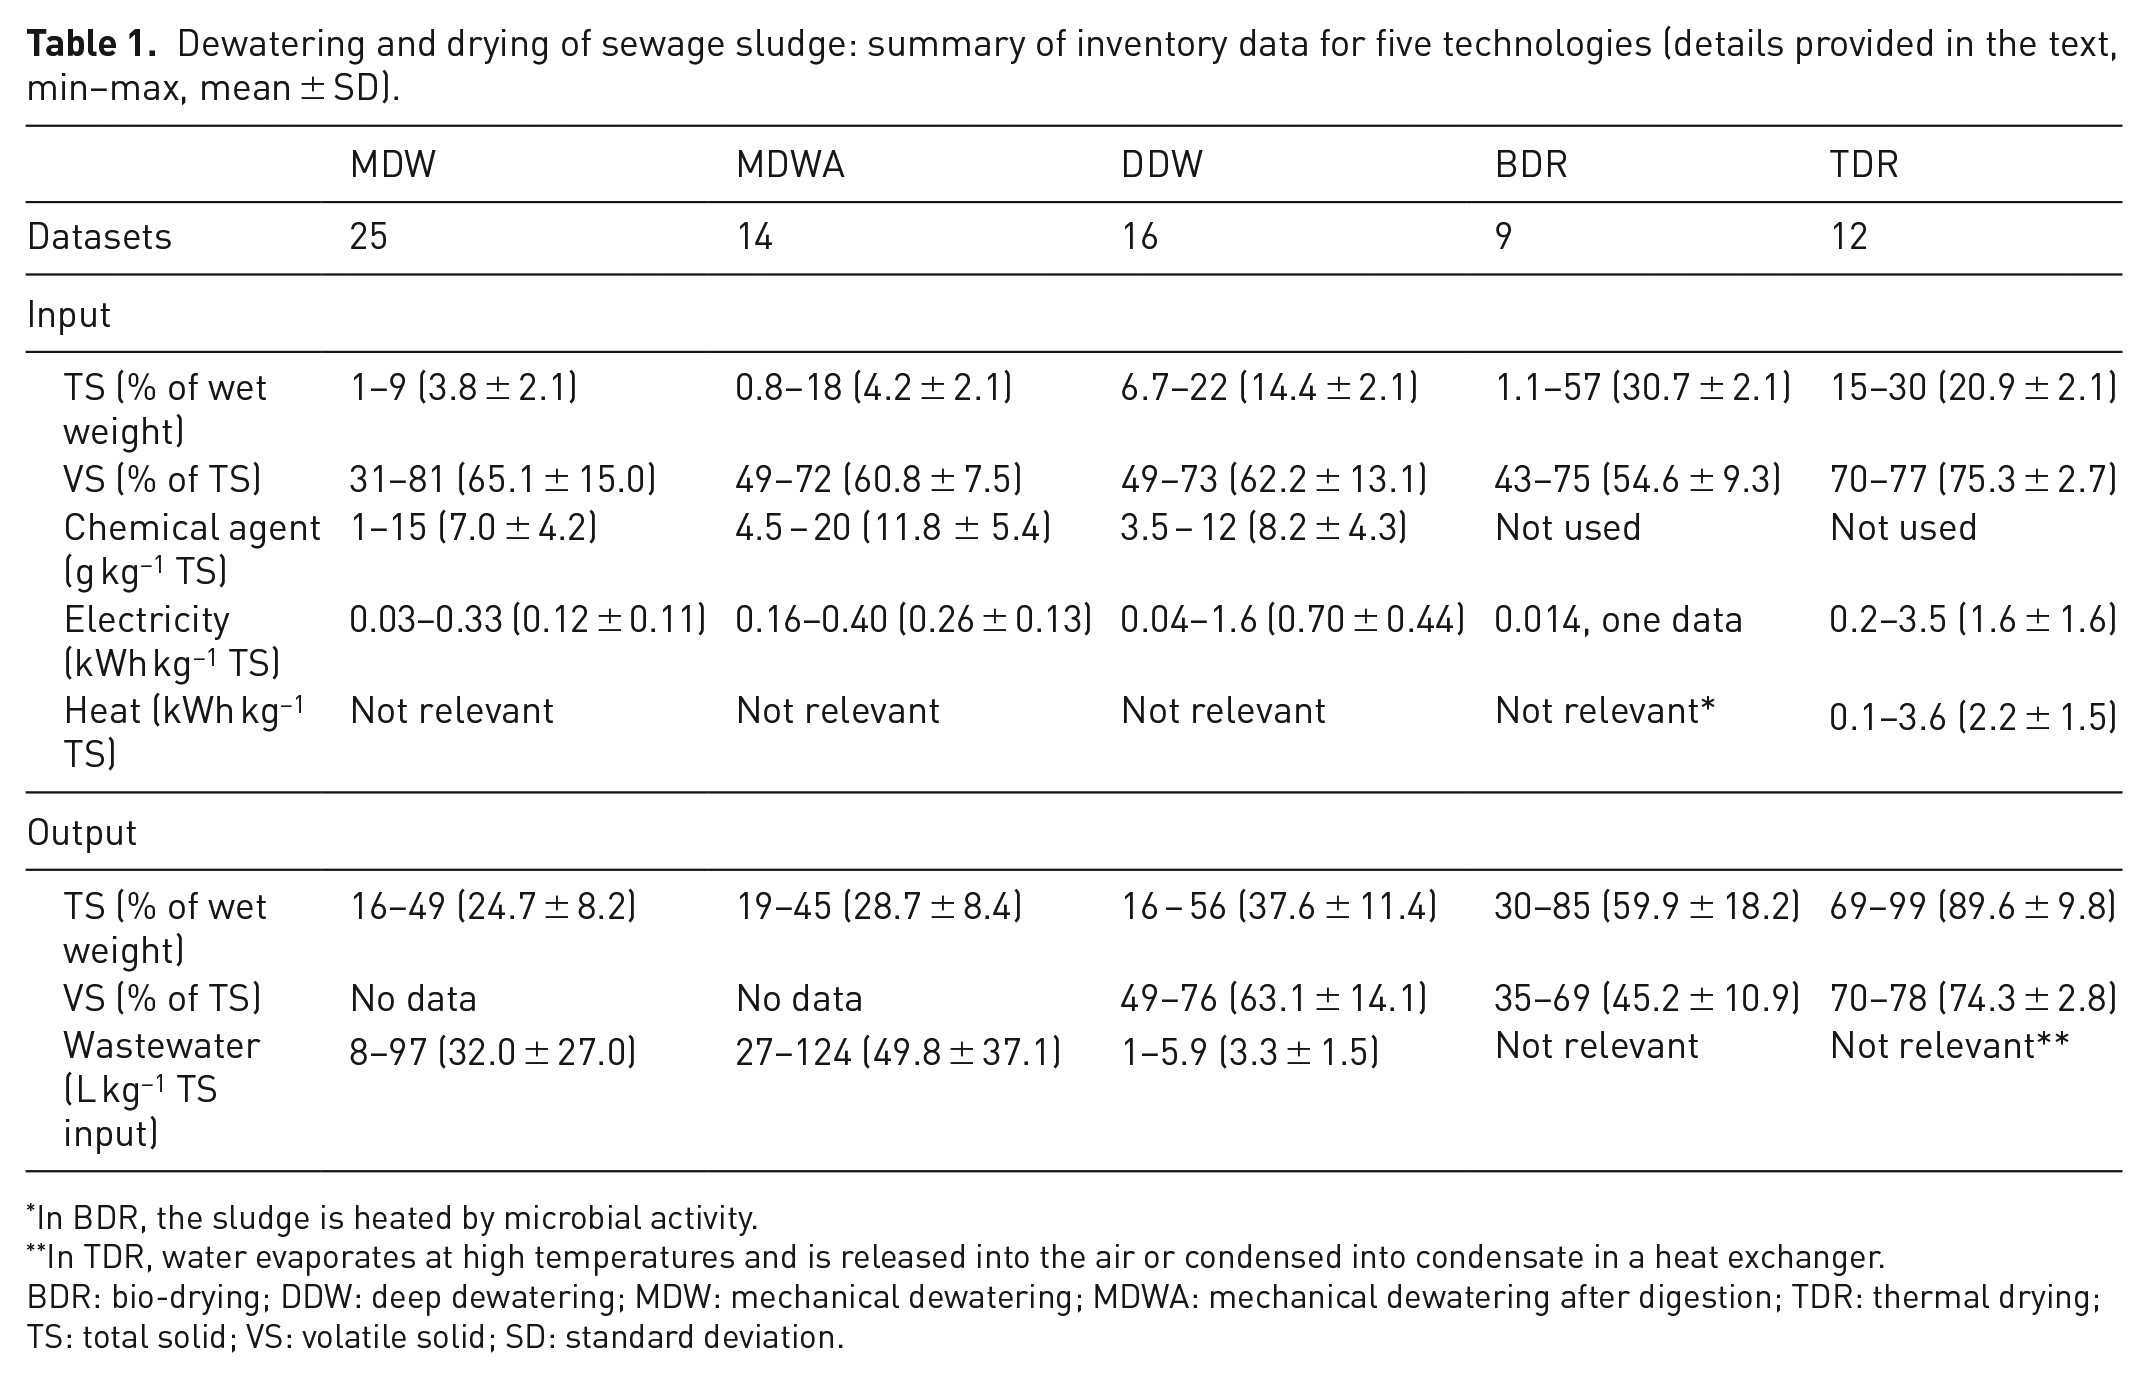
In BDR, the sludge is heated by microbial activity.
In TDR, water evaporates at high temperatures and is released into the air or condensed into condensate in a heat exchanger.
BDR: bio-drying; DDW: deep dewatering; MDW: mechanical dewatering; MDWA: mechanical dewatering after digestion; TDR: thermal drying; TS: total solid; VS: volatile solid; SD: standard deviation.
TS obtained
The removal of water from the sludge is expressed as the %TS obtained by dewatering and drying; Table 1 shows the mean and standard deviations as well as the numbers of observations. Figure 1 shows the distribution of TS content after dewatering and drying. The datasets are rather small and show large variations, but they nevertheless suggest that on average MDW obtains 25% TS, DDW obtains 38% TS, BDR obtains 60% TS and TDR obtains 90% TS. MDW may achieve slightly higher TS content for digested sludge (29% TS) than for raw sludge (25% TS). However, the difference is not statistically significant.
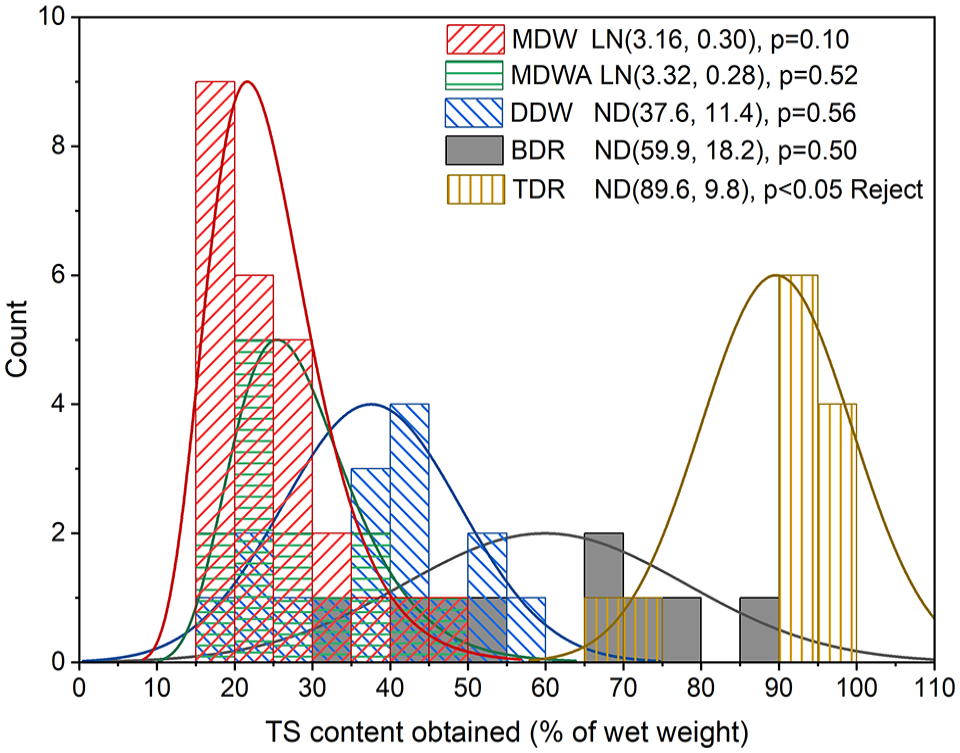
Sewage sludge dewatering and drying: histogram of TS obtained (% of wet weight) after dewatering and drying.
Transfer coefficients
Transfer coefficients reported in the literature or calculated based on published data are presented for TS, VS and Ash in Figure 2 for the five dewatering and drying technologies considered herein. Theoretical curves for the transfer of water to the treated sludge, as well as reported observations for water transfer, are also presented in Figure 2. The further TS, VS or Ash values are above the curves representing the water transfer coefficients, the better the separation of water from solids. For BDR, in Figure 2, three water transfer coefficients are far above the theoretical line, due to mixing with bulking or recycled material, which also contribute with water but which we cannot compensate for when calculating the water transfer coefficient. Average transfer coefficients are summarized in Table 2.
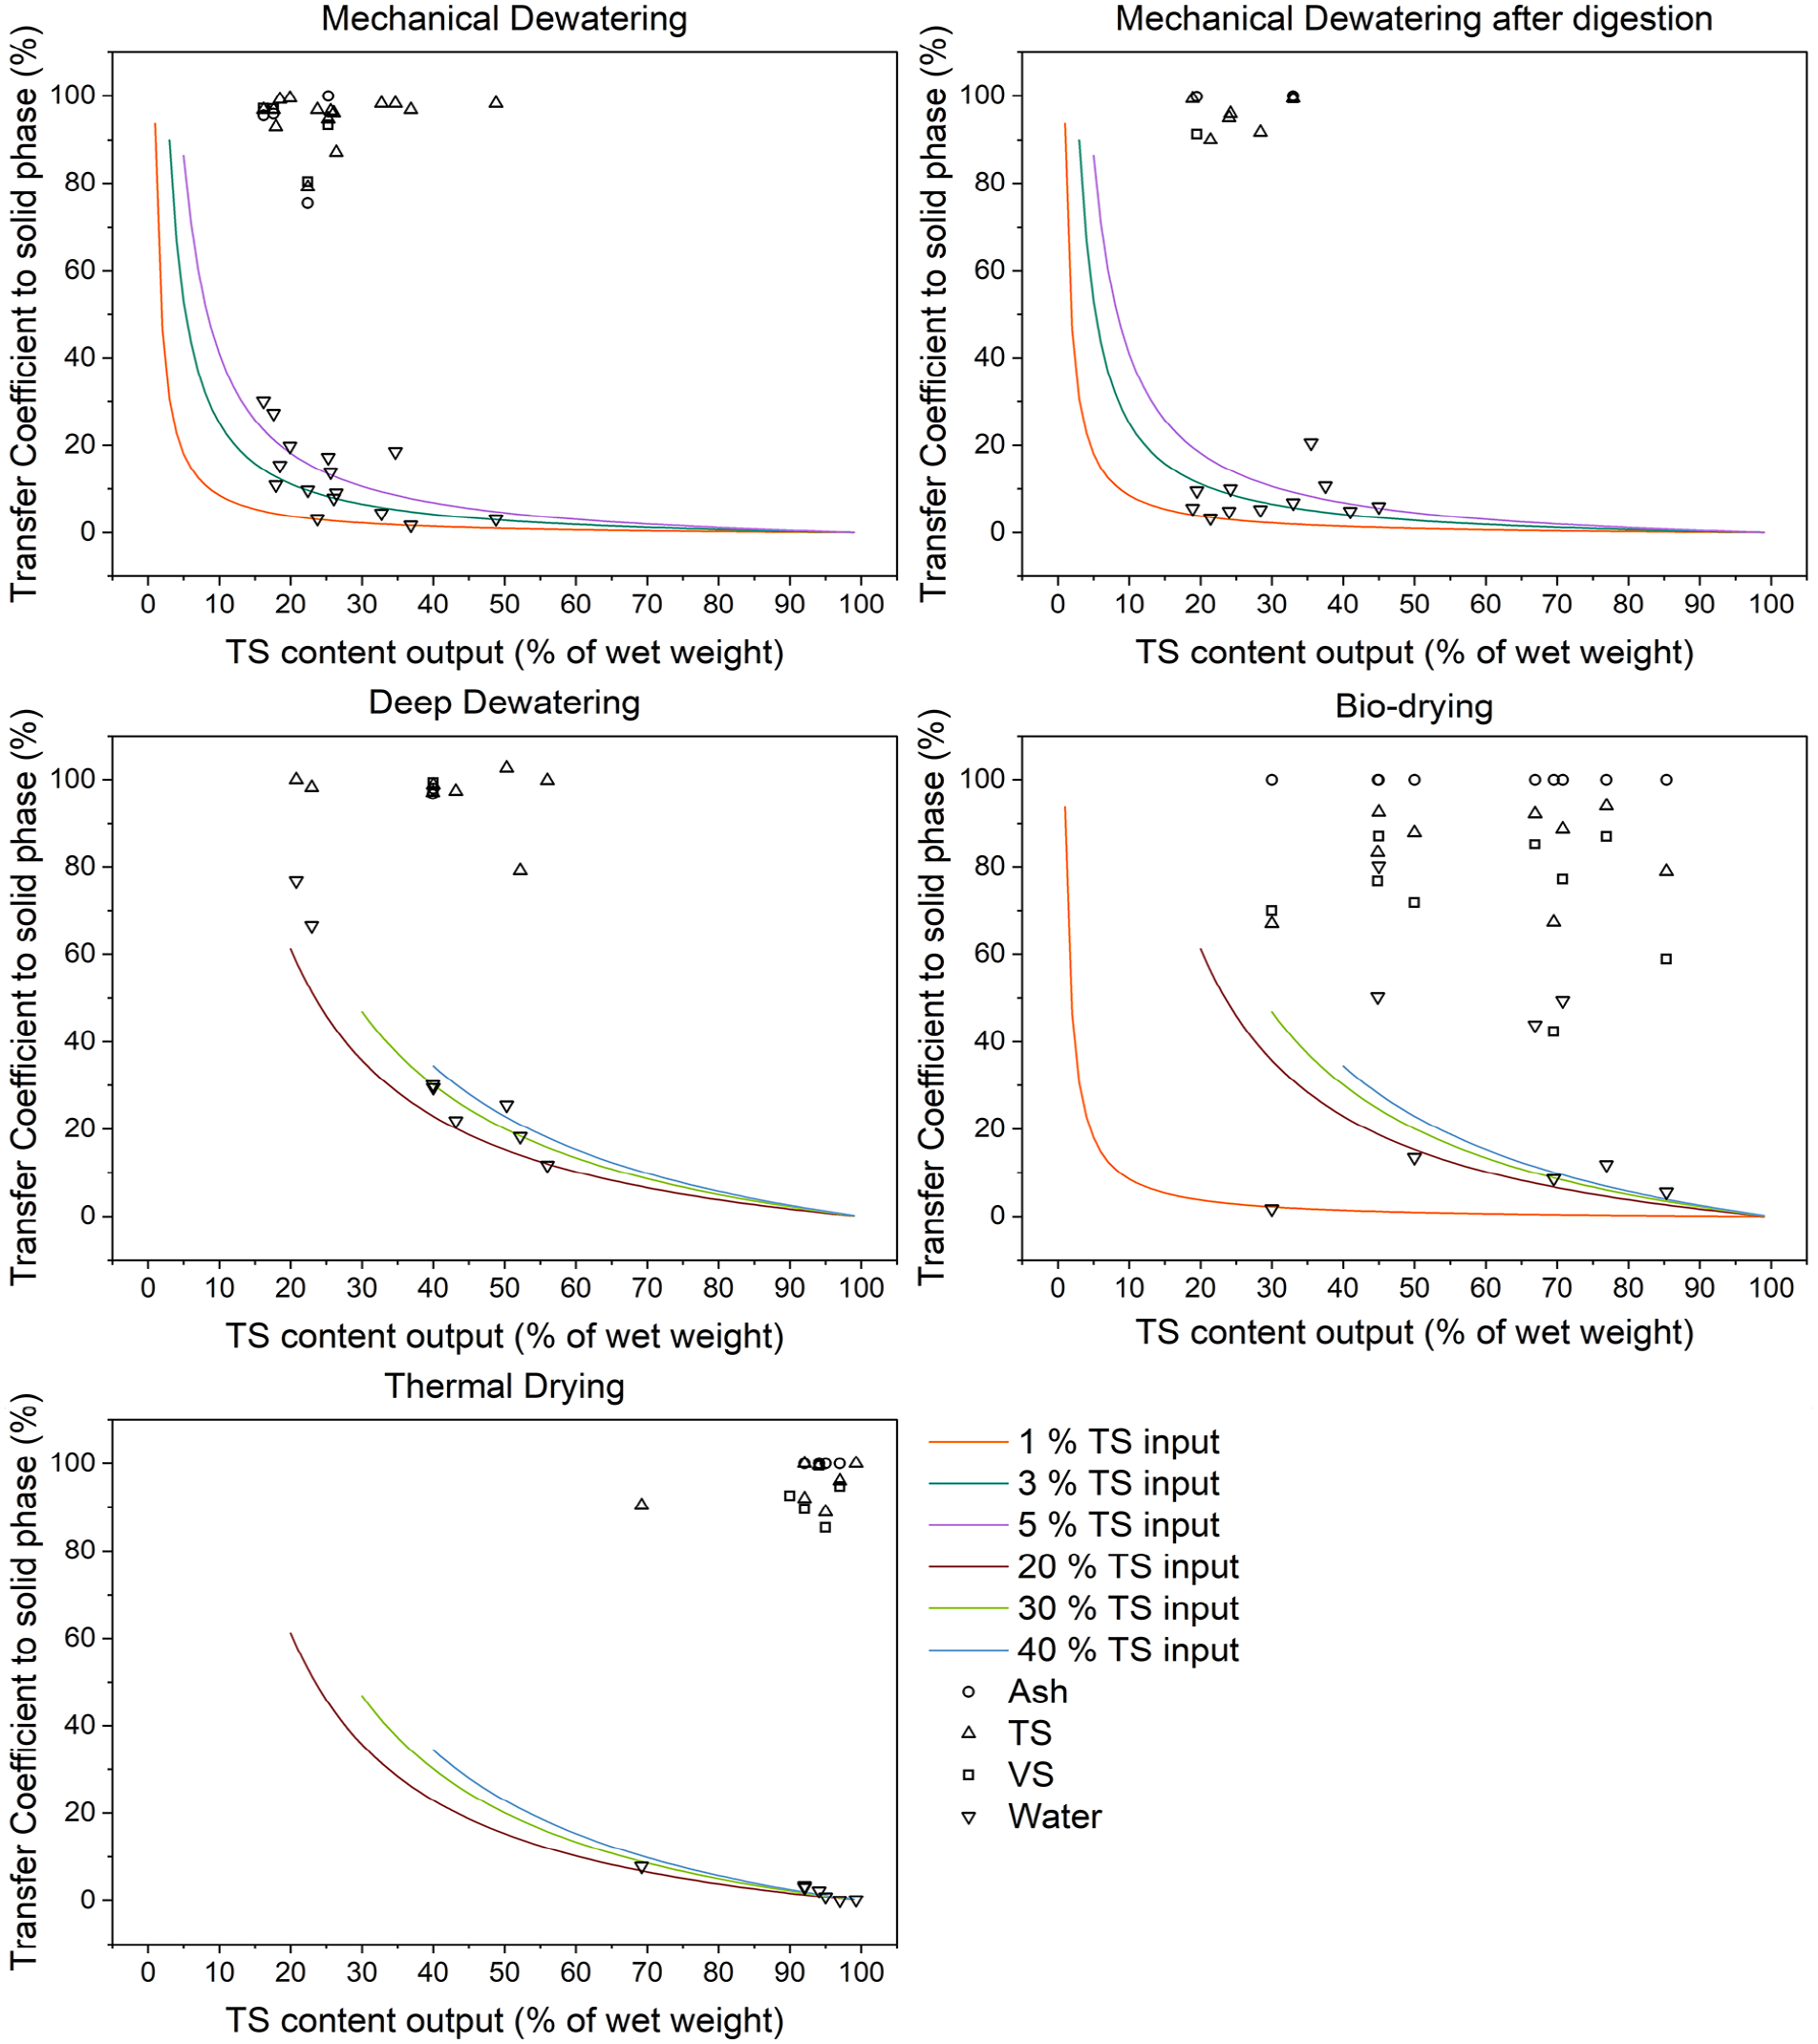
Sewage sludge dewatering and drying: transfer coefficients of Ash, TS, VS and water. Solid lines are theoretical transfer coefficients of water to TS obtained with different starting contents of TS (1–40% TS input).
Sewage sludge dewatering and drying: transfer coefficients to solid phase for TS, VS and Ash.
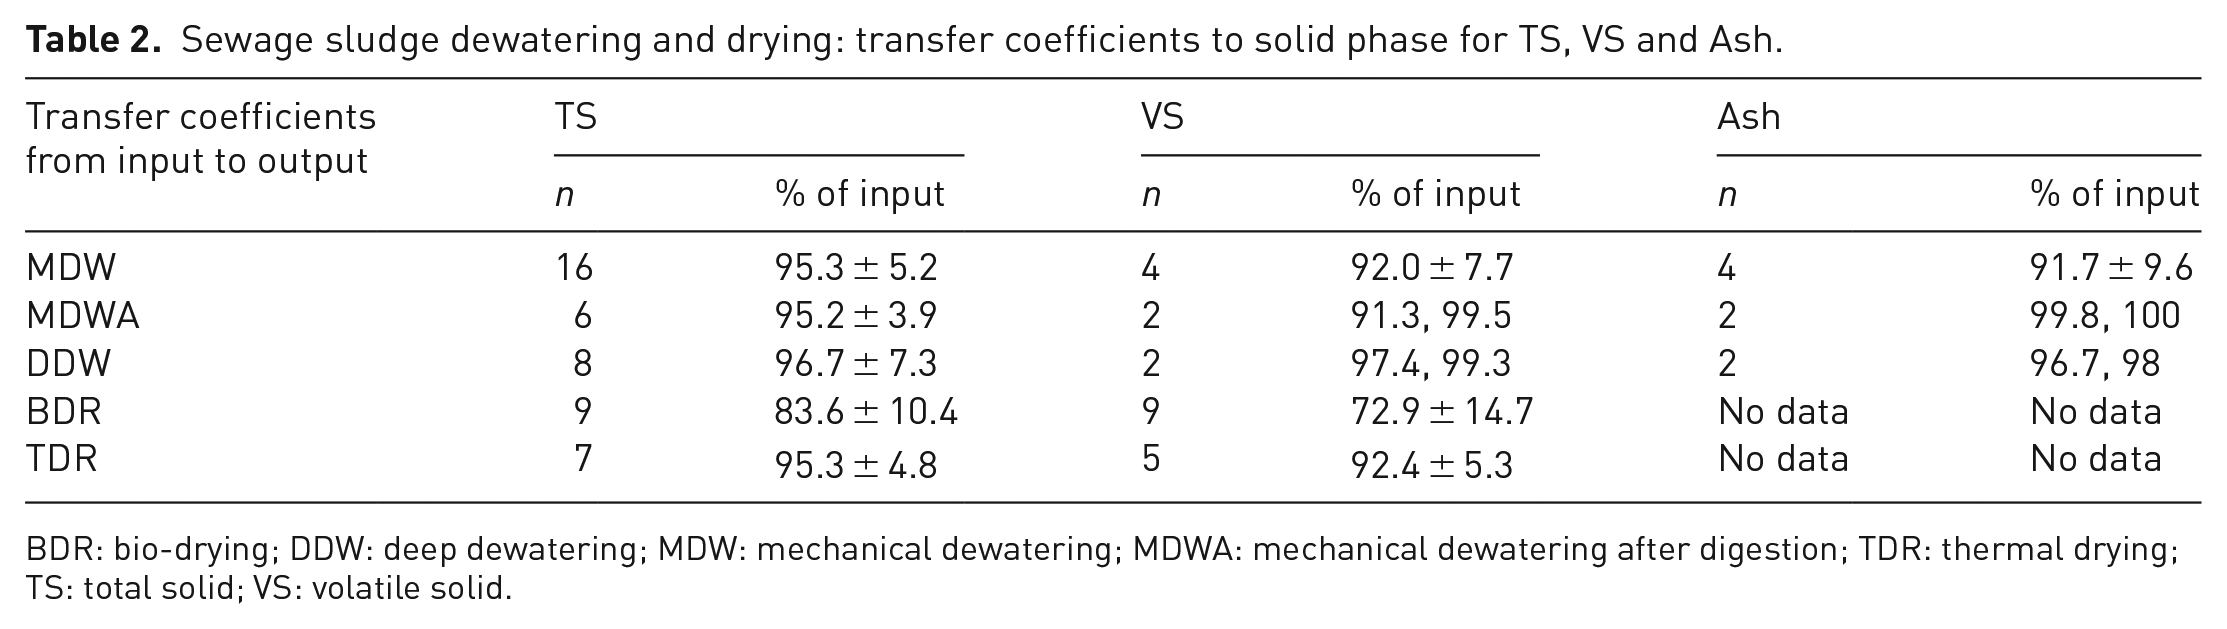
BDR: bio-drying; DDW: deep dewatering; MDW: mechanical dewatering; MDWA: mechanical dewatering after digestion; TDR: thermal drying; TS: total solid; VS: volatile solid.
The reviewed transfer coefficients are few in number but nevertheless suggest that some of the organic fraction of the sludge represented by VS content is lost during dewatering and drying. During dewatering, some of the soluble compounds and fine particulate matter will leave along with the water being removed. This is supported by data reported on the liquid fraction of digestate, revealing ranges of 240–5630 mg solids L−1 (Mailler et al., 2021; Mentzer et al., 2021; Sun et al., 2021). Mailler et al. (2021) reported high phosphorus (P: 71 mg L−1) and ammonium concentrations (NH4+: 389 mg L−1) in the liquid fraction.
TS loss: Figure 2 shows that in general more than 90% of TS is found in dewatered solids, but some escapes with the removed water or is lost during drying. TS equates to the sum of VS and Ash, and most papers address the latter two parameters because they behave differently.
VS loss: VS losses are significant in terms of the drying process, in that TDR loses about 8% and BDR 27% of VS content. The TDR may operate at high temperatures (up to 300°C) and thus cause loss of highly volatile organics in the sludge. The data for BDR showed many variations, suggesting that in some cases, significant composting was taking place and degrading a substantial part of the VS in the sludge.
Ash loss: For MDW (no digestion), two papers (Ruiz-Hernando et al., 2013; Yoshida et al., 2018) found Ash loss of 0–4% in laboratory-scale experiments and 24.6% in full-scale cases, while corresponding VS losses were 3–7% and 19.6%, respectively, which suggests a huge difference between laboratory- and full-scale data. No explanation was found in this regard; however, MDWA showed smaller losses of Ash (0.2 and 0%) but higher losses of VS (9 and 0.5%) (Houdkova et al., 2008; Turek et al., 2018), which is in accordance with the effect of anaerobic digestion – as also discussed earlier.
Energy and chemical consumption
Dewatering and drying technologies use chemical agents (coagulants, flocculants) to improve the agglomeration of solids, as well as energy to operate. Figure 3 shows energy consumption and chemical agent consumption for the five technologies related to changes in the TS content of sewage sludge.
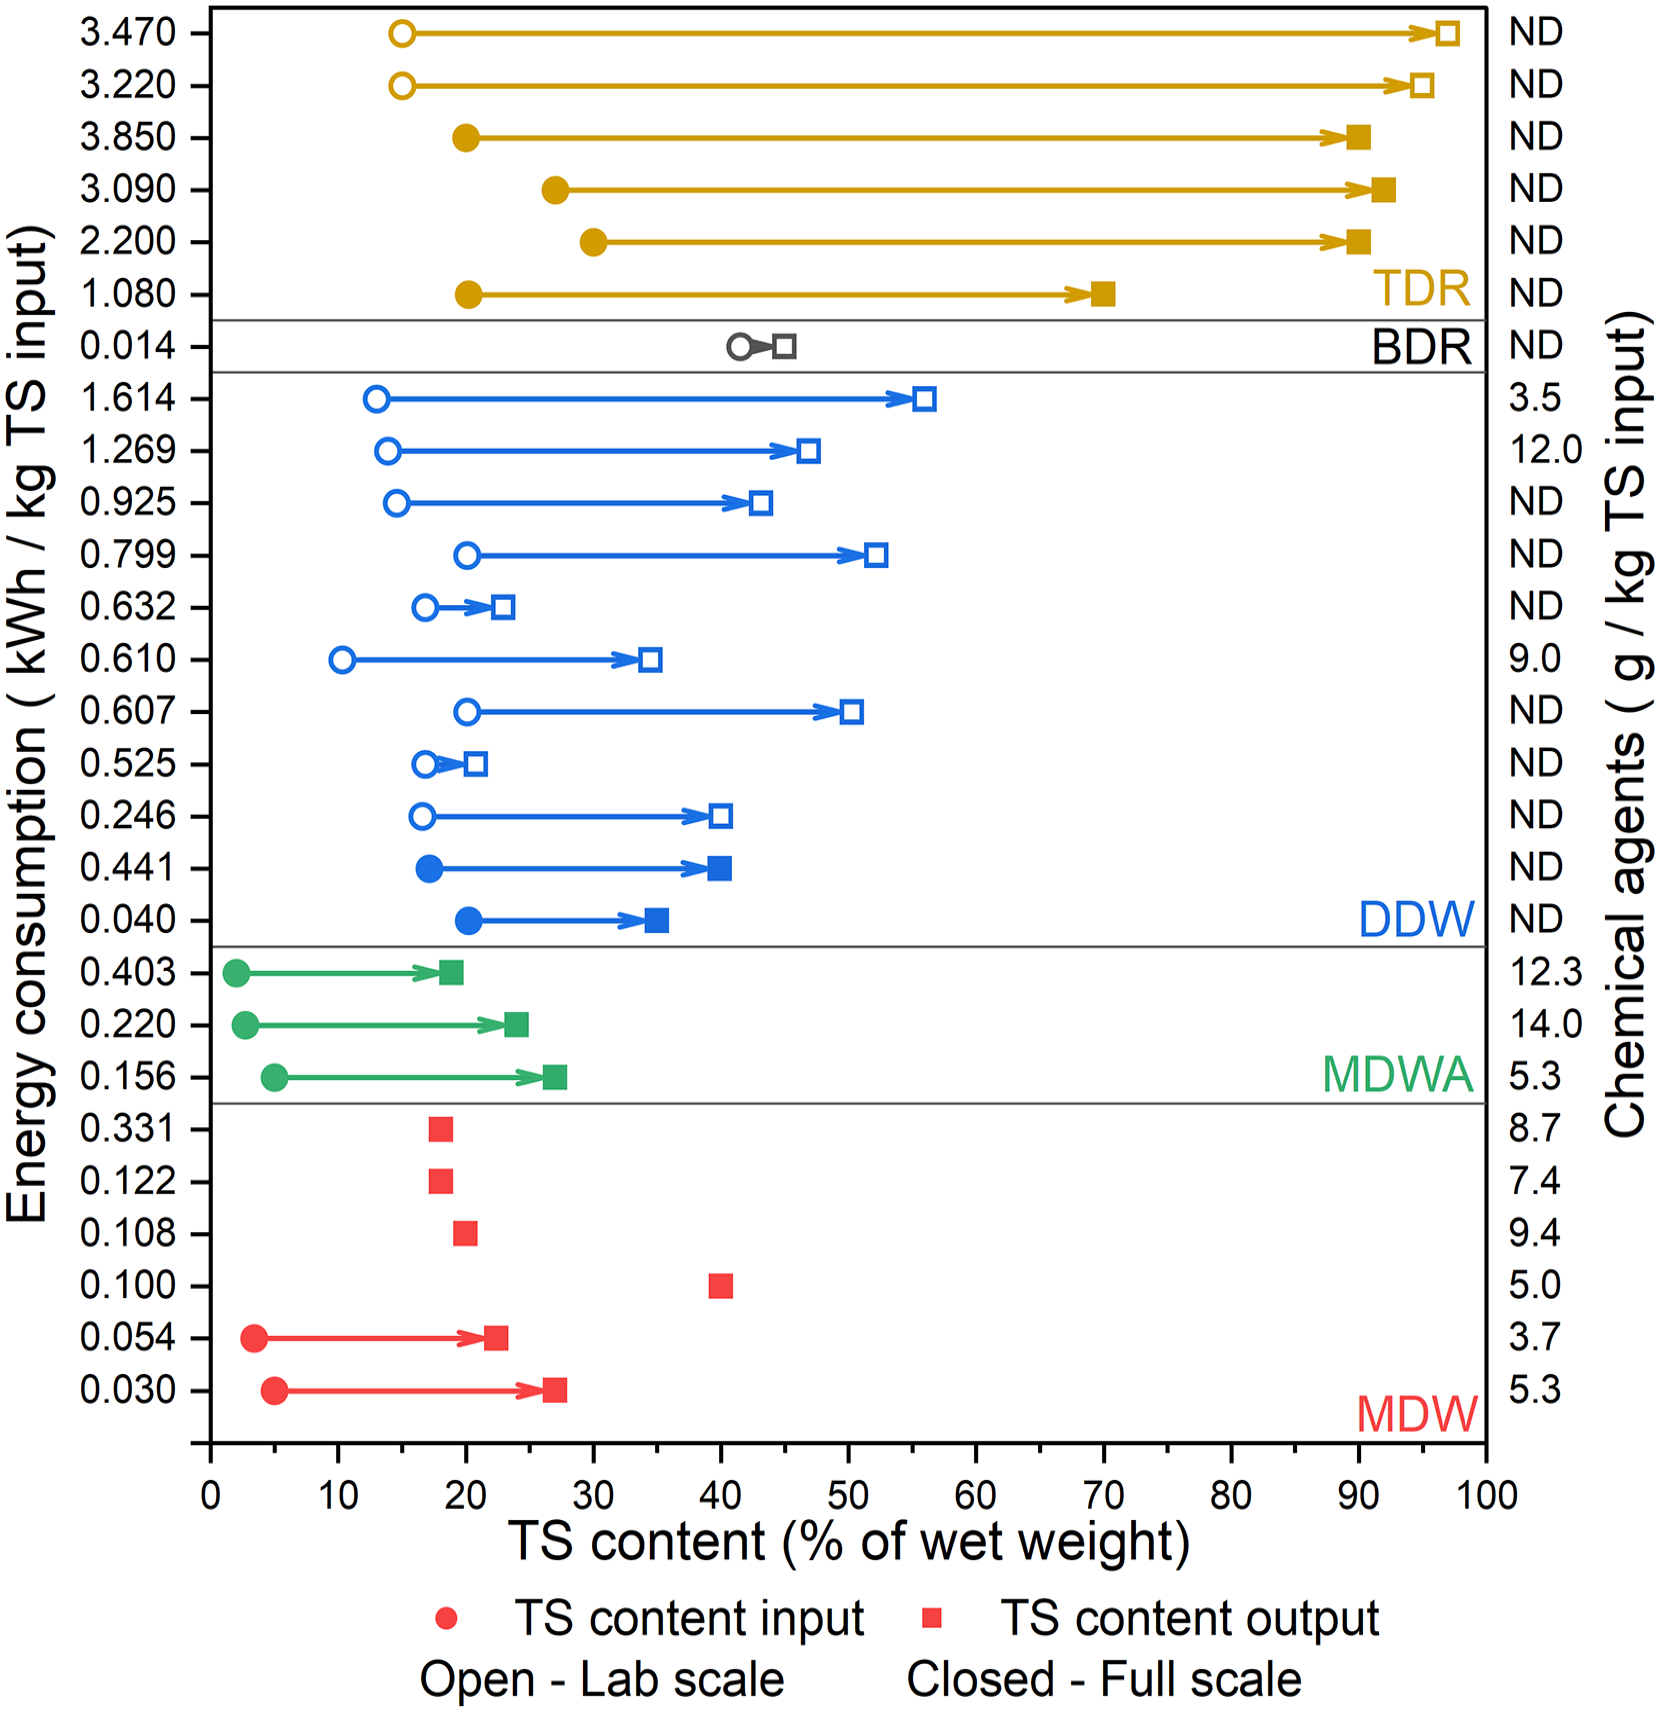
Sewage sludge dewatering and drying: consumables of different technologies related to changes in TS content.
Published data on the amounts of chemical agents used in sludge dewatering are scarce (see Figure 3 and Table 3), but a rough estimate in this regard is 5–15 g of chemical agent per kg TS input, or 0.05–1.7 g kg−1 wet weight input. The amounts of chemical agents (flocculants, coagulants; see Wei et al. 2018 for details) used for dewatering seem higher after anaerobic digestion, which is in accordance with the extensive hydrolysis and fermentation taking place during digestion leading to smaller organic particles and more suspended fine particles. This has also been observed by Christensen et al. (2015). Based on wet weight, DDW uses more chemical agents than the other technologies.
Sewage sludge dewatering: amounts of chemical agents used (mean ± SD).
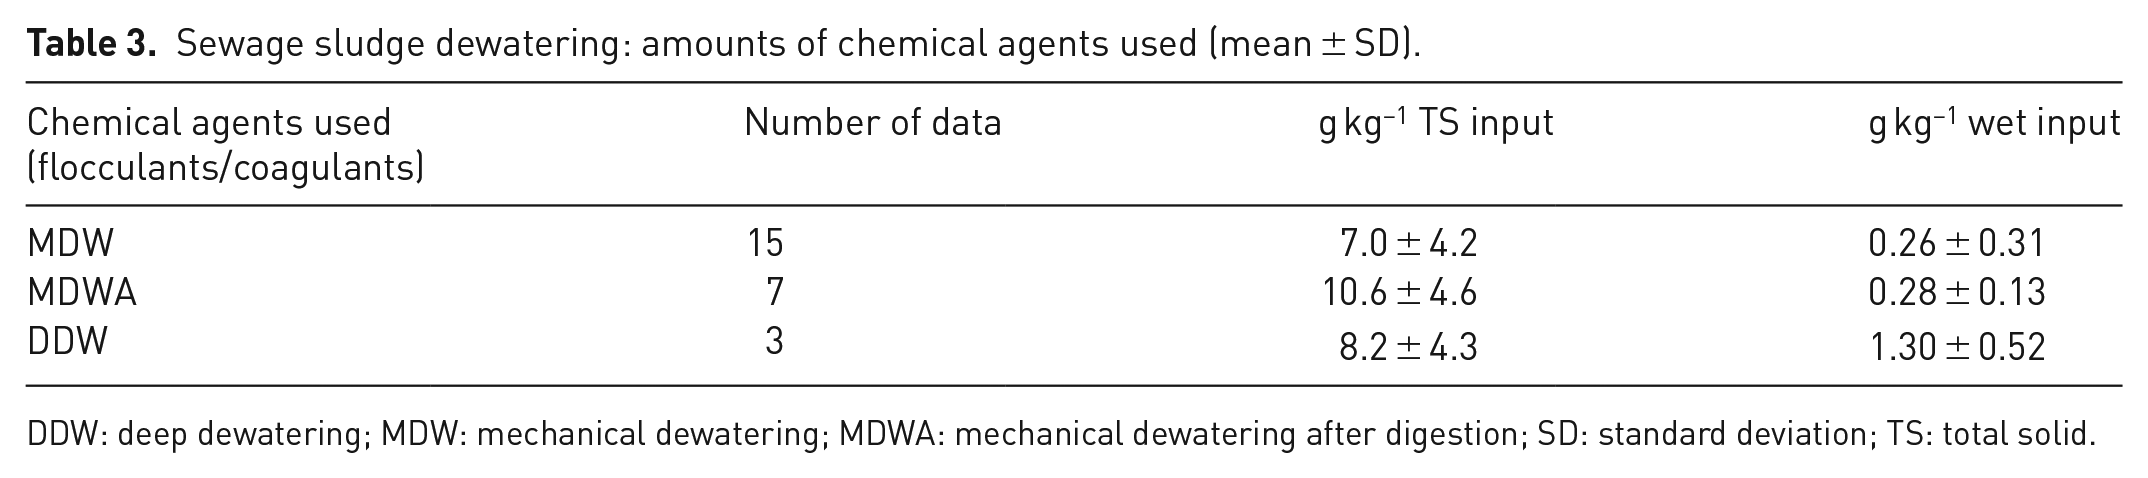
DDW: deep dewatering; MDW: mechanical dewatering; MDWA: mechanical dewatering after digestion; SD: standard deviation; TS: total solid.
The published data on energy used in sludge dewatering and drying are somewhat scant, as demonstrated by Table 4. In experimental work, often on a reduced scale, technologies are not necessarily optimized with respect to energy consumption and conservation, which may be the case for some of the reported data.
Sewage sludge dewatering and drying: amount of energy used (mean ± SD).
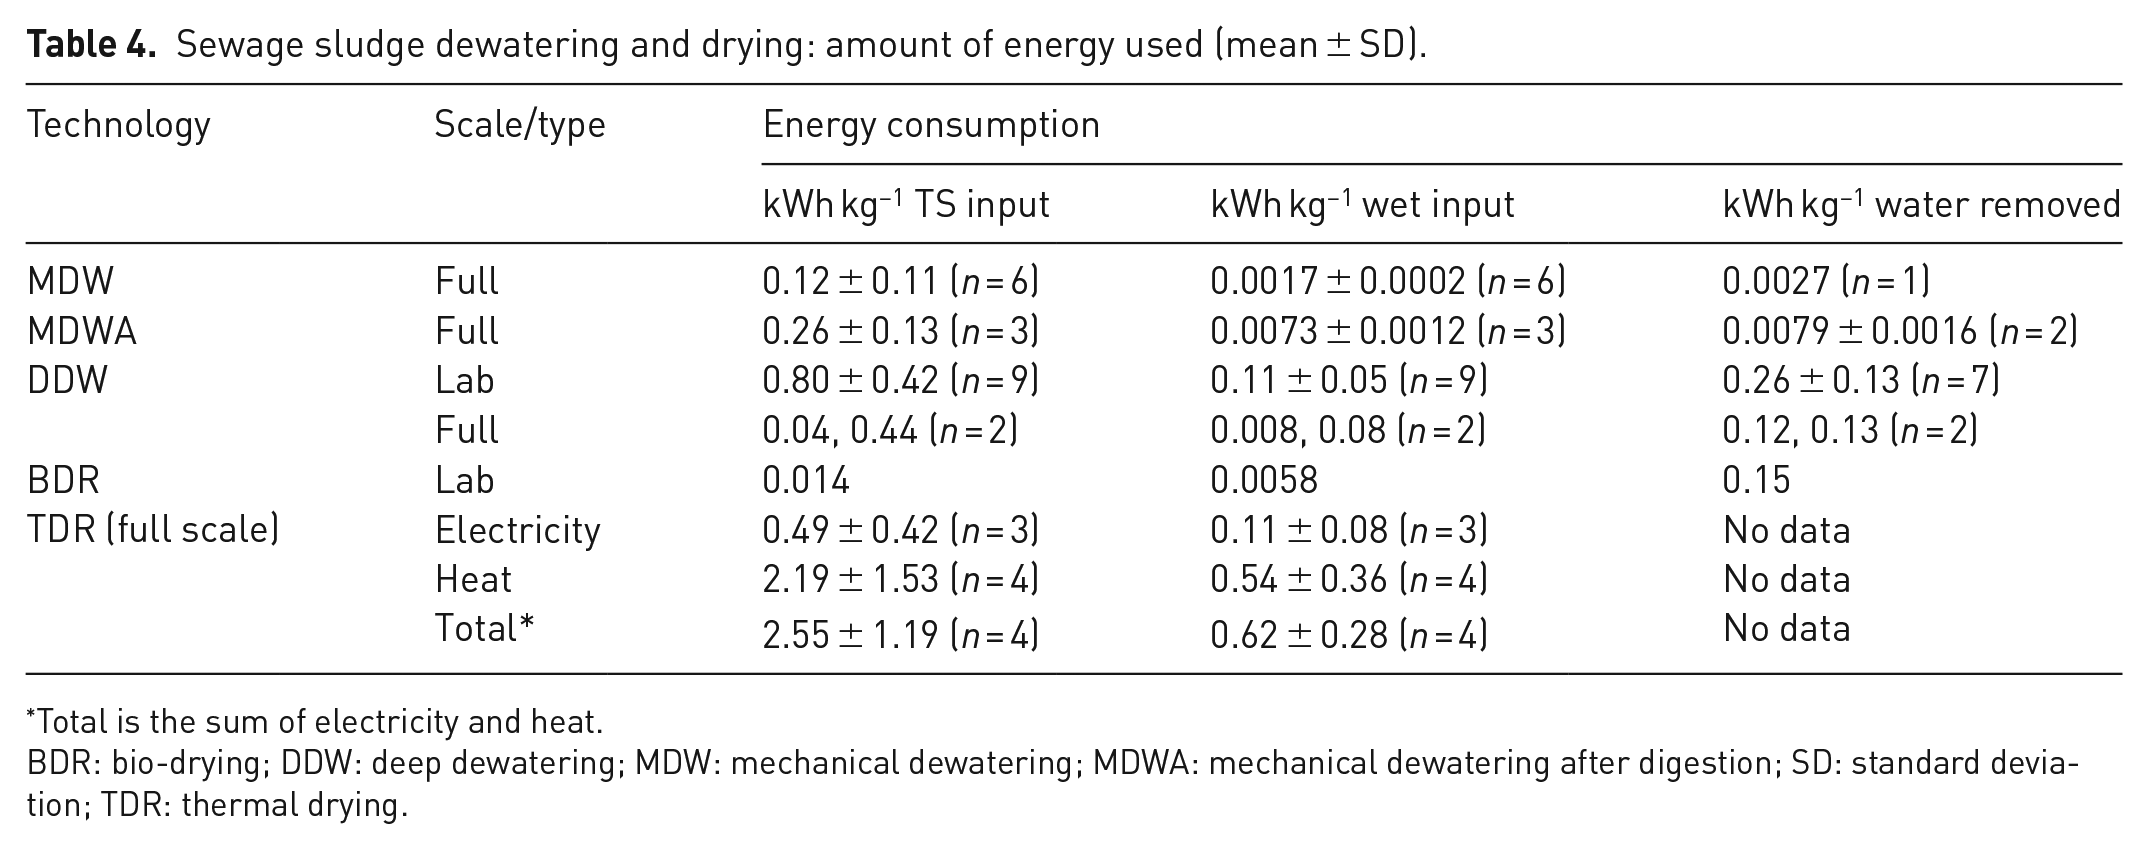
Total is the sum of electricity and heat.
BDR: bio-drying; DDW: deep dewatering; MDW: mechanical dewatering; MDWA: mechanical dewatering after digestion; SD: standard deviation; TDR: thermal drying.
MDW of raw sludge, when only considering data specifically representing full-scale technologies, shows low but highly variable electricity consumption, ranging from 0.03 to 0.33 kWh kg−1 TS input, with an average of 0.12 ± 0.11 kWh kg−1 TS input. Despite the few data available, electricity consumption for dewatering after digestion seems about twice as high as dewatering without digestion. Increased use of electricity for dewatering after digestion has previously been observed by Christensen et al. (2015).
DDW was used by two full-scale plants reporting electricity consumption levels of 0.04 and 0.44 kWh kg−1 TS input (Sha et al., 2019; Zhang et al., 2017). However, when normalized to the amount of water removed, the data were similar (0.12 and 0.13 kWh kg−1 water removed). Nine datasets from laboratory-scale experiments showed average electricity consumption of 0.80 ± 0.42 kWh kg−1 TS input and 0.26 ± 0.13 kWh kg−1 water removed, which is almost twice as much as observed in full-scale cases.
Biological drying has only one value for energy consumption, namely BDR with air injection, which used 0.014 kWh kg−1 TS input (equal to 0.15 kWh kg−1 water removed) (Sha et al., 2019).
TDR has data from four full-scale plants using hot steam (3.5 and 3.1 kWh kg−1 TS input), heat from natural gas combustion (2.0 kWh kg−1 TS input) and hot flue gas (0.1 kWh kg−1 TS input) to dry sewage sludge (Cao and Pawlowski, 2013; Đurđević et al., 2019; Sha et al., 2019; Tańczuk et al., 2016). Electricity consumption was reported for three of the plants (Đurđević et al., 2019; Sha et al., 2019; Tańczuk et al., 2016) at 0.3, 0.2 and 1.0 kWh kg−1 TS. Total energy consumption for TDR is of the order of 3.5 ± 0.5 kWh kg−1 TS input.
The energy consumption of dewatering and drying is likely to be related to the amount of water that is removed from the solids. Figure 4 shows, across the technologies available, a plot of the amount of energy used per tonne of wet sludge as a function of the amount of water removed. A theoretical line calculated as the energy needed to evaporate the water removed is shown as well. At low amounts of water removed, the energy use for MDW is modest and increases only slowly with the amount of water removed. Removing high amounts of water, as with thermal technologies, requires high amounts of energy, actually slightly more than what evaporation from a free water surface requires. In practice, TDR will be used only after MDW so the energy consumption is minimized.
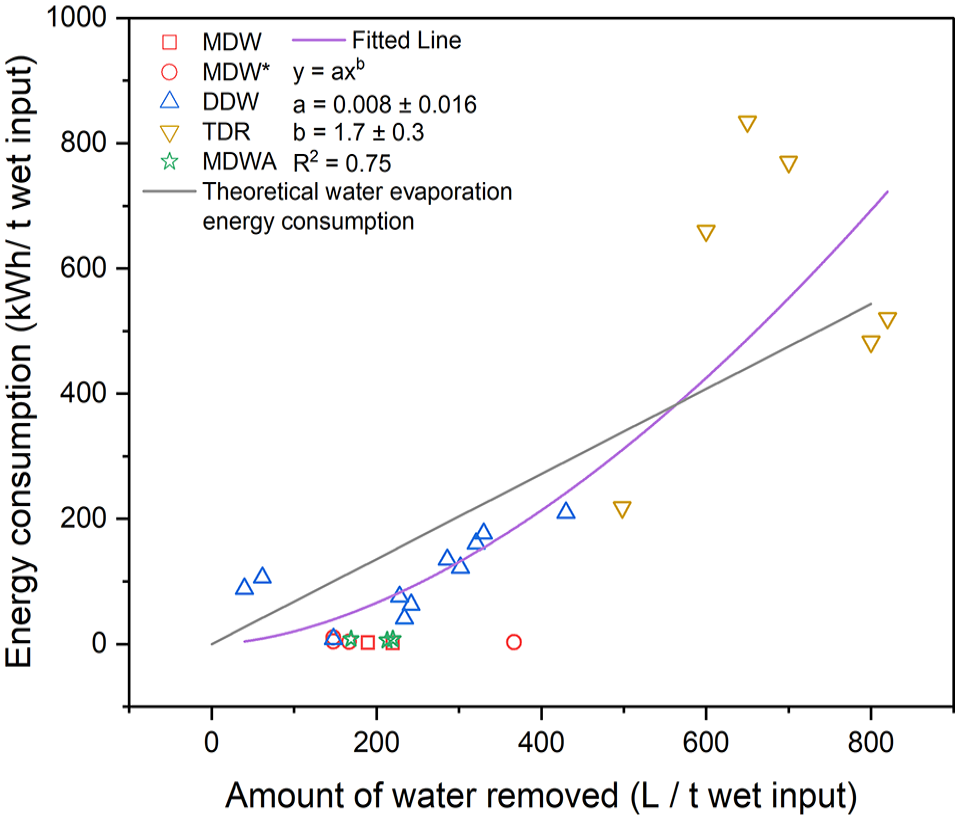
Sewage sludge dewatering and drying: energy consumption as a function of amount of water removed. Three data points marked with * were calculated assuming an initial water content of 96.7%, which is the average water content observed for thickened sludge.
Conclusion
Reviewing the literature revealed 55 datasets on sewage sludge dewatering and 21 datasets on drying. The scarcity of data did not allow for identifying detailed relationships between inputs and outputs for the many technologies available, but fair estimates were obtained for the solid content (%TS) that can be obtained by the main dewatering and drying methods, namely 25–30% TS for MDW, 35–40% TS for DDW, 60% TS for BDR and 90% TS for TDR. The few data available regarding the use of chemical agents (flocculants, coagulants) in MDW showed typical average values in the range 5–15 g kg−1 TS: if sludge is digested prior to dewatering, the use of chemical agents tends to increase. The use of energy is low for MDW (average of 0.12 kWh kg−1 TS for raw sludge and 0.26 kWh kg−1 TS for digested sludge) but substantially higher for TDR (average of 3.8 kWh kg−1 TS). Transfer coefficients identified for TS, VS and Ash showed that more than 90% was in mechanically dewatered sludge, while a substantial loss of VS was observed for TDR (8%) and BDR (27%).
We believe that the reviewed data on sewage sludge dewatering and drying can provide a comprehensive basis of dewatering and drying parameters for technological comparison and system modelling of sewage sludge management, by applying data of generality with statistical significance. However, the relatively few datasets found, as well as the large variations in the reviewed inventory data, also reveal the need for more and better data on sewage sludge dewatering and drying. In particular, data from full-scale plants on energy consumption and the composition of removed water are requested to complete the inventory for sludge dewatering and drying. By providing this review, we hope to inspire modellers and practitioners to take notice of the data variation and limited generalizability in dewatering and drying processes, and in future research note the lacking data which are crucial for technological comparison and system modelling.
Supplemental Material
sj-docx-1-wmr-10.1177_0734242X221139170 – Supplemental material for Mini-review of inventory data for the dewatering and drying of sewage sludge
Supplemental material, sj-docx-1-wmr-10.1177_0734242X221139170 for Mini-review of inventory data for the dewatering and drying of sewage sludge by Huimin Chang, Yan Zhao, Ankun Xu, Anders Damgaard and Thomas H Christensen in Waste Management & Research
Footnotes
Declaration of conflicting interests
The authors declared no potential conflicts of interest with respect to the research, authorship and/or publication of this article.
Funding
The authors disclosed receipt of the following financial support for the research, authorship and/or publication of this article: This work was supported by the Major Science and Technology Program for Water Pollution Control and Treatment, China (2017ZX07205001) and the China Scholar Council (202006040155).
Supplemental material
Supplemental material for this article is available online.
References
Supplementary Material
Please find the following supplemental material available below.
For Open Access articles published under a Creative Commons License, all supplemental material carries the same license as the article it is associated with.
For non-Open Access articles published, all supplemental material carries a non-exclusive license, and permission requests for re-use of supplemental material or any part of supplemental material shall be sent directly to the copyright owner as specified in the copyright notice associated with the article.