
Abstract
The numerous resources are consumed and a large number of multiple-source organic solid wastes are discharged during urban metabolic, which put pressures to environment. This study combined material flow analysis and ecological network analysis to comprehensively analyse the metabolism of multiple-source organic solid waste in Hefei. Analysing current metabolic characteristics of urban multiple-source organic solid waste and relationships between the components of metabolic system can help urban environmental management. The internal material flows of the system were analysed by a metabolic network containing 5 nodes and 18 pathways, which revealed metabolic characteristics of multiple-source organic solid waste in Hefei. The study showed that the metabolic system of multiple-source organic solid waste was relatively stable though distribution of internal flows changed in 8 years. The metabolic environment and agricultural sector covered a relatively large weight in this model. The control and exploitation relationships dominated the metabolic system. The urban metabolic mechanism reflected in this research can improve efficiency of urban metabolic resource, optimize waste management and provide data support for sustainable urban development. This study provided scientific guidance for metabolic research in Hefei and similar cities in China’s rapid economic development.
Keywords
Introduction
The cities are a complicated and changeable system which accommodates social productive activities and people’s daily life (Wang et al., 2019b). The sustainability of resources metabolism is at the core of urban economic system (Voukkali and Zorpas, 2022). Sustainable human economic and social development depends on environmental sustainability, and environmental sustainability depends on the balance between material and energy flows (Huang et al., 2012). Sustainable development is a priority in urban management to maintain the stability of urban metabolism (UM) (Zorpas et al., 2021). The urbanization rate of China has increased to 64.72% and an estimated 82.3% of Hefei’s population lives in urban area of the city in 2020 (HBS, 2020). Economic growth impetus contained in the process of urbanization will be released more and people’s demand for resources increases rapidly with the development of social economy. Ecological environment provides human with necessary resources to maintain survival and deal with waste and pollutant generated by human activities, which supports the normal operation of the urban system (Kissinger and Stossel, 2019). Bad effects caused by rapidly developing urban system and increasing resources consumption were concerned, such as increasing amounts of organic solid waste (Maranghi et al., 2020; Voukkali et al., 2021). The natural resource used in China increased dramatically from 11.7 billion tonnes in 1995 to 35.4 billion tonnes in 2015 (Wang et al., 2019a), and municipal solid waste collected in China reached 235.117 million tonnes in 2020. Material flow analysis (MFA) can help determine the material flow path of UM and figure out relationships between resource extraction, the production, consumption, circulation of materials and waste discharge in the urban economic system which provides data and theoretical support for government to manage cities (Bahers and Giacchè, 2019). This study was conducted to analyse urban material metabolism associated with multiple-resources organic solid waste in Hefei.
The concept of UM was proposed by Wolman Abel in 1975 to analyse America’s metabolism, and she considered it as the process of material metabolism between cities and environment (Wolman, 1965). The UM concept was defined by Christopher Kennedy as ‘the totality of technological and social activities that occur in cities and result in growth, energy generation, and waste reduction’ (Kennedy et al., 2007). The city is compared to a huge organism and flows of material, energy or elements of economic activities are regarded as metabolic activities of organism. UM provides a research perspective to explore the metabolic processes and quantify material and energy flows (Liu et al., 2021). Then a substantial and growing body of research on UM has been investigated over 60 cities (Beloin-Saint-Pierre et al., 2017), such as America (Chini and Stillwell, 2019), Philippines (Martinico-Perez et al., 2017), Beijing (Li et al., 2019), Macao (Lei et al., 2018) and so on. These studies have been conducted at national or city level to analyse resource inputs, material production, consumption and waste management in a specific region. Different perspectives on UM have been studied to analyse the metabolic situation under specific conditions (Zhang, 2013), such as urban carbon metabolism (Li et al., 2021) and urban water–energy relationship with UM (Fan et al., 2019). The research of UM was initially a black box model, so scholars tried to develop models to reveal specific material flow pathways within cities, such as ecological network models and input-output model (Zhang, 2013). In the development research of UM, some scholars focused on metabolic processes, while others focused on metabolic effects and relationships involved in metabolism (Zhang et al., 2015).
MFA is widely used to account flows and stocks of environmental contaminants in UM (Makarichi et al., 2018). MFA takes into account mass conservation equation and evaluates inputs, migration, transformation and outputs of the system quantitatively (Song et al., 2016). MFA can play an important role in addressing how material flows and analysing cities’ metabolism (Arto, 2009; Huang et al., 2012). Eurostat established material flow accounts, data and frameworks for economic system, which enabled EU member states to use a common framework for data collection and material flow calculations (Eurostat, 2001). There are mainly two targets towards the description of MFA, the certain elements (Sinha et al., 2022) or the certain materials, such as Fe and plastic. Meanwhile, material flows were investigated at national level and district level (Noll et al., 2021). MFA requires a large amount of data to reflect the intensity of UM, but metabolic analysis cannot be carried out in a unified framework due to inconsistent data lists across countries in the practical application. MFA focuses more on the material exchange between environment and economic system, ignoring the metabolic relationships among sectors within the economic system. The ecological network model can achieve this goal perfectly (Zhang et al., 2014). Matrix operations were used in ecological network analysis (ENA) to transform ecosystems into nodes, paths and flows in a network, and analyse the flows of materials and energy within the system (Gao et al., 2021; Xu et al., 2021). Applying ENA to urban ecosystems, the interrelationship of nodes within the system can be analysed to facilitate the regulation and management of urban systems (Schandl et al., 2020; Zhai et al., 2019). ENA was widely used in urban, industrial, energy and water resources systems to identify and quantify direct and indirect impacts in that system (Fath and Patten, 1999; Zhai et al., 2019).
Hefei, the provincial capital city of Anhui, is located in Eastern China and surrounded by Chaohu Lake. As the sub-centre of the Yangtze River Delta Urban Agglomerations, Hefei covers a total area of 11.445 billion square metres and has a population of nearly 9.36 million persons by the end of 2020. With the rapid development of urban modernization, domestic waste production in Hefei has risen to 2.7 × 10⁶ Mt in 2020 and conflicts between highly increasing wastes production and inadequate handing capacity have gradually intensified.
The concept of UM was studied to effectively analyse the sources and production of multiple-sources organic solid waste in this research (Zorpas et al., 2018). MFA was applied to take into account all flows through the system and quantitatively describes the material flows between the environment and the economic system. ENA was applied to build a network containing metabolic nodes and metabolic pathways to make the material flow within the metabolic system visible. A study will be conducted to address the current situation of no relevant metabolic analysis in Hefei.
Methods
The material flows of urban multiple-sources organic solid waste in this research were analysed from two aspects: figure out UM between sectors and environment through MFA and build contacts between sectors through ENA. The structure and framework of model were clarified to measure material flows of inputs and outputs within the system and expound the metabolic characteristics by intensity indicators. The relationships between sectors in the system were precisely elucidated by ecological metabolic network.
System boundary and date acquisition
The natural environment and all economic sectors involved in the metabolism of multiple-source organic solid waste were included. The multiple-source organic solid wastes were mainly consisted of household waste, kitchen garbage, sludge, manure and livestock manure. Material accounting items include agriculture, industrial production, human living, sewage treatment and waste disposal. The administrative and temporal boundary was delineated for the metabolism of multiple-source organic solid waste to account for material flows in a certain area. The system boundary was defined as Hefei Administrative Region (includes four municipal districts, four counties and one county-level city). The temporal boundary was defined as the time period from 2013 to 2020 because administrative regions in Hefei has been adjusted in 2011. The time scope was chosen as many years as possible for metabolic studies while assuring the integrity of the original basic data.
The date lists were collected from Statistical Yearbooks such as China Statistical Yearbook, Anhui Statistical Yearbook, Anhui Survey Yearbook and Hefei Statistical Yearbook. Meanwhile, some data not contained in Statistical Yearbook were searched from government public data, on-site research interviews, literature and survey results. If there are any differences between Statistical Yearbooks in different years, the latest data shall prevail. Some data of multiple-source organic solid waste such as domestic waste and manure can be obtained directly through Statistical Yearbooks. Other production data not available can be estimated. Daily production of livestock manure and consumption of feed can be obtained from conducting field surveys in rural areas. The amount of livestock waste can be calculated from the number of livestock in the annual Statistical Yearbooks.
Material account for UM analysis
According to the established framework and metabolism model (Cui et al. 2019), material flows in Hefei based on MFA and urban metabolic framework were constructed to quantify results for material metabolism and evaluate metabolic characteristics. The material flow account was constructed to calculate inputs and outputs of urban metabolic material flows and present material flow changes.
Materials input, materials flowing and materials output (MO) through economic system were included in material account. Resources come from environment, circulate through economic system with the form of raw materials, products or semi-finished products, return to environment as waste after the process of manufacturing and producing. UM was accounted in the model with dividing urban metabolic system into environment and the other sectors including agriculture, manufacturing industry, household consumption and waste treatment. The material flows in waste treatment sector could be reflected in other sectors. Material flows of the three sectors are mainly described in the following description.
In the agricultural sector, it was necessary to determine the output of agricultural products and consumption of materials during agricultural production, such as agricultural film, fertilizer and so on. These data could be directly obtained through Statistical Yearbooks. In the industrial sector, the number of industrial products also can be obtained through Statistical Yearbooks. Then the products were exported to other sectors according to the demand and the remaining products were considered as exports (Exps). The product distribution will meet the household sector first, followed by the agricultural sector. Inputs of industrial sector were mainly raw materials required for industrial products. Since this data was difficult to obtain, it can be estimated through input-output tables. In the sector of living activities, input items mainly included agricultural products and industrial products needed by residents such as plastics and paper, while the output items were household garbage and kitchen waste and so on. The quality of food and other necessities that must be taken in life was determined by the per capita consumption in the survey yearbook of Anhui Province (Liu et al., 2020). The dissipated materials in all sectors were also calculated through parameters from the previous literature.
According to the Eurostat MFA and UM framework (Cui et al., 2019), five main categories of material flows were involved in the system, which were domestic extraction (DE), MO, import (Imp), Exp, local discharge (LD) and balance items (BI). DE meant materials obtained from natural environment through human labour and technological means, such as agricultural crops and aquatic products. The natural resources extracted into system contained two flow paths, one part flew into household consumptions and manufacturing sector, and the other parts were unused natural resources, such as straw and bycatch. MO meant the material produced by urban economic sector and then it was provided to other sectors for production or consumption, including agricultural and industrial products. Materials not available locally or not produced locally enough to cover demand was defined as Imp. Similarly, Exp was defined as the production of materials not needed or used up in sectors. LD meant waste and emission generated from production, usage and final disposal sessions, where materials originated from natural environment and Imps. The BI meant the exchange of water and air that affected mass balance of material flows, including input BI and output BI (Krausmann et al., 2015). The material flows involved in three sectors were calculated and analysed according to the above categories.
Referring to the EW-MFA handbook published by Eurostat in 2015, Economy-wide Material Flow Accounting Introduction and Guide, Version 1.0 (Krausmann et al., 2015), and other urban metabolic indicators mentioned in the literature, some indicators were calculated to build the urban metabolic characteristics evaluation system. Indicators include extensive indicators, intensive indicators, metabolic indicators and efficiency indicators, the specific meaning is shown in the following table S2 and these indicators was calculated as follows (Fragkou et al., 2010).


Material flow analysis
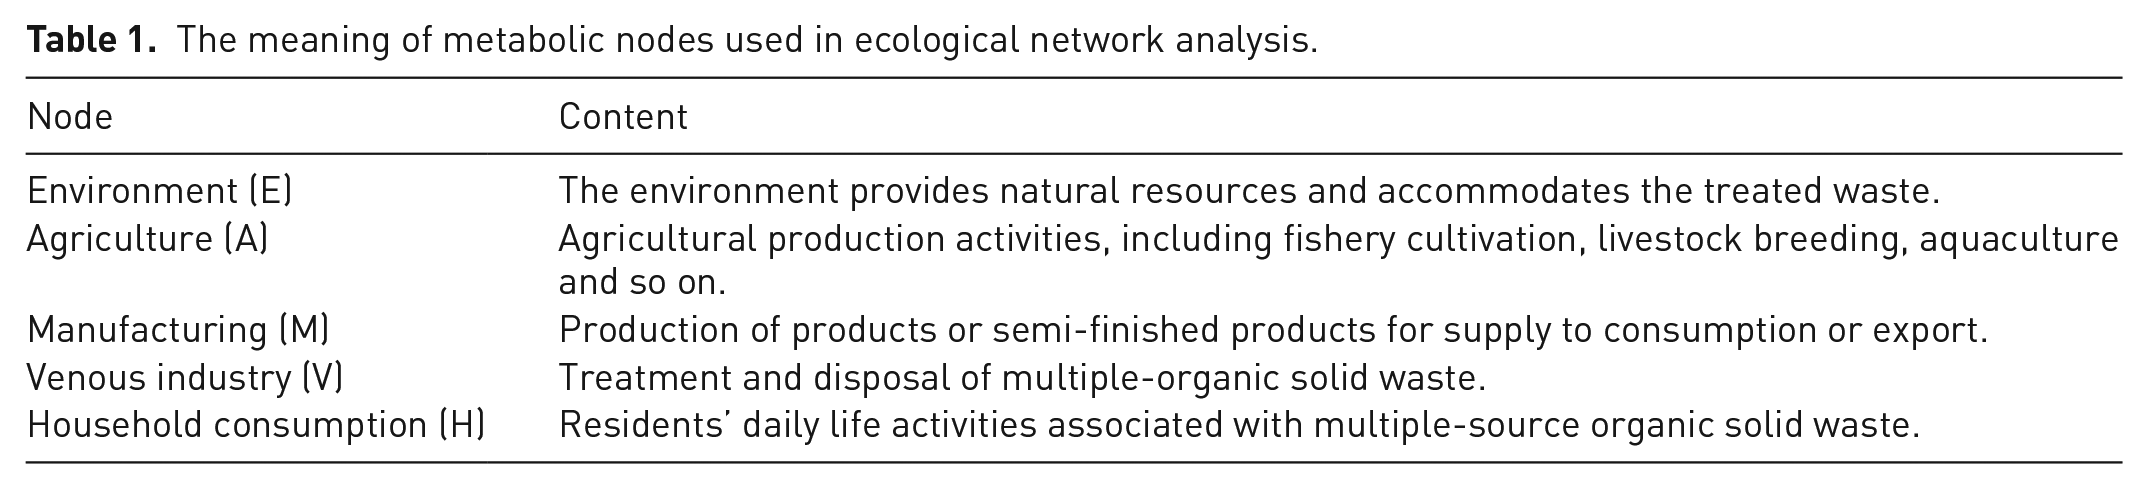
According to the method in research, an ecological network model containing 5 compartment and 18 paths were designed to analyse the metabolic process of multiple-source organic solid waste in Hefei. In the ecological network showed in Figure 1, the model consisted of five nodes that represented the socioeconomic sectors and environment associated with metabolism. The nodes represented agriculture (A), environment (E), household consumption (H), manufacturing (M) and venous industry (V) and their meanings were described in Table 1. The directed lines connecting two nodes represent the flow paths of material flows (Li et al., 2018). The arrow points in Figure 1 represent the direction of material flows. The metabolic relationships were figured out through integrated flow analysis and network utility analysis (Chen and Chen, 2012). In contrast to urban metabolic analysis, material flows contained in each sector was refined through ecological networks into intersectoral links.
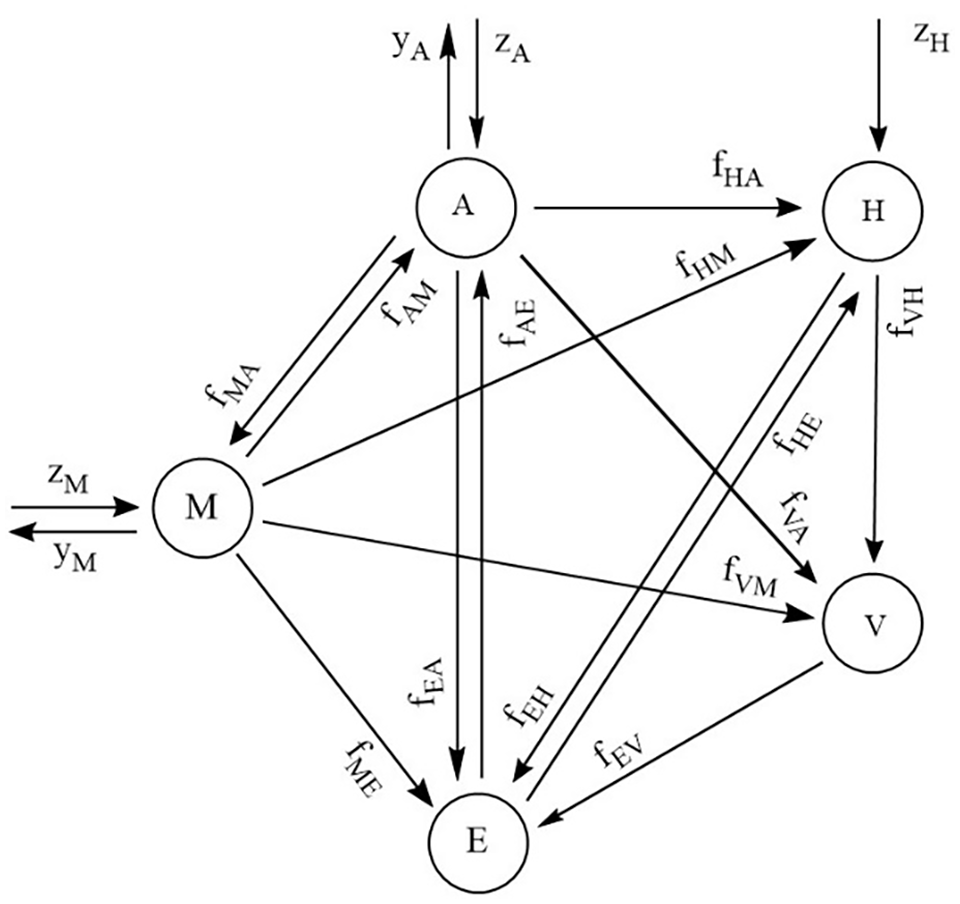
Metabolic network model of multiple-sources organic solid waste for sectors of the urban system in Hefei, China. Nodes: A, agricultural; H, household consumption; M, manufacturing; V, venous industry; E, environment.
The meaning of metabolic nodes used in ecological network analysis.
Integrated flow analysis
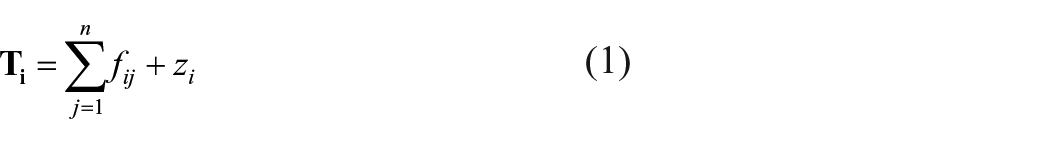
The data were firstly collected and calculated to acquire direct flow matrix
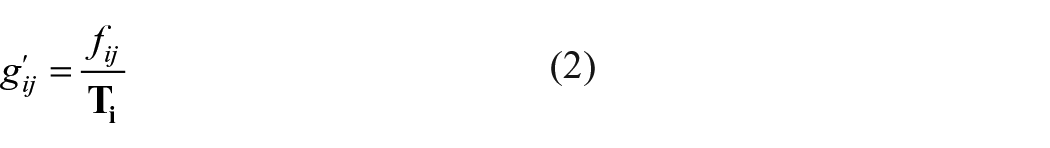
The dimensionless material flow intensity matrix
The dimensionless integrated flow intensity matrix
Multiply the dimensionless total flows matrix by the diagonal matrix of total flows to obtain the integrated flow matrix

The weights of each sector in equation (5) were calculated to analyse the key sectors in the ecological network (Li et al., 2019).
Ecological relationship analysis
The inter-relationship between each node could be obtained by utility analysis in ENA. Define the direct utility matrix in equation (6).
Based on the convergent power series of the direct utility matrix

Where uij was the element in matrix
The positive and negative sign relationships of the elements of the integrated utility matrix
Results and discussion
The amount and structure of the material inputs and outputs
The total urban material metabolism involving multiple-sources of organic solid wastes were analysed through data collection in Hefei in supplemental material. The total material input of Hefei was obtained by adding the material input of each sector in Figure 2. The total direct material input (Imp and DE in three sectors) in Hefei showed a trend of first increasing and then decreasing, reaching 1.456 × 10⁷ Mt in 2020 (note: 1 Mt = 103 kg, international system of units (SI), and the agricultural sector accounted for the largest amount of direct material input. The Imp in Hefei was similar to the results in other cities, where Hefei had a high dependence on imported materials (Wang et al., 2019b). The material flows of Imps firstly increased, then decreased within 8 years, and generally maintained a relative stability between 45 and 55%. The high proportion of biomass materials (resources acquired from agriculture activities) were not consistent with the results in other cities for which the metabolism of organic solid waste was mainly involved in this system. The imported materials were ranked in order of their proportion, with products, biomass and energy in that order. A large amount of biomass resources were provided by agricultural system in Hefei and then they were transported to other sectors. The Imp demand was mainly focused on the acquisition of products and related raw materials. The direct material output generally showed a decreasing trend and fell to 9.95 × 10⁶ Mt in 2020. The material Exps were dominated by agricultural materials, followed by industrial products, which accounted for 61.6 and 38.4% of total Exps in 2020. The generation of multiple-sources organic solid waste in Hefei fluctuated widely, reached 6.105 × 10⁷ Mt in 2020. The largest proportion of waste was farming waste, followed by domestic waste, and farming waste generation was on a downward trend while domestic waste generation was increasing year by year.
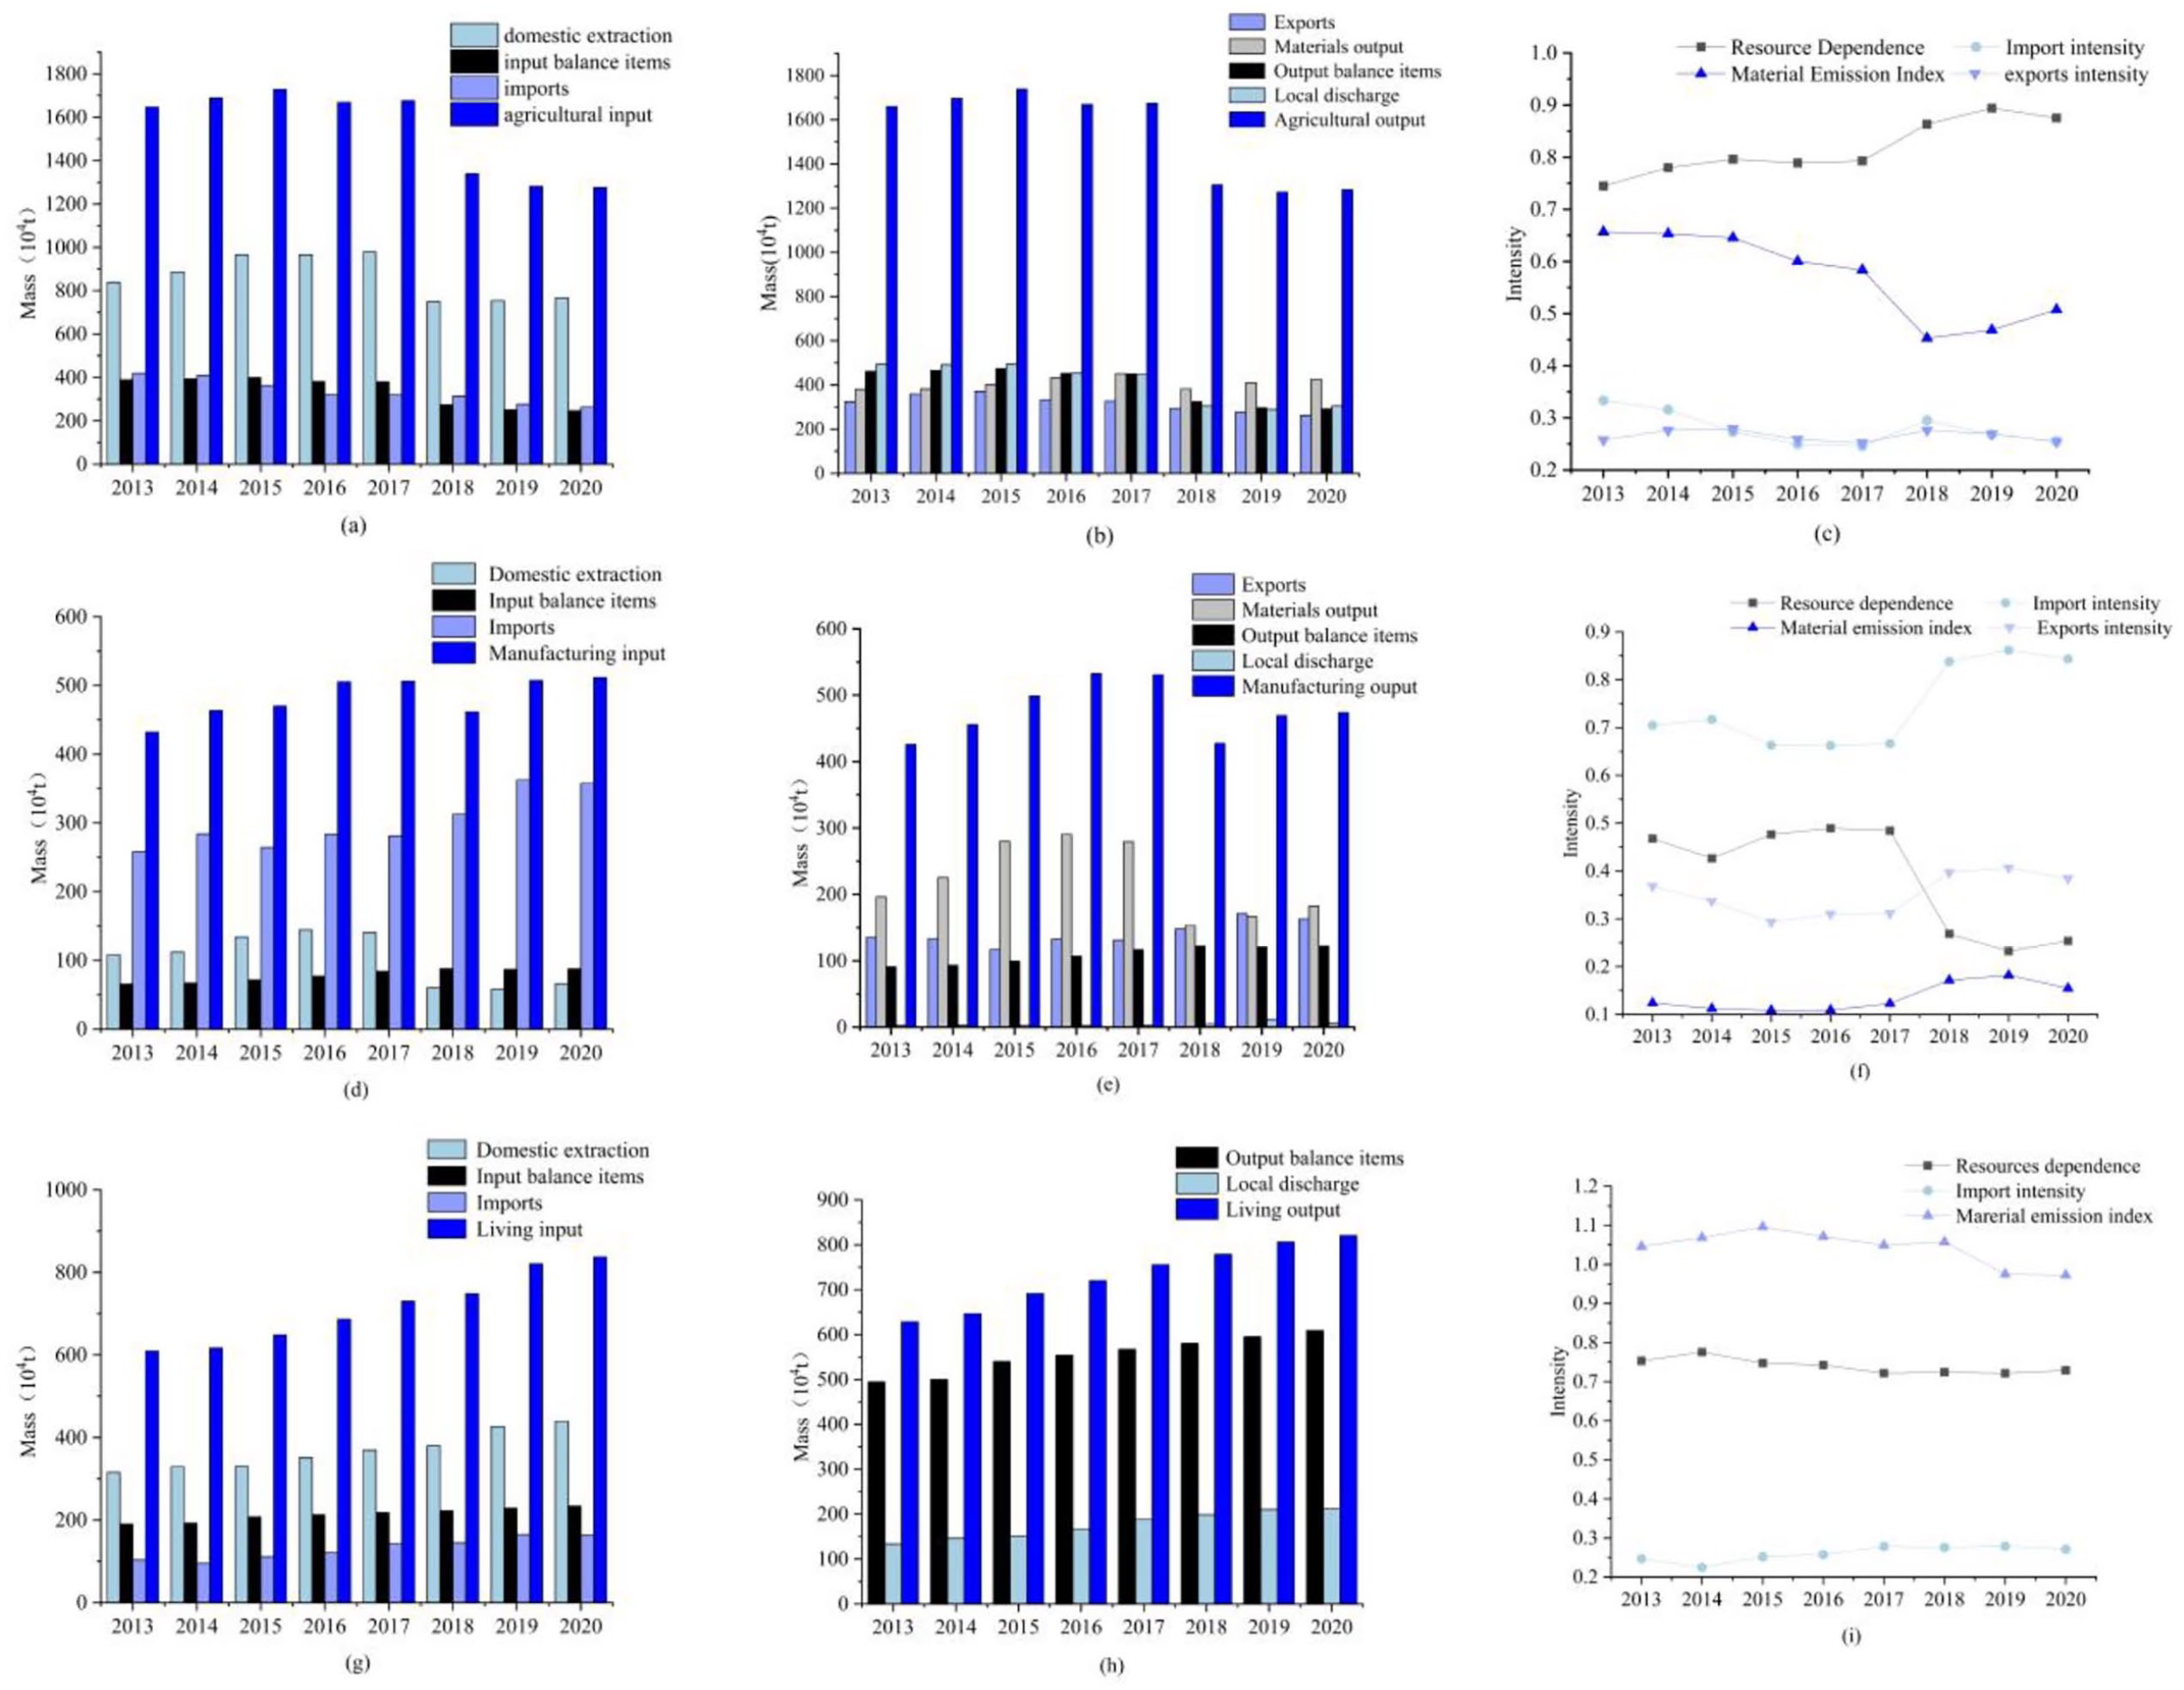
Analysis and evaluation of material flow characteristics in each sector (agricultural: a, b, c; household consumption: d, e, f, manufacturing: g, h, i).
Analysis of the flow amounts in the UM
According to the material flow account established in 2.2, the metabolic process was analysed from agriculture, household consumption and manufacturing sectors. According to the five material flow categories mentioned in the methodology, we calculated material inputs, material outputs and metabolic indicators for each sector, as shown in Figure 2.
Generally, the supply of agricultural products was unstable in Hefei, with an upward trend from 2013 to 2017, reaching its peak supply in 2017 at 7.69 × 10⁶ Mt, then production of agricultural products gradually declined and returned to the original scale, which was consistent with inputs trend of industrial products (e.g. plastic films). The resources produced by agricultural sector, which provided material support for household consumption and manufacturing, has grew to 11.67% in 8 years. The dependence on Imps and Exps gradually decreased. Imported materials were mainly energy and fodder which was required for livestock breeding and the number of Imps gradually decreased with the reduction of livestock breeding scale. A large number of wastes (e.g. livestock manure) was inevitably generated and they posed a threat to environment. Material inputs, outputs and risks to the environment were gradually reduced as the agricultural scale in Hefei declined.
There are variations in material needs and environmental impacts of cities depending on urban development level and leading industries (Wang et al., 2020). The development degree of urban economic activities determines consumption of resources and generation of wastes. The development of modern society was supported by industrial activities through producing various products or semi-finished products. The organic industrial products related to multiple-sources organic solid waste were mainly counted in this model. The total material input of manufacturing industry in Hefei presented two stages: there was an increasing trend from 2013 to 2017 and the total inputs increased by 14.7% compared to 2013, then there was a decrease in 2018 and followed by an increasing trend. Imported material for industrial activities has increased by 27.8% in last 8 years, mainly influenced by the demand of energy and raw materials. Imps and material inputs presented an upward trend, which meant consuming more materials and producing more products, and inevitably generating dependence on imported products and environmental pressure (Cui et al., 2019).
The household consumption sector played an important role in sustaining human living activities in urban areas. The total material input gradually increased to 27.2%, and similarly, the total material output increased to 25.6%, which was associated with the increasing material demand and beautiful life of human beings. The Imp intensity of the household sector was less than 0.3 in 8 years, which indicated low dependence of Imps in Hefei. Local production and resource extraction can basically meet people’s material needs. Material emission index eventually decreased as it was related to the high rate of output BI, and multiple-sources organic solid waste emissions (e.g. domestic waste and sludge) increased in a fast speed, putting huge pressure on urban environmental management (Pappas et al., 2021).
The statistics of multiple-source organic solid waste showed that domestic waste and farming waste accounted for a large proportion of waste, which indicates that government should focus on the treatment and reuse of these two wastes. At present, the management of domestic waste classification has been carried out in Hefei, and attention was paid to the precise treatment and resource reuse of domestic waste. Hefei has a strong development potential as the capital city of Anhui Province and the population in Hefei is increasing rapidly year by year. The consumption of resources is also increasing, creating more pressure on the environment. The analysis of living sector showed that Hefei is less dependent on resources and the demand for Imps from other cities increases significantly from 2018. The urban metabolic system can trace the trajectory of material flows within the city more clearly. The changes in resource flows reflected by UM can help cities in resource management and development planning to promote sustainable urban development.
Analysis of ecological flow network
Figure 3 depicts the integrated flow of the metabolic system established in Figure 1. The lines represented the combined flow between two sectors, the colour from dark to light represented the direction of flow, and the thickness of the lines represented the size of the combined flow. The integrated flows between sectors of the city system in Hefei made a difference but remained relatively stable, as shown in Figure 3. The total integrated flow of metabolic network in Hefei decreased by a relatively small 5.8% during the study period. The decline in metabolic network flows was mainly caused by agricultural sector, associated with consumption of agricultural products in manufacturing and organic solid waste emissions in agriculture. The greater changes of material flows between sectors were flows from E to V and flows from H to V from 2013 to 2020. The largest material input among sectors of metabolic network was agriculture sector and its integrated flow decreases by 26.08% from 2013 to 2020. The environment sector was the second largest recipient of substances in metabolic network, and its integrated flow increased by 6.5% over 8 years.
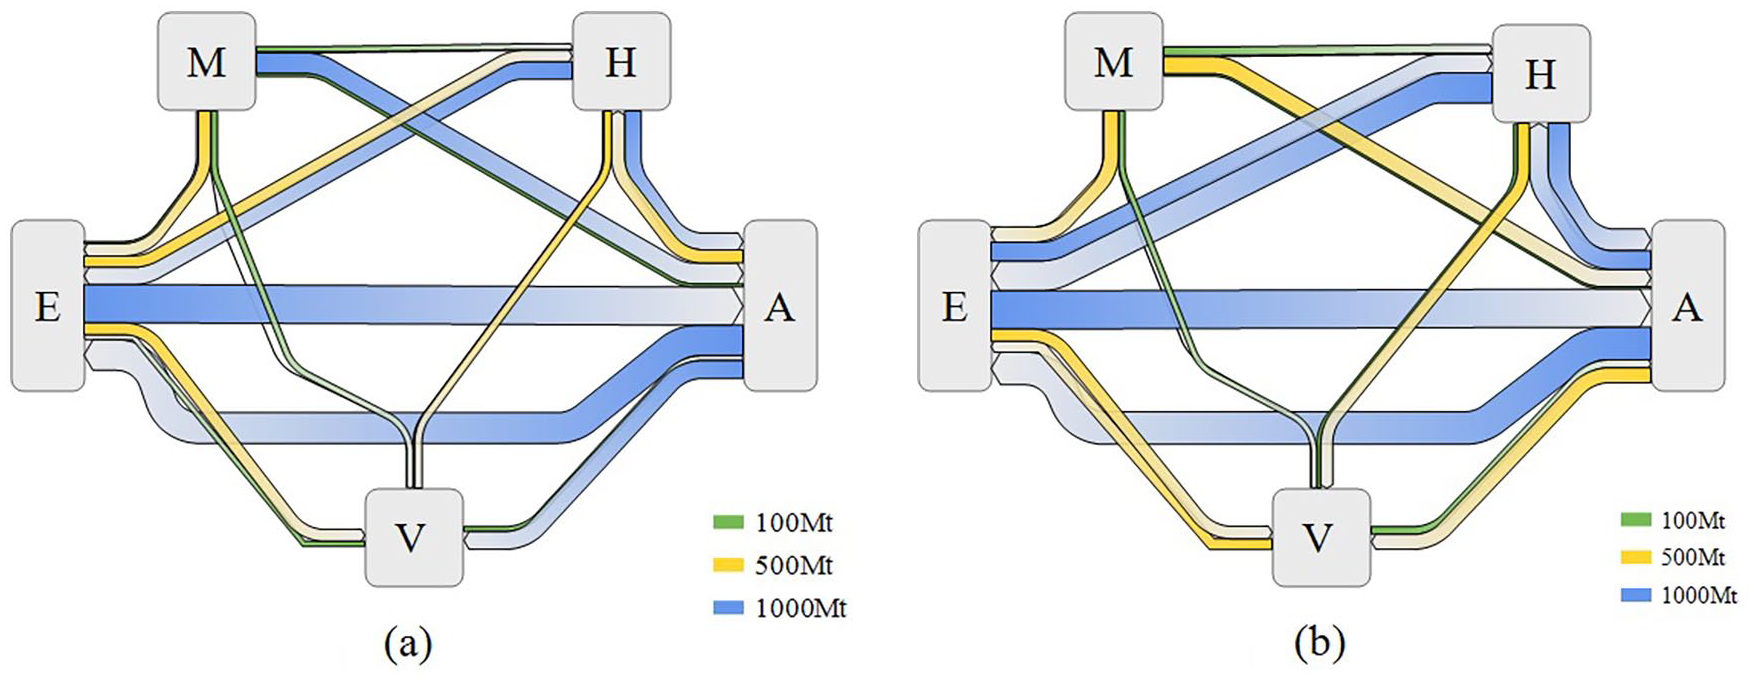
The integrated flow among sectors of urban metabolic system in Hefei in 2013 (a) and 2020 (b).
The variations and average weights of sectors in Hefei’s metabolic network from 2013 to 2020 was calculated, as shown in Figure 4. The ranking of sectoral weights was as follows: A (36.61%) > E (30.94%) > H (14.56%) > V (14.28%) > M (3.6%). Agricultural sector contributed the largest material flow as the producer in the system, which indicated that agricultural production played a prominent role in Hefei’s UM.
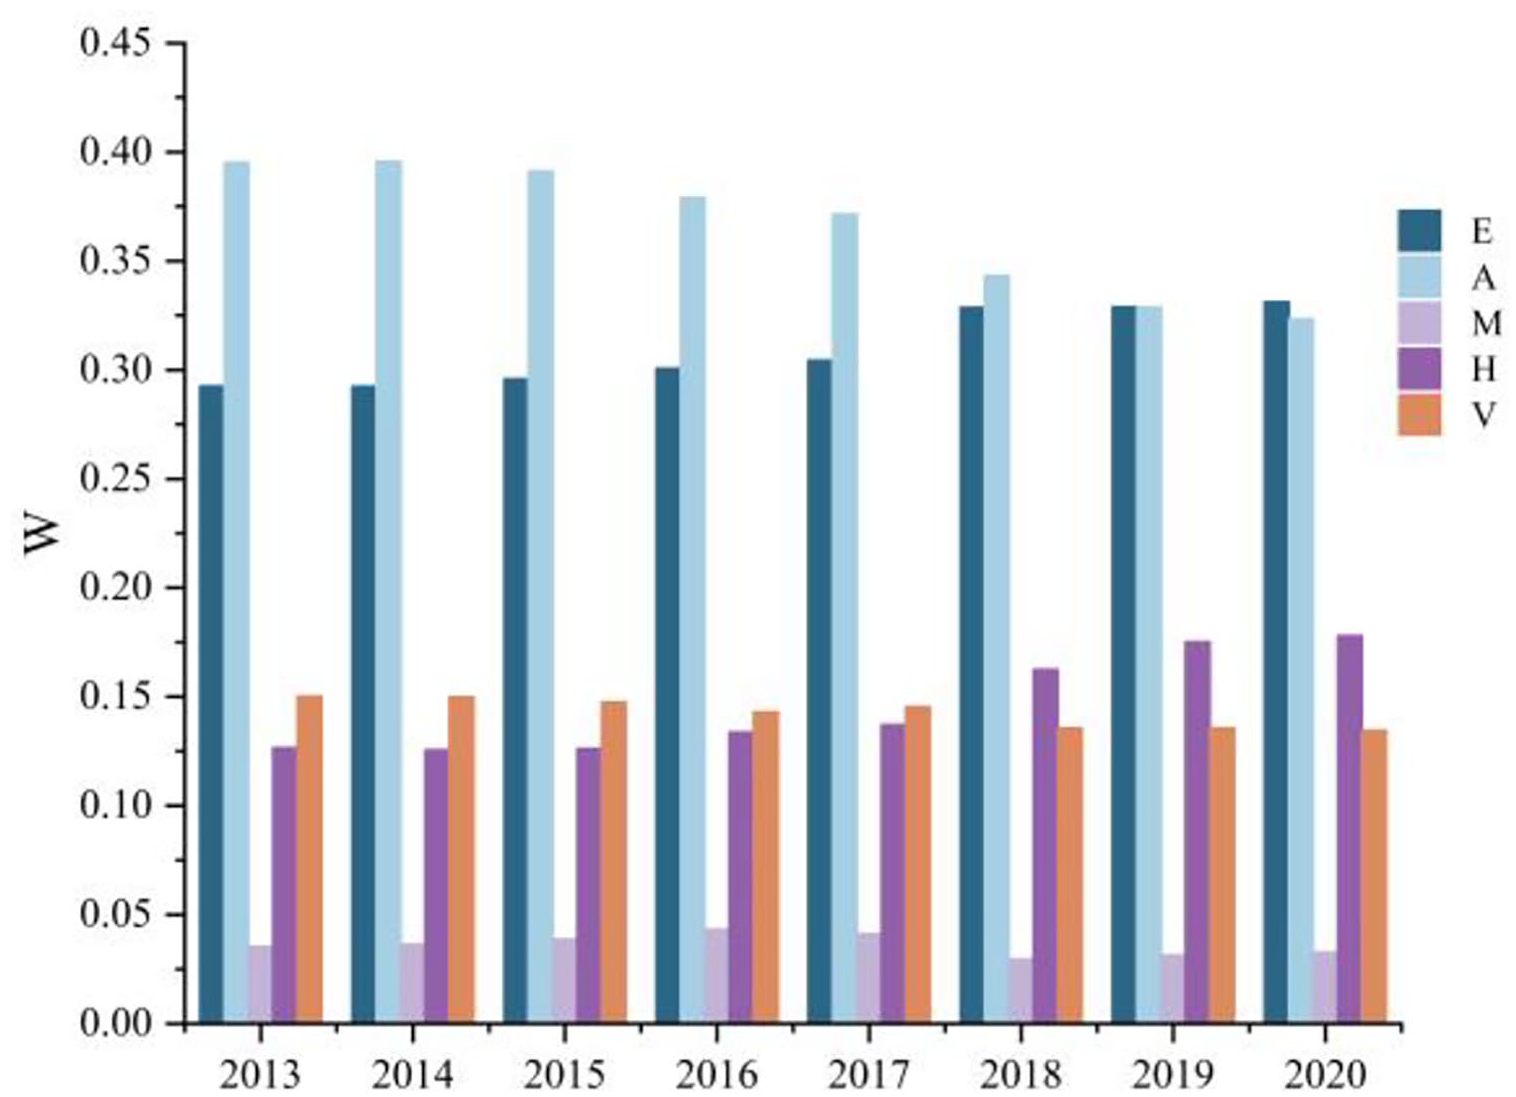
Variations of sectoral weight within Hefei’s urban metabolic system from 2013 to 2020.
The integrated flow intensity of metabolic network had two influencing factors, direct intensity and indirect intensity, where the effect of indirect intensity on integrated flow intensity was more obvious (Figure 5). The effect of direct intensity on integrated flow intensity was more obvious (more than 15%) in all sectors except manufacturing and the change of integrated intensity in these sectors had almost no effect on direct intensity in this research. Due to the relatively large proportion of indirect intensity, the trend of change in integrated flow intensity was consistent with the trend of change in indirect intensity. All sectors basically showed a trend of rising and then falling.
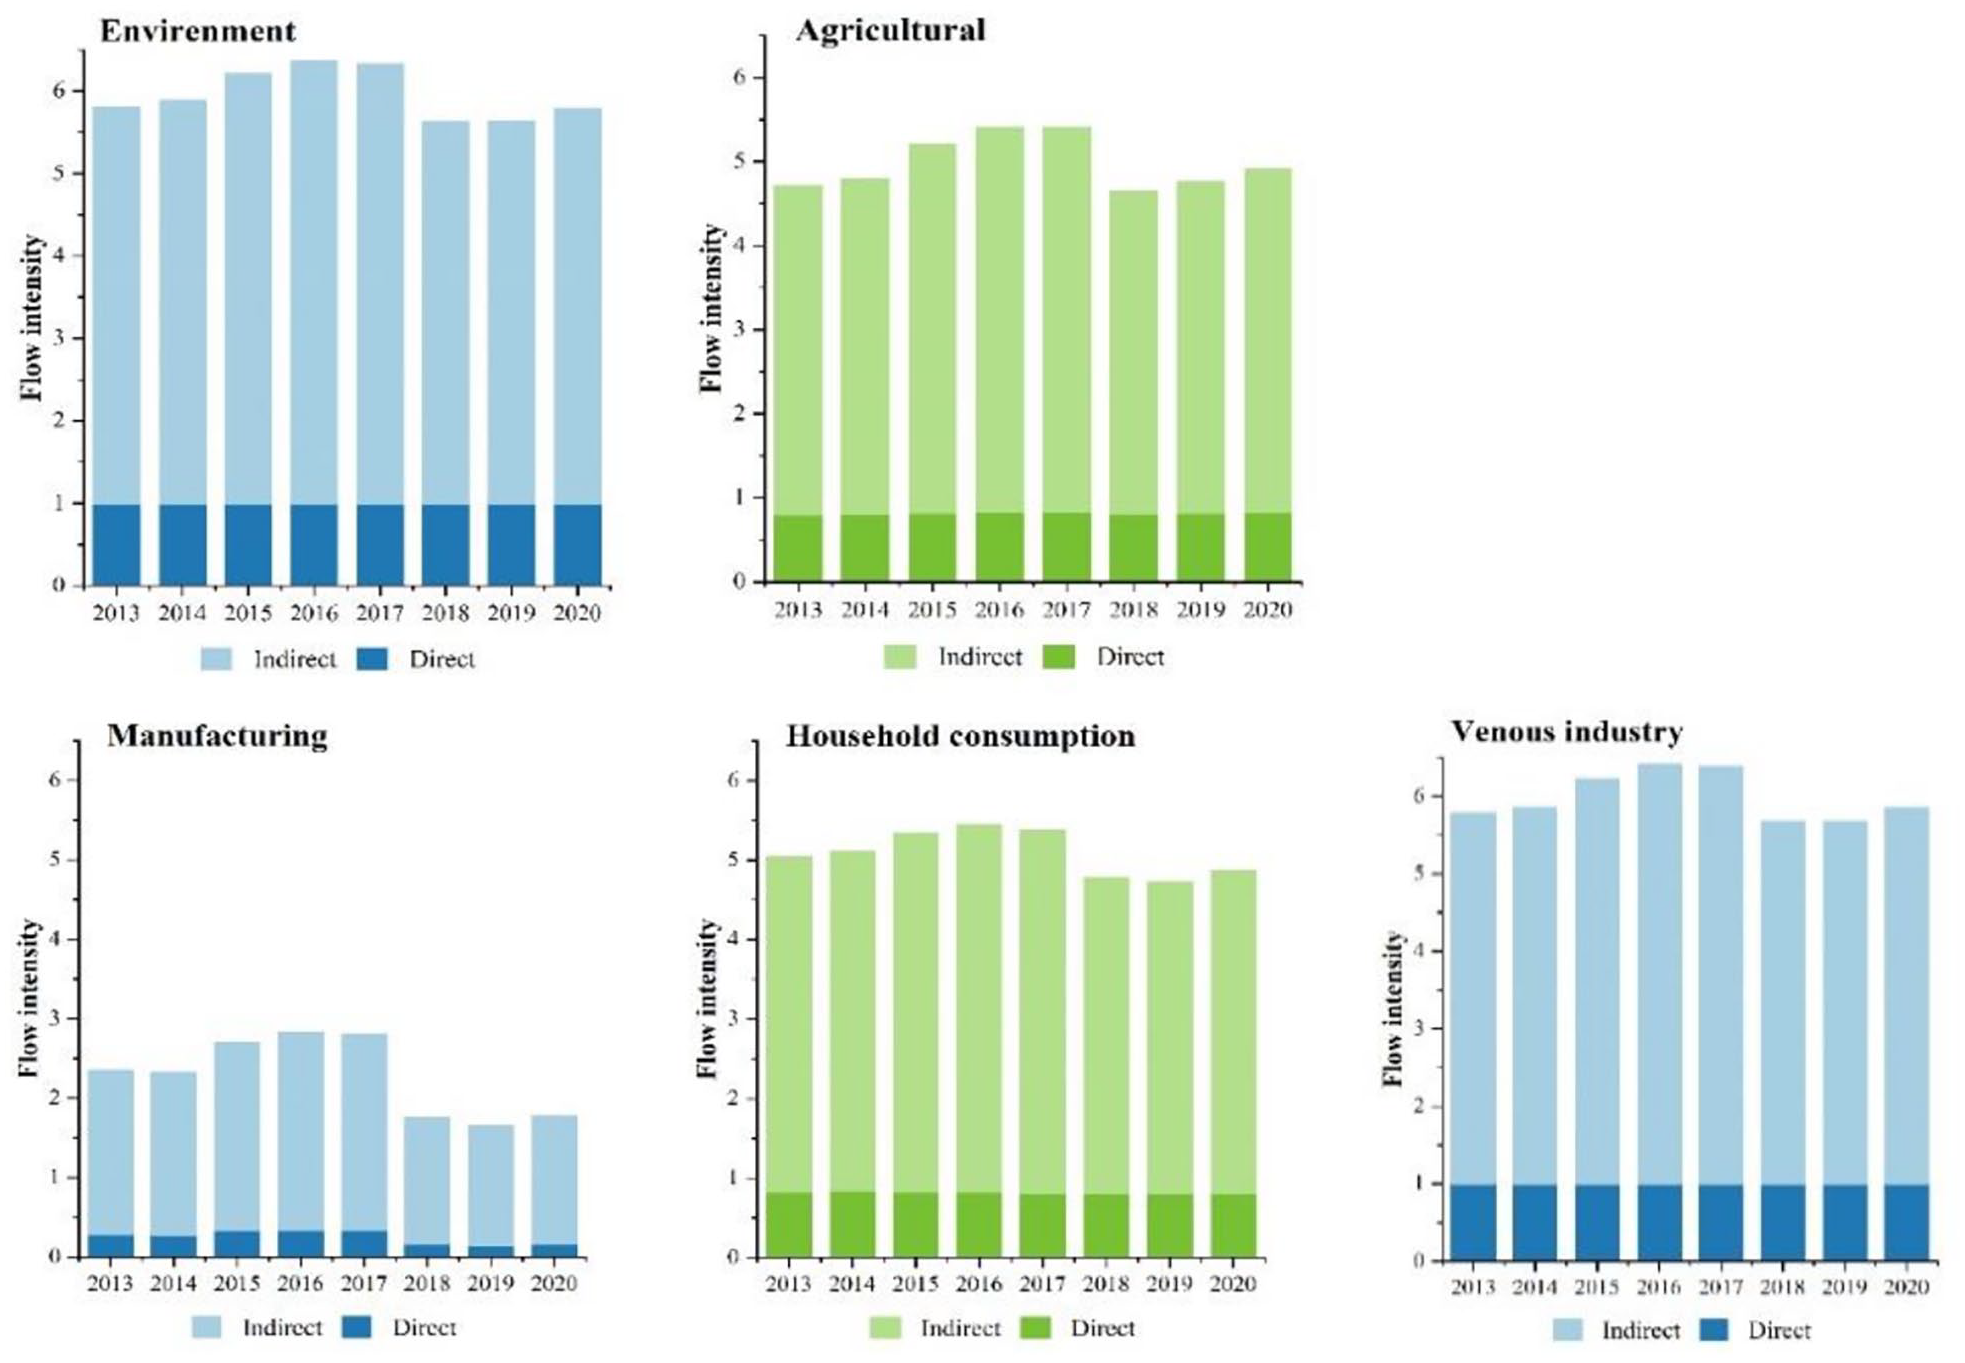
The changes in the direct and indirect flow intensities for five components of metabolic flow network from 2013 to 2020 in Hefei.
The analysis of the utility relationship matrix from 2013 to 2020 showed that ecological relationships of multiple-source organic solid waste in metabolic system in Hefei remained basically stable in 8 years. According to the ecological relationship analysis, the system exhibited five predatory relationships, four controlling relationships and one symbiotic relationship as shown in Table 2, and this system was dominated by exploitative (50%) and controlling relationships (40%). The stable emergence of symbiotic relationships between manufacturing and venous industries reflected positive feedback between these two sectors. (suae, suea) = (suha, suah) = (suhm, sumh) = (sura, suar) = (surh, suhr) = (+, −) represented exploitation relationship. Among them, (suae, suea) = (+, −) represented stable exploitation of resource from agricultural sector to environment; (suha, suah) = (+, −) represented high demand for agricultural resources in household consumption sector; (sumh, sumh) = (+, −) represented consumption of manufacturing products from household consumption sector; and (sura, suar) represented high emission of agricultural wastes which meant enormous harm to ecology environment. (sume, suem) = (suma, suam) = (suhe, sueh) = (sure, suer) = (−, +) represented control relationship. Where (sume, suem) = (−, +) represented counteraction of substances released into environment from industrial production. (suma, suam) = (−, +) represented the use of industrial products by agriculture. (sure, suer) = (−, +) represented the impact of waste disposal on the environment (Borrett et al., 2018).
Ecological relationships among Hefei’s five sectors from 2013 to 2020.
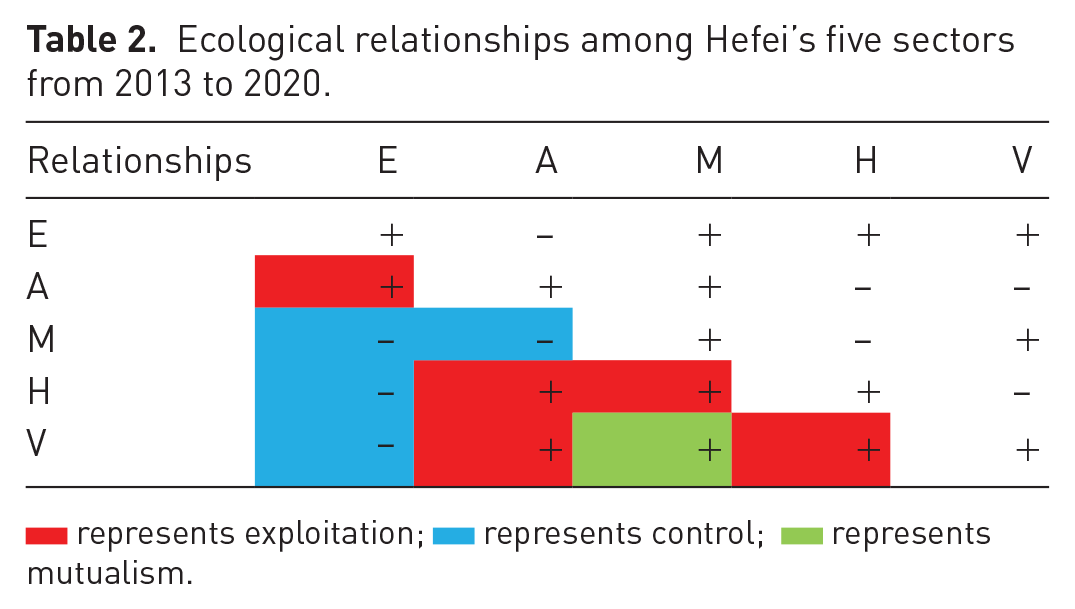
 represents exploitation;
  represents control;
  represents mutualism.
The process of material consumption and exchange within UM was clarified through ENA. The integrated flows showed that internal system of UM in Hefei was relatively stable. The weight of agricultural sector in Hefei was significantly reduced. The weight of manufacturing sector was slightly reduced from 2018 as shown in Figure 5. These results indicated that the industrial structure has changed, and the proportion of manufacturing and agriculture sectors has decreased with the urban development in Hefei, which was also consistent with the results in Beijing and Wuxi (Li et al., 2018, 2019). The adjustment of industrial structure could influence resource metabolism. The ecological relationships in Hefei were consistent with other cities, where control and exploitation relationships dominate the city, and the proportion of interconnection relationships was relatively low (Li et al., 2018, 2019). Therefore, policy makers should consider metabolic internal relationships to improve resource utilization and carry out sustainable development with the development of city.
Conclusions
Resource consumption and waste emissions involved in the metabolism of multiple-source organic solid waste in Hefei were investigated from the perspective of material metabolism, and the changes of material input, output and consumption in the metabolic system from 2013 to 2020 were analysed. With the accelerated urbanization, the consumption of resources in Hefei was increasing and the emissions of multiple-source organic solid waste were increasing, which posed a challenge to urban management. The links between five critical sectors in UM were explored through ENA. The largest material flows in the network were contained in the sectors of environmental and agricultural, while they were also the main resource providers and waste dissipators. The integrated flow intensity of the network was influenced by indirect flows and it decreased. Control and predation relationships were dominant in metabolic networks and only one set of mutualistic relationships existed in the ecological network, which indicated that future policy making should be oriented towards harmonious and symbiotic metabolic relationships.
The urban metabolic accounting framework involving multiple-sources organic solid waste was developed which can be extended to other cities. Although we considered as many material categories as possible, some material categories may be neglected and it leads uncertainty to model. All these uncertainties made difference between the calculation of material flow in the model and the actual situation. In the future, further expansion and improvement of metabolic network should be carried out as soon as possible to provide more scientific and accurate data sources.
Supplemental Material
sj-docx-1-wmr-10.1177_0734242X221136467 – Supplemental material for Material flow analysis and characteristics of multiple-source organic solid wastes from a perspective of ecological network analysis: A case study in Hefei, China
Supplemental material, sj-docx-1-wmr-10.1177_0734242X221136467 for Material flow analysis and characteristics of multiple-source organic solid wastes from a perspective of ecological network analysis: A case study in Hefei, China by Yulin Zhang, Chuncai Zhou, Jiao Du, Min Wang, Wentao Wu and Guijian Liu in Waste Management & Research
Footnotes
Acknowledgements
We acknowledge editors and reviewers for polishing the language of the paper and for in-depth discussion.
Declaration of conflicting interests
The authors declared no potential conflicts of interest with respect to the research, authorship, and/or publication of this article.
Funding
The authors disclosed receipt of the following financial support for the research, authorship, and/or publication of this article: This work is supported by the National Key Research and Development Project of China (2020YFC1908601), the National Natural Science Foundation of China (42272196), the Key Research and Development Program of Anhui Province (202004a06020030 and 202004b11020016), the Anhui Provincial Natural Science Foundation (1908085MD113) and Project of Linhuan Coking Industry Company.
Supplementary Information
Supplementary data to this article can be found online.
References
Supplementary Material
Please find the following supplemental material available below.
For Open Access articles published under a Creative Commons License, all supplemental material carries the same license as the article it is associated with.
For non-Open Access articles published, all supplemental material carries a non-exclusive license, and permission requests for re-use of supplemental material or any part of supplemental material shall be sent directly to the copyright owner as specified in the copyright notice associated with the article.