
Abstract
The global market for battery electric vehicles (BEVs) is continuously increasing which results in higher material demand for the production of Li-ion batteries (LIBs). Therefore, the end of life (EOL) of batteries must be handled properly through reusing or recycling to minimize the supply chain issues in future LIBs. This study analyses the global distribution of EOL lithium nickel manganese cobalt (NMC) oxide batteries from BEVs. The Stanford estimation model is used, assuming that the lifespan of NMC batteries follows a Weibull distribution. The global sales data of NMC batteries from 2009 to 2018 were collected and the sales data from 2019 to 2030 were estimated based on historical trends and BEV development plans in the top 10 countries for BEV sales. The result shows a view of EOL NMC batteries worldwide. In 2038, China, South Korea and the United States (US) will be the three leading countries in the recovery of NMC battery materials. An overall global flow of NMC battery materials (aluminium, copper, manganese, steel, lithium and graphite/carbon) was also predicted in this research. This study estimated the waste potential of NMC battery materials specifically in the top 10 countries and also in other countries. Finally, the economic value estimation results for recovered materials indicated that copper, aluminium and manganese will have cumulative economic values of 7.9, 4.4 and 3.9 billion US dollars in 2038, respectively. As this study considers the different specific energy of NMC batteries in the coming years due to technological advancement, the findings can provide a more realistic insight into the future demand for NMC battery materials. This study reveals that a high number of EOL NMC batteries will be accumulated in 2038 in several countries. Therefore, large-scale recycling infrastructures should be set up to improve the efficiency of the recovery of battery materials.
Introduction
Presently, the transportation sector is mainly driven by fossil fuels such as petrol, diesel and natural gas. This sector consumes almost two-thirds of global oil (International Energy Agency, 2020b) and produces approximately 23% of global CO2 emissions (Buckle, 2009; Shafique et al., 2021a). Therefore, the global community is focused on moving to sustainable vehicles to tackle climate change. Under these circumstances, electric vehicles (EVs), one type of viable vehicle, attract much attention from society to reduce direct CO2 emissions (Shafique et al., 2021b; Shafique and Luo, 2021). The use of EVs has increased substantially in recent years around the globe (see Figure 1). Global sales of EVs exceeded one million in 2017 (International Energy Agency, 2018) and sales of battery electric vehicles (BEVs) were estimated to be 1.44 million in 2018 (EV-Volumes, 2019). The number of EVs will continue to increase. According to different organization’s forecasts, annual EV sales in 2030 are anticipated to be 21–28 million (International Energy Agency, 2019), 26 million (Bloomberg, 2020) as well as 31.1 million (Deloitte Insights, 2020). As a result, the adoption of EV batteries, such as lithium-ion batteries (LIBs), is expected to grow, rising the demand for LIB materials (Shafique et al., 2022; Simon et al., 2015; Weil and Ziemann, 2014). Lithium nickel manganese cobalt (NMC) oxide and lithium nickel cobalt aluminium (NCA) oxide are the most widely used cathode chemistries for EV batteries (Brand et al., 2013). NMC batteries are one of the leading types of batteries deployed on BEVs (Mayyas et al., 2019). However, with the increase in the number of EV batteries, the number of batteries from BEVs reaching their end-of-life (EOL) will proliferate soon (Wang and Wu, 2017).
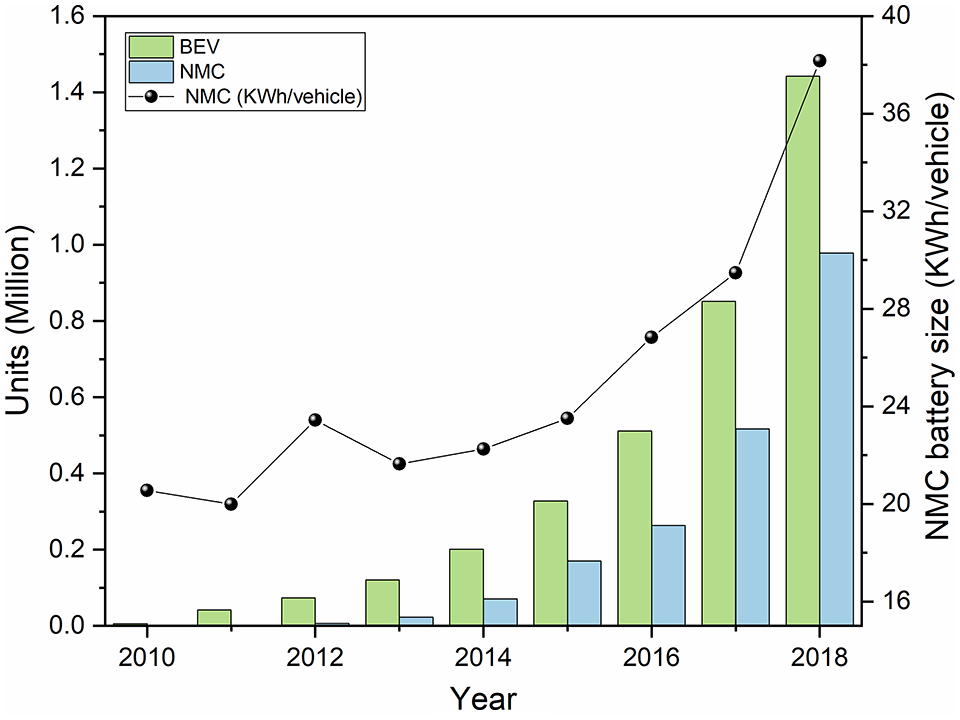
Sales of BEVs and NMC and change in NMC battery size in 2010–2019.
Recycling or reusing EOL of batteries is a key strategy to mitigate the material supply risk by recovering the larger proportion of materials from used batteries and thus reusing the recovered materials for the production of new battery materials (Shafique et al., 2022), as well as to alleviate the environmental degradation (ED) and human health (Golmohammadzadeh et al., 2018). Battery metals such as nickel and lead produce reactive oxygen species, which further damage deoxyribonucleic acid (Stinson et al., 1992; Stohs and Bagchi, 1995). Similarly, electrolytes and organic solutions may contain toxic elements that can leak and degrade the water and soil (Liu et al., 2019). Moreover, the sustainable recycling of batteries is an essential step towards the circular economy because the cathode of batteries contains lithium (2–5%), nickel (5–12%), cobalt (5–20%) and manganese (7–10%) (Li et al., 2019). Therefore, recycling the useful metals (e.g. aluminium, copper and manganese) from EOL batteries can mitigate the ED and boost resource efficiency (Harper et al., 2019; Oliveira et al., 2015). If conducted domestically, recycling can reduce dependency on imported battery materials in countries (Richa et al., 2014) and thus reduce the burden on battery material supply chain in the coming years. Several published literature emphasizes the recycling of the LIBs (Ai et al., 2019; Castro et al., 2021; Crespo et al., 2022; Kamran et al., 2021; Yao et al., 2021), which could help to reduce the use of new material for future battery production (Gaines and Nelson, 2012; Shafique et al., 2022; Ziemann et al., 2018). Schmidt et al. (2016) assessed the material flow analysis for LIBs (Schmidt et al., 2016). Other researchers focused on cobalt and lithium and their potential depletion in the face of growing demand for BEVs (Olivetti et al., 2017; Pehlken et al., 2017). Ziemann et al. (2018) carried out a material flow analysis for EV LIBs to assess the recyclable lithium, using different recycling scenarios and varying the quality of the recycled materials. Their results indicated that if the recycled lithium was of satisfying quality to be used as a material input for producing new EV LIBs (closed-loop), then it could reduce the pressure on available material resources (Ziemann et al., 2018). As quantities of EOL NMC batteries are expected to increase shortly, many countries have developed LIB recycling technologies. However, it is still challenging to recover more valuable products such as nickel and cobalt (Sonoc et al., 2015; Ziemann et al., 2018). Analysing the global spatial distribution of NMC batteries can help countries formulate policies regarding resource handling and solve the problems associated with tackling EOL battery quantities in the coming years.
The quantity of EOL EV batteries mainly depends on sales volume, unit weight, battery lifetime distribution and battery technologies (Ai et al., 2019; Wu et al., 2020). Ai et al. (2019) assume two lifespans for LIBs of BEVs and employ various distribution functions (i.e. uniform, Weibull and truncated normal) for battery discard probability for estimating the EOL of batteries. On the other hand, Wu et al. (2020) examine the EOL by considering the different vehicles with different weights. In addition, the Weibull distribution is used for end of life distributions of EV batteries and then finally calculated the quantities of EOL NMC batteries material on the Stanford estimation model around the globe. Similarly, Qiao et al. (2020) used the Weibull distribution to characterize the lifetime of EV batteries, and then employed the Stanford estimation model to quantify LIBs EOL in 2010–2050 in China. They further predicted the number of retired ILBs in China from 2010 to 2050. Moreover, Abdelbaky et al. (2020) calculated the number of EOL LIBs in Europe by employing different probability techniques, and average weight was assumed for batteries each year (Wu et al., 2020). Recently, the power capacity (kW/h) of LIBs has continued to amplify with new technologies used in future battery production. Previous studies focused on national levels (e.g. China, USA) and mostly estimated EOL EV batteries without considering a specific battery type. Therefore, a more comprehensive evaluation is needed specifically for NMC batteries that can estimate the current and future numbers of EOL NMC batteries, as this type is widely used in BEVs around the globe.
This study focuses on NMC batteries and provides a more precise estimation of the number of EOL BEV batteries. First, we compile NMC batteries’ sales figures from 2009 to 2018 and then forecast future sales from 2019 to 2030 by considering the future climate change mitigation policies and incentive plans in different countries. In addition, the in-use stocks of NMC battery material are anticipated from 2009 to 2030. Second, by considering the dynamic life distribution of NMC batteries, the Stanford estimation model is utilized to estimate the EOL NMC batteries globally. Third, the recovered materials and waste materials were anticipated using material flow analysis. Fourth, the quantities of LIB materials such as aluminium, copper, lithium, manganese, graphite/carbon and steel from EOL batteries are also presented in the present study. Furthermore, the economic value of recovered NMC batteries was estimated to manifest their potential economic benefits.
The remainder of this paper is organized as follows. Next section describes the methodology applied in this research. The results are presented in Section ‘Results and Discussion’, followed by the discussion in the next section. Final section concludes this study with future recommendations.
Methodology
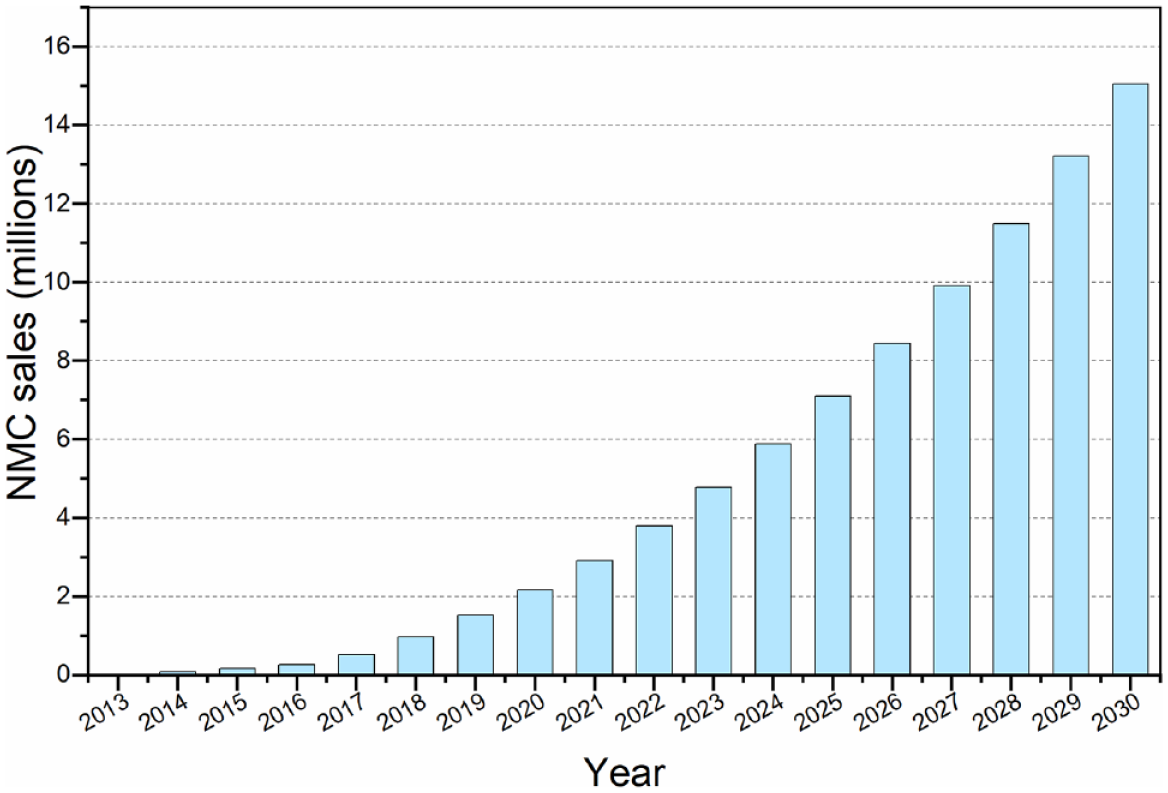
The methodology is shown in Figure 2. First, the analysis determined the amount of BEV NMC on the global market. Here, BEV sales, average battery size and share of different LIB batteries data were collected from the different published and reports. According to historical trends and future promotion and incentive plans in multiple countries, we have predicted the future sales of new NMC batteries using a linear extrapolation in the 10 selected countries and remaining parts of the world. Second, by considering the future development of battery energy density (Wu et al., 2020), this study took into account the higher battery energy density in the coming years. The share of NMC batteries is used to quantify their raw materials around the globe. Based on the number of batteries entering the global market for BEVs, the EOL of NMC batteries is calculated using the different distribution functions as lifetime scenarios. Third, this study used the Stanford estimation model to predict EOL NMC batteries globally. Fourth, this research assessed the in-use stock and recycling potential of materials significantly used in NMC batteries. The selected materials from NMC batteries were discussed in relation to their global in-use stock, recycling potential and waste flow. Fifth, the economic value of potentially recoverable materials is presented.
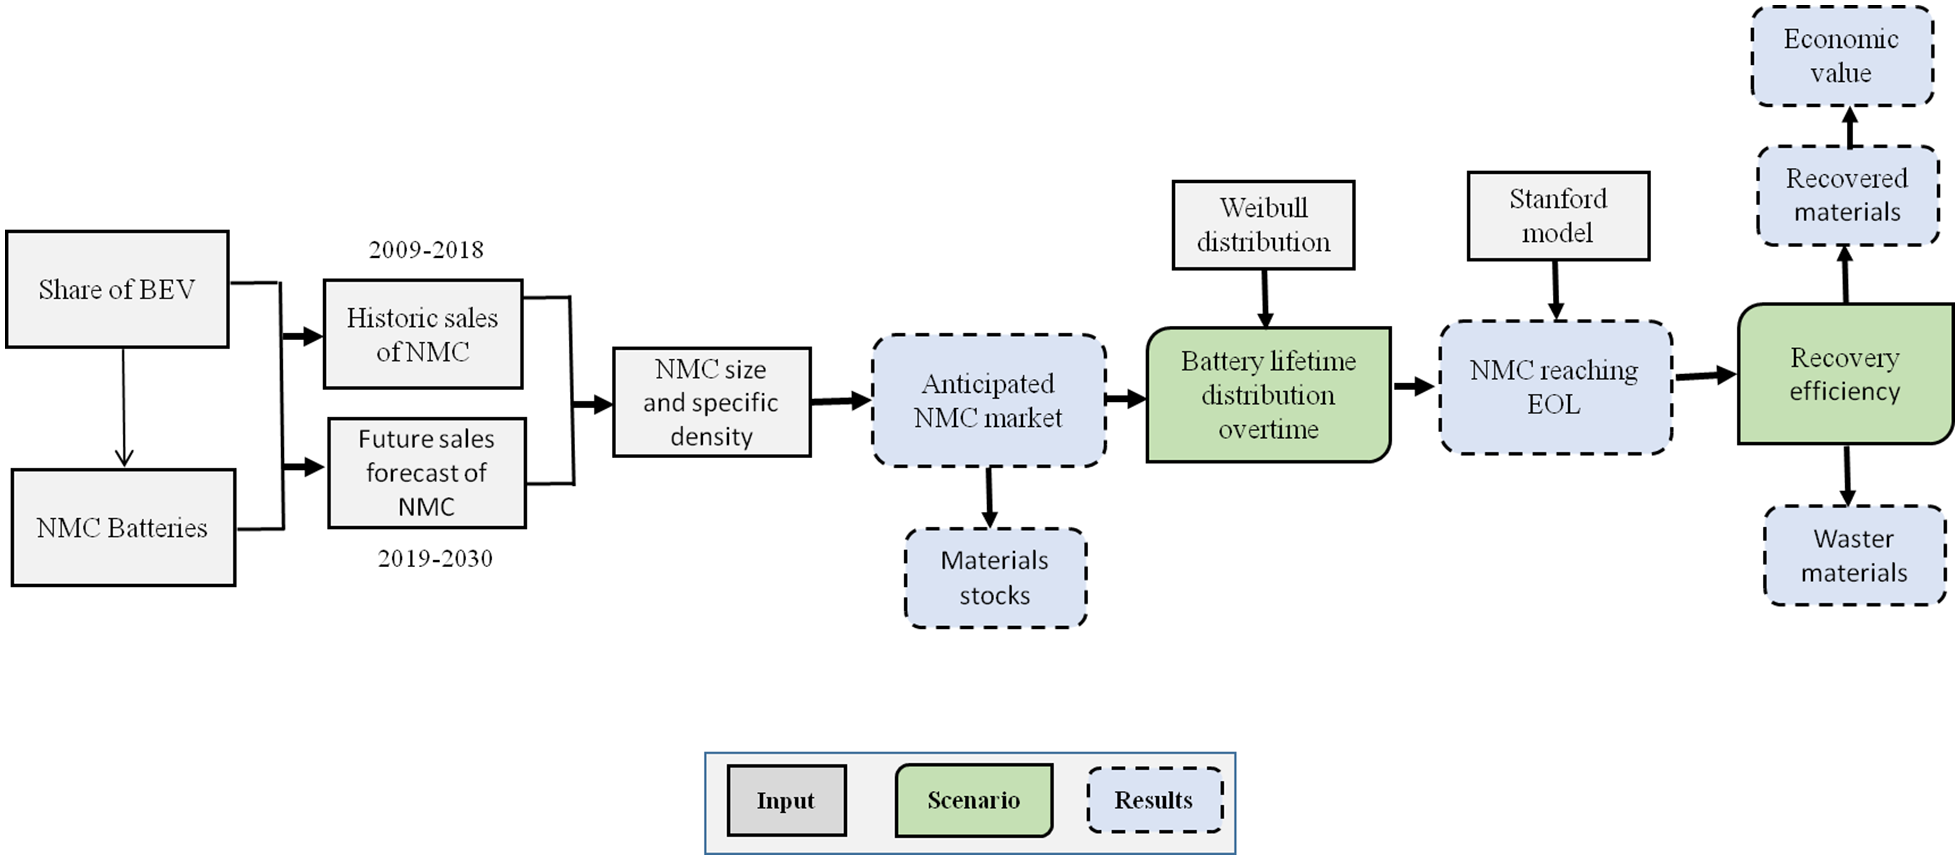
Methodology flowchart.
Scope of the study
In this study, we collected and estimated the NMC battery sales for BEVs globally from 2009 to 2030. The historical growth trend was considered for NMC battery sale prediction. For this purpose, based on the previous sales of NMC batteries, the future NMC batteries were predicted using the linear extrapolation. In addition, new plans for BEV adoption in different countries were considered for the future of NMC batteries (Gong et al., 2013; Woodward et al., 2020). Moreover, in the current research, it is believed that future NMC batteries will have a longer service life and, later, account for their EOL. For example, the average lifespan of NMC batteries in 2024 and 2030 was considered to be 10 and 15 years as compared with 8–10 years in the current scenario. Our study included only NMC batteries used in BEVs; we excluded the sales data of NMC batteries for hybrid electric vehicles (HEVs) and plug-in hybrid electric vehicles (PHEVs). This is because the main scope of this article is how NMC battery impacts the material demand and recycling potential on the global level. Moreover, for comprehensive analysis as the battery sizes of BEVs are greater than HEVs and PHEVs so here we only consider the NMC for BEVs. This research accounted for NMC battery sales in each country by counting NMC BEV sales domestically without considering imports and export during the use phase. Our main aim is to represent the NMC battery material demand and recycling potential globally by manifesting the result of different countries.
NMC battery sales from 2009 to 2030
Global sales of NMC batteries have increased rapidly in the past decades (Deng et al., 2020; Ponrouch and Palacín, 2019) and accounted for more than 80% of batteries used for BEVs (EV-Volumes, 2019). Therefore, the current market share of EV NMC batteries is extrapolated based on the top 10 countries, including others. Other types of LIBs (NCAs, lithium iron phosphates (LFPs) and lithium ion manganese oxide batteries (LMOs)) have very little market relevance and are therefore neglected here. An NMC battery uses lithium nickel cobalt manganese as the cathode material (Raugei and Winfield, 2019). This research compiled the data of NMC battery sales from 2009 to 2018 around the globe (EV-Volumes, 2019; International Energy agency, 2020a; Wagner, 2021). NMC BEV sales data were collected in each country for each year. The future sales of BEV NMC batteries from 2019 to 2030 were predicted using linear extrapolation. Based on historical trends and BEV roadmaps in different countries, we estimate global NMC battery sales in 2020, 2025 and 2030 at 2.17, 7.10 and 15.05 million, respectively. With the average battery capacity per vehicle in each year, the total capacity of NMC batteries from 2019 to 2030 was also predicted. In addition, by calculating the quantity of each material in per kWh of battery, this study also estimates the in-use stock of NMC battery materials, that is, aluminium, copper, lithium, steel, graphite/carbon and manganese.
Specific energy and battery weight
The average battery size of BEVs entering the global market is estimated based on previous trends, as well as future technological advancements that can affect the overall weight of the battery. The total number of BEVs in a certain year was multiplied by the battery size of the EV model, and then the total number of models was divided by the total number of sales to provide the average NMC battery size for the top 10 countries, including the other countries, as shown in Table 1. The values given in Table 1 are selected based on the published literature.
Average NMC battery sizes of BEVs considered in this study.
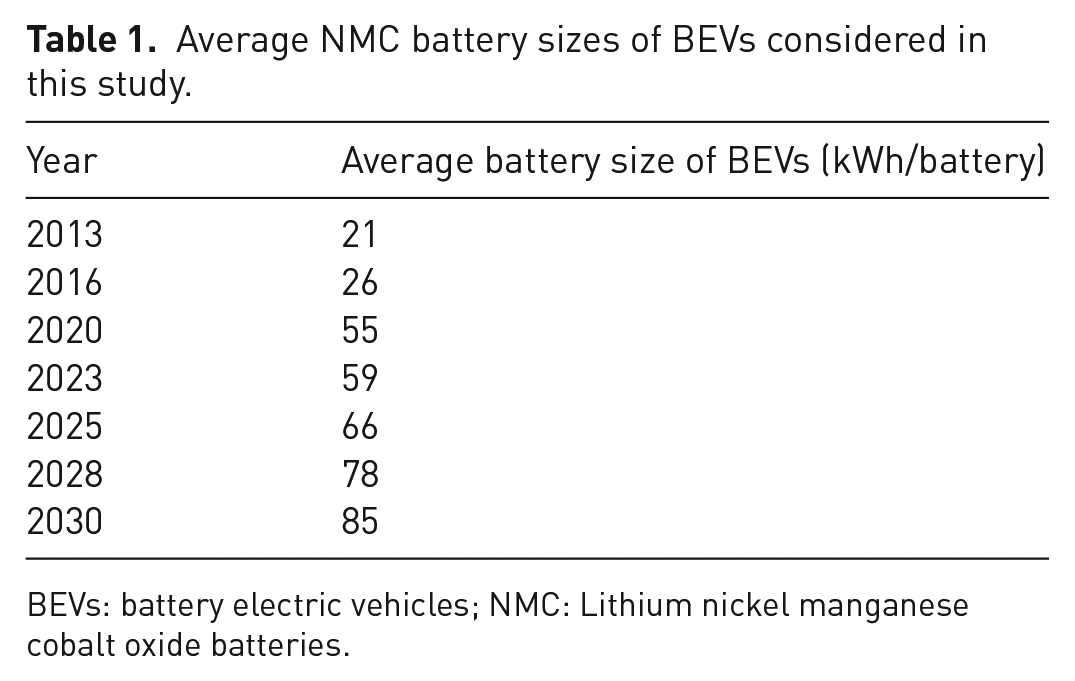
BEVs: battery electric vehicles; NMC: Lithium nickel manganese cobalt oxide batteries.
Presently, extensive research is going on LIBs, and the specific energy of LIBs is expected to rise in the future up to 295 Wh/kg (Griffith, 2019). Under the above circumstances, the current study assumed that the specific energy of NMC batteries is escalating at a constant rate each year and is expected to reach up to 266 Wh/kg in 2030. Linear interpolation was utilized to anticipate the specific density for each future year from 2019 to 2030. By dividing the NMC BEV battery pack capacity for each country in a specific year by the corresponding specific density, the NMC BEV battery weights were calculated. Multiplying NMC battery sales by NMC BEV battery weight gives the battery in-use stock’s weight each year. Assuming the proportion of materials (Richa, 2016) in the BEV battery remains unchanged (as shown in Table 2), the material in-use stocks of NMC batteries for each country can be calculated. The results are summarized in section ‘In-use material stocks of NMC batteries’.
Materials bills for the NMC battery pack (39 kWh) in a BEV (Based on Richa, 2016).
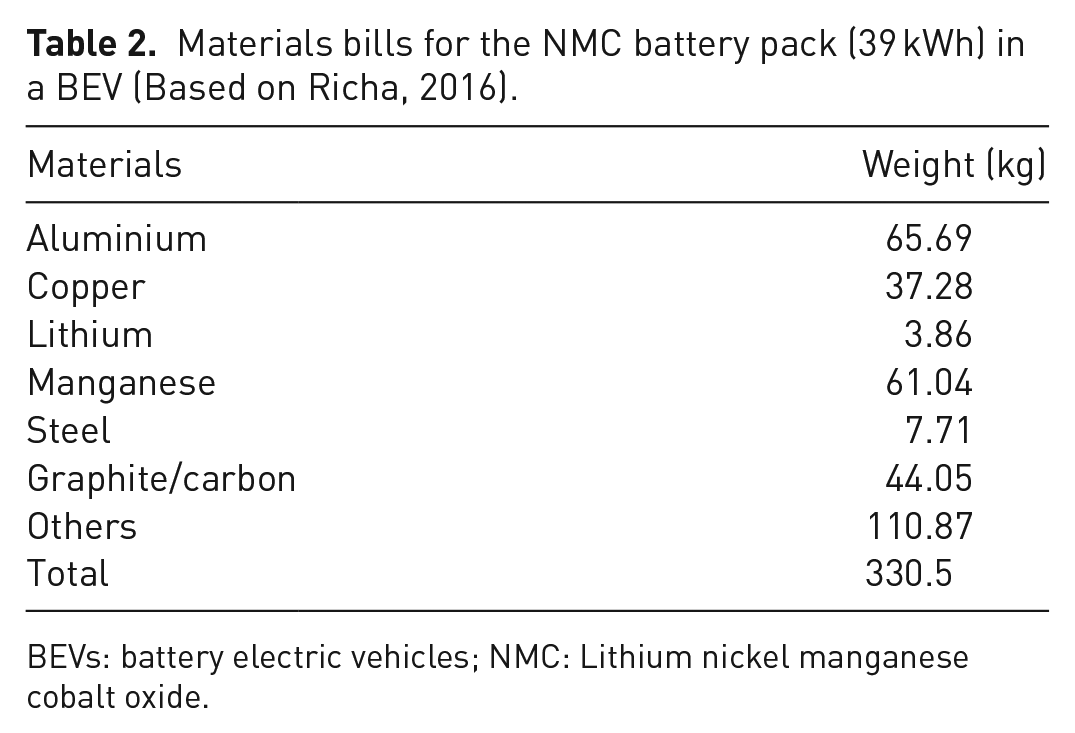
BEVs: battery electric vehicles; NMC: Lithium nickel manganese cobalt oxide.
Dynamic lifespan of NMC battery by Weibull distribution
The lifespan of BEVs LIBs is a vital factor for estimating the EOL battery volume. This is because BEV battery depends on the number of factors which includes battery capacity and degradation, material use and battery development technology and usage condition (i.e. road conditions and recharging frequency) (Qiao et al., 2020). Presently, the average lifespan is 10–15 years, while the manufacturer’s warranty lifespan is 8–10 years (California Air Resources Board, 2019). Thanks to technological advancements, the future lifespan of LIBs will increase up to 15 years; therefore, this study also assumed a higher lifespan of 15 years for NMC batteries from 2028 to 2030 (Ziemann et al., 2018).
Several factors such as battery recharging frequency and road conditions directly affect the actual lifespan of LIBs and therefore, a Weibull life distribution model with a dynamic lifespan is assumed based on the previously published study (Ai et al., 2019). A Weibull distribution is selected by assuming the dynamic battery lifespans to simulate the battery life distribution and anticipate the generation of e-waste. This Weibull distribution model was chosen to estate the scrappages of NMC batteries globally. The two parameters with F(t) denoting the battery life distribution function, as shown in equation (1).

In equation (1), β is the scale parameter, t is the year, which is equal to the average life of the battery, and α is the shape parameter with a value of 3.5 (Ai et al., 2019; Wu et al., 2020).
To assess the accuracy of the results, this research considered the average lifespan of NMC batteries from 2009 to 2014, 2015 to 2020, 2021 to 2024, 2025 to 2027 and 2028 to 2030 to be 5, 8, 10, 12 and 15 years, respectively. Figure 3 shows the percentage of NMC batteries with different average lifespans reaching their EOL.
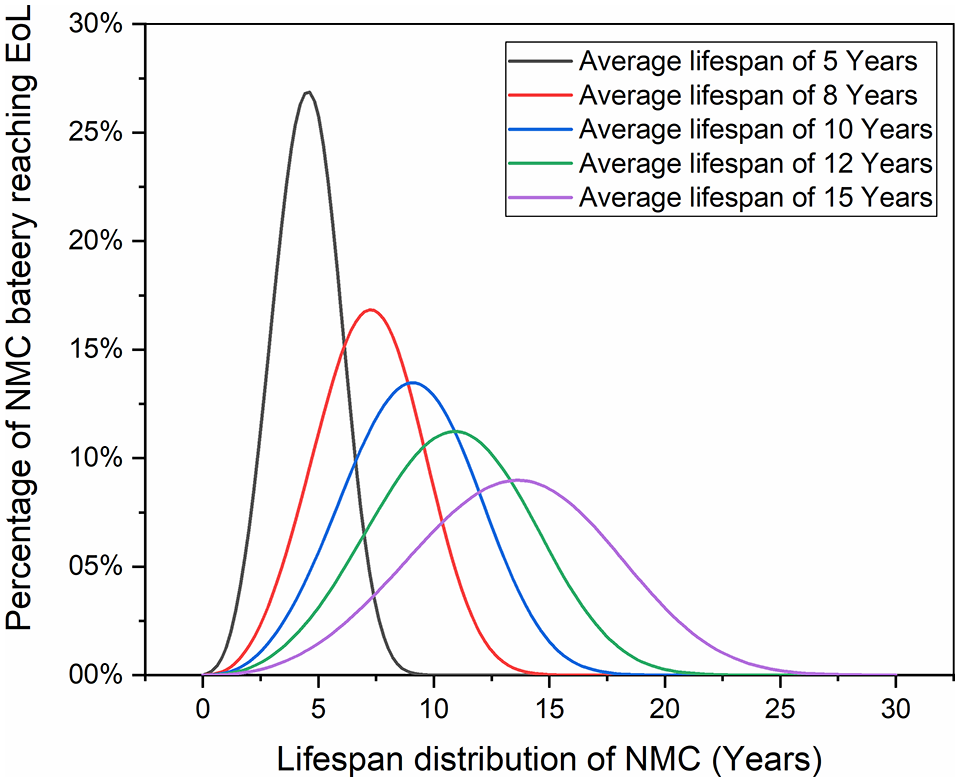
Lifespan distribution of NMC batteries.
Estimation of NMC battery retirement
In this study, Stanford model was selected to forecast the global NMC battery retirement from 2010 to 2030 (Shafique et al., 2022; Song et al., 2016). The Stanford model is a useful tool to accurately predict batteries’ internal systems in real time by considering the technological improvements that can further prolong the battery life. Therefore, to estimate the future EOL of NMC batteries in a more realistic way, this study uses this model for analysis. The quantities of different materials of NMC batteries reaching EOL were calculated from 2010 to 2030 using this model in the study. The Stanford method used to calculate the EOL of batteries is expressed as equation (2).
Recycling potential and waste flow assessment
To estimate the amount of constituting materials (i.e. Al, Li, Cu), the share of cathode type must be known. Therefore, the focus is on NMC batteries with cathode types NMC 622, NMC 111, NMC 811, NMC 422, NMC 532, NMC 523, NMC 721 and NMC 442 with varying weight shares, as used by most automakers (Li et al., 2018). The market share for each cathode type was estimated according to the capacity of LIBs entering the global market. The future development of NMC batteries was based on new EV models and future sales projections until 2030. The present study further assessed the recovery potential of NMC battery materials in the top 10 countries, including other countries around the globe. Using equation (2), the quantities of recovered NMC battery materials were calculated during the analysis.
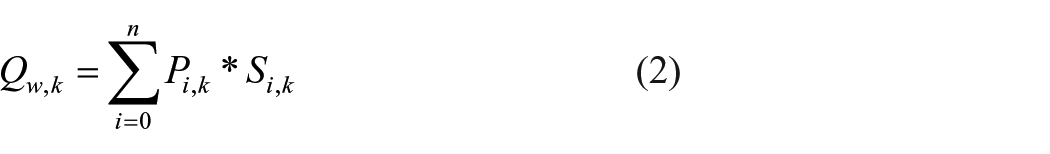
As we know, the estimation of recovery of LIB materials from the used LIBs is still in initial stage on the commercial scale. However, various laboratory studies indicated that the larger proportion of materials could be obtained through advanced technologies. Therefore, for this study, we assume the previous study recovery rates for different NMC battery materials (Li et al., 2016; Wu et al., 2020). With the recovery rate as shown in Table 3, we predicted the recoverable materials from NMC batteries from 2010 to 2030. Finally, the remaining parts of materials which could be not recovered is designated as waste flow in the current study.
Recovery rate and economic value of significant materials in NMC batteries (Wu et al., 2020; Shafique et al., 2022).
NMC: nickel manganese cobalt.
Economic assessment of EOL NMC batteries
The advantages of LIB batteries are their low cost, long lifespan, higher safety and stability for recovery (Yun et al., 2018). The recovery process helps recover the materials at the EOL for use in other applications. After retirement, EV batteries can still be utilized for energy storage in household applications. These batteries are recovered mostly in China and have a certain monetary value, as shown in Table 3 (Brückner et al., 2020; Wu et al., 2020). This study also assessed the economic value of the recoverable materials.
Results and discussion
Global sales of NMC batteries
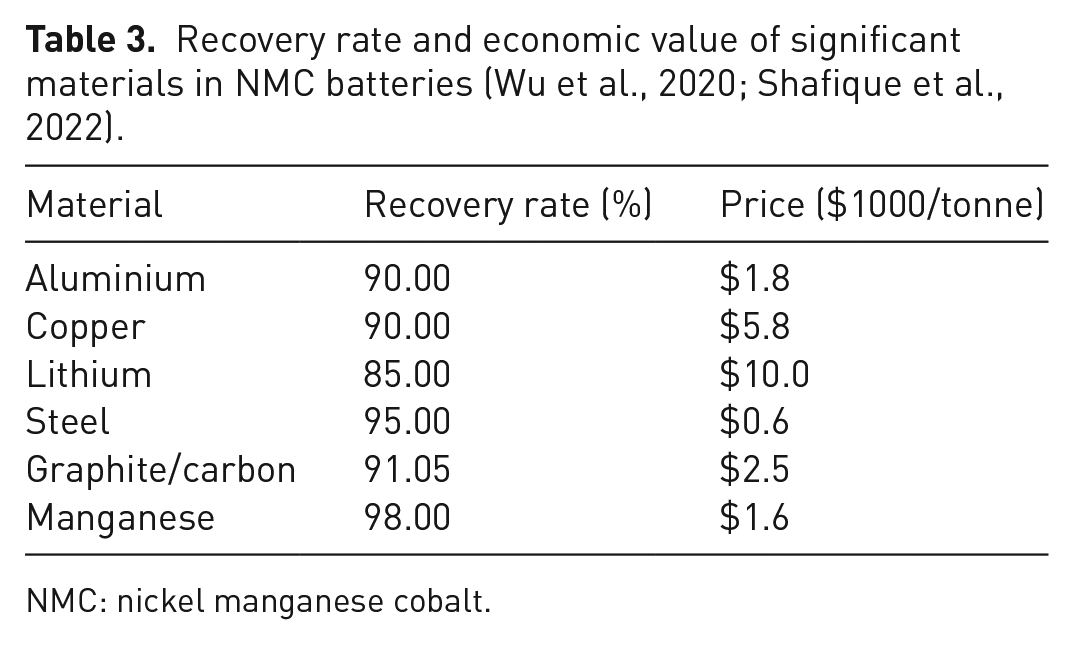
According to historical growth rates and future policies regarding EV adoption, global NMC battery sales from 2019 to 2030 are estimated and summarized in Supplemental Table S2. Sales are expected to increase from 1.53 million in 2019 to 15.05 million in 2030. After 2025, there was a higher increase until 2030. The full detail of NMC batteries each year is shown in Figure 4.
Global annual sales of NMC batteries from 2013 to 2030.
Spatial distribution of NMC battery materials
Two aspects are presented here. First, the annual in-use stocks of NMC battery materials (aluminium, copper, lithium, steel, graphite/carbon and manganese) for the top 10 countries. Second, the materials’ recycling potential and waste flow from 2010 to 2038.
In-use material stocks of NMC batteries
In-use stocks of the NMC materials in the top 10 countries and remaining parts of the world (denoted as others) are presented in Figure 5. The results indicate that stocks of NMC will continue to increase from 2010 to 2038 in all countries. This is because the NMC battery has shown an increasing trend in the past and is expected to increase until 2030. China is using the highest number of NMC batteries. The in-use stock of NMC battery materials is expected to increase significantly from 2010 to 2038. Moreover, China will have the highest material in-use stocks from 2020 to 2030, as shown in Figure 5. This is because China utilizes over 45% of total global NMC batteries, a trend that will continue in future years. On the other hand, South Korea and the US will have high NMC material in-use stocks in the coming years. When considering each NMC material stock, it is estimated that there will be an increasing trend in the coming years. For example, the results show that in 2030 there will be 563, 43 and 34 kt in-use stocks of aluminium in China, South Korea and the US, respectively. Manganese stocks will be 523, 40 and 31 kt, respectively. Graphite/carbon stocks will be 378, 29 and 23 kt. Copper stocks will be 320, 25 and 19 kt in-use stocks in China, South Korea and the US in 2030, respectively. Moreover, it is also estimated the upcoming steel in use stock will be 66, 5 and 4 kt in the top three countries such as China, South Korea and US in 2030, as shown in Figure 5. Finally, in the case of lithium, a critical material of LIBs, the results estimated that in 2030 there would be 33.1, 2.5 and 1.9 kt of in-use stocks in China, South Korea and the US, respectively. Regarding European in-use stocks, Figure 5 shows that in 2030 Norway will have the highest ones, with 24.5, 22.7, 16.4, 13.9, 2.9 and 1.4 kt of aluminium, manganese, graphite/carbon, copper, steel and lithium, respectively.
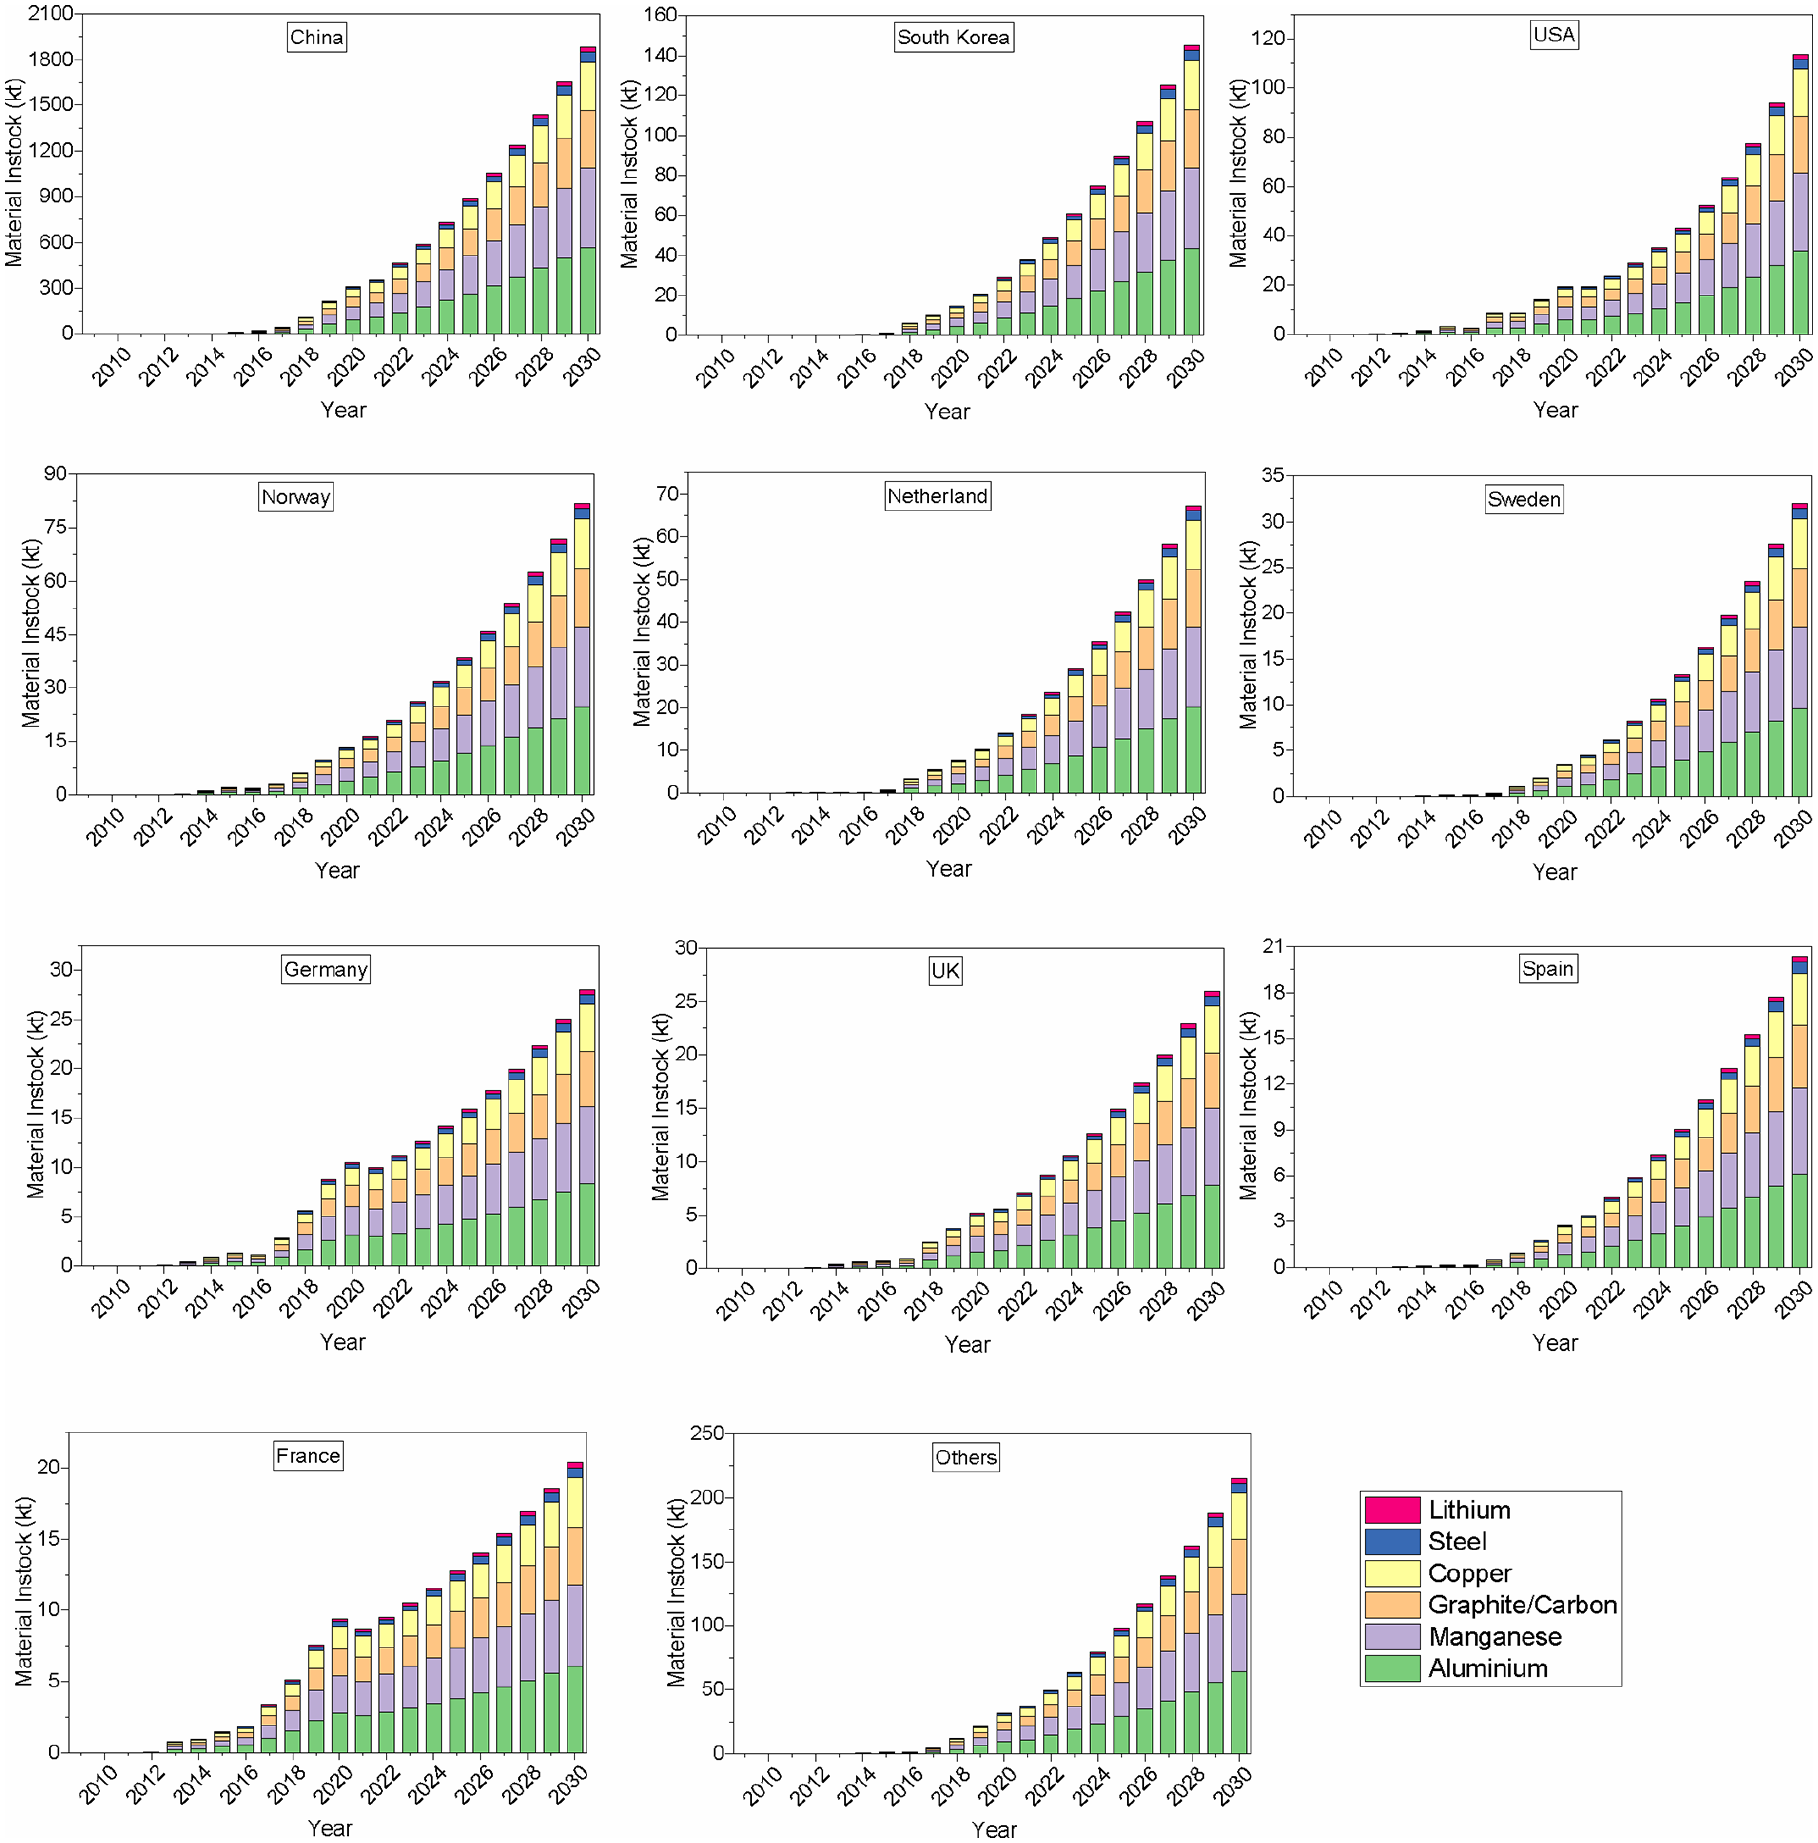
Annual in-use stocks of materials from NMC battery from 2009 to 2038.
Overall, the results estimate that Asian NMC battery material stocks will be much higher in the coming years as many Asian countries (i.e. China, Korea, Japan and Hong Kong) are showing an increase in the use of BEVs. As BEVs are estimated to increase in numbers worldwide, there will be higher NMC battery material in-use stocks. Therefore, attention should be paid to properly utilizing these stocks, preventing worldwide resource depletion.
Recycling potential and perspective waste of NMC batteries
In this part, the NMC materials available for recycling from 2010 to 2038 are summarized. Figure 6 shows the recycling potential for the top 10 countries, as well as for the selected NMC materials. For example, China will be the foremost country in terms of the number of BEVs; therefore, after the EOL of NMC batteries, a high proportion of NMC materials can be recovered each year from 2009 to 2038. These recovered materials could be used for other applications, thus reducing the demand for virgin materials. As shown in Figure 6, in 2038, there will be 174 kt of manganese, 172 kt of aluminium and 9.6 kt of lithium in China alone. Similarly, 9.3 kt of manganese, 9.2 kt of aluminium, 5.2 kt of copper and 1.1 kt of steel will be recycled in the US. Moreover, there will be 2.8 kt of manganese, 2.7 kt of aluminium and 0.3 kt of lithium in Germany. The NMC material recovery potential in the top 10 countries has been increasing every year since 2010 and will do so even faster from 2023 to 2038. This is because more NMC batteries will be sold, following an increase in demand for BEVs in the next 10 years. The higher recovery potential could help reduce the higher burden on available resources. With material recovery rates of 85–98%, the recovery potential could meet 50–60% of the inflow of new materials. Manganese has a higher recovery potential; this is because manganese’s recovery rate was 98% during the analysis. In contrast, lithium’s lower recovery rate of 85% could pose severe threats to the availability of this resource around the globe. Therefore, future research work should focus on a higher recovery rate for lithium with advanced technologies.
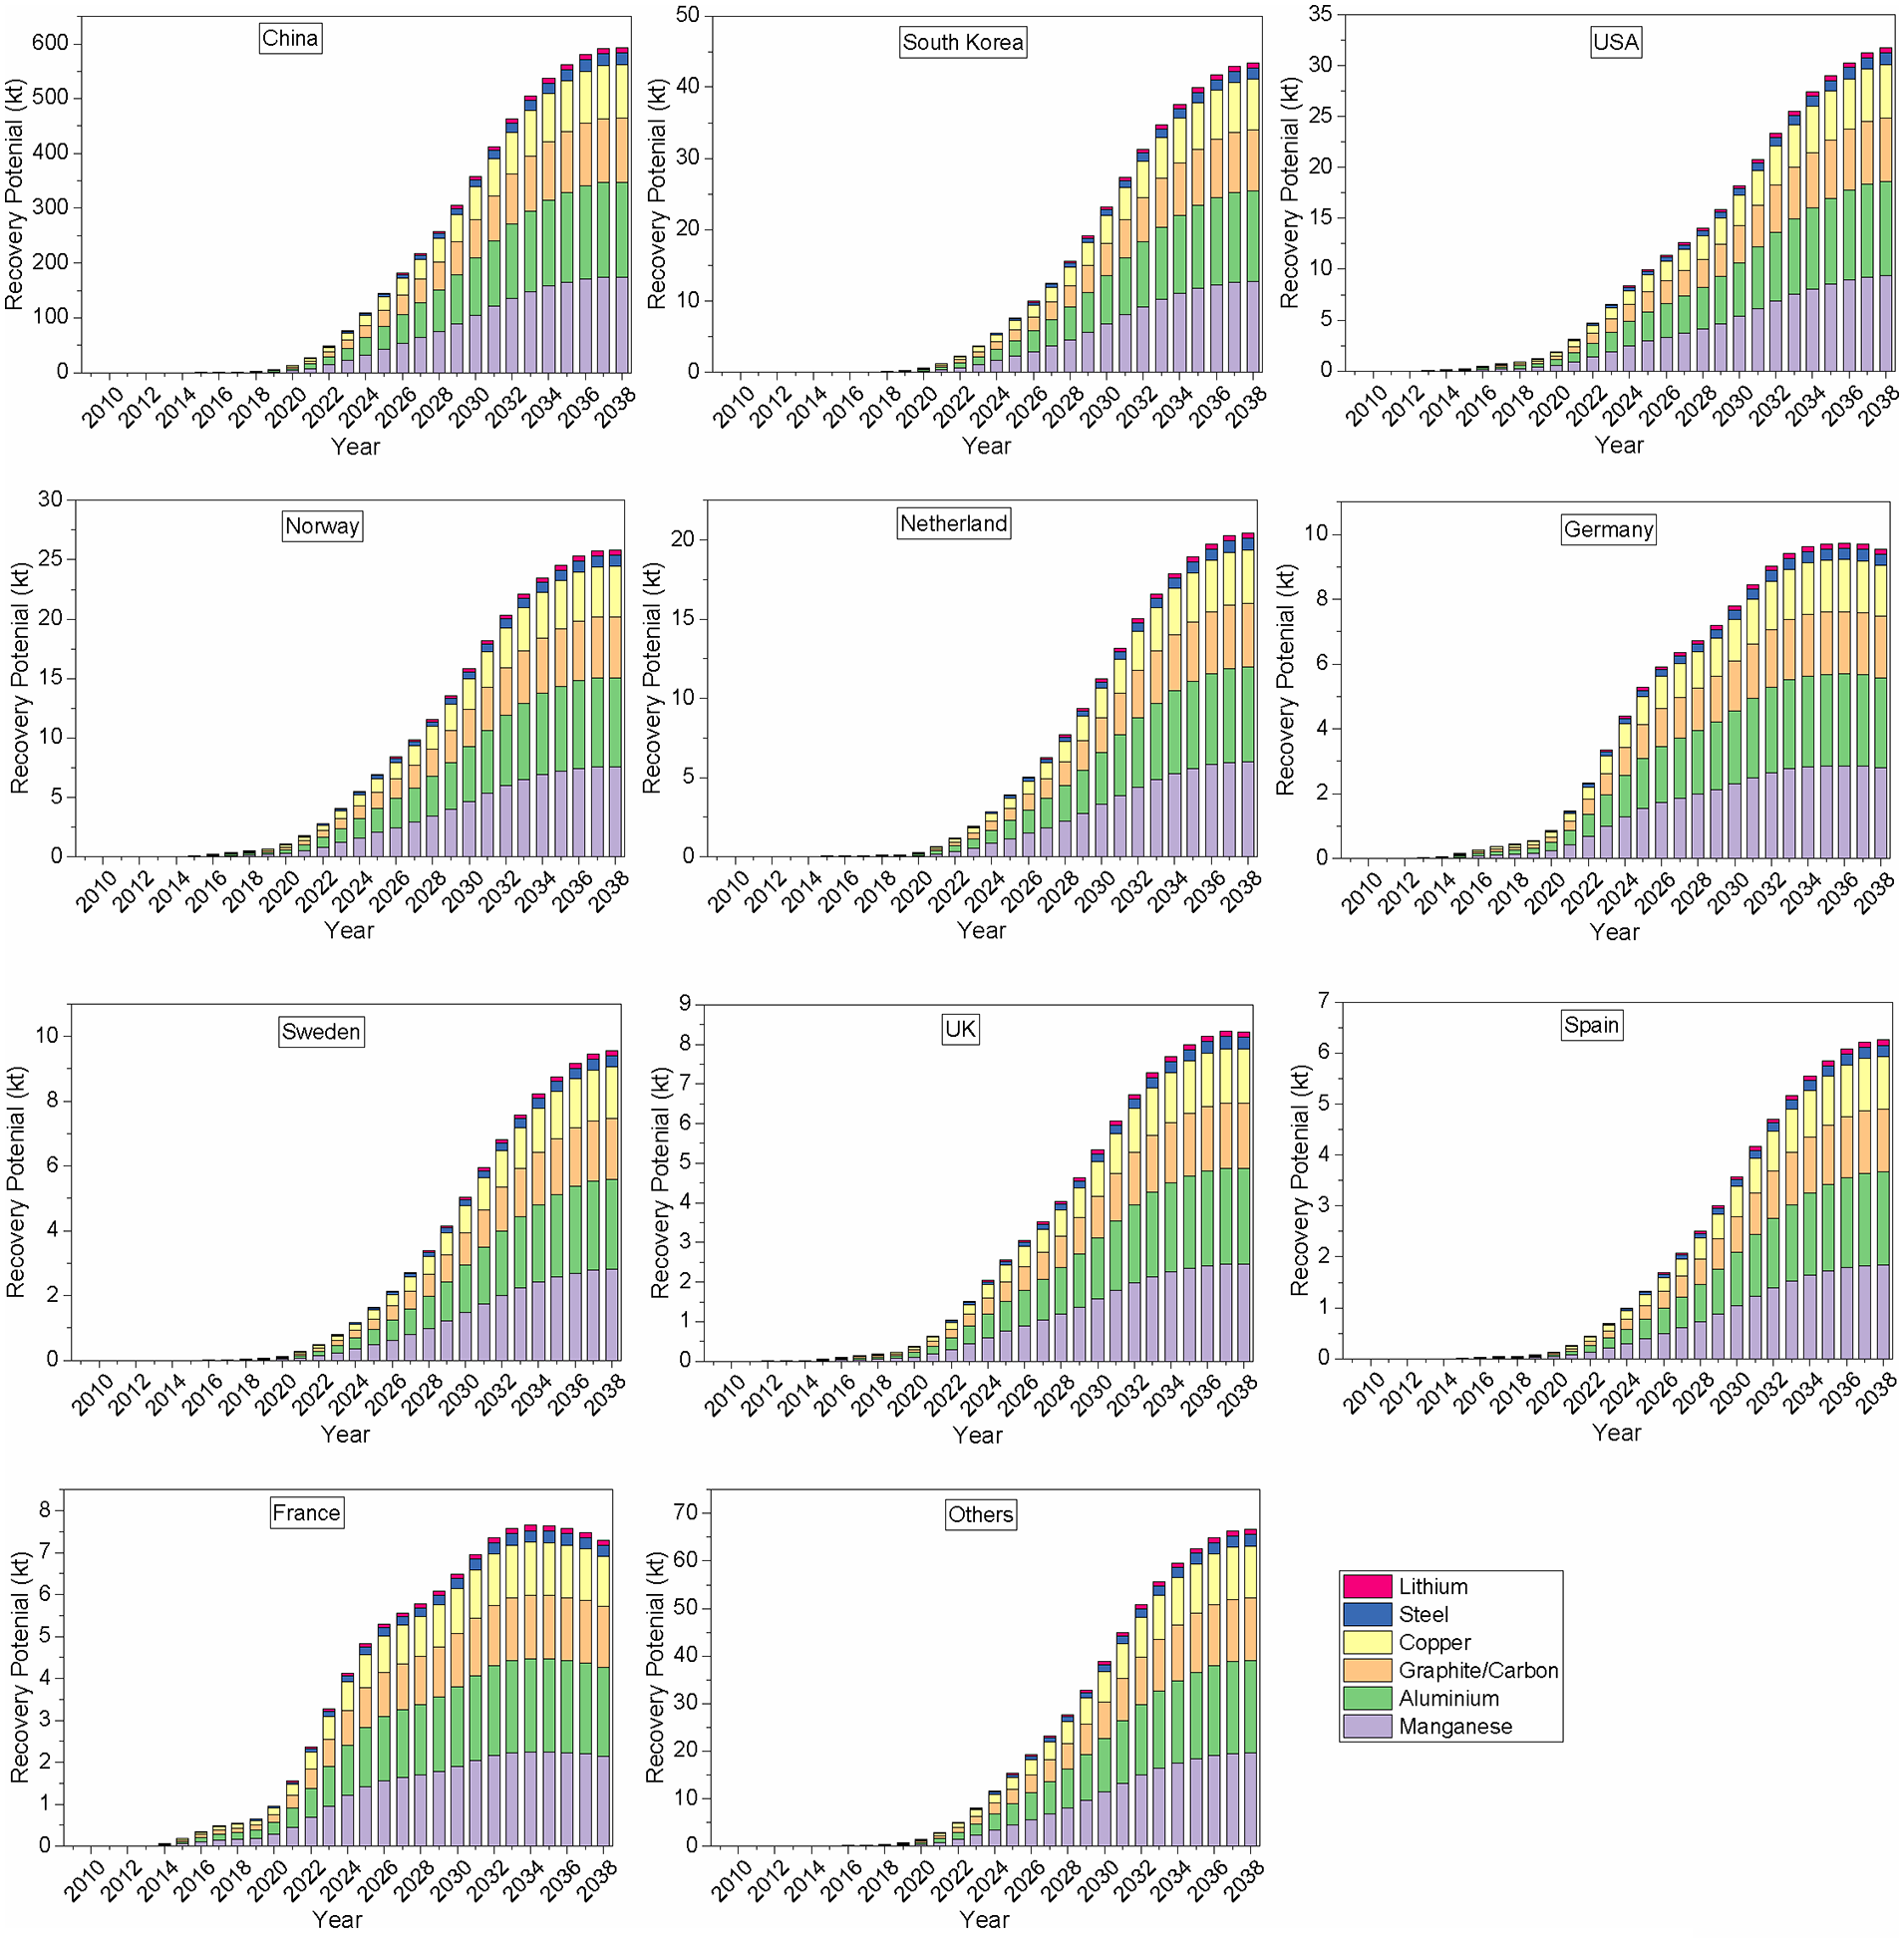
Annual recycling potential of NMC battery materials determined by dynamic Weibull distribution.
The amounts of NMC materials waste for the top 10 and the other countries are presented in Figure 7. The results show that in 2038 there will be 19.2, 1.4 and 1.0 kt of aluminium waste in China, South Korea and the US, respectively. The results also indicate that there will be 10.9, 1.4 and 7.9 kt of copper waste. Similarly, in 2038, there will be 1.7 kt of lithium waste available in China. The results show that higher NMC material waste will be generated in Asia and Europe by 2038. This is because our model estimated higher numbers of NMC batteries in Asia and Europe, resulting in a higher waste flow after EOL. Therefore, future research needs to explore ways to recover more materials from NMC batteries, thus eliminating the waste flow for landfills. This can reduce the adverse impact of lithium on humans and ecosystems.
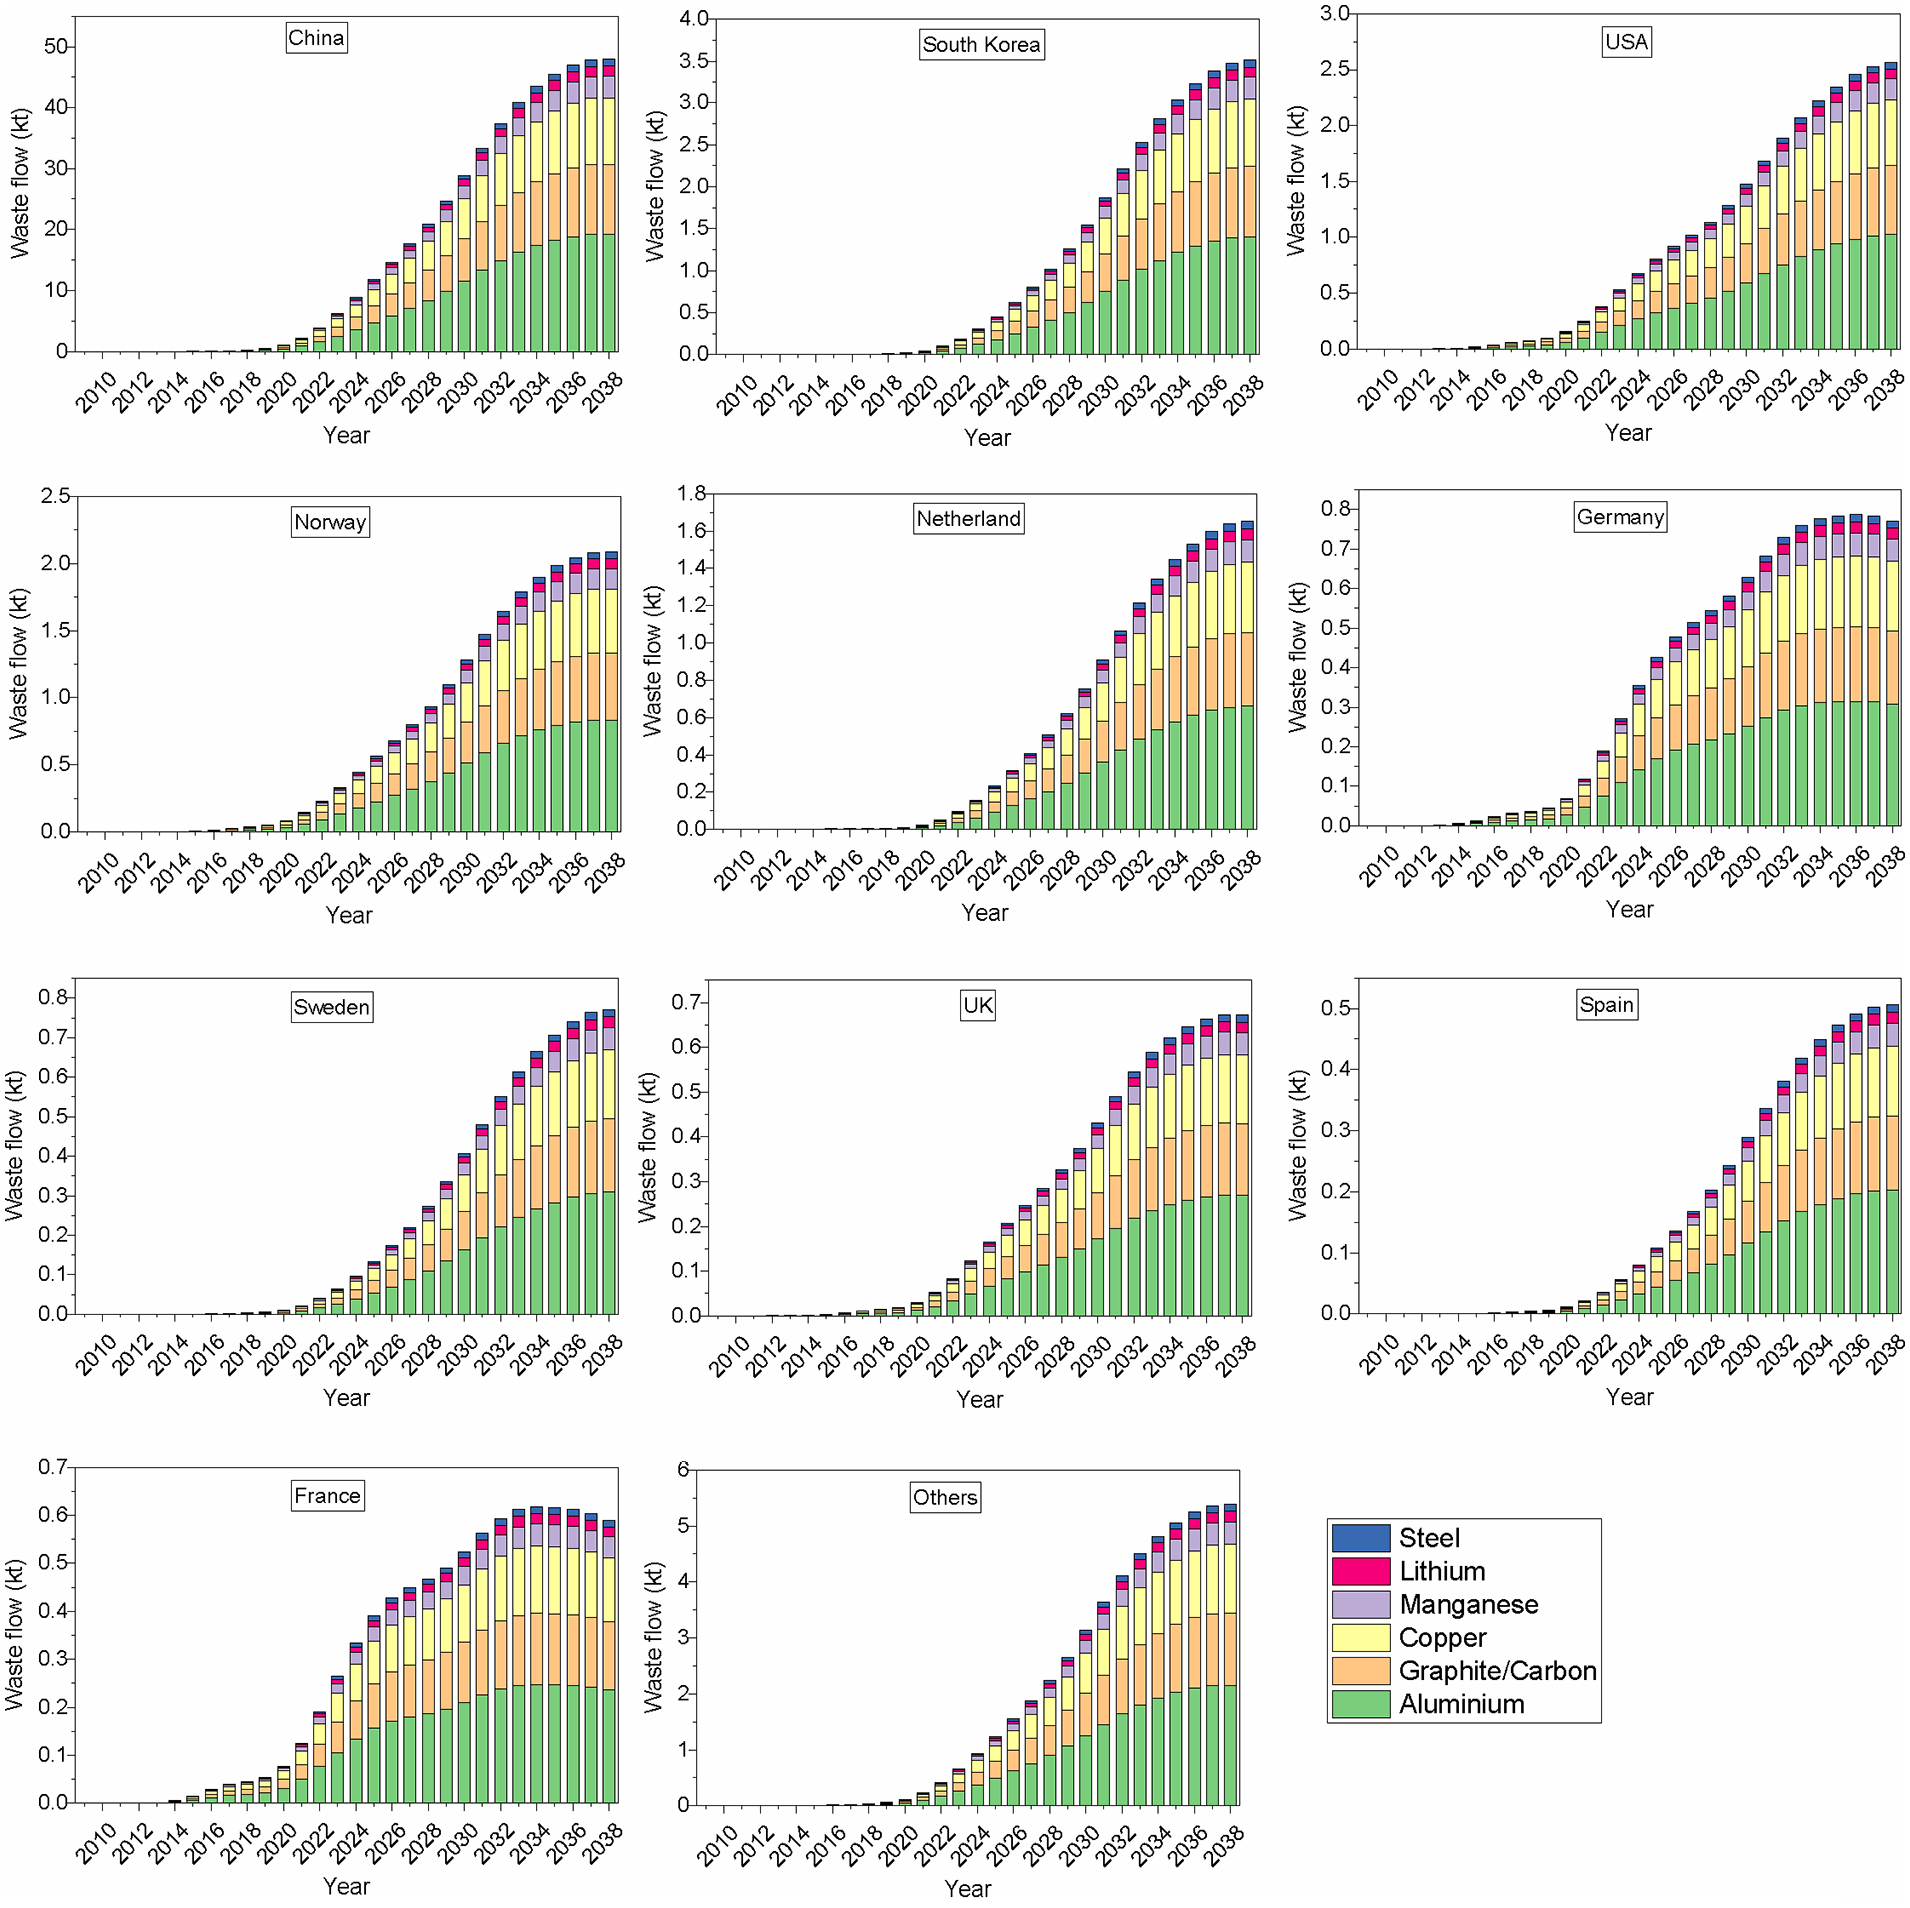
Annual waste flow potential of NMC battery materials from 2009 to 2038.
NMC battery materials flow
In this section, the figures for the global recovery and waste flow of each NMC material are summarized to describe the trends in the coming years.
Aluminium
Figure 8(a) shows the aluminium recycling potential and waste flow from NMC globally. The estimated recycling potential of aluminium increases from 0.9 tonnes in 2010 to 239 kt in 2038. Besides, the cumulative recycling potential of aluminium was estimated to be 2422 kt in 2038, providing a large supply for further use in multiple industries. There exists a sharp increase in materials recovery and waste flow after 2020; this is mainly due to the higher adoption of NMC batteries in the previous decade.
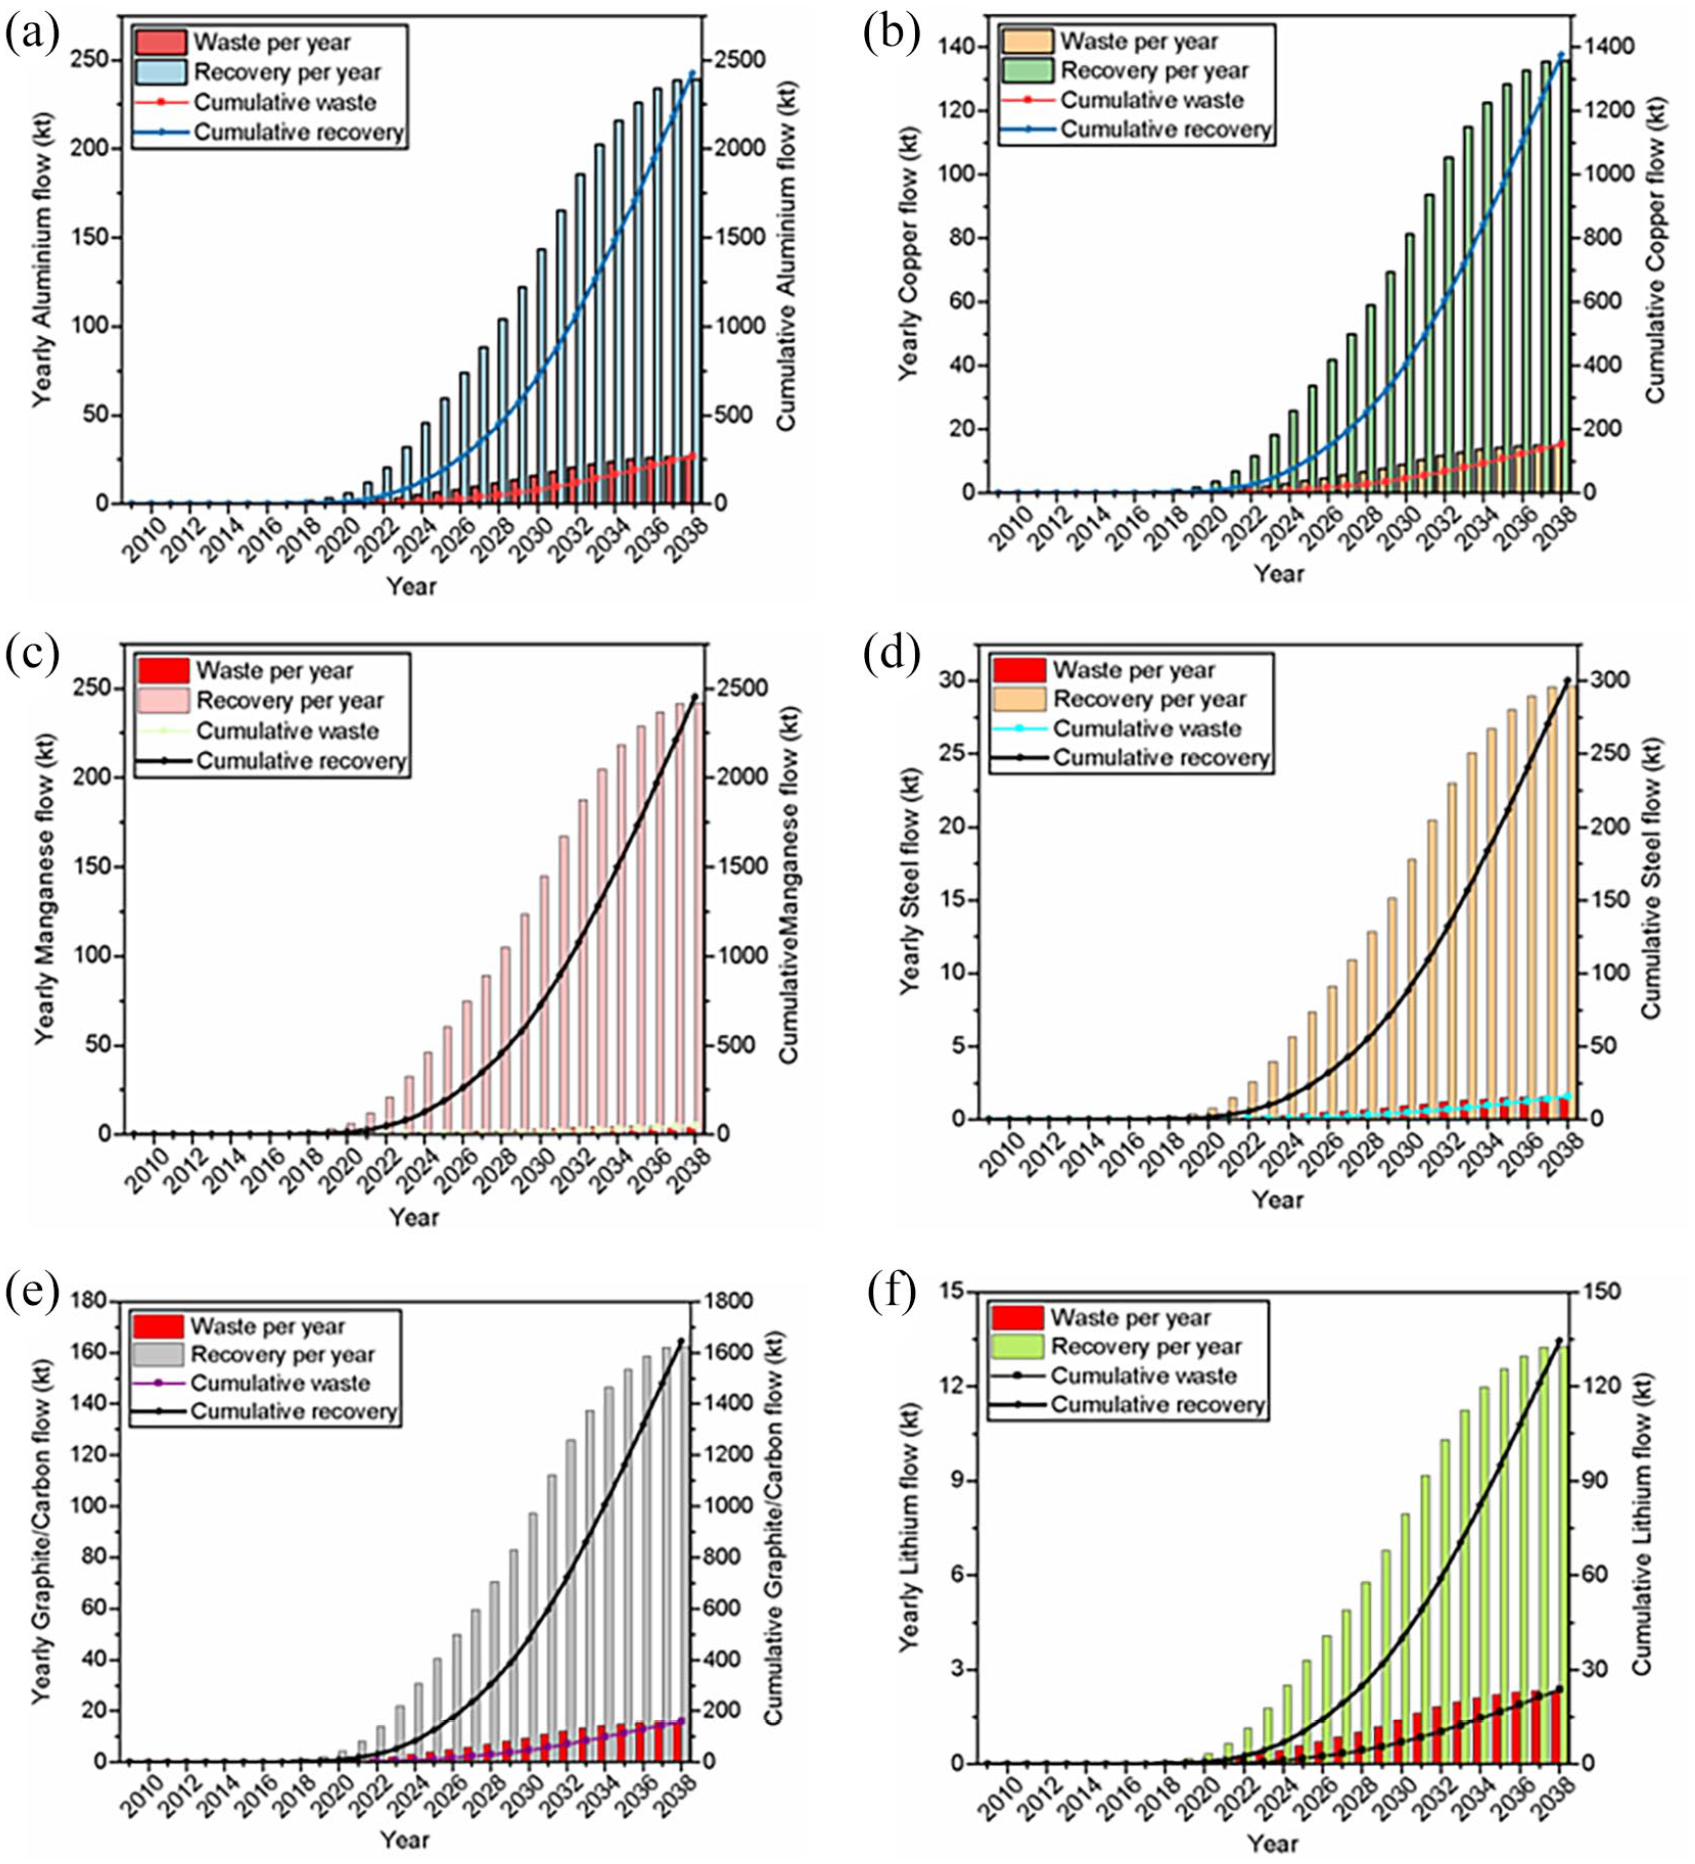
Recycling and waste flow potential estimation of NMC batteries: (a) aluminium, (b) copper, (c) manganese, (d) steel, (e) graphite/carbon and (f) lithium.
Copper
Figure 8(b) reveals that the copper recycling potential increases after 2020 and has a higher value in 2038. There will be 136 kt of copper available for recycling from NMC in 2038. Moreover, the cumulative amount of recycling copper will be 1374 kt in 2038. Similarly, the overall waste flow of copper will be higher (15 kt) in 2038 compared to 2020 (0.3 kt) because NMC batteries will be more widespread in the future.
Manganese
Figure 8(c) presents the recycling and waste flow analysis of manganese from NMC batteries from 2009 to 2038. Each year the quantity of manganese is higher because of a higher NMC battery adoption. As this study estimates that 98% of manganese will be recovered in the future, there will be very limited waste flow diverted towards landfills. This is an optimal scenario for resource management, where most of the material from the product is recycled. Figure 8(c) shows that cumulative recovered manganese will reach 2451 kt in 2038. In contrast, there will be only 50.2 kt of cumulative manganese waste.
Steel
Figure 8(d) shows the recycling and waste flow potential of steel from NMC batteries. It indicates an increasing trend of annual waste and recovery beginning in 2020. The total recovery for steel in 2038 will be 29.6 kt globally. The results also indicate a higher waste flow value each year from 2025 to 2038 because the share of NMC batteries in BEVs will be higher in the future. Moreover, the results manifest the cumulative value of recycling will be 300 kt in 2038, which means that the pressure on virgin steel could be reduced for the automotive industry, thus reducing the depletion of useful materials.
Graphite/carbon
The recovery and waste flow of graphite/carbon increases each year and maximizes the materials available for recycling in the coming years. Although graphite/carbon recovery is increasing, the future waste flow displays an increasing trend, as shown in Figure 8(e). The cumulative recovery of graphite/carbon will be 1643 kt in 2038. Our prediction indicates that there will be large stocks of NMC battery materials in the next decade that could sustain the demand for new NMC batteries worldwide.
Lithium
Figure 8(f) explores the recovery and waste flow potential of lithium from NMC batteries. It indicates that the recovery potential is significantly higher after 2030, when there will be more recovered lithium to meet the demand for new BEV batteries. The results show the cumulative recovery of lithium is 48, 94 and 134 kt in 2031, 2035 and 2038, respectively. There is also an increasing trend of waste flow from 2019 to 2038. In the near future, it is essential to reduce lithium waste (Winslow et al., 2018) and enhance recovery techniques so that the recovered lithium can be utilized in new NMC battery production, therefore reducing the demand for virgin lithium.
The economic value of recovered materials
Figure 9 displays the cumulative economic values of recovered materials from NMC batteries from 2009 to 2038. It shows a growing annual trend in the economic value of all the recovered materials. The cumulative economic value of copper increases from 0.04 billion US dollars in 2020 to 7.9 billion US dollars in 2038. Lithium, steel and aluminium will also have greater economic value in the future. Copper’s recycled economic value is higher than that of other materials, reaching 7.9 billion US dollars in 2038. Aluminium has the second highest recovery value, 4.4 billion US dollars, in 2038. Graphite/carbon has the third highest value, 4.1 billion US dollars. Similarly, manganese’s recovery value is approximated at around 3.9 billion US dollars in 2038, as shown in Figure 10. Steel and lithium will have the lowest cumulative economic value in 2038. In short, the recycling of these materials has enormous economic potential because NMC batteries contain metals with high recovery rates.
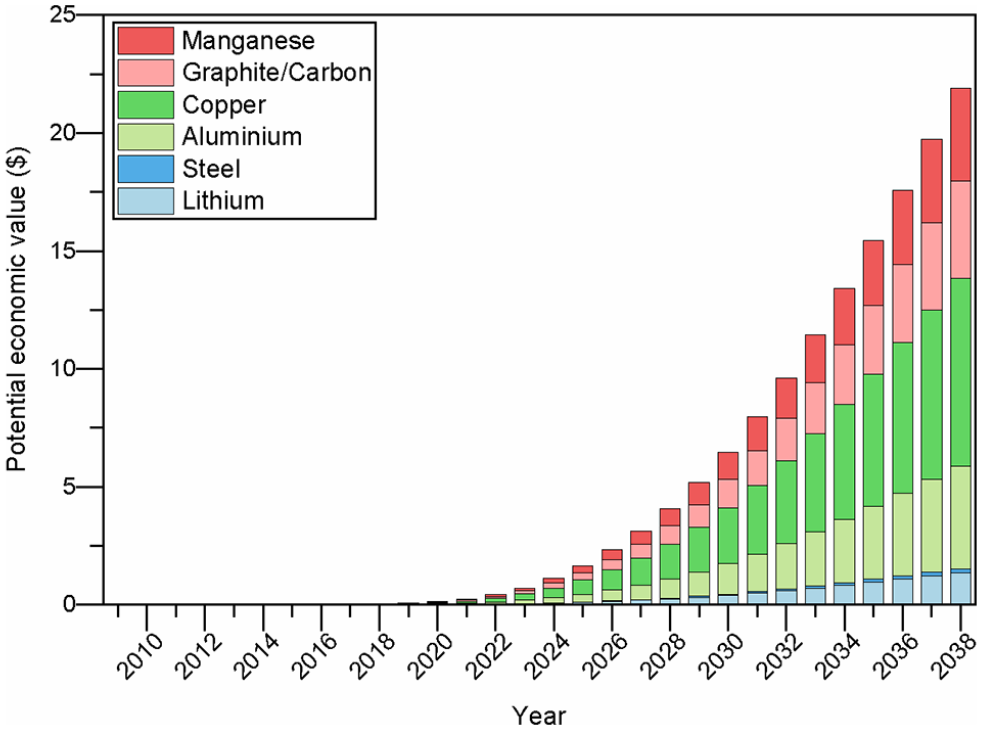
Annual cumulative economic value (in billion US dollars) of recovered materials from 2009 to 2038.
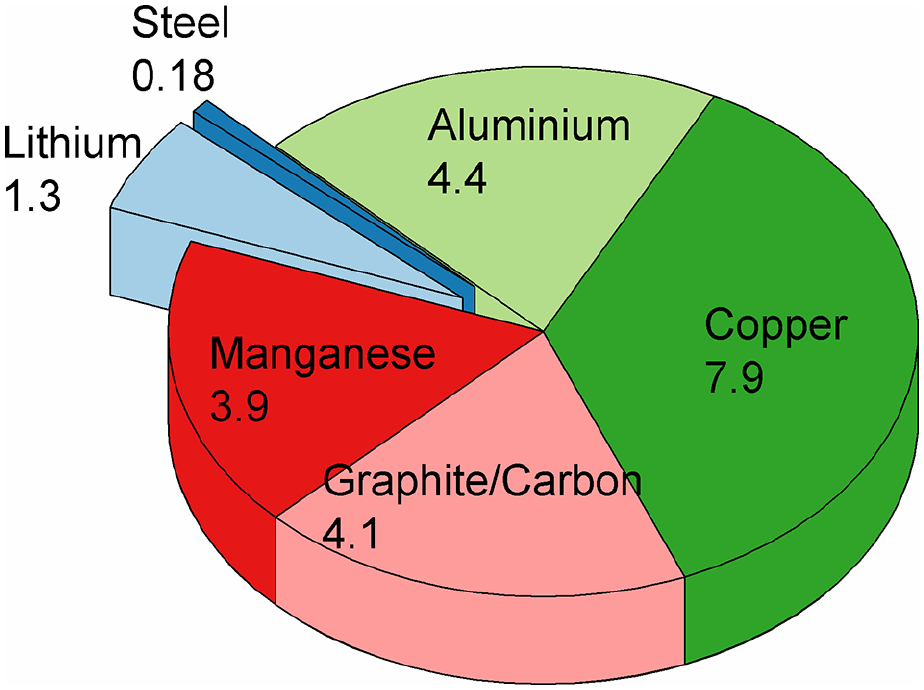
The cumulative economic value of NMC battery recovered materials in 2038 in billion US dollars.
Discussion
Given the uncertainties in the technological transformation of NMC batteries in the future, it is challenging to forecast their specific demand around the globe. This is because NMC batteries are becoming more efficient and can have a higher specific density. Moreover, the lack of information and data on future promotional policies in different countries leads to higher uncertainties in the analysis. In addition, the future development of other BEV batteries could affect the demand for NMC batteries. However, as this study utilizes historical sale trends and predicted future demand for NMC batteries, it will provide a big-picture forecast for the top 10 countries, including other countries. Multiple parameters, such as battery capacity, cathode type and material composition, are highly uncertain in the future (Simon et al., 2015). This is because countries are adopting BEVs to increase mileage rather than to reduce material intensities (Speirs et al., 2014). Moreover, policies to reduce vehicles’ carbon emissions, as well as higher crude oil prices, could lead to the significant development of NMC batteries in the future.
EV and battery service life vary over time (Ziemann et al., 2018). Battery lifespan is different depending on environmental conditions and technological advancements. The mismatch in the service lives of the EV and the battery could lead to significant impacts on future global material demands. In the present study, the average battery lifespan is assumed to be 5, 8, 10, 12 and 15 years. A shorter lifespan means more batteries are required before the EOL of EV. This could lead to higher material demands and stress on available reserves. However, some studies point out that battery lifespans are likely to increase in the coming years due to improved battery performance (Helbig et al., 2018; Richa et al., 2014).
Due to the rapid adoption of BEVs around the globe, EOL NMC batteries are estimated to rise significantly in the next decade. The recycling of batteries has thus become a competitive field for recycling companies (Richa et al., 2014). For Li, demand could outgrow current production capacities before 2025. For Ni and Al, the situation is less drastic; however, it could also be affected in future years. Therefore, among BEV materials, Ni and graphite are the most critical in terms of conservation for higher production in the future, which is confirmed by previous studies (Helbig et al., 2018; Olivetti et al., 2017; Simon et al., 2015). Many batteries have already entered their EOL stage, and our study anticipated the recovery potential for NMC batteries based on statically approach. However, in reality, the recycling of NMC batteries is still in its infancy and only a small proportion of the materials is recycled (Beaudet et al., 2020; Jacoby, 2019) because the required infrastructure is still lacking at the industrial level (Harper et al., 2019). Moreover, there is no standardized design for battery packs and cells of BEVs, making them complicated to disassemble, affecting recycling efficiency (Harper et al., 2019). Therefore, future research should focus on reducing the price of recycled materials so that it is lower than that of virgin materials. This effort should concentrate on recycling battery materials on a larger scale around the world.
According to our analysis, Li demand for BEV NMC batteries in 2030 (110 Kt) could be significantly lower than in previous studies (Deetman et al., 2018; Hao et al., 2019; Ziemann et al., 2018). The low minimum share of lithium is a result of considering only BEVs (excluding PHEVs and fuel cell vehicles). While Ziemann et al. (2018) performed a detailed analysis of NMC, NCA and LIB batteries, the present study expanded the scope with a basic economic analysis and the more comprehensive analysis of NMC batteries around the world. Material recycling and waste flow potentials of the top 10 countries, including other countries, were presented in a systematic way. To reduce the pressure on existing resources, when LIBs’ original storage capacity becomes lower than 80% of their original capacity, then batteries could be used for other applications (e.g. wind power and photovoltaic for household energy storage) (Ziemann et al., 2018). This approach could further extend lifespans by 5–10 years, and could reduce the use of virgin materials (Bobba et al., 2019; Heymans et al., 2014; Olivetti et al., 2017; Shafique et al., 2022). Our analysis illustrates that there will be an enormous number of EOL NMC if we could utilize second use as well as sophisticated techniques for the recovery of batteries in 2030. Therefore, this study suggests an optimal choice of EOL batteries in two ways, as shown in Figure 11: (1) NMC batteries could be repurposed and utilized for other energy storage applications; (2) NMC batteries could be recovered through sophisticated techniques and used in the production of new batteries, reducing the depletion of multiple materials.
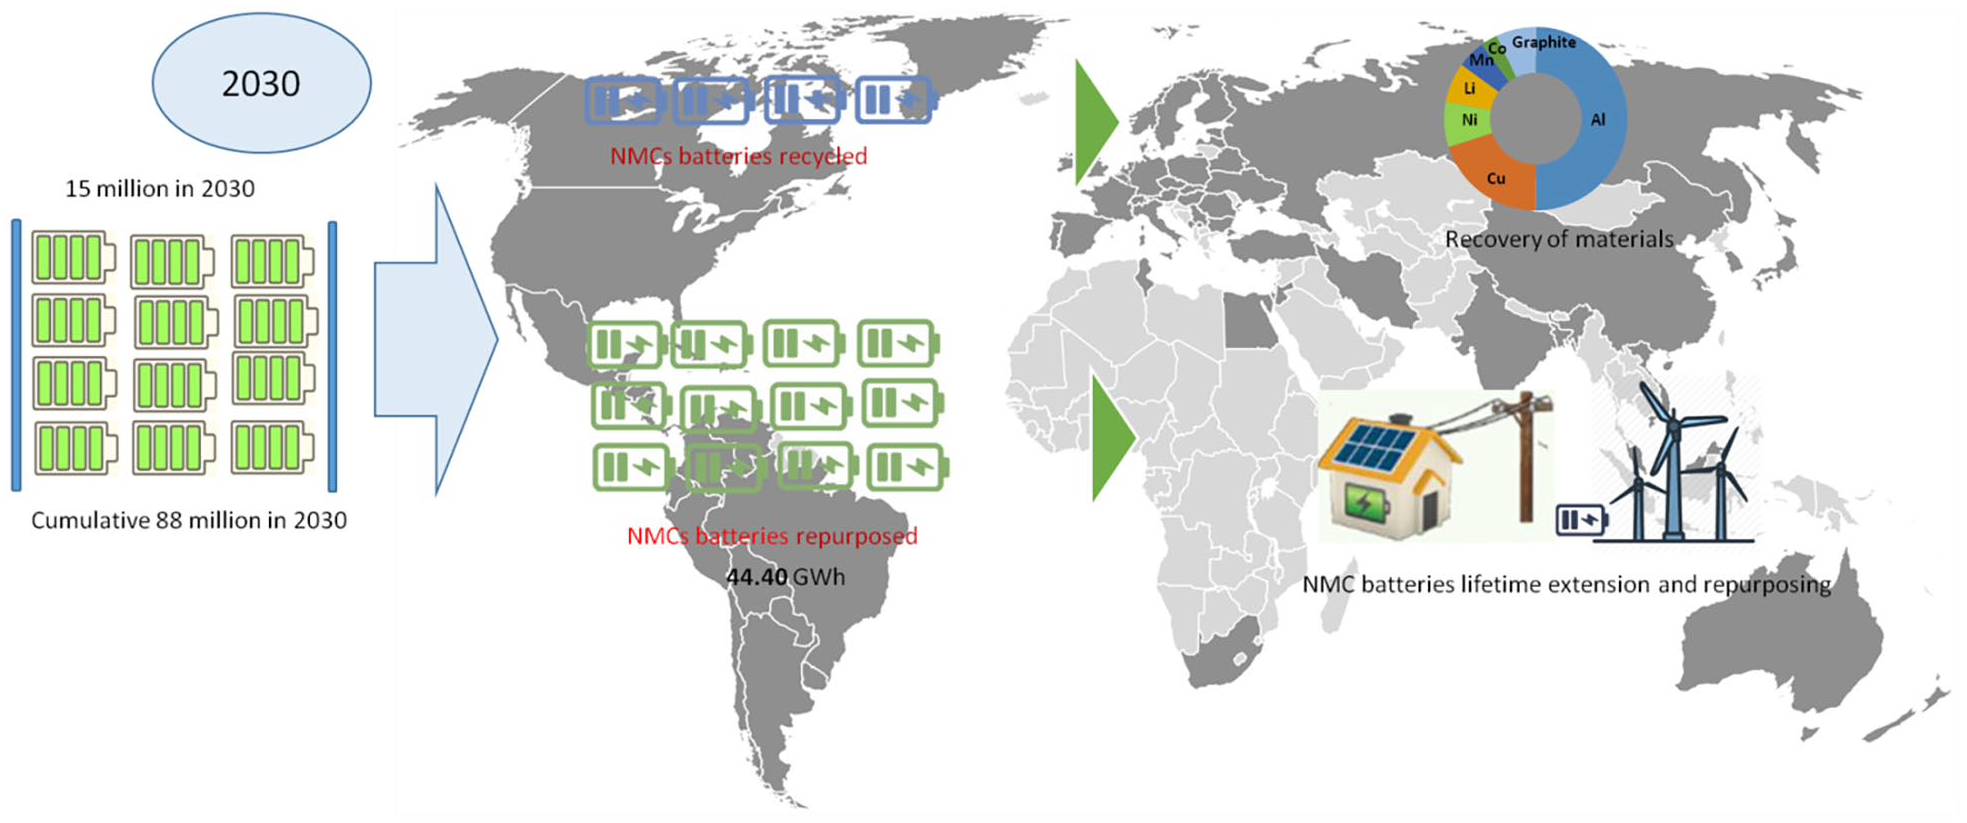
Schematic illustration of EOL NMC batteries in 2030.
Conclusion
A comprehensive assessment of EOL NMC batteries at the global level was conducted. As we considered the increase in specific energy caused by technological advancement, we believe the results are more accurate than those of existing studies. The generation of retired NMC batteries was anticipated from 2020 to 2038, including various material demands in the top 10 countries and other countries. The results manifested that there will be 15 million sales of NMC batteries in 2030 around the globe. The main findings are as follows:
Based on the estimation of NMC battery sales, China will become the top country in terms of sales. Moreover, China will be the top country with a high number of NMC batteries than all other countries in previous and future years. Our results also show that China will be the foremost country with the highest in-use stock of aluminium at 92 kt in 2020 and manganese at 563 kt in 2030. A similar pattern was found in the case of other recovered materials. South Korea and the US were the second and third countries in terms of the highest in-use stocks and recovered materials in coming years.
The results also indicated that in 2038 there would be 174 kt of manganese, 172 kt of aluminium and 9.6 kt of lithium recovered from NMC batteries in China. At the same time, 9.3 kt of manganese, 9.2 kt of aluminium, 5.2 kt of copper and 1.1 kt of steel will be recovered in the US. The results also show that there will be considerable amounts of waste from NMC batteries, which will require proper attention for the land filling to protect human health.
Based on the global NMC battery materials assessment, the outcomes estimate that in 2038 the cumulative recovery amounts of aluminium, manganese, graphite/carbon, copper, steel and lithium will be 2422, 2451, 1643, 1374, 300 and 134 kt, respectively.
Recovered copper and aluminium have estimated cumulative economic values of 7.9 and 4.4 billion US dollars in 2038. Graphite/carbon has the third highest economic recovery value of 4.1 billion US dollars in 2038.
The analysis of the future recovery and waste of NMC batteries can provide significant insight to countries to adopt the sustainable adopting policies to obtain the higher recovered materials, which future could mitigate battery material supply chain issues around the world. Despite the above contributions, there are some limitations to this study. First, we predicted the future sales of NMC batteries without considering the adoption of other types of batteries, such as lithium NCA oxide or LFP. Second, we used the same recovery rate and economic values for NMC materials for all countries, even though these could be different in different countries depending on the regional availability of materials. Third, this study used constant weight for future NMC batteries, while weight is an important aspect that could be explored in future studies. Fourth, this study did not repurpose NMC batteries to extend their lifespan for utilization in photovoltaic energy storage applications at the household level. Therefore, future studies could choose the optimal recovery rate for each country to optimize the recovery results of NMC battery.
Footnotes
Declaration of conflicting interests
The authors declared no potential conflicts of interest with respect to the research, authorship, and/or publication of this article.
Funding
The authors received no financial support for the research, authorship, and/or publication of this article.