
Abstract
This article investigates the recovery of typical wastes (coal slime, sawdust, cardboard and tire pyrolysis residue) as part of high-moisture slurry fuels. Using a laboratory furnace, the ignition and combustion characteristics of fuels as well as NO x and SO x emissions were determined. Using multiple-criteria decision-making (MCDM) methods and experimental results, we access the performance of four different slurry fuels in comparison with bituminous coal. The novelty of the study is based on the following features: we consider a unique set of parameters of the fuels (economic, environmental, safety and energy indicators), as well as three countries for their potential use (the USA, India and Russia); three different methods for calculating the efficiency indicator of each fuel were used. Despite rather low energy performance, the summarizing efficiency indicator of waste-based slurries was 53–93% higher than that of coal. The use of cardboard in the composition of a fuel blend showed the best complex result (the increase in the efficiency indicator was 80–93% relative to coal). The least promising additive was the pyrolysis residue of automobile tires. Its addition resulted in a 10–15% decrease in overall efficiency relative to a slurry without additives. The research results are useful for optimizing the component composition of waste-based slurries, technical and economic development of projects for the incineration of various wastes in the form of high-moisture fuel slurries.
Keywords
Introduction
Today, the problems of production and accumulation of industrial and domestic waste are among the most complex and large-scale. Numerous utilities, manufacturing enterprises of various profiles, as well as power plants that burn fossil fuels (in particular, pulverized coal), are the large sources of pollution. The rate of waste accumulation in many regions of the world significantly exceeds the technological and economic possibilities for waste processing. The scale and high risk of environmental pollution determine the need for the developing waste-to-energy technologies in different countries (Ninduangdee et al., 2020; Xiang et al., 2020). The current directions of these technologies are co-incineration, pyrolysis and gasification of various waste (Medina Jimenez et al., 2019; Zhao et al., 2015). In this work, the study object is high-moisture waste-derived fuel slurries. The considered direction of waste valorization is potentially effective and promising for a number of reasons (Mari et al., 2018; Nunes, 2020). The use of waste in the composition of multicomponent slurries opens up wider possibilities for reducing emissions (Jianzhong et al., 2014), stabilizing the ignition and combustion temperature, and increasing the completeness of fuel burnout. The results of several recent studies (Gaber et al., 2020; Jianzhong et al., 2014; Skoglund et al., 2016; Staroń et al., 2016), as well as the experience of using coal–water slurries (Hong et al., 2019; Wang et al., 2016), indicate that waste-based slurry fuels can be incinerated quite effectively in boilers with nozzles for fuel injection, in vortex combustion chambers, as well as grate and fluidized bed boilers. A variety of waste, including raw and wet materials can be the components for preparing fuel slurries, for example oil and coal sludge, used liquids and oils, sewage sludge, wood waste and biomass.
Low grade fuel slurries can be burned in boilers instead of coal. However, such a transition must be justified and supported by a large amount of scientific data, various calculations, and tests of different purposes and scale (Jianzhong et al., 2014; Miccio et al., 2021). To date, these issues have not been fully resolved. In addition to the need to obtain new experimental data, it is a relevant task to estimate the efficiency of mixtures of different component compositions. These assessments should include a wide range of characteristics. For new unconventional fuels, it is important to analyze a set of indicators (Sakri et al., 2021; Teixeira et al., 2014), such as cost, fire safety, emissions, ignition temperatures, ash content, heating value, etc.
Thus, the development and implementation of technologies for the incineration and thermochemical conversion of waste and nonconventional fuels require consideration of a large number of indicators, including technological, economic and environmental characteristics. In many cases, these characteristics can be contradictory, competing, and have different priority and units of measurement (Mehta and Mehta, 2020). That is when multiple-criteria decision-making (MCDM) comes in handy (Perez-Gallardo et al., 2018; Pires and Martinho, 2019). Multiple-criteria analysis is quite versatile and works with different application areas. Previously, MCDM methods were successfully applied in the power industry to assess biodiesel fuels (Erdoğan et al., 2019), various power plants and energy sources (Coronado et al., 2021; Li et al., 2020), etc.
MCDM analysis can help compare traditional bituminous coal and new nonconventional multicomponent fuels in terms of a set of indicators of different nature. The present work aims to perform such a comparison for high-moisture slurries based on coal waste with additives from solid wastes of various origins.
The purpose of the present work is to perform a comprehensive MCDM analysis of the efficiency of slurry fuels containing typical industrial and municipal waste, as well as to determine the most promising fuel compositions for different countries. We have singled out India, the USA and Russia as examples of large countries in need of effective waste recovery and capable to arrange it. The countries considered in this work are among the six leaders in coal mining (Coal, 2020; Key World Energy Statistics (Statistics report), 2020). Most of the coal is processed at coal washing plants. Considering the known volumes of coal production, at least 15 million tons of coal-processing wastes are generated annually in each of these countries. Therefore, we can confidently say that the potential for using coal slime is quite high.
The present study is original since, until now, fuels containing coal slime and municipal solid waste have not been analyzed using complex efficiency indicators based on important economic, technological and environmental criteria. The calculations are based on our own experimental findings on the combustion of fuels of different compositions. We used three different methods for calculating the performance indicators. Another unique feature of the research is that the calculation was carried out for three countries (India, USA and Russia) to factor in the possible country-specific priorities in terms of waste-derived fuels. The obtained results can be helpful as a rationale for the informed use of waste-based slurries in thermal power engineering, knowing their advantages and disadvantages. The approach proposed in this paper can become an important tool for developing waste-to-energy technologies and finding an acceptable solution to the environmental, economic, social and energy-related problems in many countries.
Materials and methods
Figure 1 illustrates the main concept and stages of the work. The study included two large parts – the experimental determination of the ignition and combustion characteristics and the multi-criteria analysis of the fuel slurries. The detailed explanations on the implementation of the main and intermediate stages of the study are given in Sections ‘Components. Preparation and composition of fuels’, ‘Set of criteria’ and ‘MCDM methods and determining weight coefficients’.
Flow chart of research methodology.
Components. Preparation and composition of fuels
We compared several fuel mixtures based on coal-processing wastes against coal dust. The following fuels were studied (the indexes of fuels are valid throughout the paper):
(1) 100% filter cake (wet);
(2) 15% coal slime (dry), 25% filter cake (dry), 10% sawdust, 50% water;
(3) 15% coal slime (dry), 25% filter cake (dry), 10% tire pyrolysis residue, 50% water;
(4) 90% filter cake (wet), 10% cardboard;
(5) 100% bituminous coal.
The technologies of fuel slurries make it possible to use the components of various qualities for combustion: high-moisture components (e.g. vegetable waste, sewage sludge (Zhao et al., 2015)), pyrolysis and waste oils (Kuan et al., 2020), coal and oil sludge.
In this study, we used coal waste (filter cake and coal slime) as the basis for the preparation of fuel slurries. This waste is generated at coal preparation plants during the flotation of fine raw coal. During this process, raw coal is washed with water and special reagents, and then purified coal is separated using filters. Flotation waste is a mixture of water, coal, mineral particles and surfactants. The average particle size in a filter cake is 80–110 µm, while coal slime is based on finer particles (less than 80 µm). Wastes used in this work were obtained from the Severnaya coal preparation plant located in the Kemerovo region (Russia).
Cardboard, rubber tire pyrolysis product and sawdust were additional components of the investigated fuel blends. These wastes are very common in the municipal and industrial sectors, requires disposal, and can be used as components of slurry fuel to improve its performance (e.g. reduce the ignition delay time and increase the heating value). The sawdust was obtained from a wood-processing factory after mechanical processing of pine wood. The solid residue of car tire pyrolysis was obtained from a rubber recycling company. The main properties and elemental composition of the components are presented in Table 1. The components have been tested using standard procedures (ASTM D5373-21; ISO 1928:2009; ISO 11722:1999; ISO 1171:2010) and certified equipment. In particular, the calorific value was determined using an IKA C 2000 calorimeter, and elemental analysis was carried out in a vario MICRO cube Elementar (Vershinina et al., 2022). The principles and methods of analysis corresponded to the standard approaches for solid fuels (Ashraf et al., 2021; Farooq et al., 2021).
Properties of components.
Wa: moisture content of an analytical sample; Ad: ash content of a dry sample; Vd: volatile content of a dry sample; Q: high heating value; FC: fixed carbon.
Tap water was used to prepare the slurries. In general, the preparation of fuel slurries can be carried out using both tap and process water, as well as waste liquids (Jianzhong et al., 2014). The effect of water properties on fuel slurry performance is a special issue. Since the objectives of the study did not include this question, the choice of tap water was determined by its availability. All solid components (excluding filter cake and coal slime) were ground in a high-speed rotor mill (rotor speed 6000–20,000 rpm) before fuel preparation. The crushed components were sieved to extract a fraction with a particle size of no more than 100 μm. The components were weighed on an analytical balance (Vibra AF 225DRCE with a resolution of 10−6 g). In accordance with the required mass fractions, the components were mixed using a Polytron 2500e submersible homogenizer (rotation speed of 1500 rpm) for 15 minutes.
Set of criteria
Fuel efficiency can be evaluated in terms of several indicators characterizing the use of fuel for the required purpose in specific condition. In this study, we consider several criteria divided into groups: economic, environmental, energy and safety indicators.
The set of economic indicators accounts for the cost and availability of fuel components. The specific cost (C) of fuel, its availability (A) and transportation cost (CTR) were considered in the calculations. The availability criterion (A) shows whether there is a sufficient stock of fuel components in a specific region. Transportation costs (CTR) reflect the total cost of delivery of fuel components.
Energy indicators reflect the ignition and combustion behaviour of fuel. The gas-phase ignition delay time (τd1) shows how much time it takes for the fuel vapors to ignite. Heterogeneous ignition delay time (τd2) indicates how much time it takes to initiate the combustion of coke residue. The minimum ignition temperature (Tgmin) also indicates the necessary conditions for the stable ignition of the fuel, including the need for additional fuel during the boiler start-up phase. The maximum combustion temperature (Tdmax) shows the highest temperature of the fuel coke residue during combustion. The combustion time (τb) is the time during which a certain amount of fuel (e.g. a droplet or particle) is burned out. In this study, we used the values of τb, τd1, τd2, Tdmax and Tgmin obtained experimentally by burning single droplets of slurries with an average size of about 2 mm in a laboratory furnace. The details on the experimental methods, setups, data processing and measurement accuracy are presented in (Glushkov et al., 2018; Vershinina et al., 2016). An important criterion for evaluating fuel efficiency is the heating value (Q). The total heating value of a fuel blend can be derived from the heating values of each component. In this work, the higher heating value of dry components was measured by an IKA C 2000 calorimeter under normal conditions in accordance with the ISO standards (ASTM D240-19 (2000); ISO 1928:2009 (n.d.)). The amount of noncombustible residue produced from the fuel combustion can be evaluated using the ash content criterion (Ash).
In this paper, safety indicators include three components: the fuel fire safety criterion (P), the ease of storage and transportation (Bkt) of fuel components and the criterion of dusting (D), which characterizes the release of particles during storage and transportation. These parameters allow to consider any fuel from the point of view of its safe and convenient use at a thermal power plant or boiler house. The fuel fire safety criterion (P) is a calculated parameter. It provides information on fuel behaviour when exposed to a high temperature. To calculate the values of fuel fire safety, we used equation (1), in which each of the multipliers was normalized:
A fire-safe fuel has the highest ignition temperatures and the maximum gas-phase ignition delay time. The Tdmax factor was normalized in such a way that the minimum of the absolute values was taken as 1. Tgmin, based on fire safety requirements, was normalized differently – the maximum absolute value after normalization corresponded to 1. τd1 was normalized in a similar way as Tgmin. The maximum gas-phase ignition delay time of the fuel mixture was taken as 1. Considering the fire hazard factor is important for new atypical waste-derived fuels. As can be seen from equation (1), this indicator includes several values that characterize how fast combustion can develop and how high temperatures during combustion can be. The normalization of these parameters is necessary for the convenience of comparing different fuels, as well as for subsequent consideration in MCDM calculations.
The environmental indicators evaluate the impact of specific fuel types on the environment during storage, transportation and combustion. When analyzing the anthropogenic emissions, we considered sulfur oxides (SO x ) and nitrogen oxides (NO x ). The emissions were measured using similar methods and experimental procedures to those used in the study of Dorokhov et al. (2021). The waste recovery criterion (SR) reflects the potential of a particular fuel composition in terms of waste recovery. For example this criterion will be lower for bituminous coal than for a fuel blend with added waste. Also, we consider the criterion (SE) that reflects the prospects for reducing the area contaminated when using a particular fuel.
In experiments on combustion and emissions, components of the same origin were used since we had access to them. Different countries were taken to simulate the use of waste-derived fuel slurries under different conditions. This approach was an important part of the research because it allowed different conditions to be modeled to calculate the efficiency indicator of fuel slurries. In particular, cost, availability, as well as the priorities of certain aspects of fuel use differ for different countries. It is also important that the components used are typical for all three countries (domestic waste and coal slime). That is the composition of fuel slurries can be reproduced in different regions where there are coal preparation plants, the municipal sector and wood processing.
MCDM methods and determining weight coefficients
In this research, we use WSM (weighted sum method), WPM (weighted product method) and AHP (analytical hierarchy process) for the analysis as being suitable (Kumar et al., 2017) for the investigated issue with the available set of initial data. To date, there are a fairly large number of different MCDM methods. About 15 basic methods and several dozen of their variations are actively used (Kumar et al., 2017; Sousa et al., 2021; Vlachokostas et al., 2021). This set of methods does not contain a general model. However, despite the diversity, most of the methods are related in their goals and calculation principle.
Thus, the researcher is faced with the task of choosing an appropriate technique. In this work, we relied on previous experience of MCDM analysis in the field of energy and related studies. According to the works (Kumar et al., 2017; Vlachokostas et al., 2021), WSM, WPM and AHP are among the most commonly used methods. A review of the strengths and weaknesses (Kumar et al., 2017) of these techniques, as well as their application areas, allowed us to conclude that they are well applicable to the problem under study (in particular, in terms of computational complexity, available initial information, its quantity and nature). Also, WSM and WPM contrast with the AHP method in terms of the principle of setting weighting coefficients. This was one of the reasons for the choice since it allowed to demonstrate possible differences between the methods of analysis.
WSM is based on assigning a weight to an indicator (factor) that affects the result (Wimmler et al., 2015). Although fuel efficiency indicators have different units of measurement, this method can be used if each criterion is normalized to a reference case. The values of normalized criteria vary from 0 to 1. The sum of all the weights equals 1. The weights can be derived from consumer requirements, expert opinions, or other conditions. After assigning all the weight coefficients, each alternative is characterized by the weighted sum of criteria given by equation (2):
where wi is the weight coefficient for each criterion; xi is the normalized value of criterion; i is the serial number of the criterion and the weight coefficient; n is the number of criteria.
The higher the value, the more effective the alternative is in terms of the chosen set of criteria and priorities.
WPM is similar to WSM. The main difference is that in the first case, it is necessary to find the product of all the criteria raised to the power of weight coefficients. In the second case, the criteria are multiplied by their weights and the resulting values are summed. The WPM involves assigning weights to each criterion and normalizing it. The summarizing efficiency indicator according to the WPM is given by equation (3):
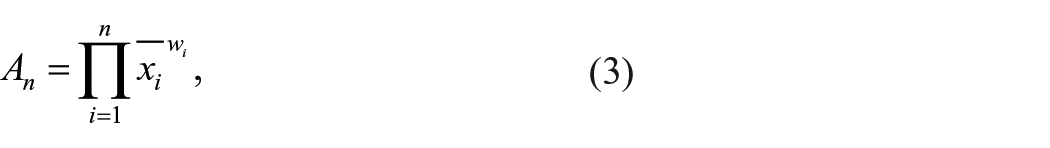
where wi is the weight coefficient for each criterion; xi is the normalized value of criterion; i is the serial number of the criterion and the weight coefficient; n is the number of criteria.
AHP is a more complex method since it does not involve the direct selection of weight coefficients, but their sequential calculation using a hierarchy of criteria (Abdallah et al., 2020). The most important element of the hierarchy is placed at level zero (goal). We used the option in which the cost of fuel is at level zero. This is mainly because the fuel purchase accounts for least 70% of all costs of a typical coal-fired power plant (Nalbandian-Sugden, 2016). The next level of the hierarchy (level 1), contains the categories of criteria chosen depending on priorities. We considered the following categories: environment, energy, industrial safety and economy. The second level of the hierarchy includes specific characteristics for assessment such as NO x and SO x emissions, ignition delay times, fire safety, fuel cost, etc. At the first calculation stage, it is necessary to evaluate each alternative in terms of each criterion. For that, the numerical values of criteria are normalized so that their sum was equal to 1. Then the weights are determined by a sequential pairwise comparison of the criteria using a special table. The cells of this table contain fractional values that reflect the importance ratio of the two compared criteria. Then the sum of values in each row is calculated as well as the sum of all the values in the table. At the next stage, we normalize the sums of rows so that their value was equal to 1. The normalized sum is given by equation (4):

where
Using equation (2), we calculate the weighted sum of criteria. The last stage involves the analysis of the efficiency/cost ratio. For that, it is necessary to divide the weighted sum of criteria of each alternative An by its normalized cost. The best alternative is the one with the highest efficiency/cost ratio. In our case, the method is used to determine the efficiency of composite fuels as compared to coal.
In this study, we considered three different regions of the world – the United States, India and Russia. The capacity of waste-to-energy technologies in these countries is relatively low, although this route is extremely promising. The selected countries have some of the highest rates of mining (including coal) and energy consumption in the world (Coal, 2020; Key World Energy Statistics (Statistics report), 2020). When assigning the weights (Supplemental Table S1), we accounted for the individual aspects of each country.
By singling out the set of economic indicators, we found that each of the countries has very different conditions and priorities in terms of cost, availability and transportation expenses. For instance, in Russia, the cost of fuel components may be leveled out by transportation expenses, and the availability indicators may be low due to the vast territory and long distances between large cities in the country. For the United States, reducing the cost of fuel and transportation can also be a priority since the fossil fuel deposits are often significantly remote. In India, the problem of fuel delivery is less pronounced and a higher priority can be given to the component composition of the fuel. Here we assigned equal weights to different criteria in the set of energy indicators because it is only advisable to prioritize individual indicators when considering a specific boiler and auxiliary equipment. The weights in the set of environmental indicators were assigned based on the information about environmental pollution, as well as the current regulations in the countries. In Russia and India, rather vast territories are designated for waste storage (coal slime, municipal solid waste, etc.). Therefore, the high priority for these countries is waste recovery and reduction of polluted areas by recycling the waste that has already been accumulated. The USA places more emphasis on keeping the emissions within environmentally safe limits. This does not make the recovery of polluted territories and recovery of accumulated wastes any less significant, but the top priority is on the environmental protection against anthropogenic pollutants. Control of atmospheric emissions is also of high importance for other countries, especially India.
Results of MCDM analysis for evaluating the efficiency of waste-derived fuels
Fuel efficiency evaluated by WSM and WPM
In the experiments, the temperature in the furnace varied in the range of 700–900 °C. It was found that such characteristics as ignition delay time, combustion time, emissions of sulfur and nitrogen oxides are rather strongly dependent on the temperature in the furnace. Therefore, for subsequent calculations via MCDM methods, three independent cases were considered – when the temperature in the furnace is 700, 800 and 900 °C. Table 2 lists the experimental values of fuel characteristics as well as fuel cost. Ignition delay times decreased with increasing furnace temperature and emissions of sulfur and nitrogen oxides increased. The combustion time of a slurry droplet depended nonlinearly on the temperature in the furnace, and this dependence was different for the slurries of different compositions. The result is because low-grade fuels tend to burn out incompletely (due to low reaction speed, insufficient heat release during combustion) and therefore an increase in temperature contributes to more complete combustion, and values of τb may increase.
Fuel characteristics.
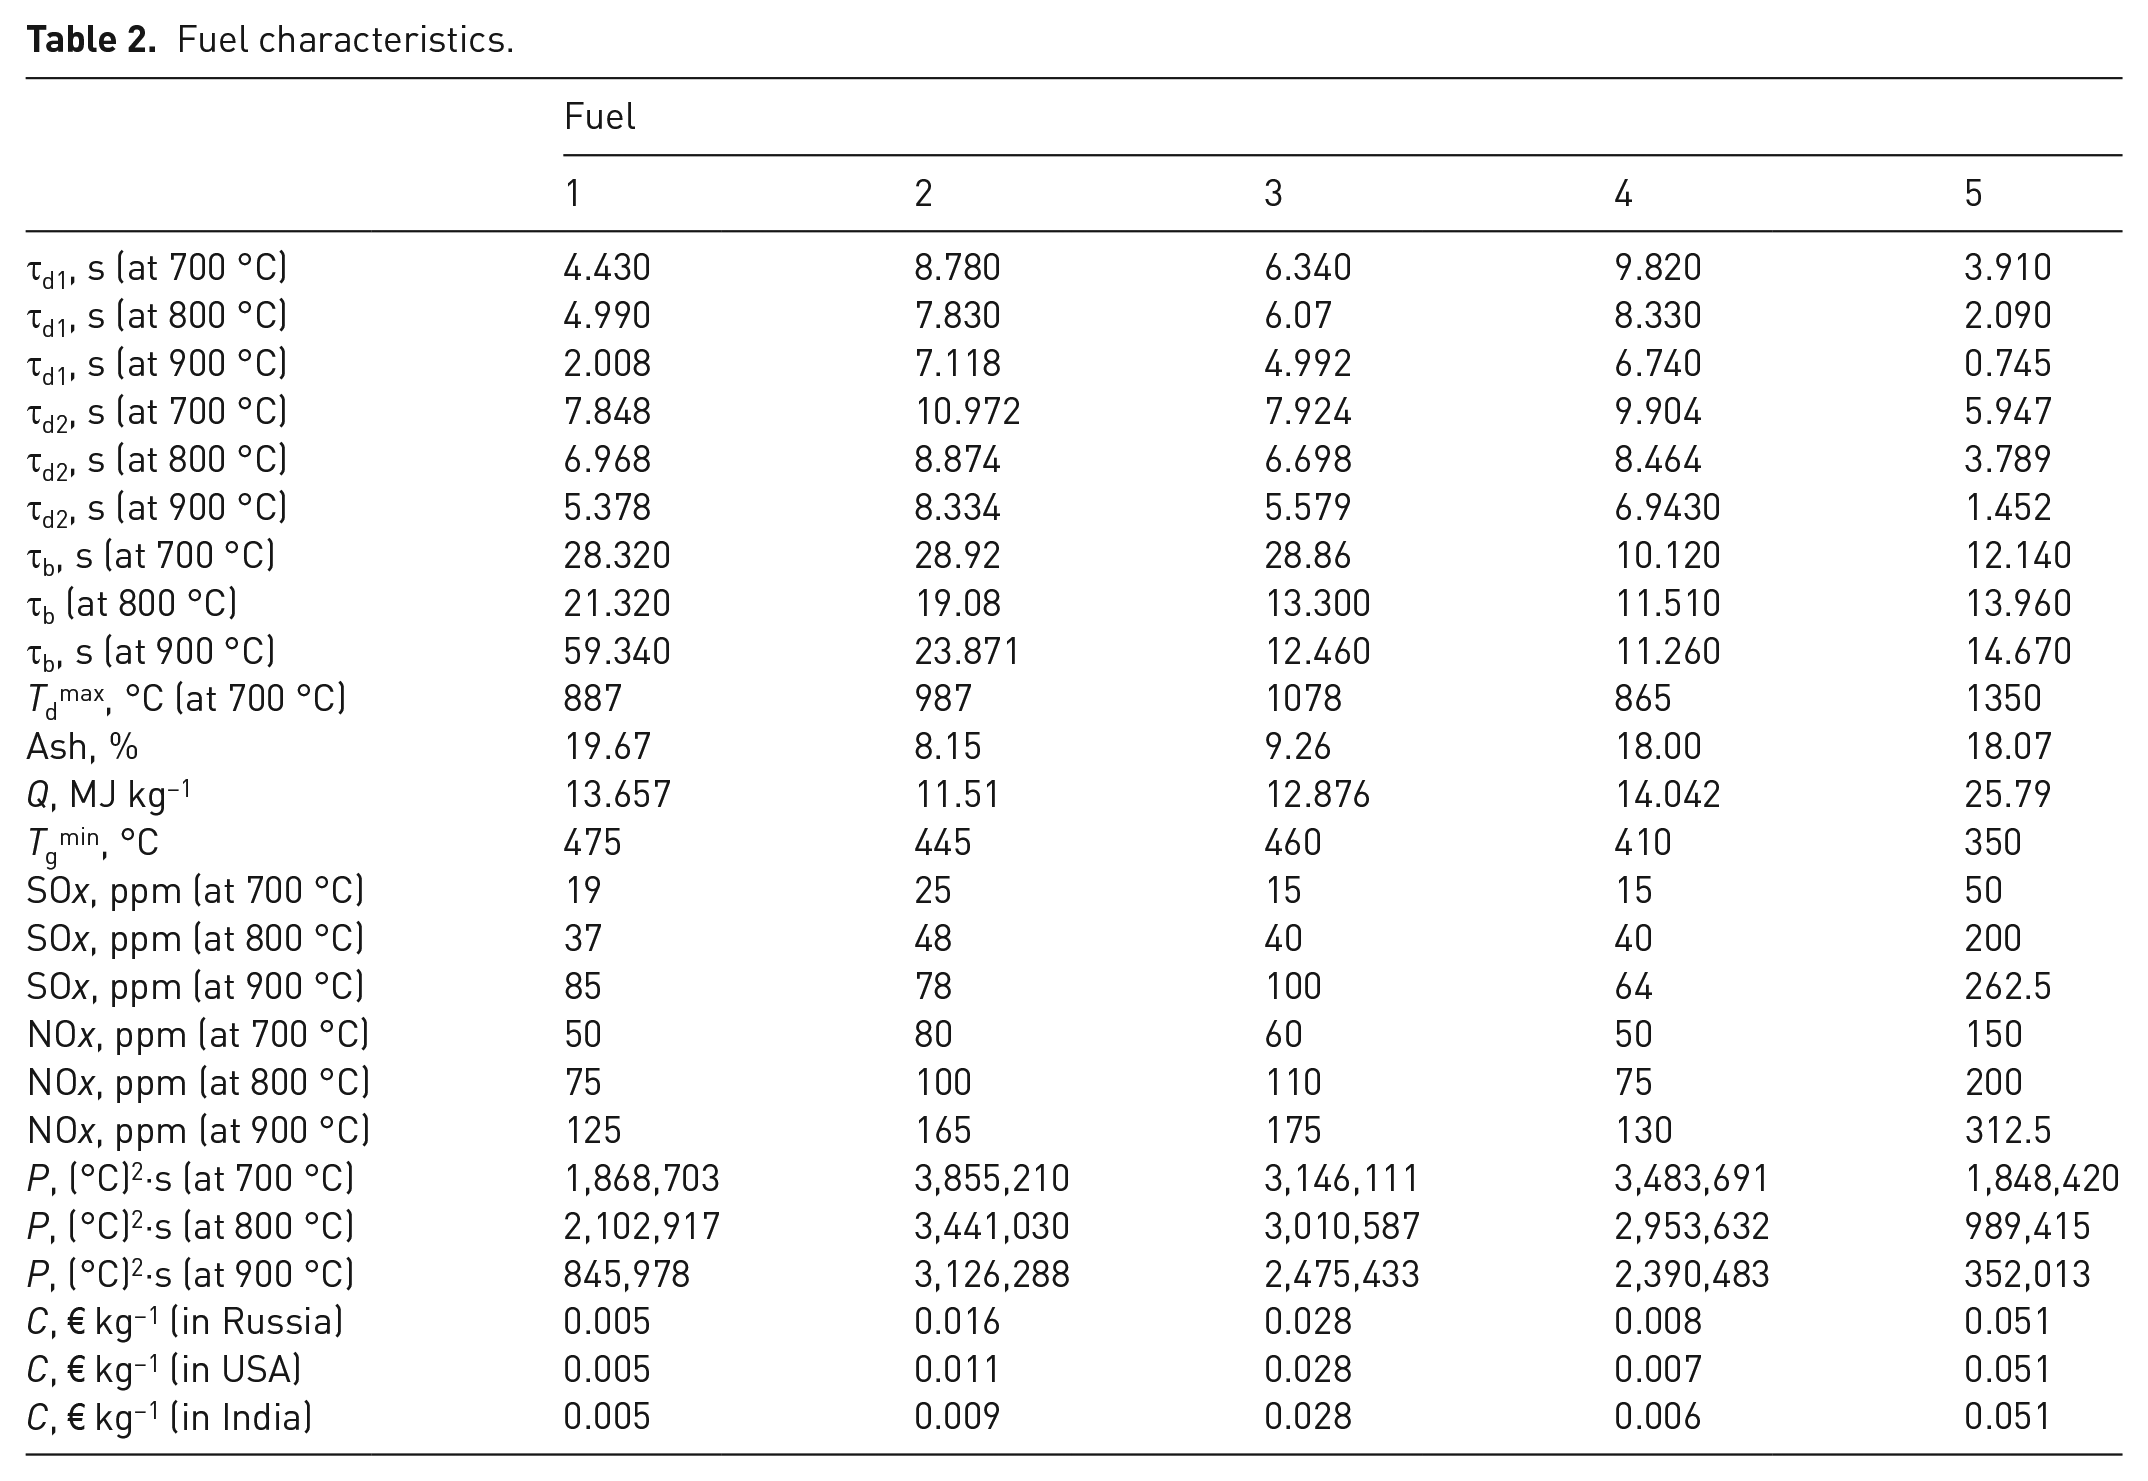
To determine the relative efficiency of a fuel mixture, it was necessary to normalize the absolute values of each criterion. Gas-phase and heterogeneous ignition, combustion time, ash content and SO x and NO x emissions were normalized to a minimum absolute value. The combustion temperature and specific heating value was normalized to a maximum value.
In addition to the criteria listed in Table 2, we used other indicators to evaluate fuel efficiency including dusting, ease of storage and transportation, availability, waste recovery, reduction of polluted territories and transportation expenses. The indicators of the storage and transportation convenience, transportation expenses, and dusting were normalized so that their value was equal to 1 for slurries because they do not produce dust and can be transported through a pipeline. When normalizing the criteria of waste recovery and reduction of polluted territories, we assigned the value of 1 to the fuel that helps to reduce the area of polluted land and the consumption of fossil fuels. For the availability criterion, we assigned the value of 1 to the fuel that contains the most widespread components in a particular country (Supplemental Table S2).
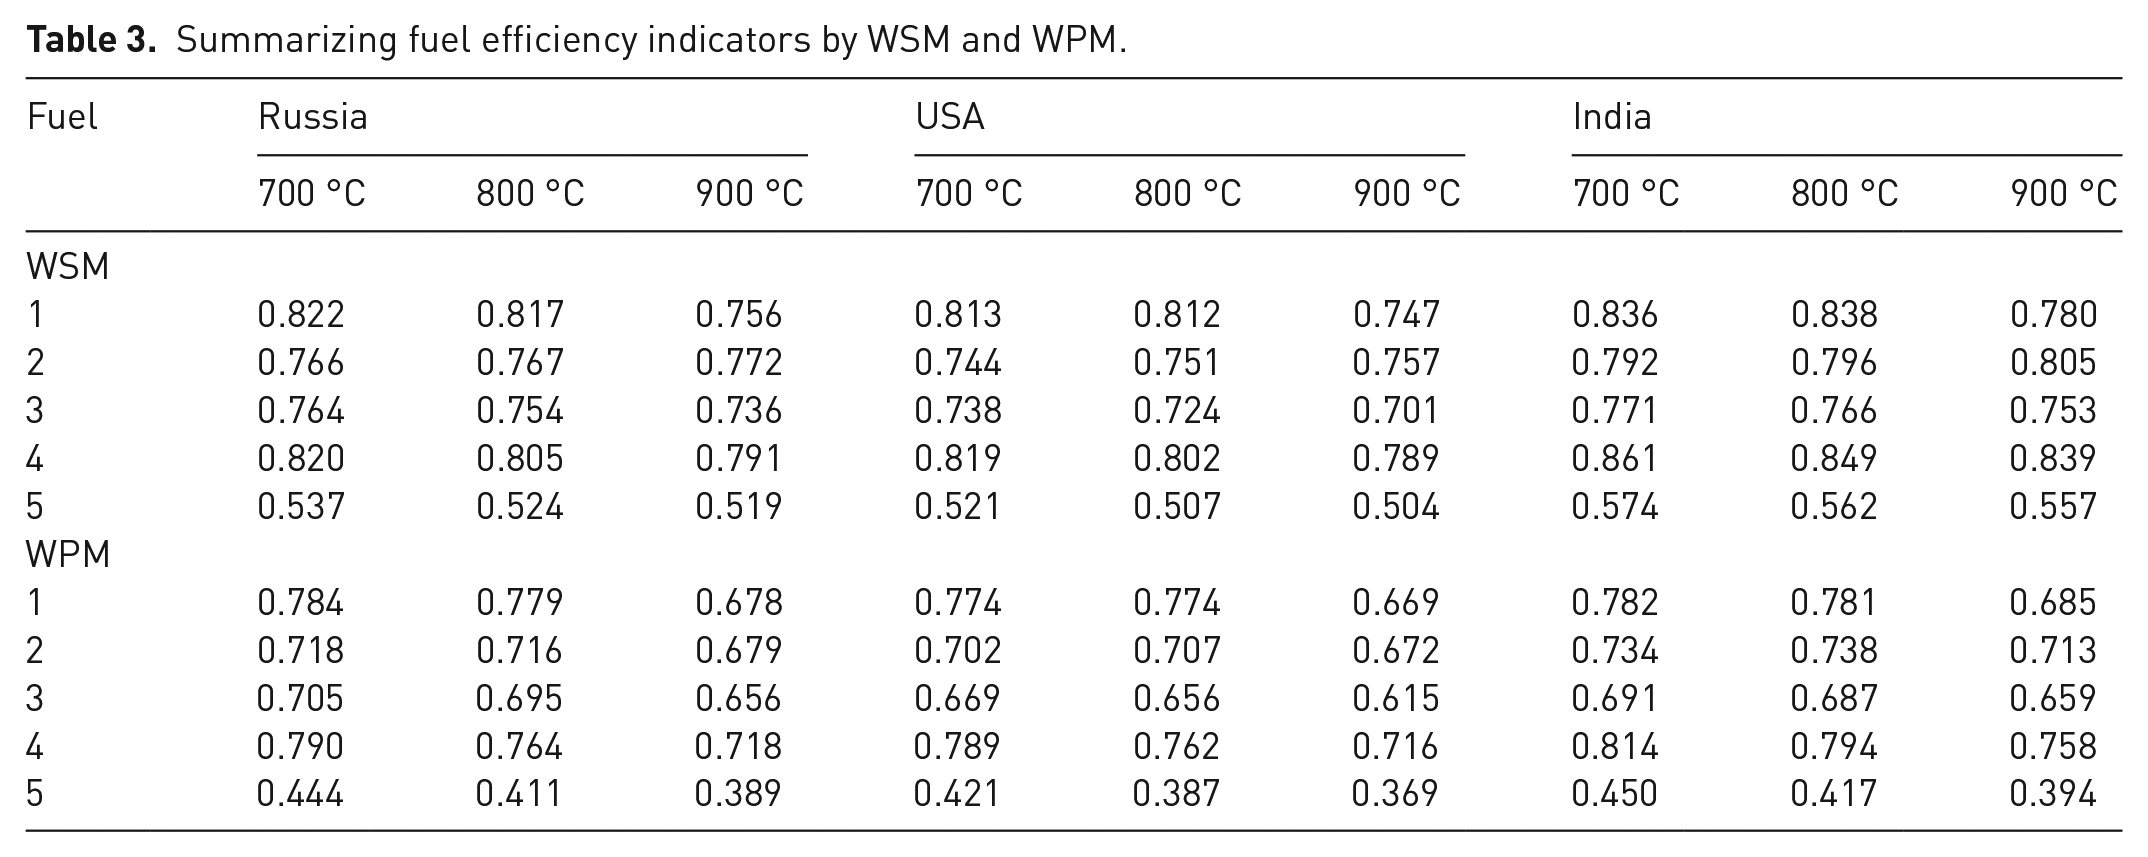
After normalizing all the absolute values, we calculated the summarizing fuel efficiency indicator according equations (2) or (3). The results are presented in Table 3.
Summarizing fuel efficiency indicators by WSM and WPM.
Fuel efficiency evaluated by AHP method
At the first stages, this method involved determining the fuel efficiency criteria. The considered criteria are described in Section ‘Results of MCDM analysis for evaluating the efficiency of waste-derived fuels’. For a more accurate evaluation, it is advisable to compare criteria within a group and then compare groups with each other. One of the first calculation stages is assigning the weights to each indicator. The results of pairwise comparison of indicators are presented in Supplemental Tables S3–S6. After the pairwise comparison of criteria, we calculated the normalized weights of all the criteria using equation (4) (for more detail, please see Supplemental Tables S7–S10). Then we calculated the weights of the set of criteria by comparing them with each other. The pairwise comparison of indicator sets is given in Supplemental Table S11. After the pairwise comparison, we determined the normalized weights of criterion sets (see Supplemental Table S12).
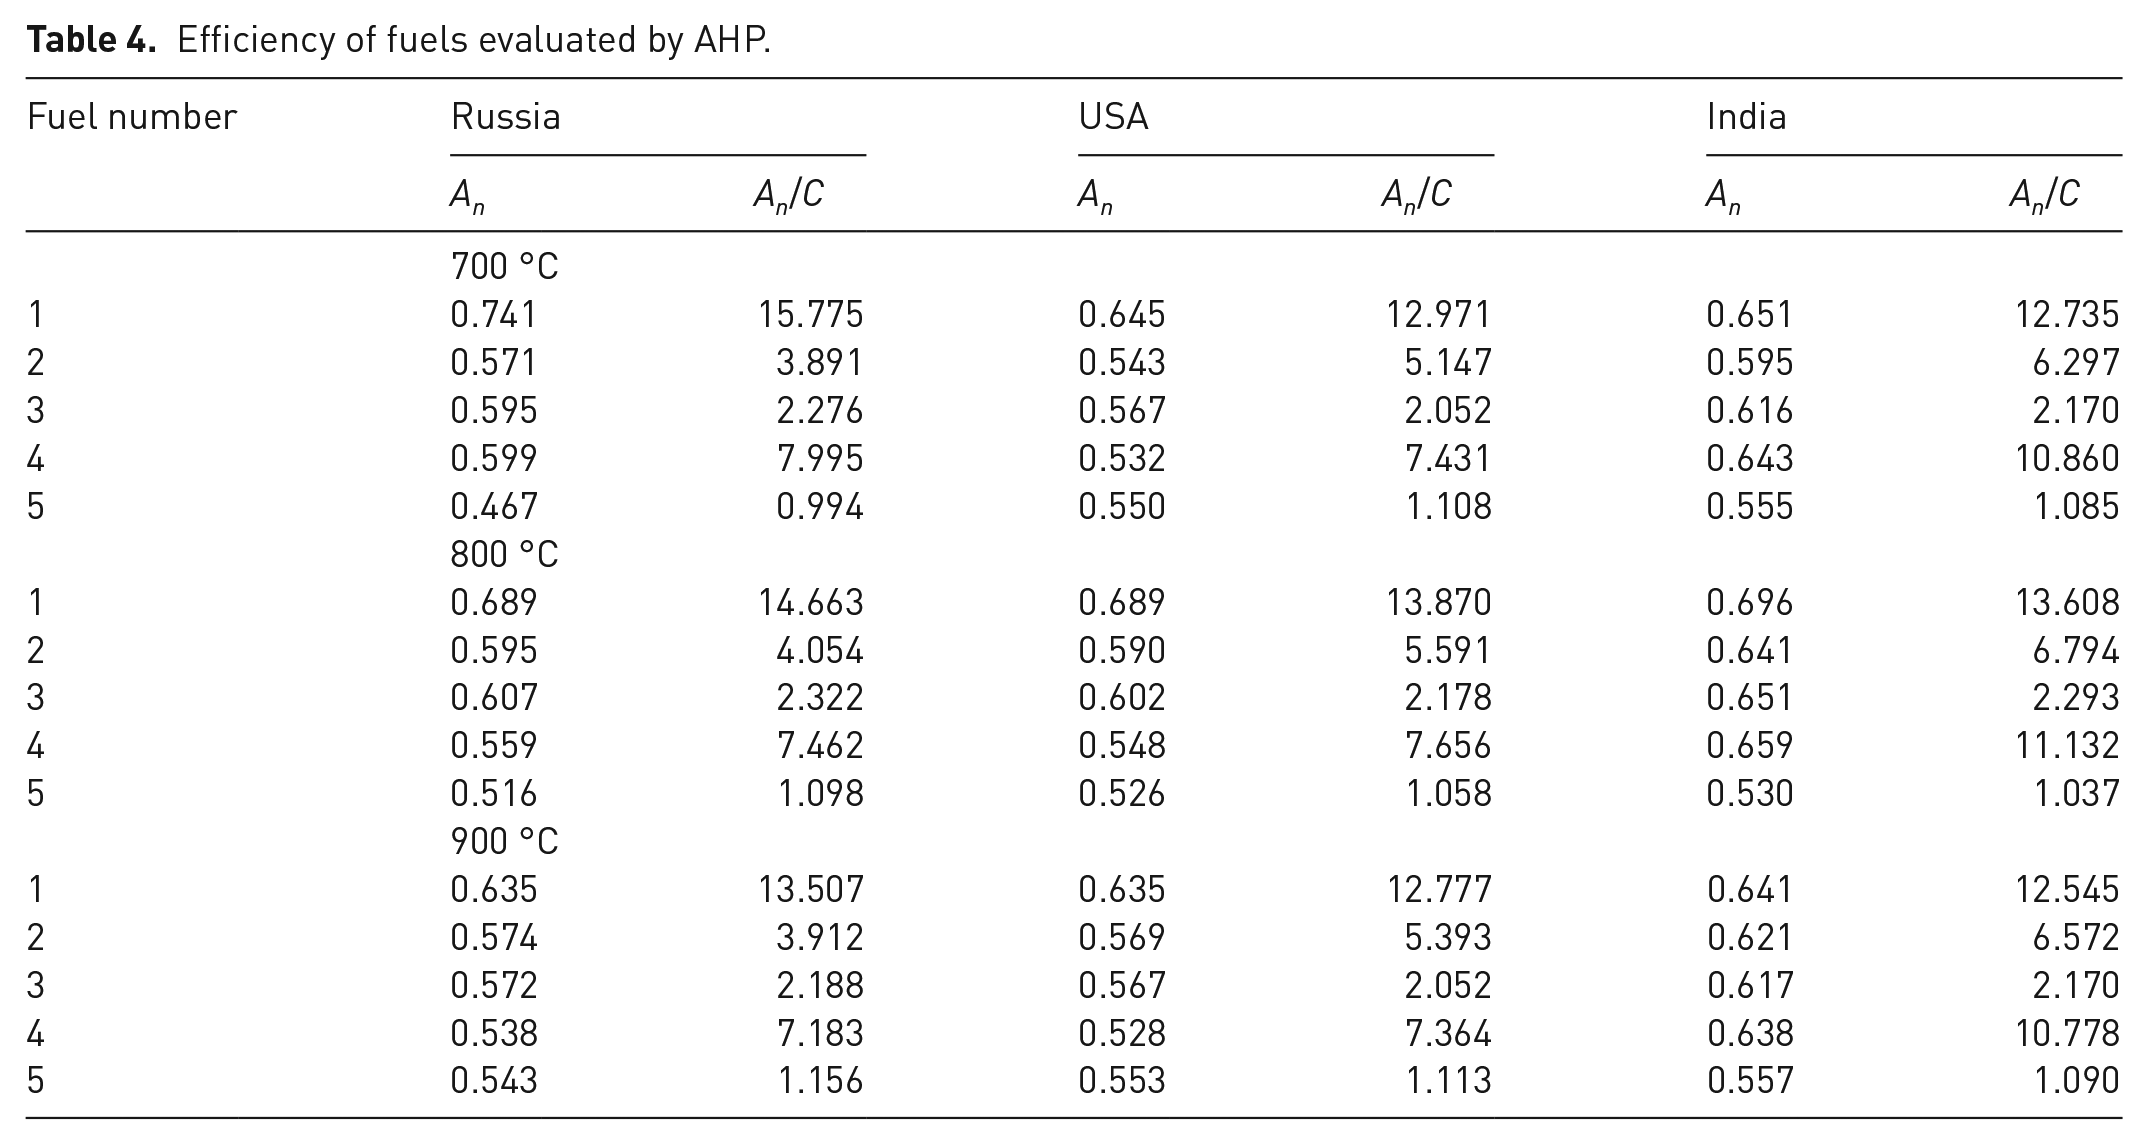
At the last calculation stage, we found the value of the efficiency/normalized cost ratio. According to the calculations, the most effective fuel was the one with the highest value of this ratio. The results are presented in Table 4.
Efficiency of fuels evaluated by AHP.
The main source of uncertainty is the experimental data on the characteristics of the fuel used in subsequent calculations. These data were obtained in the laboratory using different equipment. Consequently, there are a number of uncertainties that we could not control. These factors include the following: fuel inhomogeneity, heat loss in the combustion chamber and variation in the shape and size of fuel samples. Multiple measurements helped to reduce the uncertainty factor. In particular, experiments on ignition and combustion of the fuels were carried out at least eight times under constant conditions. When processing the experimental data, the exclusion of gross errors and the calculation of a random error at a confidence level of 95% were performed. Otherwise, the problem statement did not include such statistical factors that could be an uncertainty. There are factors that may include uncertainty (e.g. the price of fuel components), but the risk assessment of price fluctuations was not addressed in this paper. The main emphasis was placed on the evaluation of new fuel blends according to their specific technical characteristics.
Discussion
The calculations and comparative analysis using the WSM and WPM (Table 3) have revealed that the most promising fuels for all the countries under study are wet coal flotation waste (filter cake) and water slurry on its basis with added cardboard. These fuels have similar values of An. Therefore, their involvement in the energy sector of any of the countries under study will be equally effective. In this case, it is necessary to rely on the resources available in the region and the possibility of using large volumes of accumulated waste. Bituminous coal has the lowest summarizing efficiency indicator. Although coal has the best energy characteristics of all the fuels, the environmental indicators of its combustion are much lower than those of water-based slurries. Its overall efficiency is also undermined by the low relative indicators of fire safety and dusting. Moreover, the low efficiency of coal is also largely due to its high cost compared to waste.
The efficiency indicators of all fuels decrease with an increase in the fuel heating temperature provided in the experiments. This result stems mainly from the increased concentration of anthropogenic emissions with a temperature increase. It is safe to conclude that high environmental efficiency requires relatively low temperatures in the combustion chambers. However, low-grade fuels are burned at 800–1000 °C in actual practice. This temperature range applies to waste-based slurries, too. Stabilization of the combustion temperature is possible by varying the composition of the slurry. According to the data obtained, wood waste and biomass (e.g. straw, sawdust and cardboard) can be used for this. These additives have an average heating value and will not lead to destabilization of the combustion temperature. However, to increase the thermal efficiency, it is better to use highly reactive additives (e.g. oils or rubber in a small proportion).
When comparing the fuel efficiency indicators calculated for the three countries, we see that the maximum efficiency of all the fuels is achieved for India. This result can be explained by the large coal reserves this country possesses, which makes its cost low and availability high. The same conclusion can be made concerning coal processing and flotation wastes. At the same time, the requirements for the quality of exported coal are becoming stricter every year. Hence, the volumes of wastes produced when preparing coal to be exported will only increase. Coal accounts for about 57% of the total energy consumption in India, which makes it the primary source of energy. The prospects of using coal-processing wastes (e.g. filter cakes, slimes, etc.) as an energy resource are promising in this country.
Figure 2 illustrates the ratio of individual normalized criteria of the overall fuel efficiency calculated via WSM. Data are given for coal dust as well as for the slurry with the maximum efficiency (90% filter cake and 10% cardboard) and minimum efficiency (15% coal slime, 25% filter cake, 10% pyrolysis residue and 50% water). Data for Fuel 2 and Fuel 4 are given in Supplemental Tables S13–S15. If we consider all the factors influencing fuel efficiency, we can see that coal dust is inferior to fuel slurries in 80% of the criteria under study. The surface area obtained by combining all the criteria in vector diagrams (Figure 2) is larger for slurries than for coal. When considering a set of indicators, we found that coal is a promising fuel in the energy criteria (blue sector) due to its high heating value as well as its better ignition and combustion characteristics. It has a shorter ignition delay time and lower ignition temperature as well as longer combustion time and high heating value. Slurries, however, are more effective in terms of the environmental (green) and safety (red) indicators. They produce much less sulfur and nitrogen oxides, and the chance of their spontaneous ignition is low. Due to the low-cost wastes involved, slurries are also better in terms of the economic criteria (blue sector). Thus, coal can compete with slurries in the relative efficiency indicators mostly due to its high energy performance.
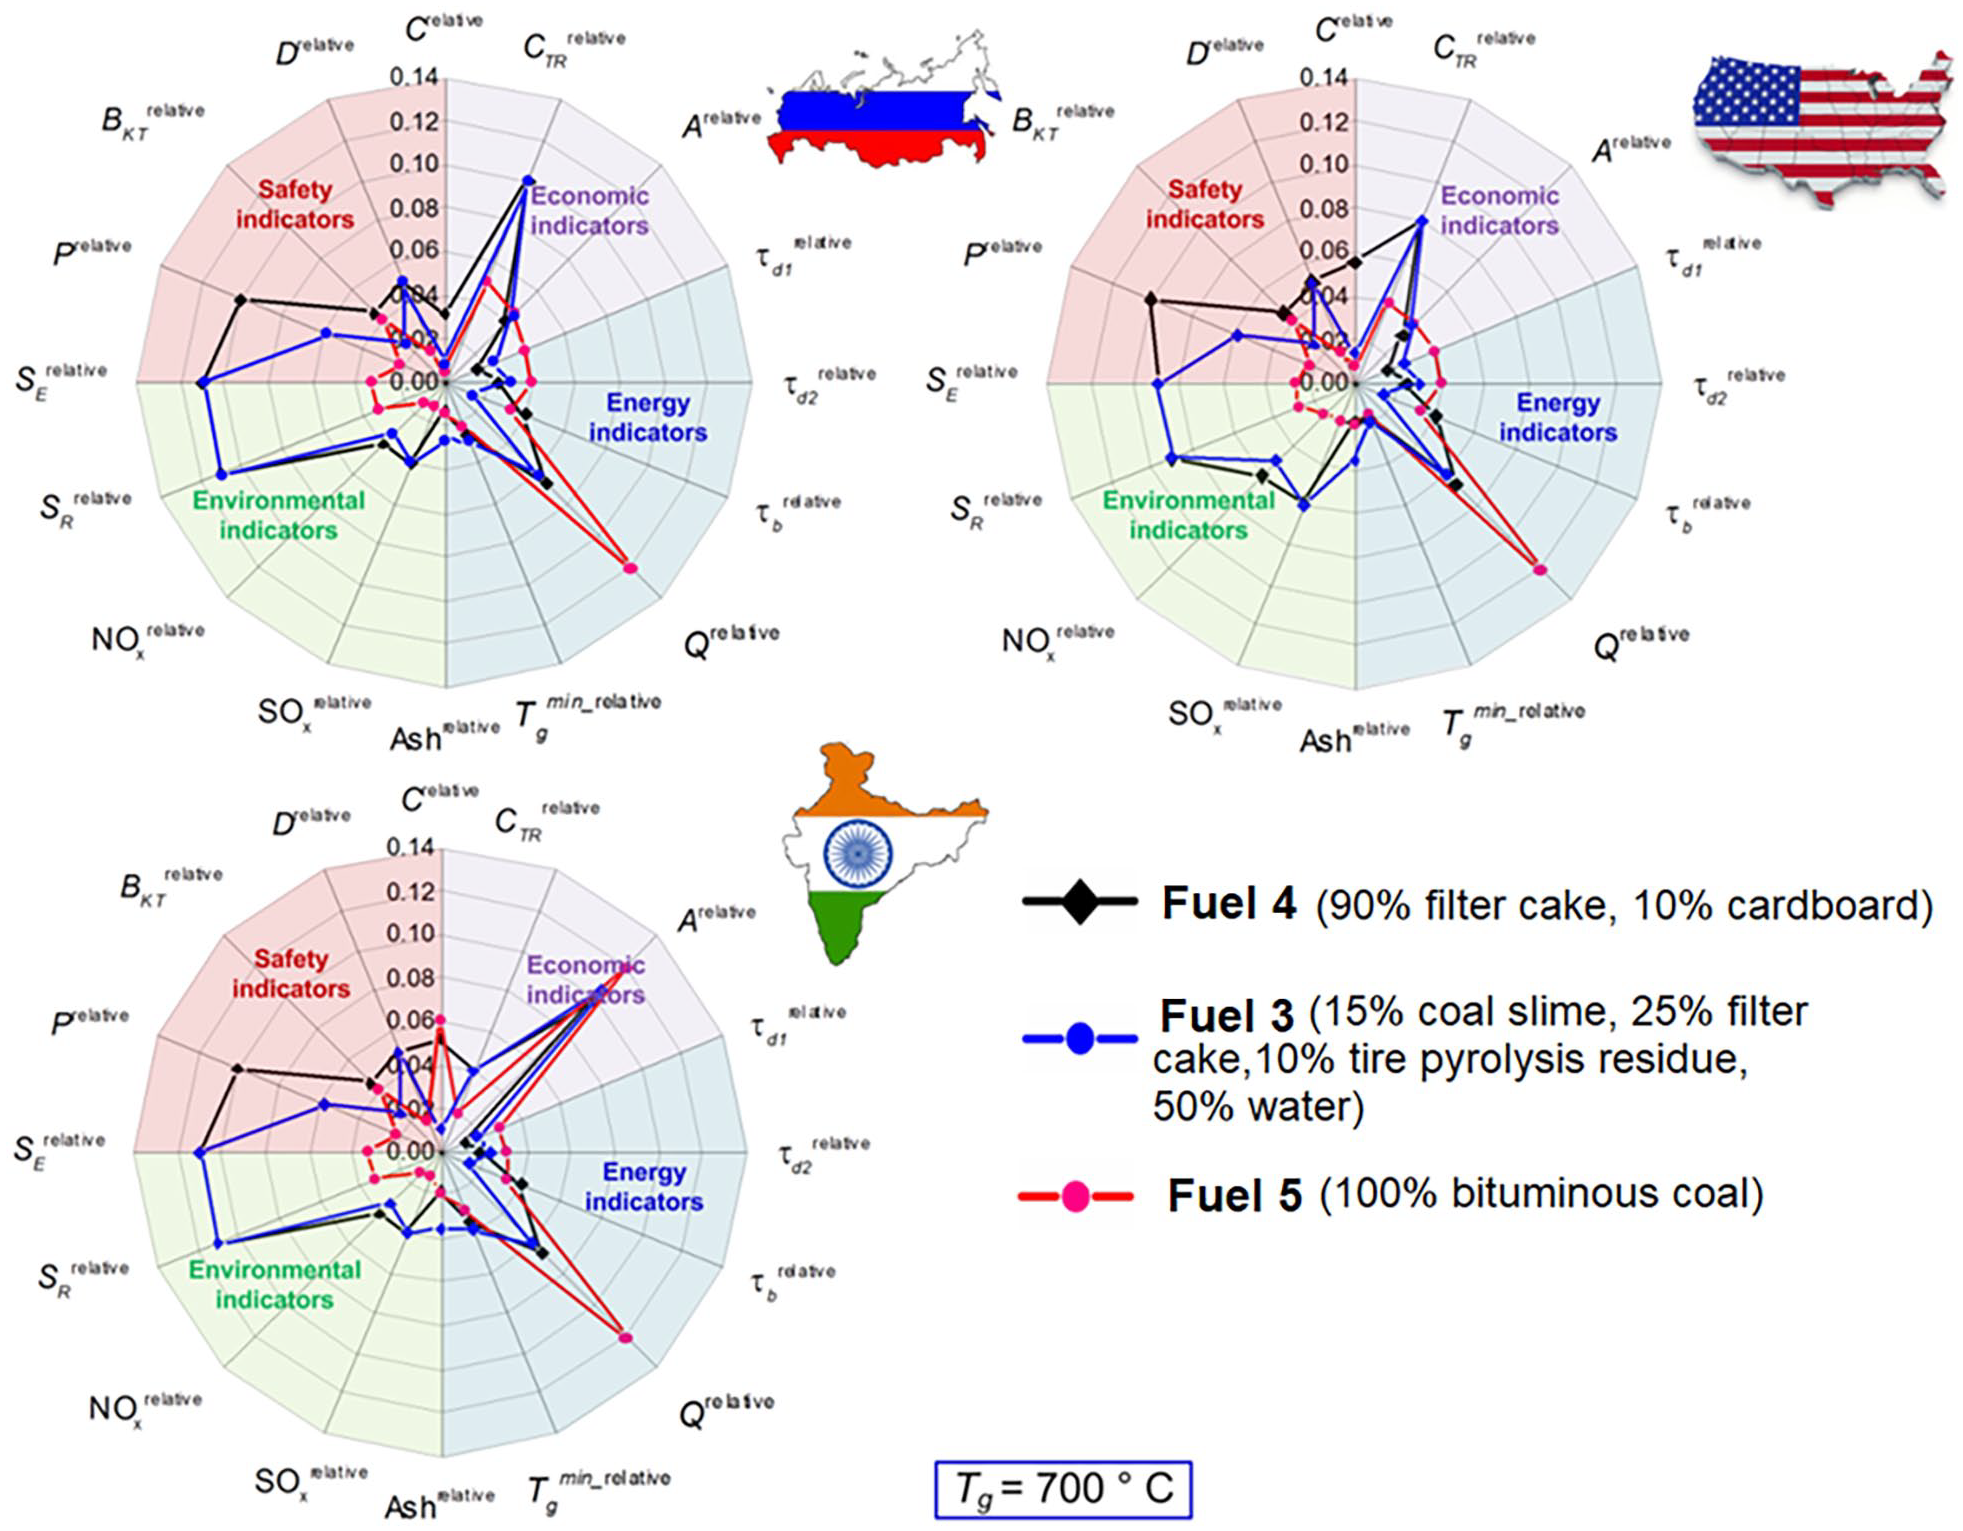
Dimensionless components of a complex fuel efficiency indicator calculated by WSM.
The data obtained show that the use of waste-derived slurries will benefit thermal power plants and boiler houses in the field of NO x and SO x emission reduction. Experimental data confirm this (Table 2). In laboratory experiments, CO2 emissions from the combustion of waste-derived slurries can be 1.5–2 times lower (Dorokhov et al., 2021) than from the combustion of coal, but this difference is due to local features of the process (e.g. lower carbon content and higher humidity of waste-derived blends). However, on an industrial scale, CO2 emissions will be comparable if the fuel is burned out completely and the equal power (thermal or combined) is produced when burning coal or a waste-based mixture. The use of new types of waste-derived slurries is more appealing in the context of reducing nitrogen and sulfur oxide emissions due to beneficial reactions with water vapor and certain substances (e.g. alkaline earth metal compounds). We can conclude that when using waste-derived slurries, the methods for reducing CO2 emissions will remain conventional: flue gas cleaning, the use of specialized equipment and, most importantly, reducing consumption and losses by increasing the efficiency at all stages of production and utilization of energy.
Figure 3 compares the efficiency of the fuel mixtures under study versus coal dust. The use of coal-processing wastes together with municipal solid waste can increase the fuel efficiency by 42–58% for Russia, by 41–61% for the USA and by 34–52% for India. The slurry containing 90% of filter cake and 10% of cardboard has the highest efficiency. This fuel blend is the cheapest, has good ignition and combustion characteristics, and does not require large investments in transportation, storage and preparation systems. The lowest efficiency indicator belongs to the fuel mixture with the following composition: 15% of coal slime, 25% of filter cake, 10% of tire pyrolysis residue and 50% of water. Tire pyrolysis residue has a high price (relative to other wastes) and lower availability. Moreover, tire residue can be effectively recovered using other methods than combustion. Another point is that the annual production volume of this component is about 30–50 times lower than that of filter cakes and slime. The addition of solid pyrolysis products increases the heating value of the fuel mixture and the combustion temperatures and can therefore be considered if a high priority is given to the thermal efficiency of the plant.
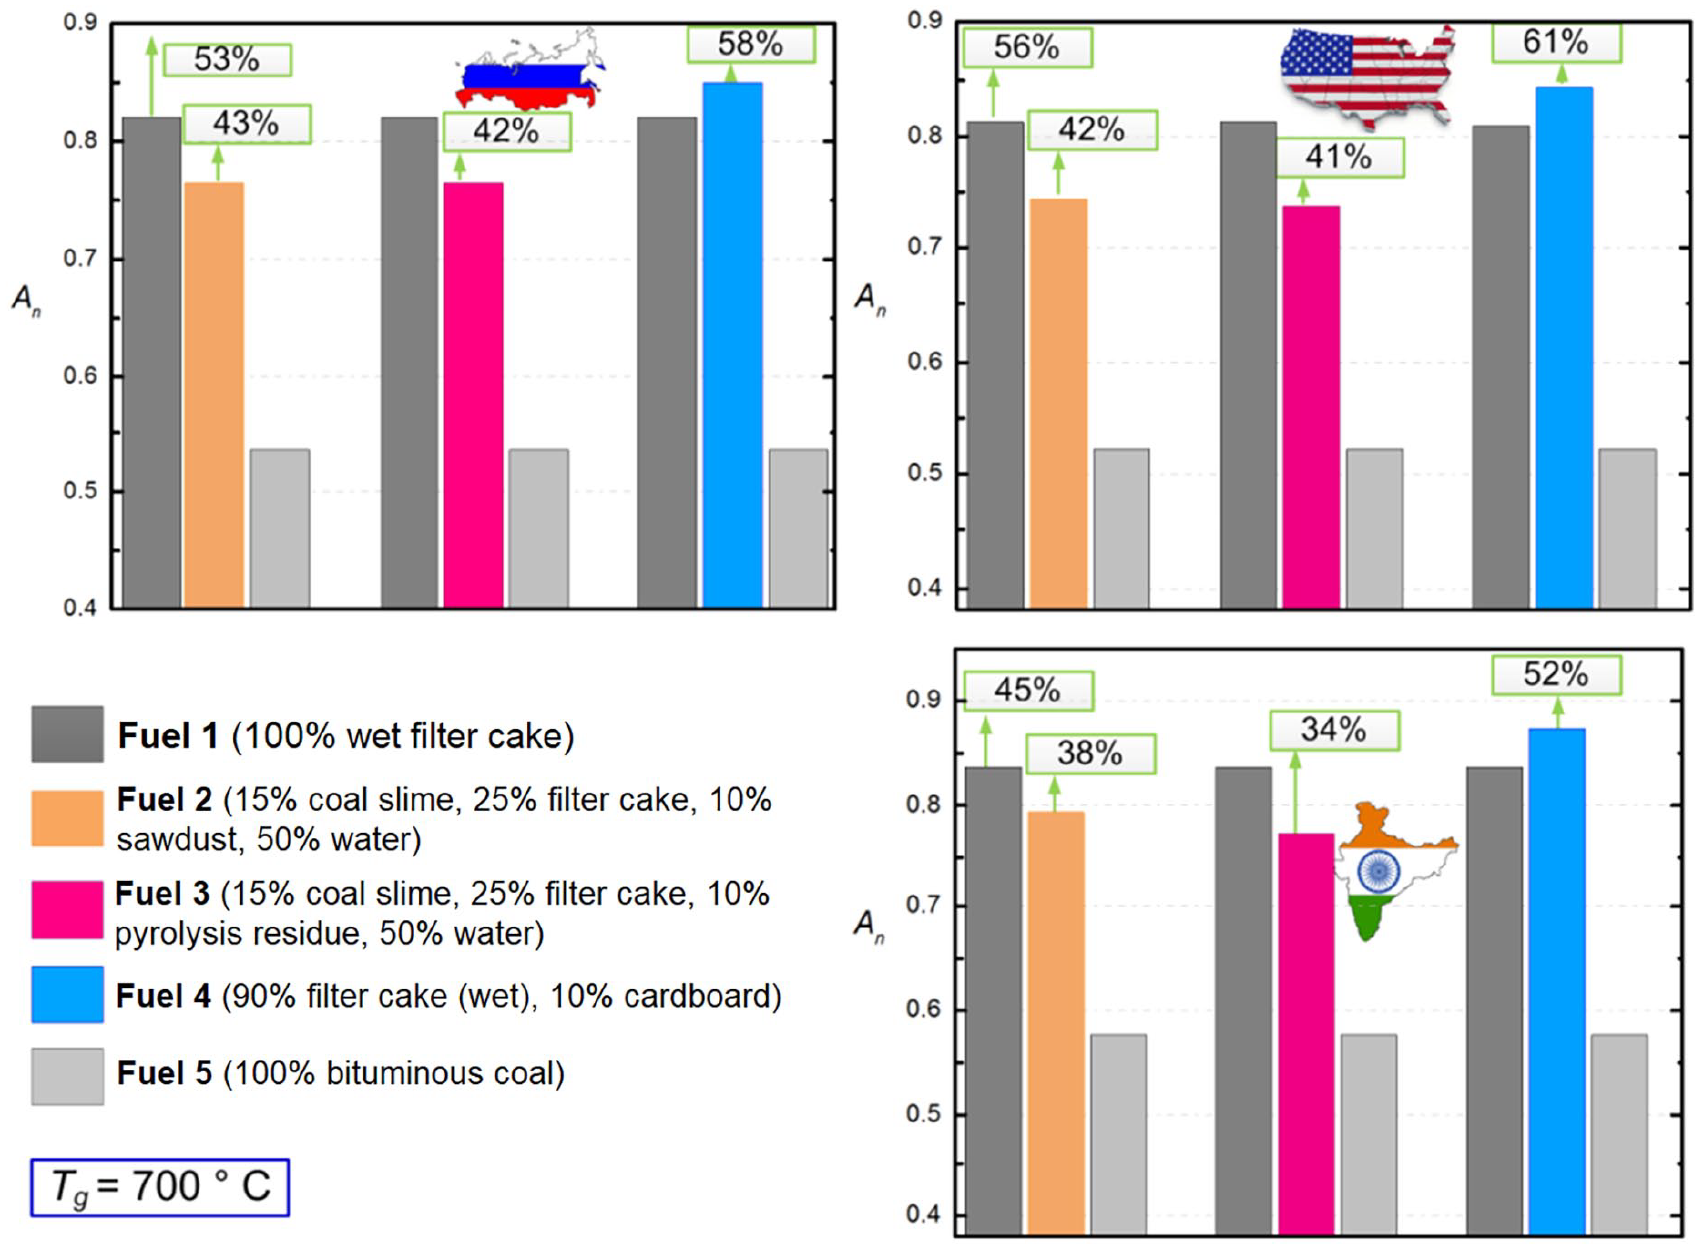
Fuel efficiency indicators calculated by WSM (percentage difference compared to coal).
Figure 4 illustrates the differences in the values of individual efficiency indicators of the fuel mixtures and pulverized coal calculated by WPM. Data are given for coal dust as well as for the slurry with the maximum efficiency (90% filter cake and 10% cardboard) and minimum efficiency (15% coal slime, 25% filter cake, 10% pyrolysis residue and 50% water). Data for Fuel 2 and Fuel 4 are given in Supplemental Tables S13–S15. A multicomponent slurry based on coal slime, filter cake and tire pyrolysis residue is the least effective for a number of reasons with the economic constituent as the main one. Due to the tire residue, the cost of fuel increases, since the cost of the component, its availability, and transportation expenses are much higher than for all the other components under study. In contrast, filter cake with 10% cardboard has the highest indicators, which suggests the good prospects for further involvement of the paper and wood wastes in slurry fuel preparation technologies. More than 300 million tons of waste paper are produced annually, which can be reused in the energy sector as an additive to fuel slurries.
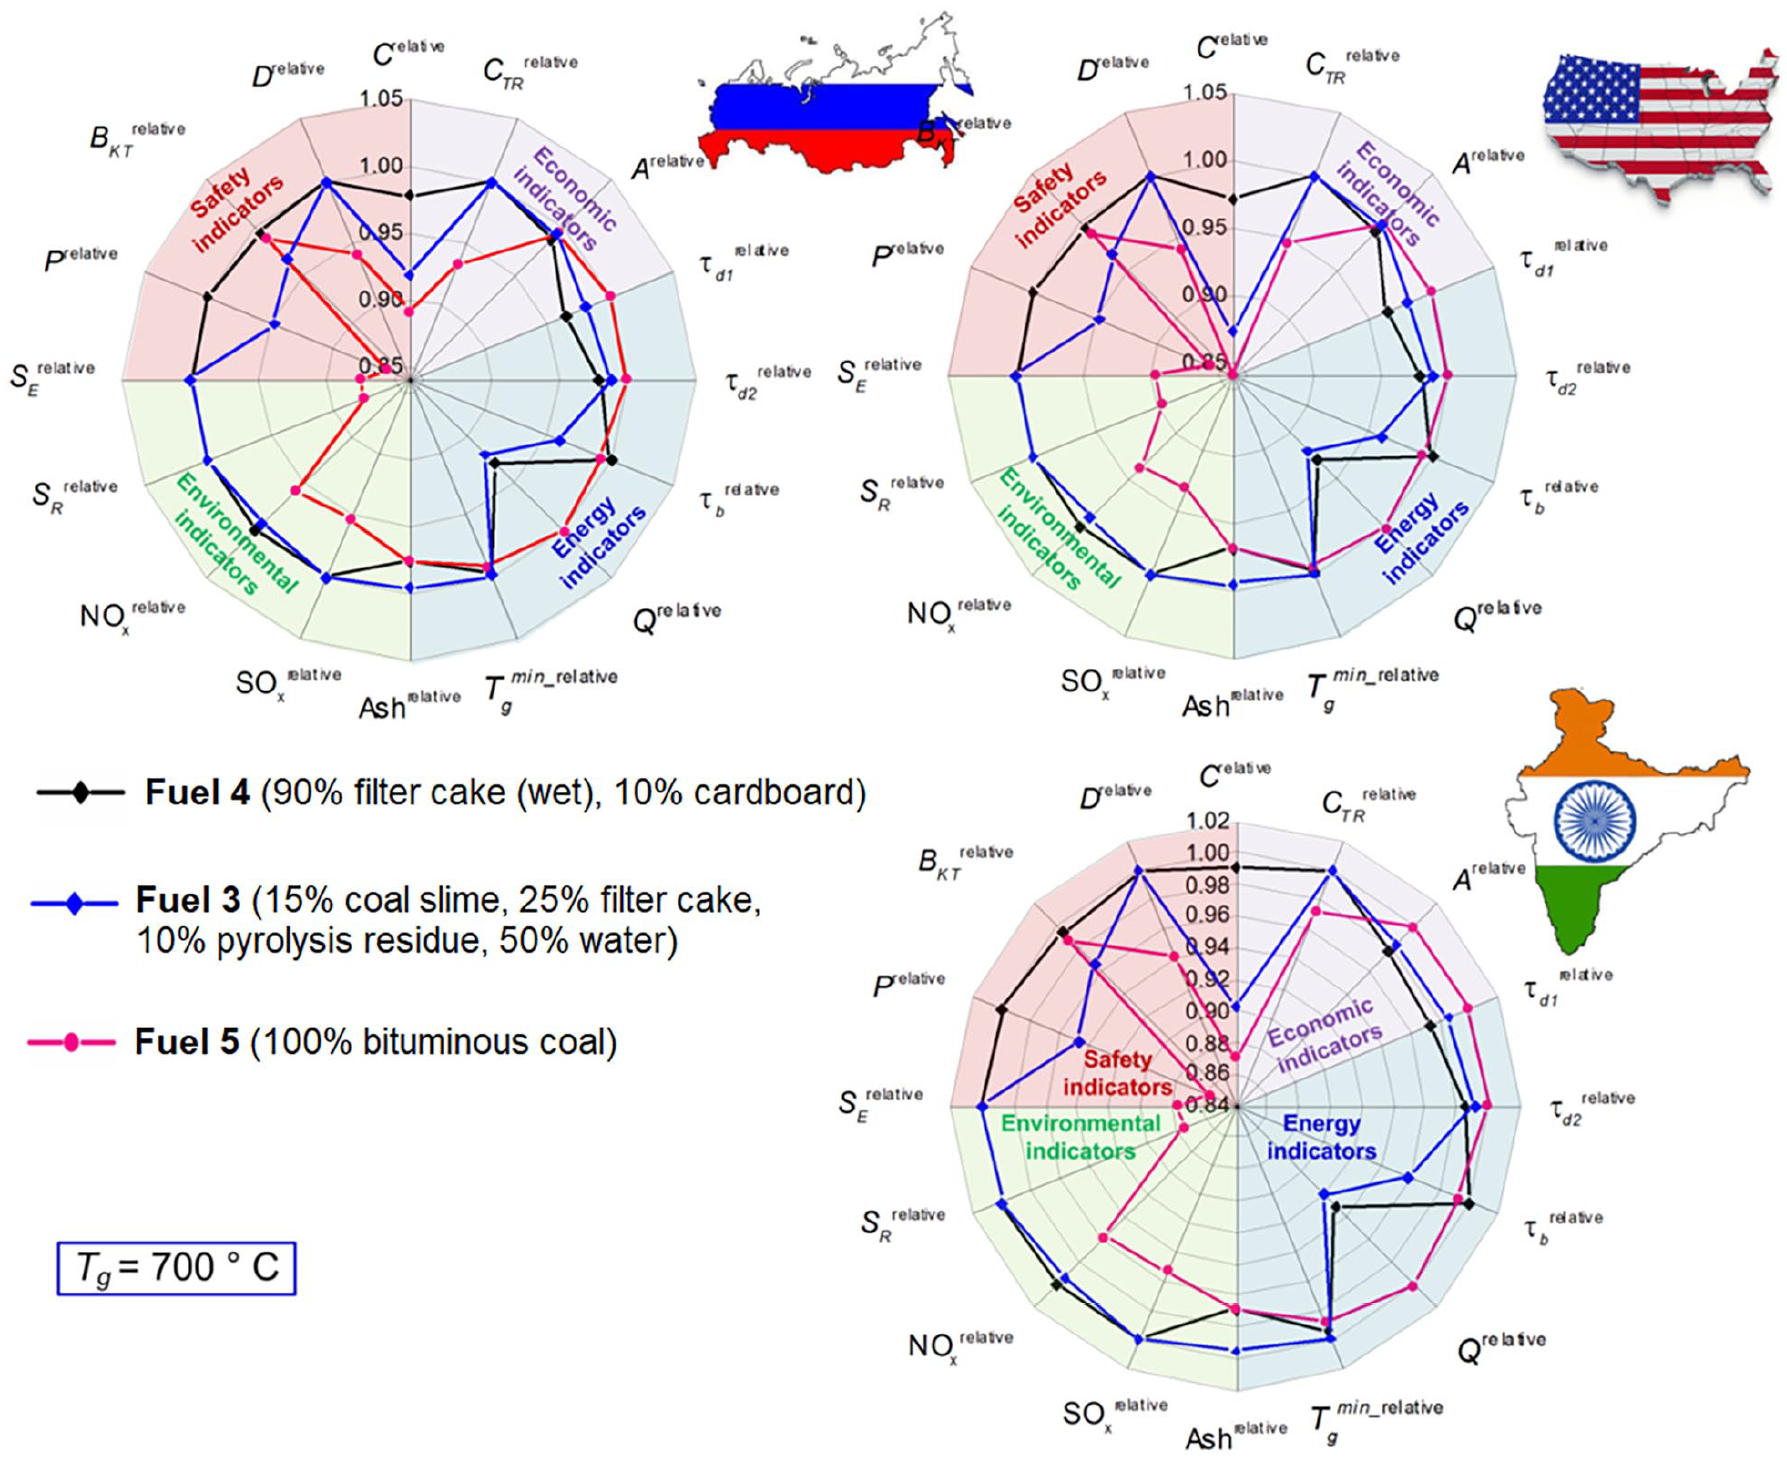
Dimensionless components of a complex fuel efficiency indicator calculated by WPM.
Figure 5 compares the efficiency indicators of fuels calculated using WPM. Full or partial replacement of coal by waste-based fuel would increase the efficiency on average by 53–93% depending on the region. When determining the fuel efficiency using the WPM (similarly to WSM), we established that the most effective fuel composition consists of 90% of filter cake and 10% of cardboard. The least effective is the composition containing 15% of coal slime, 25% of filter cake, 10% of tire pyrolysis residue and 50% of water. The reasons behind this result have been listed earlier in the paper. The fuel with the addition of cardboard has a somewhat higher total indicator than that of filter cake without any additives. The composition with sawdust scored somewhere in the middle in terms of the criteria analyzed. According to calculations, WSM and WPM gave similar results: the same compositions are characterized by the highest and lowest efficiency. Thus, both methods can be used for multi-criteria evaluation of various fuels to compare them with conventional energy resources, such as coal, gas, or fuel oil in power plants.
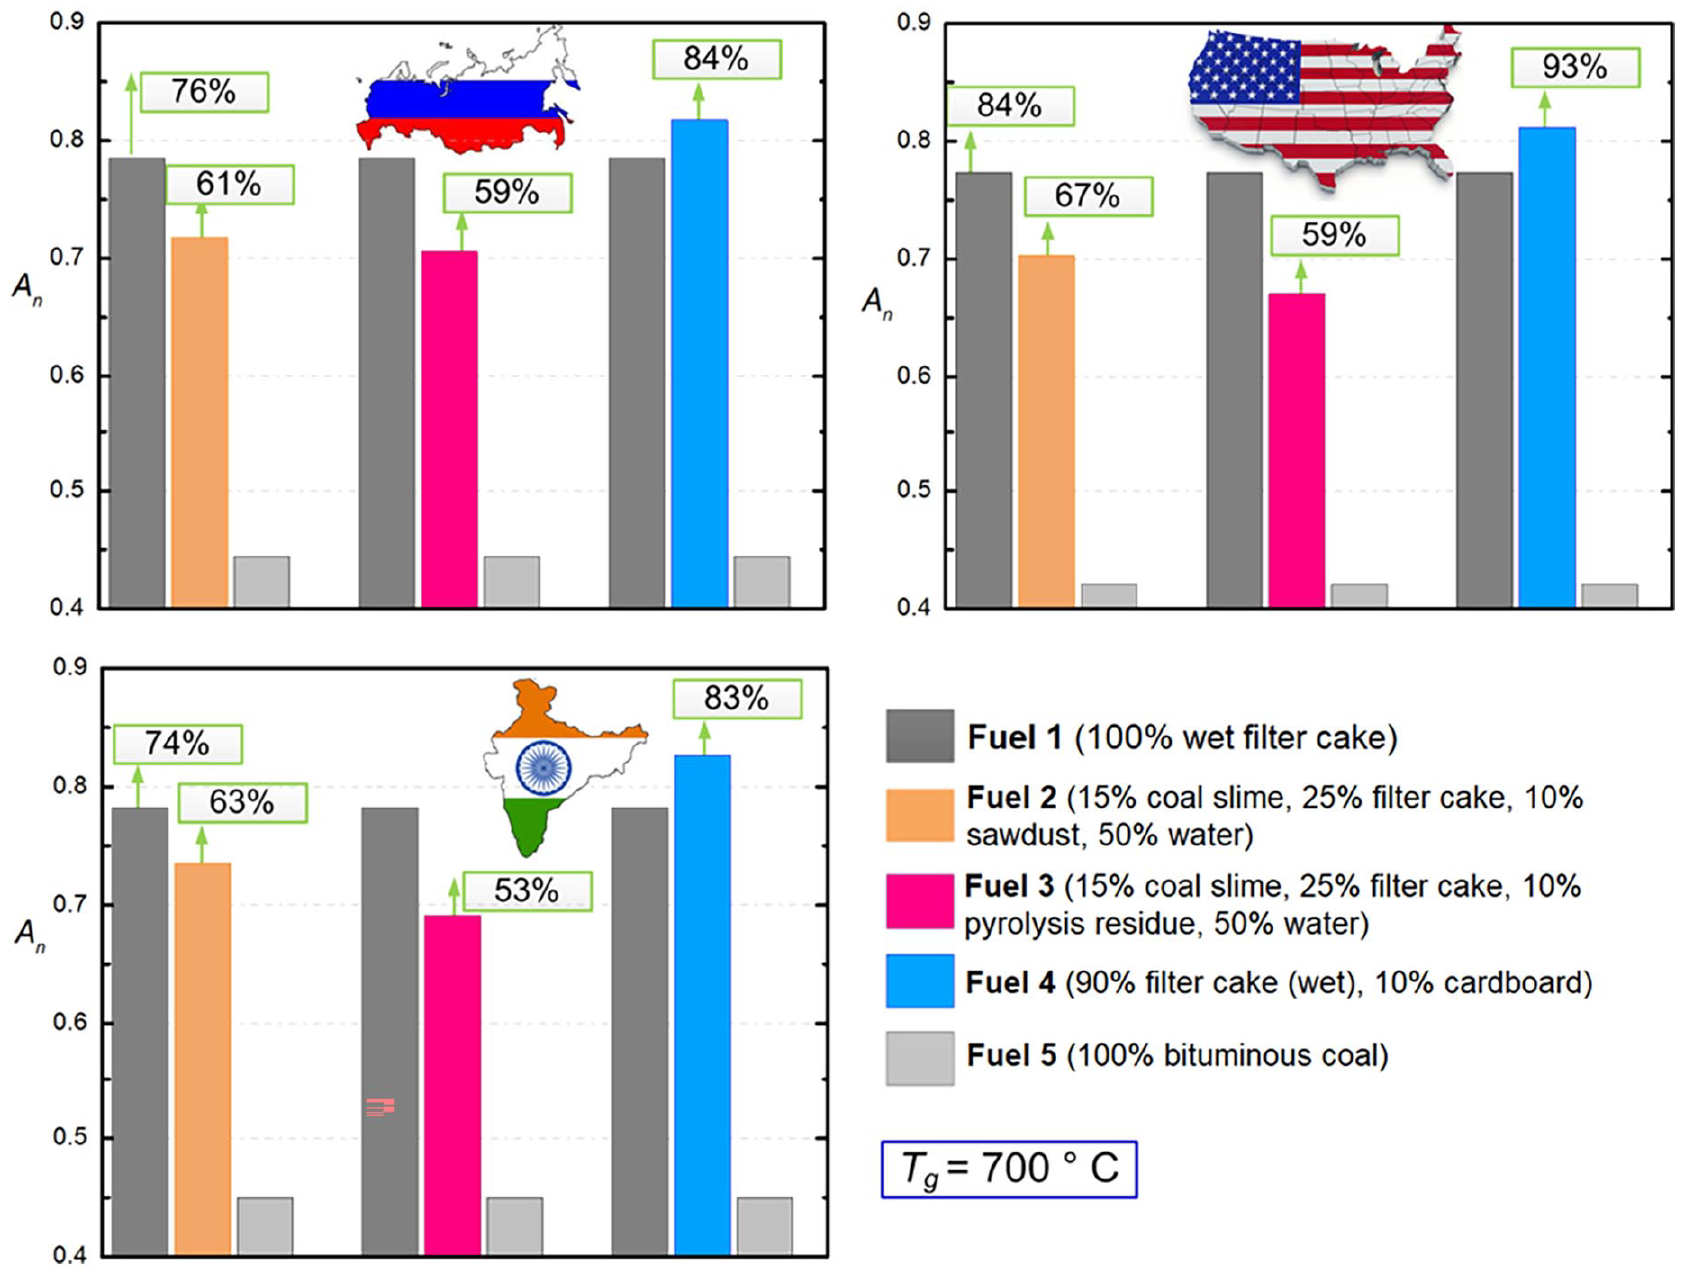
Fuel efficiency indicators calculated using WPM (percentage difference compared to coal).
The sensitivity assessment of the WSM and WPM models showed that changes in the weight of a group of parameters within ±15% of the initial values led to a change in the complex fuel efficiency indicator within 0.003–3.99%. A more noticeable change in the An indicator (4–7%) was obtained with a change in the initial weight coefficients by 17–20%. At the same time, the maximum sensitivity was manifested when the weight coefficients changed in the category of economic parameters. Changes in the weights in other categories were reflected in the complex fuel efficiency indicator to a lesser extent.
Figure 6 presents the values of fuel efficiency indicators and their ratios to the cost of fuels. The calculation of fuel mixture efficiency indicators using the AНР shows that the wet filter cake without additives has the highest overall efficiency. The efficiency to cost ratio of the filter cake is more than 12 times higher than that of coal dust. The composition ‘15% coal slime, 25% filter cake, 10% tire pyrolysis residue and 50% water’ is the least effective fuel among those considered. Nonetheless, the efficiency/cost ratio of this fuel is twice as high as that of coal. Thus, if we prioritize the cost, the AHP method emphasizes the possible benefits since the waste is cheaper than high-grade fuels. This is more important from an economic point of view, in terms of profit and cost-sharing. If we take a step beyond economic interests, the results will not undergo serious qualitative changes. If, for example environmental indicators are at the top of the hierarchy, then low-grade fuels, despite several obvious drawbacks, are likely to again rank higher again, because the rational use of waste is more profitable in the long term than investing more and more in extraction.
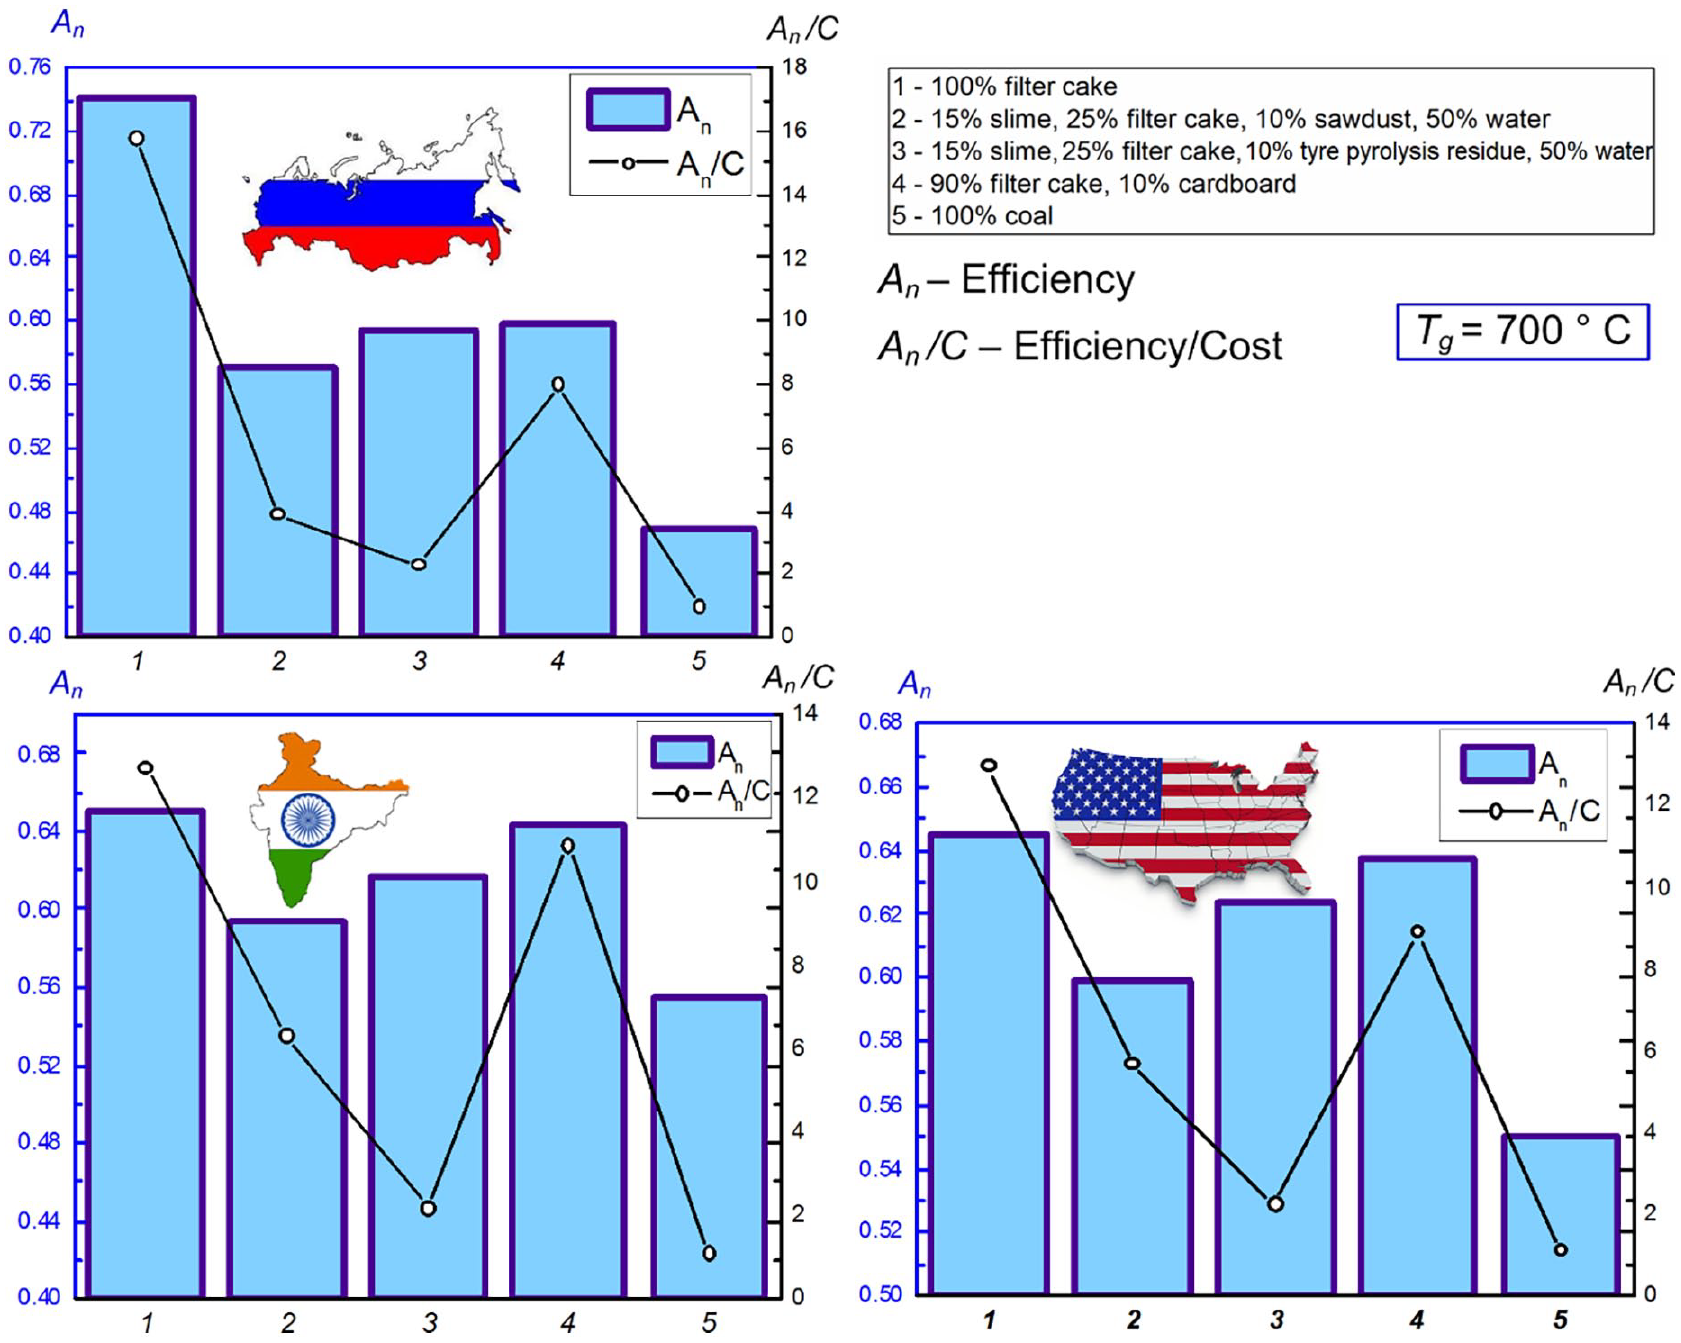
Fuel efficiency indicator and its ratio to the fuel cost for the three states under study (data obtained by AHP).
In general, the highest potential of using composite slurry fuels is typical of countries with developed coal and/or oil production and processing (China, India, USA, Australia, Russia). These industries generate a very large volume of waste (Kaza et al., 2018; Wilson, 2015), which is rather difficult to recover. Waste-to-energy combustion can become the main route, including incineration of coal and oil processing waste as part of multicomponent slurries. Recent trends (Coal, 2020; Key World Energy Statistics (Statistics report), 2020) indicate a decline in coal mining and processing in the European region. But, in our opinion, this is no reason to discard the development of slurry combustion technologies in Europe and other countries where there is no large-scale production and processing of oil or coal. Fuel slurries can be prepared from a wide range of components including high-moisture or oily waste. In European countries, these can be such components as sewage sludge, oil sediments, waste liquids, agricultural waste, as well as solid and oily pyrolysis products of these components.
Thus, all the methods of MCDM can be successfully applied for the general assessment of the efficiency of unconventional fuels. Calculations can be performed both for a specific country and for a specific region or enterprise. Particular attention should be paid to assigning weights (when using WSM and WPM) and the design of the criteria hierarchy (when using AHP). This will make it possible to assess the prospects for the use of a new fuel most adequately, considering the legislation, geographical features, the current economic situation, the state of the environment, and technological readiness.
Conclusions
i. The results of this study supported the hypothesis that nonconventional waste-derived coal–water blends can replace bituminous coal. The approach proposed in this paper can become an important tool for developing waste-to-energy technologies and finding an acceptable solution to the environmental, economic, social and energy-related problems in many countries.
ii. The performed MCDM analysis made it possible to identify the best and worst fuel compositions. Bituminous coal in any model cases had the lowest complex efficiency indicator. Wet coal slime without additives has high overall efficiency (74–84% higher than that of coal). However, it may cause the destabilization of combustion in the furnace. Therefore, higher-calorie and more reactive fuel (fuel oil, diesel, natural gas) will be needed to fire up the boiler.
iii. Regardless of the region, a mixture based on wet coal waste (90%wt) and cardboard (10%wt) has become the most promising fuel. Its overall efficiency is 50–80% higher than that of coal due to its high ignition and combustion performance, acceptable emissions and low cost.
iv. Combustion of wet coal slime together with solid waste makes it possible to increase fuel efficiency by 42–58% for Russia, by 41–61% for the United States and by 34–52% for India. For all the countries considered, the development of technologies of waste-derived fuel slurries can become an economically and environmentally promising strategy that contributes to the diversification of energy sources.
v. Calculations performed using different methods showed similar results, that is fuel ranking did not change significantly when using WSM, WPM and AHP. At the same time, the WSM and WPM methods provided the closest results in terms of the values of the final fuel efficiency indicator.
vi. AHP method allows highlighting the contribution of a particular factor. In this work, the fuel cost was placed at the main level of the hierarchy. For this reason, and also because of the calculation algorithm, the efficiency indicator for the same fuel differed by 1.2–1.4 times compared to the WSM and WPM.
Supplemental Material
sj-docx-1-wmr-10.1177_0734242X221127170 – Supplemental material for Multiple-criteria decision analysis to substantiate the prospects of industrial and solid municipal wastes as slurry fuel components
Supplemental material, sj-docx-1-wmr-10.1177_0734242X221127170 for Multiple-criteria decision analysis to substantiate the prospects of industrial and solid municipal wastes as slurry fuel components by Daniil Romanov, Ksenia Vershinina, Galina Nyashina and Pavel Strizhak in Waste Management & Research
Footnotes
Declaration of conflicting interests
The authors declared no potential conflicts of interest with respect to the research, authorship, and/or publication of this article.
Funding
The authors disclosed receipt of the following financial support for the research, authorship, and/or publication of this article: The study was supported by a grant from the Ministry of Science and Higher Education of Russia, Agreement No 075-15-2020-806 (Contract No 13.1902.21.0014).
Supplemental material
Supplemental material for this article is available online.
References
Supplementary Material
Please find the following supplemental material available below.
For Open Access articles published under a Creative Commons License, all supplemental material carries the same license as the article it is associated with.
For non-Open Access articles published, all supplemental material carries a non-exclusive license, and permission requests for re-use of supplemental material or any part of supplemental material shall be sent directly to the copyright owner as specified in the copyright notice associated with the article.