
Abstract
A 2-year monitoring campaign was carried out within the Marche Region (Italy) to quantify the potential still edible wasted food (seFW) within the sorted (seFWsorted) and unsorted (seFWunsorted) waste streams. Results were elaborated to estimate the distribution of seFW among the five provinces and the amount per capita. Results in terms of total quantities per inhabitants (seFWindex per capita) depict an important variability between districts but almost constant in years (26–38 kg/inhabitants in 2018 and 26–36 kg/inhabitants in 2019). Scores in Marche were then used to study the national situation, adopting the same percentage factors. Analysis was performed on 2019 data. Gradual colour shade was used to identify the Regions with greater seFW production potential. Worst scores are achieved by Lazio, Lombardia and Sicilia (red), followed by others classified as orange and yellow. More than 1.5 Mt potential seFW was estimated at national level, 29% of which is due to the unsorted fraction. Results at national level were used to assess the potential environmental impact related to seFW in terms of climate change. Carbon footprint indicator was quantified per capita (69 kg equivalent carbon dioxide (CO2e)/inhabitant/year in the case of Marche) and overall (3.5 MtCO2e). In addition, an evaluation of the potential economic implications related to the greenhouse gases emitted was made using the Social Cost of Carbon. Results showed that cost of the tCO2e global damage related to seFW in Italy ranges from 35 to 700 M$.
Keywords
Introduction
Food waste (FW) is certainly a problem of social nature, since it highlights a great inequality of resources distribution, considering that many people still suffer from hunger. Recent estimation (Food and Agriculture Organization of the United Nations [FAO] et al., 2021) has confirmed between 720 and 811 million people are suffering worldwide, trend which is expected to reach the dramatic value of 2 billion by the end of 2050 (SDG Tracker, 2018). Global Hunger Index (scores that comprise the prevalence of undernourishment, childhood wasting, childhood stunting and child mortality) highlights serious, alarming and extremely alarming situation in parts of Asia and most of Africa (Our World In Data, 2021).
In addition, FW has also significant economic and environmental implications, because it represents a wastage of valuable products and resources (land, water and energy), and both food production and biowaste management generate a significant impact (at least 1.9 tCO2e per tonne of FW; Bräutigam et al., 2014). In addition, recent research published by Cline et al. (2020) has demonstrated that FW provokes greater overburden pressures in landfills (1.27–1.86 tonne m−3). For these reasons, it is always been a topic of concern worldwide, but it gained more attention after the release of the Agenda 2030 (UN General Assembly, 2015). The Agenda has settled the commitment to halve FW at the retail and consumer level and to reduce food loss across supply chains (see Sustainable Development Goal (SDG) 12.3), to cut resources consumptions (SDG 12), damage effects on climate change (SDG 13) and contribute in promoting a zero hunger society (SDG 2). Preventing FW is also one of the priority areas that European Union (EU) identified within the Circular Economy Action Plan (European Commission, 2015) and the recent strategy called ‘Farm To Fork’ (European Commission, 2020).
Nevertheless, the quantity of FW still reaches significant values. In the United States, FW covers around 30–40% of the food supply (USDA, 2021). On World scale, it has been estimated that 17% of total food available to consumers was dumped in 2019 (United Nations Environment Programme [UNEP], 2021), corresponding to 931 million of tonnes per year. The 61% of the whole amount (570 Mt/year) was related to households, leading to an average of 74 kg per capita of FW each year (UNEP, 2021). Trend at EU level is depicted in Figure 1 in terms of FW along with supply chain (a) and FW by food category (b).
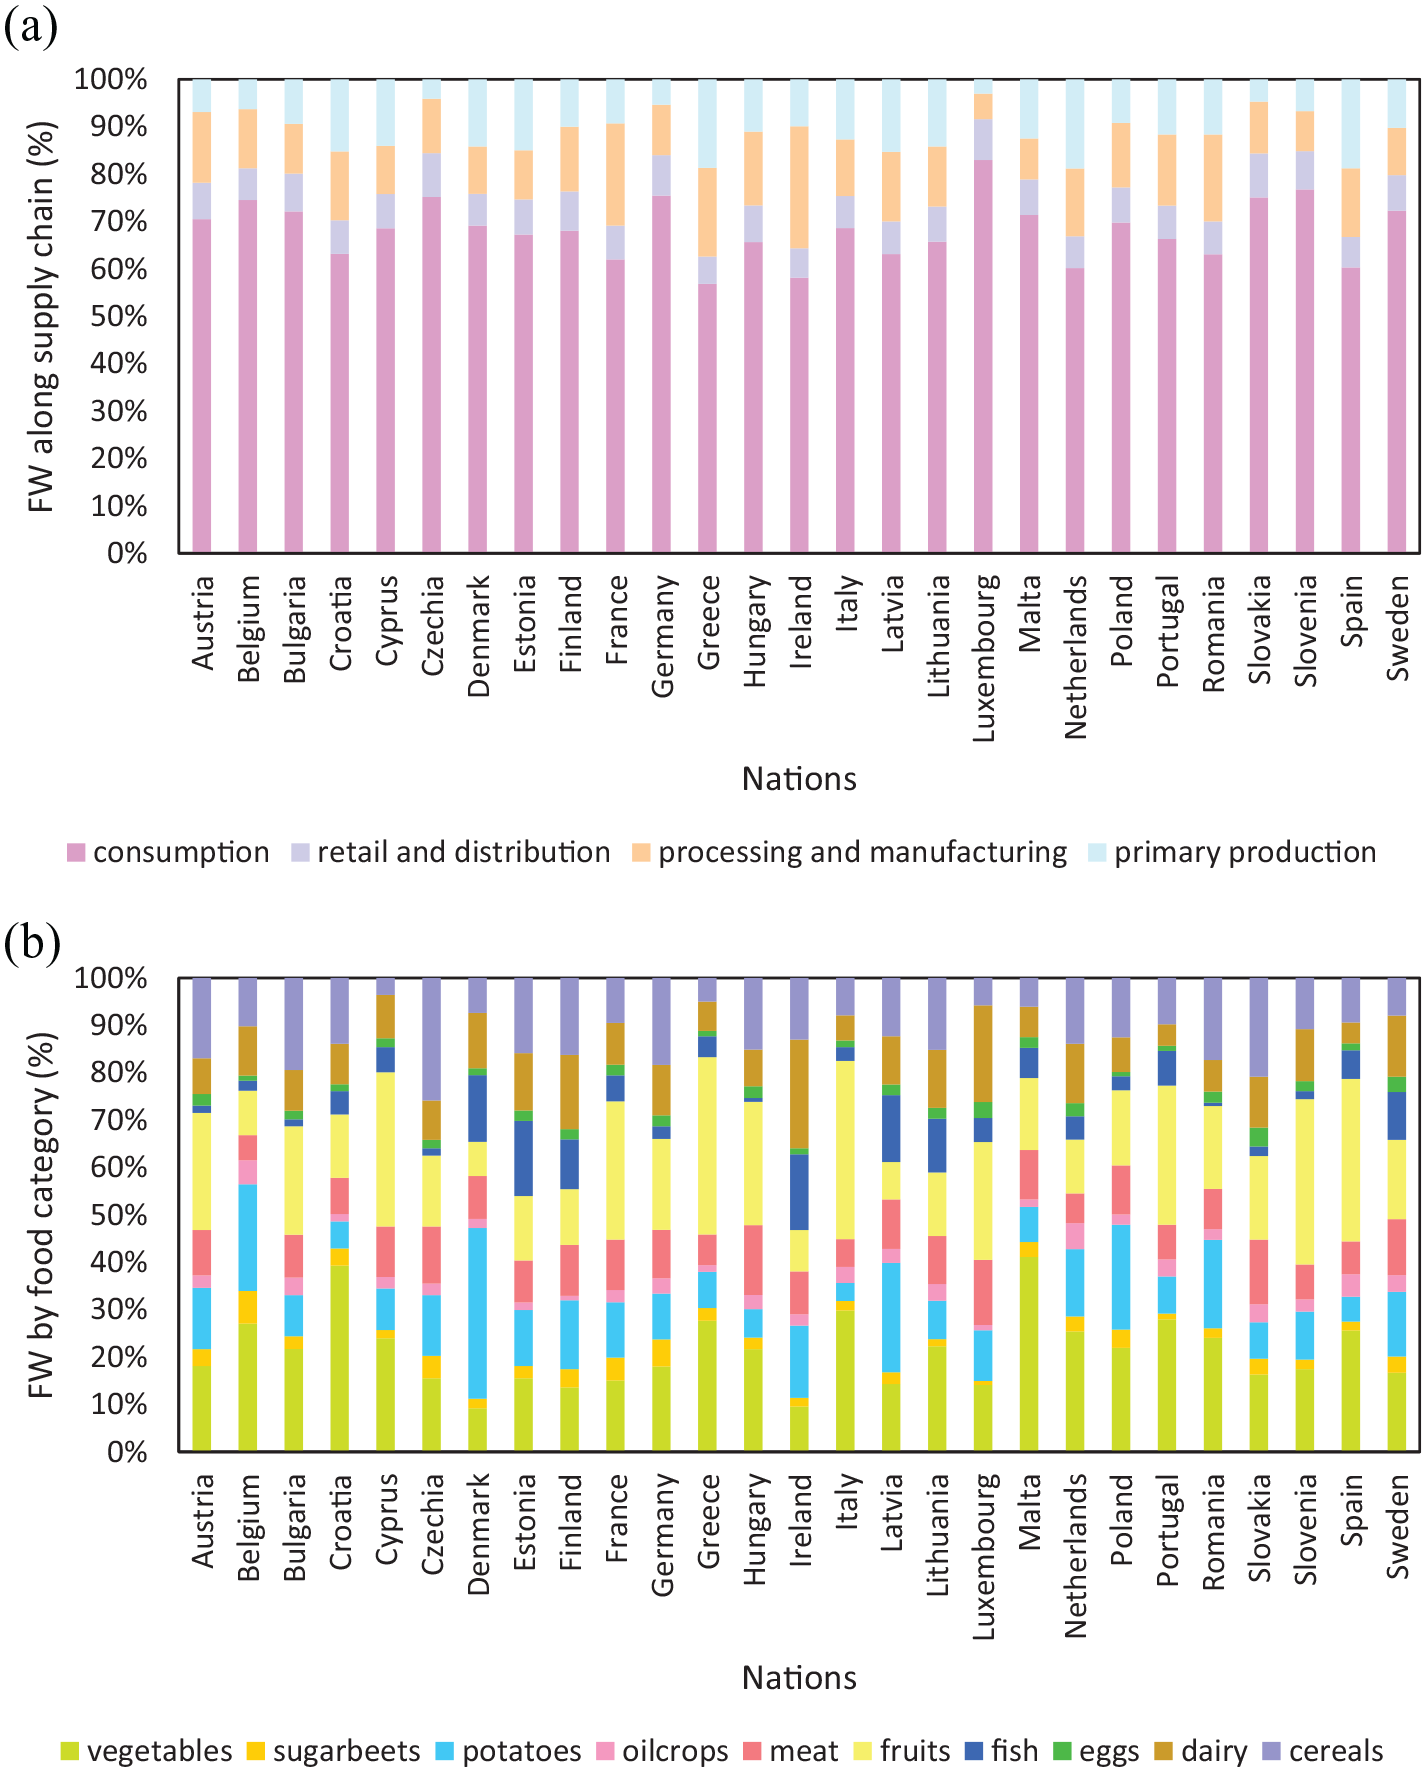
FW along supply chain in EU, data from year 2017 (a); Food waste by food category in EU, data from year 2017 (b). Adapted from EU Bioeconomy Monitoring System dashboards, Knowledge Centre for Bioeconomy (Source: https://knowledge4policy.ec.europa.eu/visualisation/eu-bioeconomy-monitoring-system-dashboards_en).
Graphs are adapted from indexes derived by the strategy ‘Farm To Fork’ (European Commission, 2020) and they refer to 2017 data. At communitarian level, an average of 67% of FW is produced by consumers. Worst results are achieved by Luxemburg citizens with 83%. Italians have their relevance on such regrettable record with an estimated amount of more than half a kilo of FW per capita per week (0.529 kg in 2020 and 0.595 in 2021 of FW per capita per week, around 28–31 kg per capita in a year; Waste Watcher International Observatory, 2021, 2022), corresponding to 68% of FW produced during consumption, above the EU average. At EU level, vegetable and fruit categories together represent almost the 50% of total FW, followed by cereals (12%), potatoes (11%), meat (9%) and dairy (8%). The rest is <5%. In Italy, vegetables and fruits achieve almost 70% of the total FW, followed by cereals (8%), meat (6%) and dairy (5%). The rest is <5%. Results seem to be line with those obtained by other studies already conducted in Italy (Gaiani et al., 2018; Scalvedi and Rossi, 2021; Setti et al., 2016).
For these reasons, the issue of FW is largely debated in the literature leading to an exponential increasing trend in the number of publications since 2015, as shown by recent manuscript (Giordano and Franco, 2021): +1543 publications in 10 years (2010–2020) related to the issue of FW. Research, performed through Scopus database by searching for the term ‘food waste’ and limiting the results to social science, business, economics and agriculture, has revealed 443 publications in 2010 and 1986 in 2020.
Several waste composition studies (Lebersorger and Salhofer, 2003; Monier et al., 2010; Salhofer et al., 2008; WRAP, 2008) have confirmed the increasing trend in the FW quantities, leading to the conclusion that the potential for waste prevention is unquestionable (Lebersorger and Schneider, 2011).
However, too often the estimation of the FW amount in different countries only relies on surveys carried out among consumers (Elimelech et al., 2019; Falasconi et al., 2016; Giordano et al., 2018, 2019; van Herpen et al., 2019; Visschers et al., 2016). Questionnaires as well as FW diary using the consumer self-assessment method (Langley et al., 2010) are very useful tools for testing citizens confidence with the issue of FW and, at the same time, to raising campaigns and interventions able to fight it (Reynolds et al., 2019; Soma et al., 2020; van der Werf et al., 2021). In addition, surveys allow researchers a great autonomy (Giordano and Franco, 2021): they can collect and elaborate large amount of data quite easily and in a reduced time period.
Therefore, the use of surveys may have strengths (e.g. availability of FW composition, low costs, larger sample size, data on respondents that are not felt, observed or judged by researchers) and weaknesses (e.g. low response rate, underestimation on self-reported FW quantities, tendency in giving socially desirable responses) as well and are summarized in the recent literature (Gaiani et al., 2018; Withanage et al., 2021).
To our knowledge, as also reported by Lebersorger and Schneider (2011), no standardized methodology exists to quantify FW and avoidable FW at international level. The same for the Italian scale (Grosso et al., 2019). However, several studies were already performed to investigate the national situation using surveys (Amicarelli and Bux, 2021; Falasconi et al., 2016; Gaiani et al., 2018; Giordano and Franco, 2021; Giordano et al., 2018, 2019; Grosso et al., 2019; Lanfranchi et al., 2016; Last Minute Market and SWG, 2016; Pappalardo et al., 2020; Piras et al., 2022; Principato et al., 2015; Rodgers et al., 2021; Scalvedi and Rossi, 2021; Secondi et al., 2015; Setti et al., 2016; Vittuari et al., 2021) and qualitative–quantitative approach through waste composition analysis at treatment facilities (Grosso et al., 2019). The latter approach is quite similar to that performed by some Environmental Protection Agency at regional scale (e.g. Marche).
In our opinion, more confident results may be achieved by integrating surveys with results from primary investigation campaigns about the FW handled by the various treatment plants. Surveys and waste composition analyses are not in contrast, but should be considered as two different approaches that may be combined. The first is more oriented top-down approach, which allows to investigate higher numbers at the same time. The latter is more oriented on quantitative data following a bottom-up approach. In fact, introducing a quantitative score to measure the potential tonnes of wasted food may also be an important key performance indicator for the environmental management system of the municipalities (European Commission, 2009; ISO, 2015).
Therefore, in this paper, we present results from a 2-year monitoring campaign carried out within the Marche Region (Italy). The aim of the study was to quantify an average amount of the potential still edible wasted food (seFW) within the sorted biowaste (organic waste (OW) derived from kitchen and canteens, EER 200108) and unsorted waste (EER 200301) fractions in the Region and then evaluate the extension of such index (seFWindex) at national scale. The term seFW refers to food (fresh and prepared) that still fit for consumption since in good quality, but intentionally wasted by citizens before or after the expiring date. Therefore, the acronym includes all food types (vegetables, meat, milk and derivates, cereals and derivates, etc.) and forms (solid, liquid, semi-solid, dried, in powder, etc.), with or without primary packaging. In seFW, visibly spoiled food was also included, since it would help in understanding the amount of food bought by citizens and not eaten. On the other hand, seFW does not take into account partially consumed food (whose contribution is negligible) and all the non-edible rests (e.g. bones, peels, shells, etc.) derived from any kind of preparation. These latter parts fall into the OW. The idea to investigate the seFW fraction seems to be also in line with the results of previous campaign conducted in Italy that confirms that 43% of all disposed FW corresponds to food not used at all (such as, unopened packages) followed by food partly consumed (30%, Scalvedi and Rossi, 2021). Therefore, it is clear that seFWindex could be introduced to monitor citizens’ and companies’ behaviours with the goal of setting targets for improvement. As stated above, the methodology here proposed follows a bottom-up approach, since it represents a direct monitoring of seFW from waste composition analyses. The expected result is that values obtained from the campaign may become available for comparison with those from other evaluation (e.g. top-down). In addition, quantitative amounts of seFW could be also used to improve and integrate questionaries by making stakeholders more conscious of the potential benefits related to the avoided wasting of seFW (e.g. kgCO2e) and designing strategies discouraging non-ethic conducts.
Materials and methods
The Marche is a Region located on the east coast in central Italy (Supplemental Figure S1) with a population of around 1.5 million people, distributed in five districts (the so-called provinces): Ancona (AN), Ascoli Piceno (AP), Fermo (FM), Macerata (MC) and Pesaro-Urbino (PU). The reduced number of inhabitants and the introduction of new strategies of gathering have led to redouble the separate waste collection ratio during the last 10 years. The most important innovation has been the introduction of the door-to-door collection strategy aimed to encourage citizens in performing the correct way to separate household waste. Results of the door-to-door campaign were impressive. Regarding the organic fraction, only nine municipalities on 228 (4%) do not have a separate system to collect OW, around 5000 people corresponding to the 0.3% of the whole (data elaborated by ARPAM – Agenzia Regionale per la Protezione Ambientale Marche). This led to a sensible decrease in the total waste production in the Region during the last 10 years (2011–2020), switching from 793,210 tonnes down to 755,494 tonnes, more than 37 kilotonnes of household waste were avoided (data elaborated by ARPAM).
Similar trend was obtained for the organic fraction. Looking at the data from household kitchen and canteens (EER 200108) depicted in Supplemental Figure S2, a sensible increase in the amount of organic fraction collected per capita occurred leading to an average +47% in the Region (109 kilotonnes in 2011 and 160 kilotonnes in 2020). Absolute results per each province are reported in Supplemental Table S1.
As stated, pictures and tables cited above show a substantial increase in the volume of the collected waste, which implies a reduction in the fraction landfilled. However, such figures do not inform on the amount of the seFW. Therefore, in line with the Agenda 2030 goals, the regional Environmental Protection Agency (ARPAM) has considered appropriate performing an analysis campaign to investigate the average regional amount of seFW within the Region (seFW full definition reported in the introduction). A 2-year campaign (2016–2018) was performed with the goal of obtaining quantitative data to support the Governance in designing direct and indirect mitigation strategies. 2019 campaign was not performed due to some re-organization reasons. On the contrary, 2020 campaign did not occurred due to the ongoing COVID-19 pandemic.
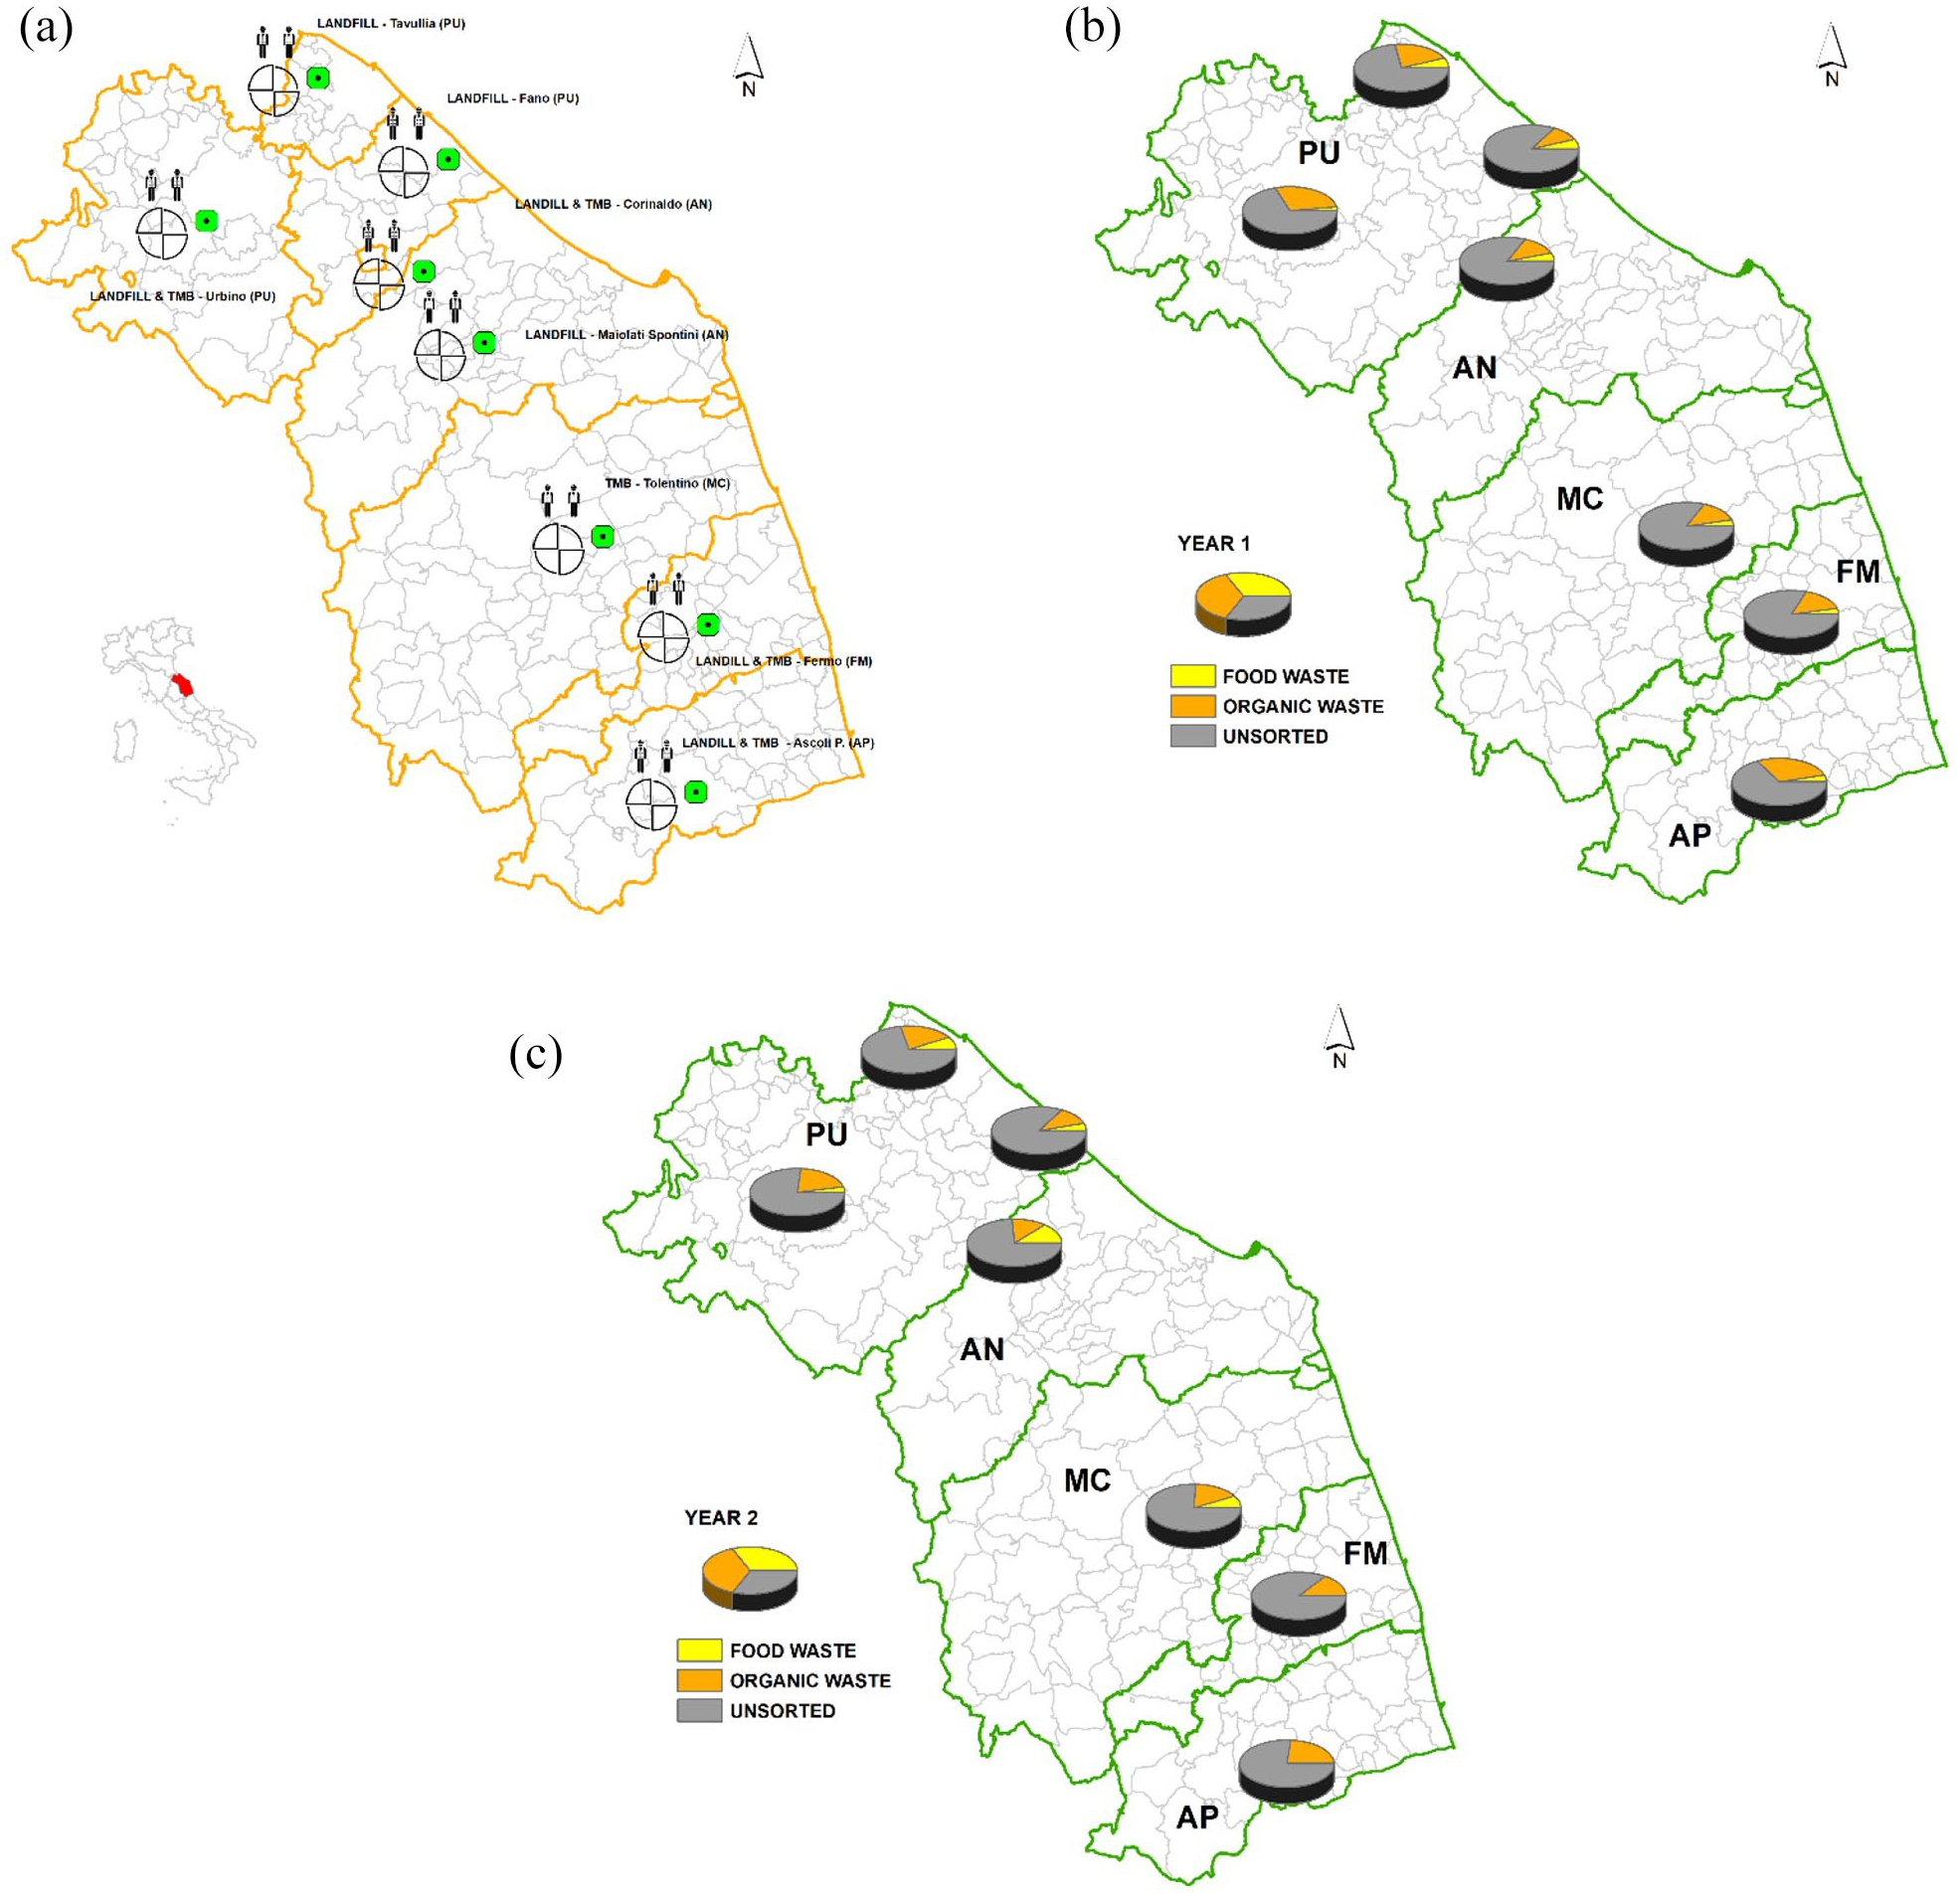
Figure 2 describes, in brief, the methodology adopted in the study. Green boxes (included within study boundaries, pink lined frame) represent the work carried out in this research. After unsorted wastes are disposed, ARPAM technicians have worked to collect representative samples per each catchment area through quartering according to ANPA (2000) This procedure was performed manually (through visual and manual selection) to differentiate all the waste categories. The procedure described in next paragraph was adopted to estimate the amount of seFW in the unsorted fraction (seFWunsorted) and within the organic fraction (seFWsorted). The sum represents the total amount of still edible food discharged by citizens within the Marche Region (seFWindex, equation (1)). These indicators were then used to estimate trend in other Italian Regions:
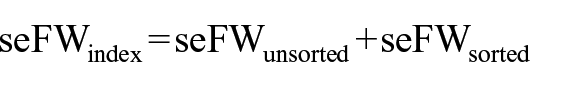
In equation (1), seFW is expressed in mass.
Flow sheet of the unsorted waste path, from generation to the analysis of FW fraction at the disposal site. Green boxes (included within study boundaries, pink lined frame) represent the work carried out in this research.
Red lines in Figure 2 correspond to the areas for future improvement. seFWindex may be used as a benchmark to implement surveys and then strategies to be shared with the community to work on the reduction of such problem. As suggested in the literature (Lebersorger and Schneider, 2011), the full methodology is presented later to help third parties to adopt the same strategy or to work to improve it.
Catchment areas and sample preparation
Eight catchment areas within the Marche Region were selected during the first year (Y1) and seven in the Y2, since two waste treatment facilities operating within the AN district were unified. These catchment areas consist of landfill and mechanical–biological treatment plant dislocated along the Region. All the catchment areas were selected to cover the entire regional surface. Per each catchment area representative samples were obtained. This procedure was carried out considering the waste produced by selected municipalities, which were identified on the basis of three different criteria:
Number of people and population density, to include both small and big towns. Demographic representativeness.
Waste collection system, to cover all the different methodologies implemented within the Region such as doorstep collection, community depots and road bins. Technological representativeness.
Territorial altitude, to take into account several cultural behaviours and accessibility of vehicles (plain, hill and Apennine zones). Geographical representativeness.
The selected areas in the study were as follows:
Catchment 1_Tavullia (PU)
Catchment 2_Urbino (PU)
Catchment 3_Fano (PU)
Catchment 4_Corinaldo (AN)
Catchment 5_Maiolati Spontini (AN)
Catchment 6_Tolentino (MC)
Catchment 7_Fermo (FM)
Catchment 8_Ascoli Piceno (AP)
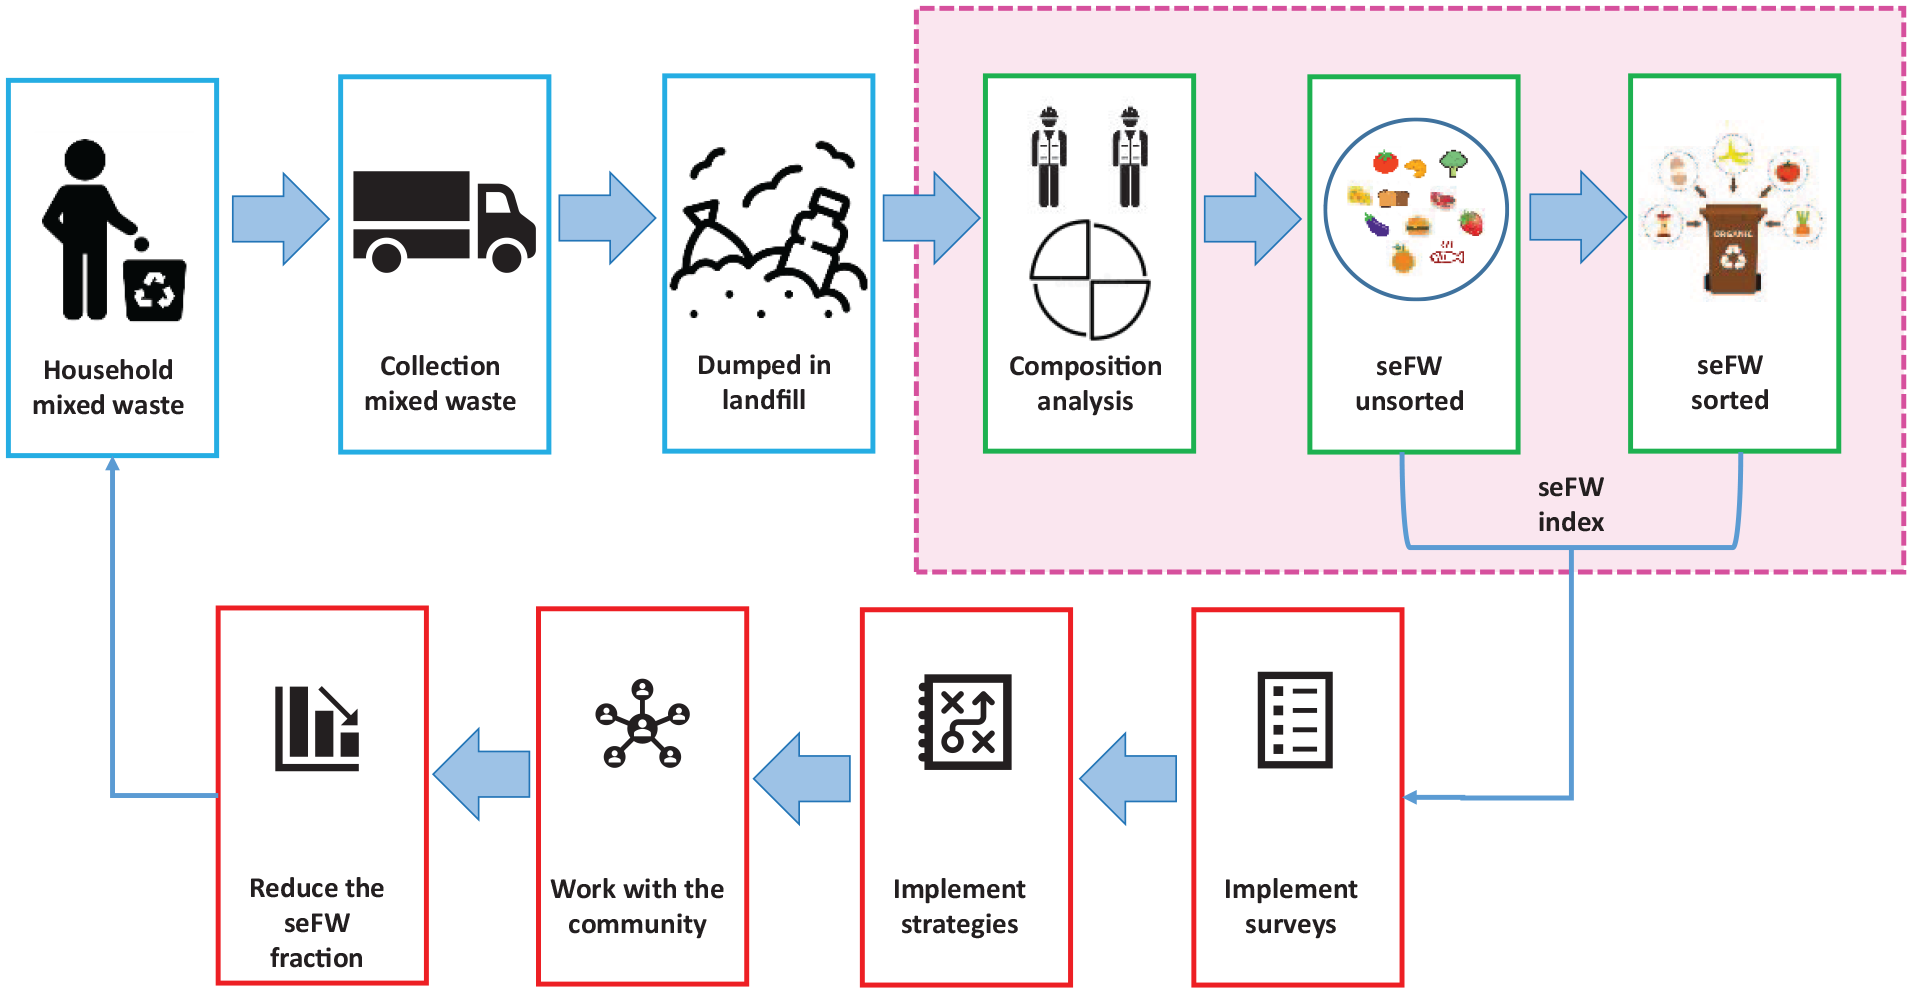
Figure 3 shows the location and distribution of the catchment areas selected in the study.
Selected catchment areas per year, with the percentage of FW and organic fraction. Location of each catchment area (a); Distribution of the waste composition analysis, Year 1, per catchment area (b); Distribution of the waste composition analysis, Year 2, per catchment area (c).
Different from a top-down approach, a waste composition analysis implies physical resources onsite (i.e. technicians and machineries), not always available due to their involvement in other activities. Therefore, to reduce time and costs, the sampling procedure was condensed by collecting only one sample per area of analysis. A manual quartering procedure was performed to prepare representative samples (Supplemental Figure S3). Quartering was carried out by two technicians on closed bin bags by the use of a wheel loader (model L110H, L120H; Volvo Construction Equipment; Volvo C.E. Italia S.p.a., Via Dell’Industria, 8, 20074 - Carpiano (MI)) to create a waste round platform denominated ‘cake’, with 5 m of diameter and 80 cm high. The choice of performing quartering on closed bin bags has also contributed in minimizing likelihood of breaking and mixing the FW. In addition, one technician audited the entire process, while the other handled the wheel loader. The cake created was then divided into four quarters clockwise numbered. The operators have discarded first and third and mixed second and fourth quarters. A new cake was generated which weights half than the first. Quartering procedure was then repeated to obtain the final samples of 77–185 kg each, in line with ANPA (2000). Exact values per each sample are shown in Supplemental Table S7.
Once ready, final samples were used to quantify the seFW within the samples of unsorted waste (seFWunsorted). Figure 4 depicts the whole procedure, described in detailed below, which was applied for each sample and catchment area.
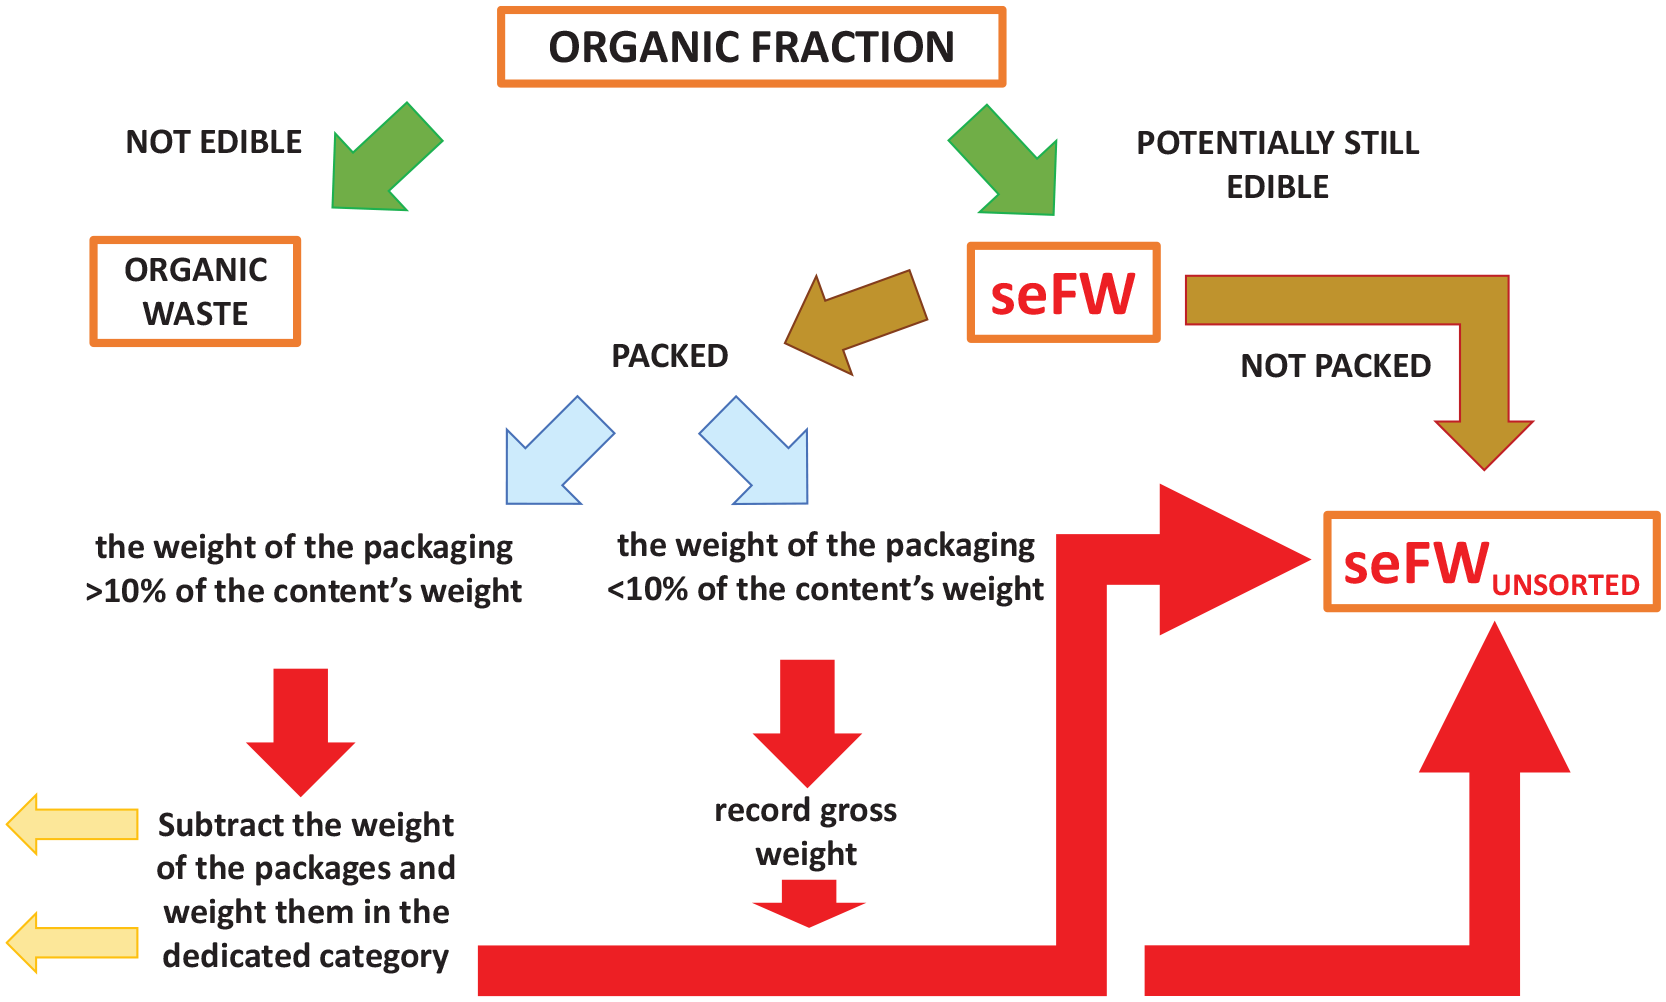
Estimation of the seFWunsorted.
To identify the seFWunsorted amount, a waste composition analysis was performed through manual selection. This procedure allowed to split the sample content into 18 waste fractions (metallic packaging, metallic goods, plastic packaging and plastic goods, wood packaging and wood goods, wood from garden and parks, graphic papers, cellulosic packaging, WEEE, dangerous waste (as medicinal and batteries), diapers and absorbent material, inert waste, glass, glass packaging, organic, multilayer packaging, textile, mixed waste with diameter <2 cm, rest derived from sorting). Among these, the organic fraction was then divided into two sub-categories: seFWunsorted and the OW. As suggested in the literature (Lebersorger and Schneider, 2011), none screening through sieving was performed to reduce error in waste composition. Some examples of seFW found during the analysis of the unsorted waste are shown in Supplemental Figure S6. In particular, we found vegetables (e.g. fava beans, salad, onion, fennel, tomato, apple, oranges, potatoes, cabbage, eggplant, zucchini and tinned chickpeas), pasta and bread (e.g. common bread, stuffed sandwich, breadsticks, biscuits, pasta, piadina and crackers), meat and fish (e.g. cured meat, salami, frankfurters, steak and canned tuna) and beverage (e.g. orange juice, milk and sodas).
The seFW fraction was then split into packed and not packed. The fraction without packaging was collected in a separated plastic crate and then weighted by the use of an industrial basic balance, the same adopted for other mass measures within the study (model IND22; METTLER TOLEDO; Mettler-Toledo S.p.A., Via Anna Maria Mozzoni 2/1, 20152, Milano). On the other hand, the packed fraction was sub-divided into seFW with a packaging weight >10% of the content’s weight and seFW with a packaging weight <10% of the content’s weight. In the first case, technicians have measured the gross and net weights of the packaging flows to address the exact amount of seFW. In the latter case, the packaging weight was considered negligible (e.g. plastic film in 500 g pasta pack) and the whole items were weighted and the results were collected as seFW. The sum of these two streams represents the so-called seFWunsorted index. Results of the analysis are shown in Supplemental Table S2. Data on composition for 2019 represent weighted averages between 2016 and 2018 results. Percentages for the years 2018 and 2019 were then used to estimate the total amount of seFWunsorted (in kg) within the Marche Region (Supplemental Table S3). Percentages, per catchment area and year, were combined with the municipal unsorted waste generated per province in both years (direct communication by the Italian Institute for Environmental Protection and Research – ISPRA). Results (in tonnes) are reported in Supplemental Table S3. To investigate the pre-disease trend in the Marche Region, data from 2018 and 2019 were selected. They represent the last available results on waste management before the ongoing COVID-19 pandemic and, therefore, not affected by fluctuations that are shown in Supplemental Figure S5 and Table S4. In fact, a decrease in the organic and paper fractions is depicted between 2019 and 2020. Main reason could be the national lockdown which implied lower amount of wasted food and a decrease in the usage of office paper. This trend is also confirmed by international peer review literature. Amicarelli and Bux (2021) have found an average −30% on Italian values during lockdown; Pappalardo et al. (2020) have shown about 33% of the sample reported a substantial decrease in the FW amount (16% decreased mildly). Vittuari et al. (2021) have found that 51.6% of respondents stated that they wasted less food during the quarantine, with respect to the previous period. Similar results were also founded on international scale in the case of Japan, Spain, Brazil and the United States (Qian et al., 2020; Rodgers et al., 2021; Schmitt et al., 2021; Vidal-Mones et al., 2021) On the other hand, glass fraction is increased. Lockdown, again, could represent a valuable reason since Italians may have privileged long-life food. Looking at the overall municipal solid waste trend, the effects of the 2008 economic crisis have been reflected on the total urban waste from 2011 up to 2015. They grew up again in 2016–2019. On 2020, a sensible decrease in −4% was detected due to the ongoing pandemic situation.
Amount from Supplemental Table S3 was then normalized using the number of inhabitants per province (see data for 2019 in Supplemental Figure S1). Results per capita (kg/inhabitants) are depicted in Supplemental Figure S4 and Table S5. To estimate the seFWindex within the Marche Region, quantitative values of the sorted fraction are needed. However, they were not available: the analysis was not performed on the OW sorted, since it is not requested by the authorities. Therefore, to obtain a potential estimation of the seFWsorted, it was assumed that the total amount of seFWunsorted (equal to the sum of the single value found per sample, 65 kg) corresponds to the total seFWsorted. Thus, average percentage indexes for the sorted and unsorted (seFWorg.frac.% and seFWunsorted%) were then calculated for the Marche Region. Values are shown in Supplemental Table S7. This assumption is supported by the fact that citizens behaviour in terms of wasted food is not necessarily affected by the type of waste collection chosen to landfill, but it is related to other variables in upstream (e.g. income, cultural level, sensibility to such issue). As already reported in the literature (Bernstad Saraiva Schott et al., 2013), percentages of FW in separate collection and mixed waste are almost constant. Therefore, it is plausible to suppose that within the Marche Region similar amount (kg) of food is wasted within the sorted collection. The seFWorg.frac.% is then used to estimate the potential total amount of seFW in kitchen biodegradable waste for the years 2018 and 2019 (seFWsorted). Values are first evaluated in absolute terms per catchment area and then seFWsorted per capita (kg/inhabitants) were calculated. Average results are shown in Supplemental Table S8. Figure 5 depicts the results in terms of seFWindex showing the contribution of the seFWsorted and seFWunsorted fraction, per both years studied.
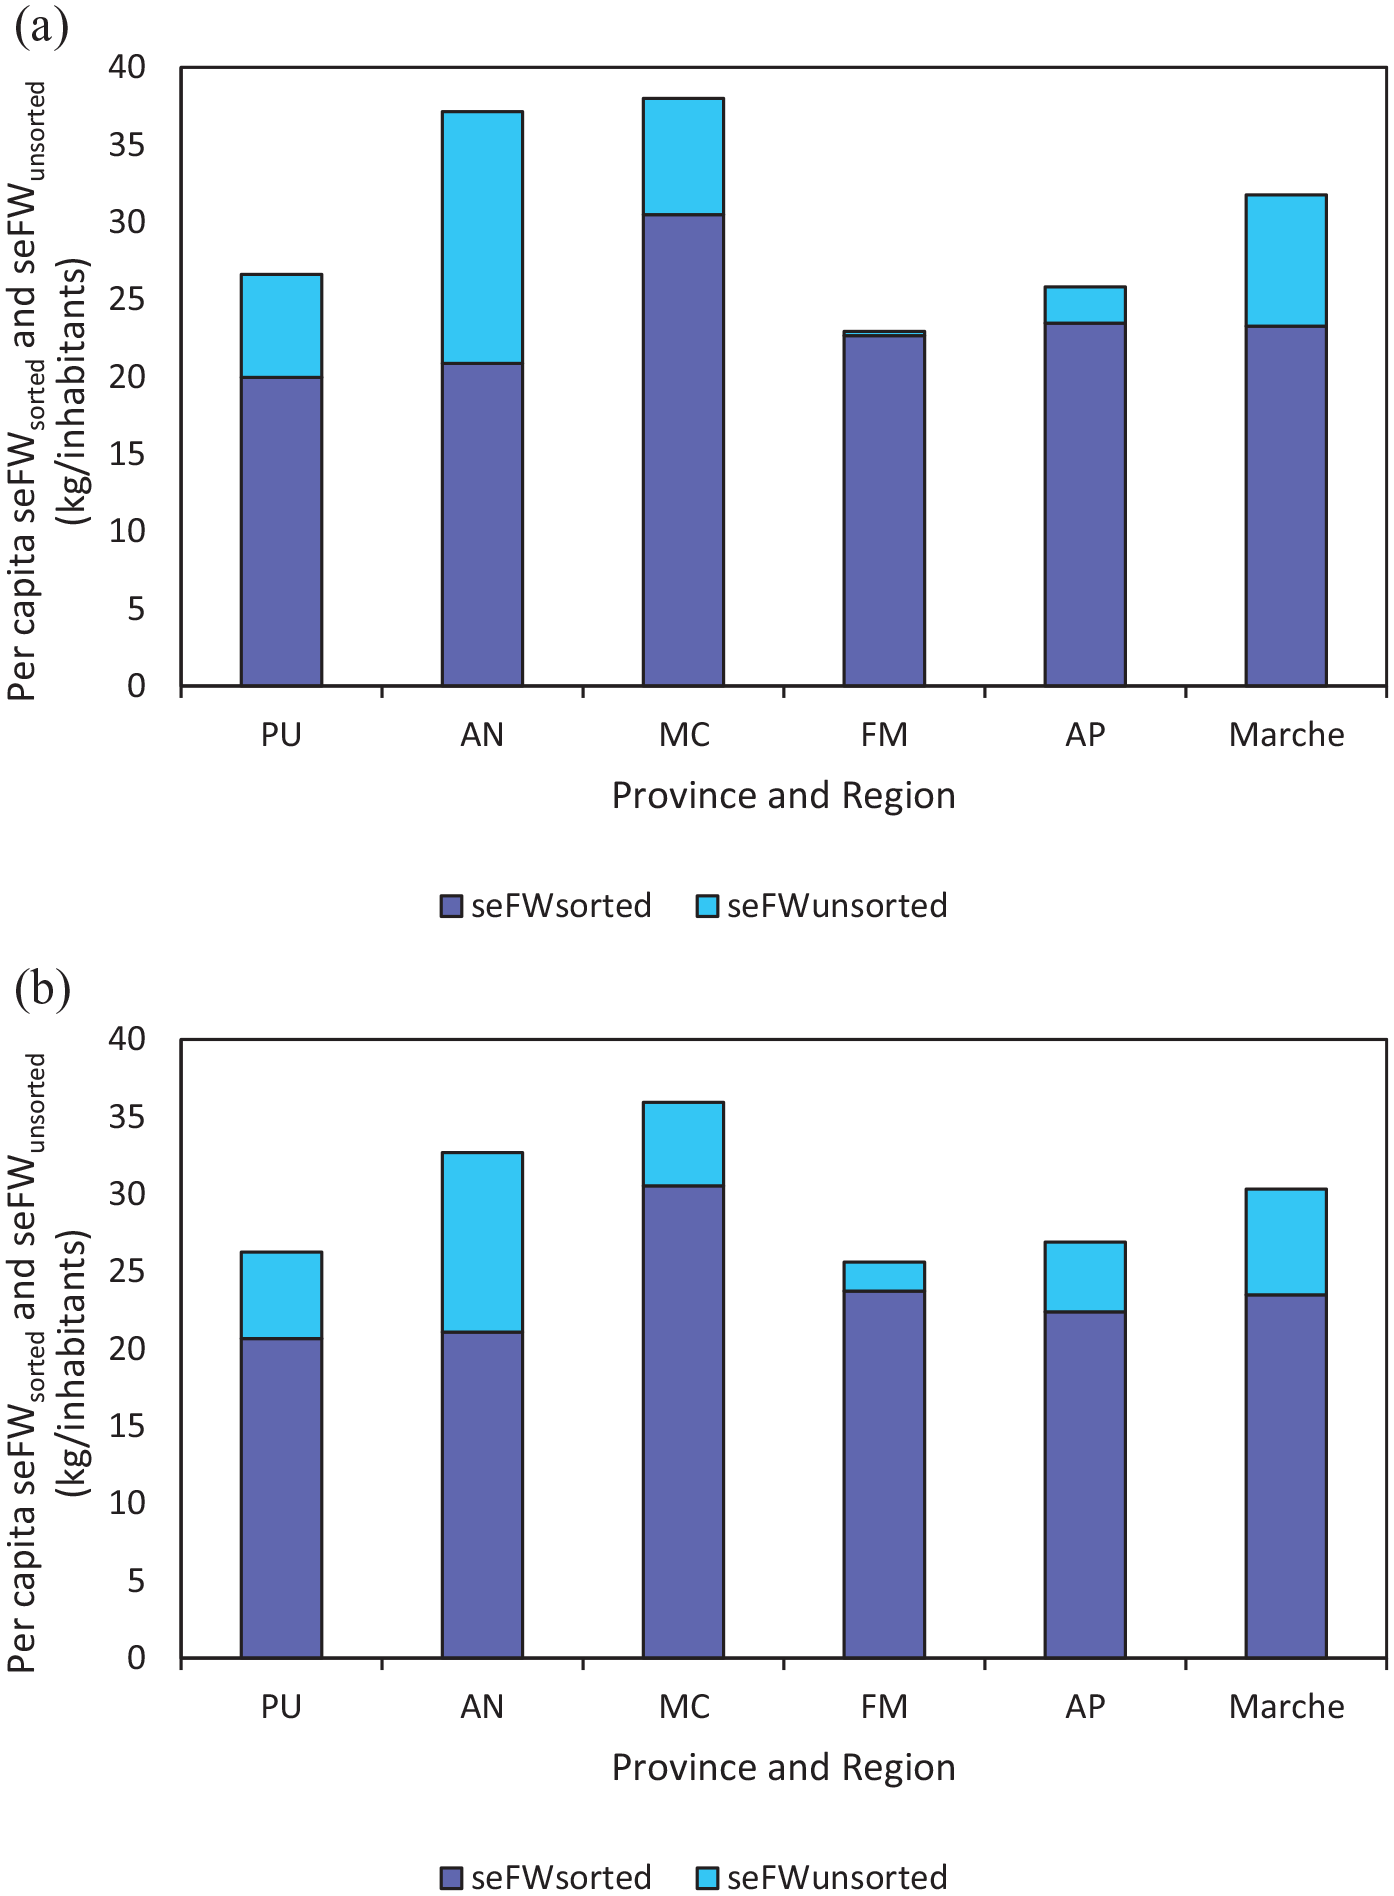
seFWindex per capita, per province and cumulative: (a) year 2018 and (b) year 2019.
Application at national level
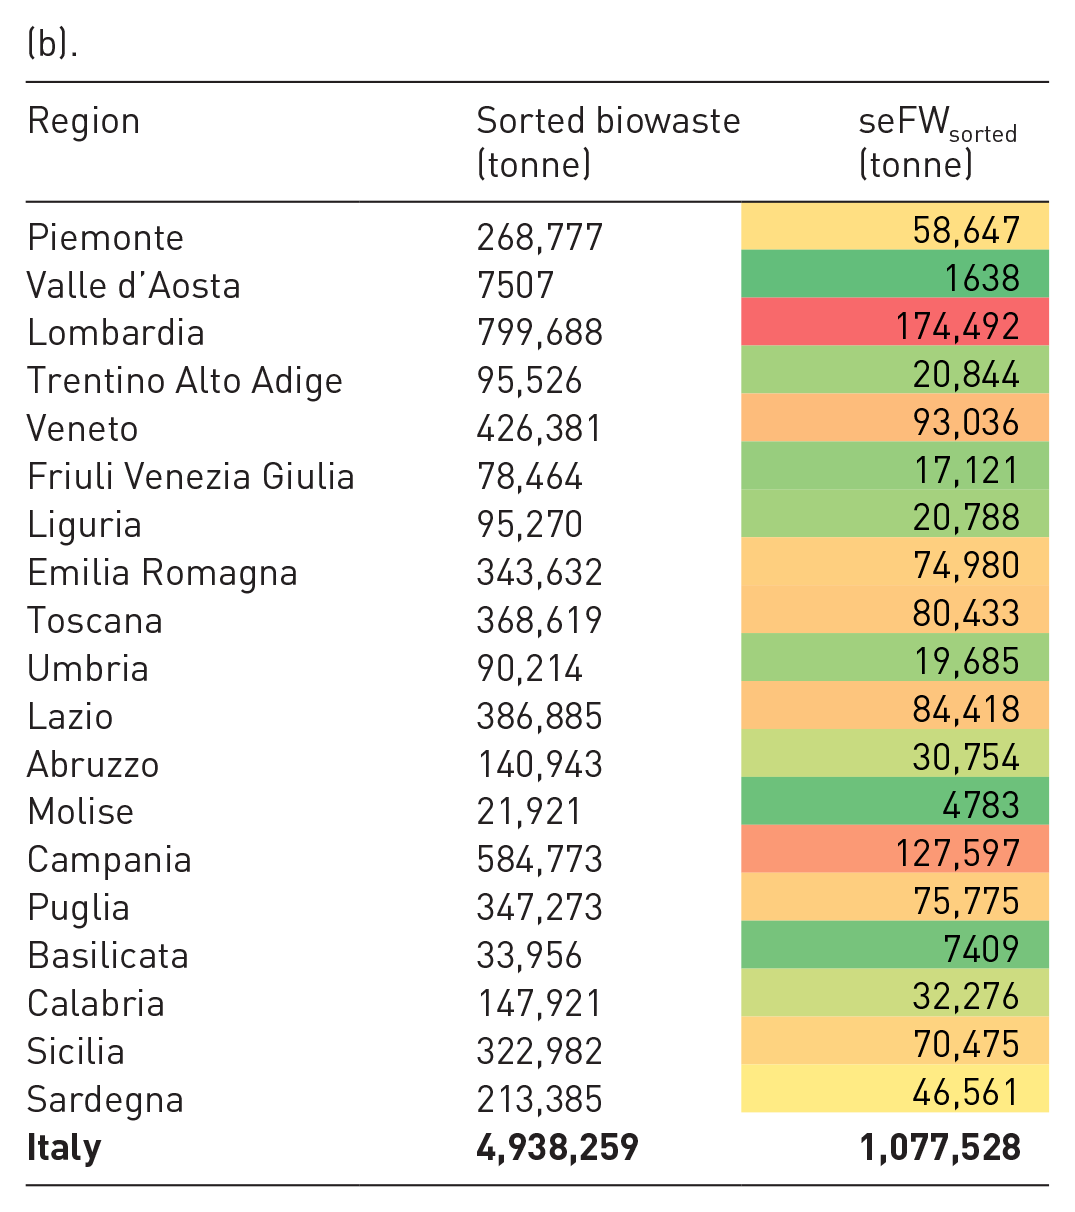
After completing the analysis at initial regional level, the resulting values were applied to the other Italian Regions. Urban waste generation 2019 data were communicated directly by ISPRA. Thus, the same methodology applied before was followed by assuming the percentage parameters remain constant. A linear extrapolation was adopted by assuming the same percentage of seFW (sorted and unsorted) is produced among the Regions. Despite the fact the literature (Waste Watcher International Observatory, 2022) has shown that FW produced in Italy varies between North (−12% vs average), Centre (−7% vs average) and South (+18% vs average), our estimations were maintained constant to not introduce a further source of potential error. As reported in a previous study (Falasconi et al., 2019), values obtained are not intended as a reliable proxy for the real national situation. On the contrary, they should be used to make citizens more conscious of the potential impacts and benefits of their behaviour at home. The seFWunsorted% was combined with the total amount of unsorted mixed waste (EER 200301) generated in each Region to estimate the absolute values (Table 1a). The same procedure was extended to the sorted biowaste fraction (EER 200108) using the seFWorg.frac.% (Table 1b). Per capita amounts were also evaluated and the tendency is shown in Figure 6.
seFW values from unsorted (a) and sorted (b) municipal waste in Italian Regions. Data: year 2019.
(a).
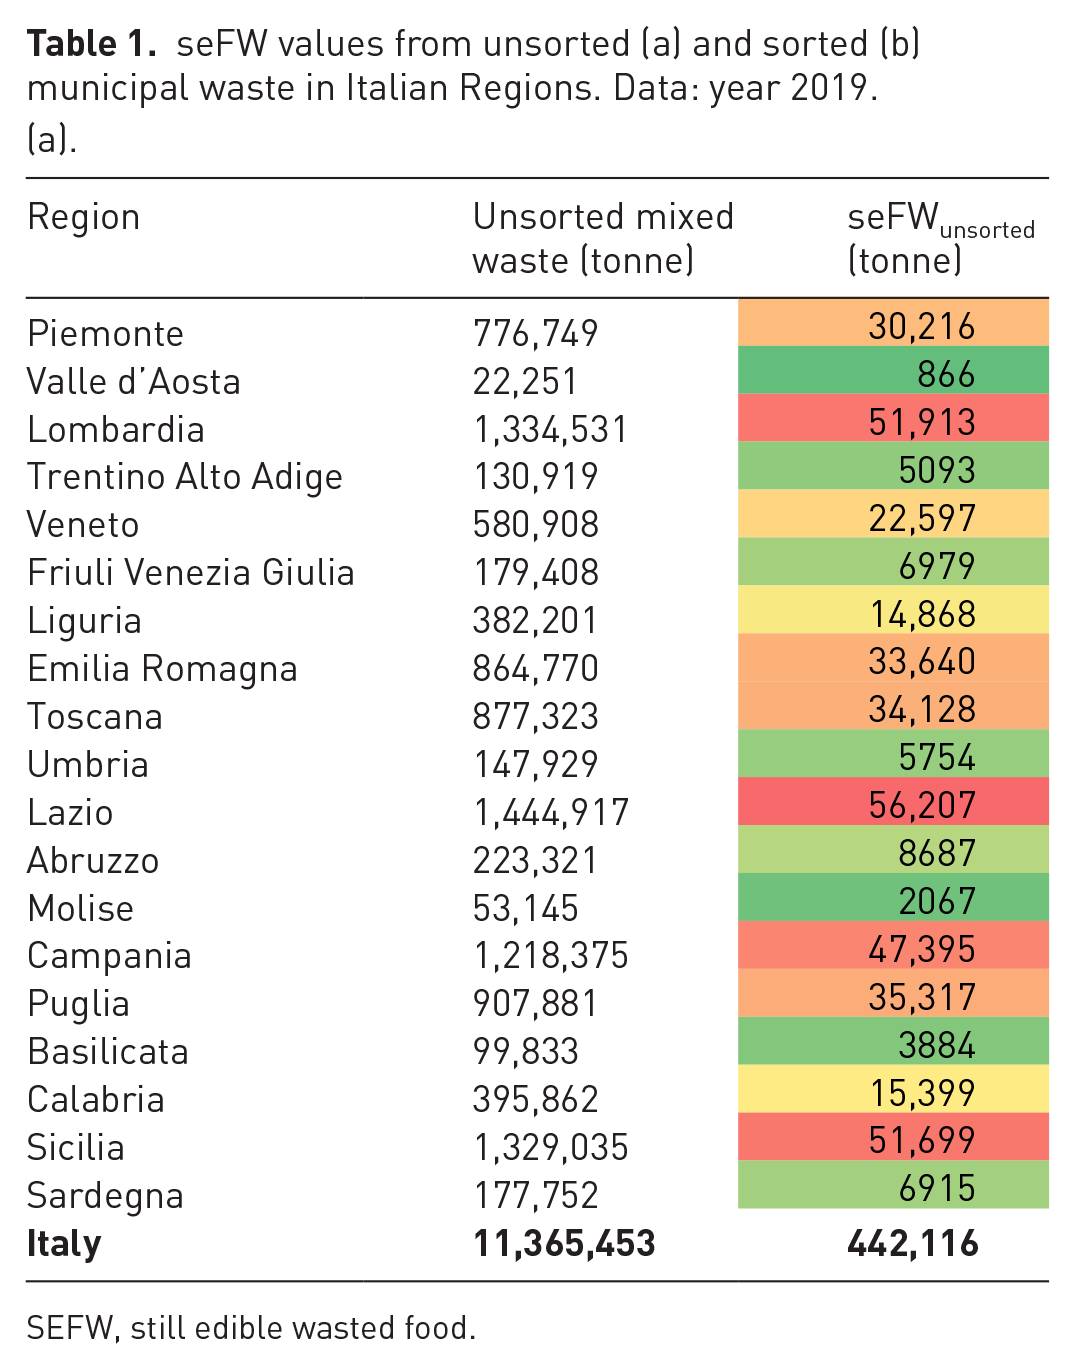
SEFW, still edible wasted food.
(b).
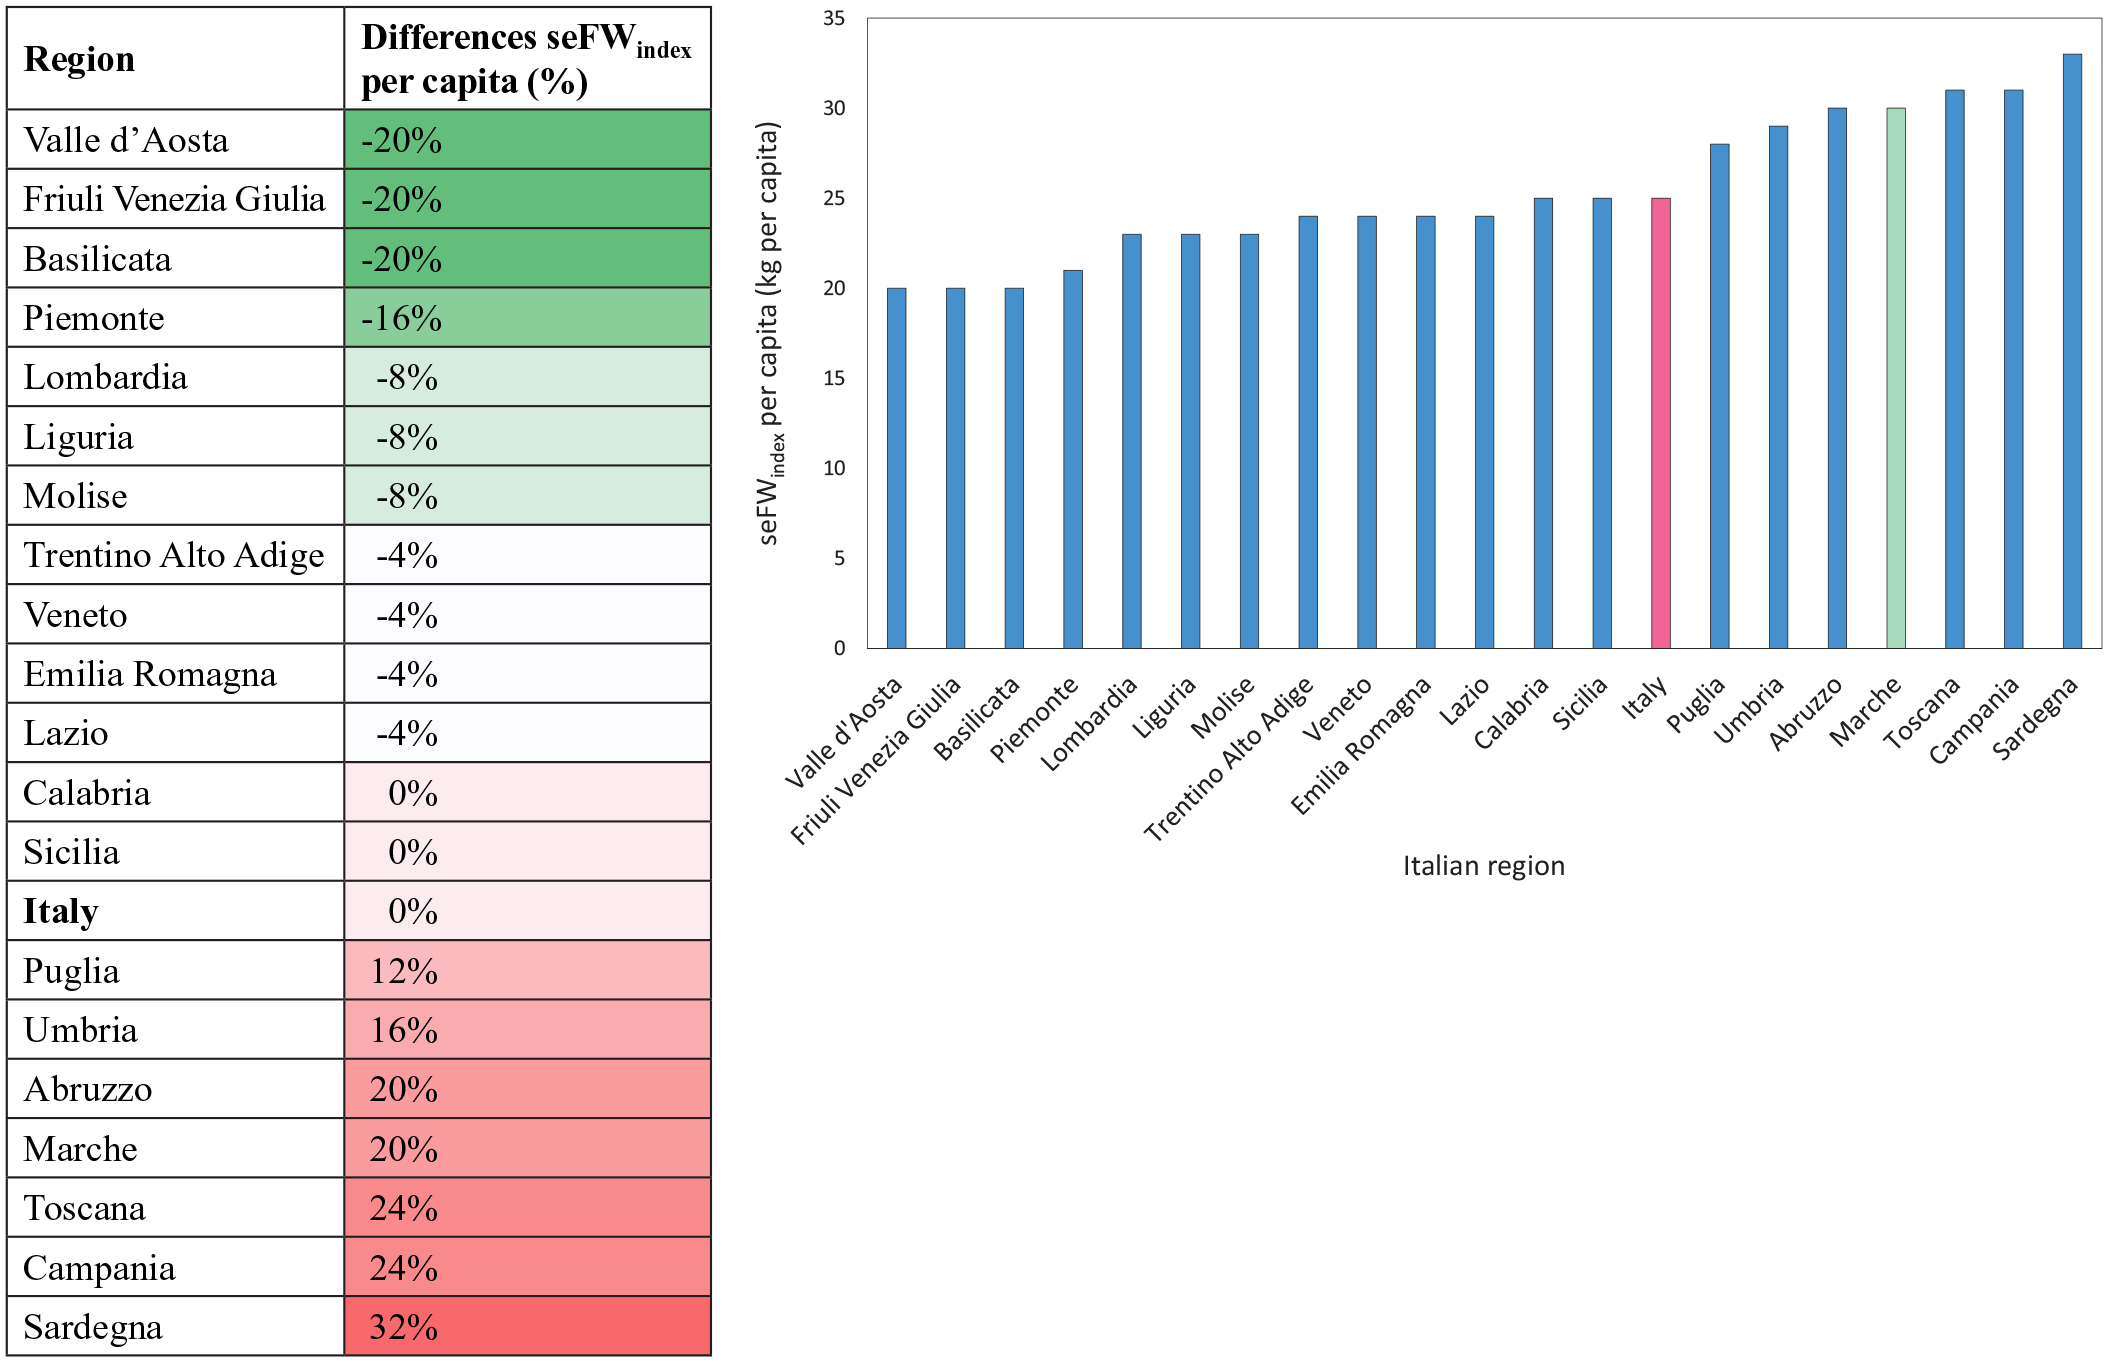
seFWindex per capita at national level. Data: year 2019.
Environmental and economic assessments
An estimation of the potential environmental and economic impacts related to seFW was performed. This choice was made based on the relevance of the environmental issues concerning the agri-food systems and consistently with previous FW impact assessments on a global scale and national scale (FAO, 2013; Grosso et al., 2019). The environmental impact assessment has focused on climate change potential only, by expressing the results in terms of carbon footprint. Mass of CO2e is used as an indicator. This impact category is not comprehensive of all the impacts derived from the agri-food sector (e.g. land occupation, water use and pollution, biodiversity loss, soil degradation, deforestation and others). However, CO2e was selected as it is user friendly and worldwide recognized as an indicator to have a first benchmark on the environmental sustainability of the system under study. Estimates obtained by Grosso et al. (2019) were followed, because of their affinity in terms of final aim, methodology (waste composition analysis) and setting (Italy). Researchers performed a full life cycle assessment (ISO 2006a, 2006b) including all the food supply chain phases and their relative impacts, from agricultural production to domestic consumption and final disposal. Based on the mentioned methodology and according to the sampling campaigns performed in northern Italy, 27 kg/inhabitant/year of FW was estimated, which corresponds to 62 kgCO2e/inhabitant/year. Such numbers were applied to our case study, by assuming a linear correlation. Results are depicted in Supplemental Table S11.
Starting from data reported in Supplemental Table S11, an evaluation of the potential economic implications related to the greenhouse gases (GHGs) emitted was performed. GHG emissions were valued using the Social Cost of Carbon (SCC), based on the total costs of a tonne of emitted CO2e (FAO, 2014). This methodology was applied due to the lack of data concerning retail price, which needed values on single country and commodity levels, data not available at the moment of the analysis. According to FAO (2014), the SCC represents the total costs of a tonne of emitted CO2e and it is able to estimate the cost of the global damage caused by GHGs emitted by considering their lifetime (100 years or longer). Estimates of the SCC are often disputed as they depend on different parameters such as the discount rate or the cost coverage. Therefore, the combination of these uncertainties results in a wide range of values: USD 8–20/tCO2e (Waldhoff et al., 2011), USD 180/tCO2e (Anthoff and Tol, 2013) or USD 10–200/tCO2e (Andersson et al., 2020). Stern Review (2007) gave an estimate of USD 113/tCO2e, quite near to the EUR 100/tCO2e settled by Europe (European Commission, 2013) within the Emissions Trading Scheme. Therefore, values from the European Central Bank (Andersson et al., 2020) were used in our case study. Results are collected and described in the following paragraph.
Results and discussion
This section describes the main results achieved in the study. As stated above, the first step was the quantification of the seFWunsorted within the Marche Region. Scores are shown in Table S3, which show that the decrease in total mixed waste generated in the various provinces is reflected in the decline of seFWunsorted from 2018 to 2019. Separate collection of organic kitchen waste is active on the investigated territory, covering 96.5% of the municipalities and at least 99% of inhabitants. Worst results are achieved by municipalities within the AN district. They show the highest potential contribution to the seFWunsorted within the Region (58–50%), despite the reduction of −29% reached in 2019. As reported in the footnote, data for Corinaldo (Catchment 4, AN) were aggregated to those of Maiolati Spontini (Catchment 5, AN) due to the unification of the plants. Later in the list can be found PU (23–20%), MC (18–15%), AP (8–4%) and FM (3–0.4%). The trend for AN district is also confirmed by results per capita (kg/inhabitants). Supplemental Figure S4 and Table S5 show the higher potential values achieved within AN district (+92 to −70% with respect to the weighted average). The main reason of these scores could be ascribable to low efficiency of the sorted waste collection achieved by the city of AN (the most densely populated within the district). In fact, according to the data elaborated by ARPAM, the collection of the sorted waste in the laps 2018–2021 ranges from 57% up to 61%, significantly lower than the regional average (72%). This means that in the city of AN, a part of OW goes into the unsorted fraction leading to a higher value of the seFWunsorted, estimated having a contribution between 36% and 44% on the seFWindex (Supplemental Figures S7–S8).
As described in the section above, values achieved for the seFWunsorted were used to estimate a regional seFWunsorted% (4%) and seFWorg.frac.% (22%). As explained, the latter was used as approximation to calculate seFWsorted. Scores are reported in Table S7, which also show that the total weight per sample ranges between 77 and 185 kg each. This fluctuation is only limited to the mass, since quartering of bin bags was carried out to maintain the volume constant (wheel loader capacity around 3.0–3.6 m−3, in line with the ISO standard).
Values for seFWsorted and seFWunsorted were combined to obtain the cumulative seFWindex per district. Absolute results are shown in Figure 5, by highlighting the contribution of sorted (purple) and unsorted (light blue). Table S9 shows the data ranging from a minimum value of 23 to a maximum value of 38 kg capita in 2018 and values from 26 to 36 kg per capita in 2019. Results per district were used to estimate the overall score per capita within the Marche Region. In 2018, regional seFWindex was around 32 kg per capita, while in 2019 the value reached 30 kg per capita. A reduction of 2 kg per inhabitant has led to an avoided production of around 3000 kilotonnes of seFW in 2019 with respect to the previous year. Cumulative regional scores are in line with those already reported in the literature regarding the average amount of FW in Centre of Italy. Waste Watcher International Observatory, 2021, 2022) has found 26 kg/year/inhabitant and 28 kg/year/inhabitant for the years 2020 and 2021, respectively. They are also comparable to those calculated for the North of Italy: 27 kg/year/inhabitant (Grosso et al., 2019; Waste Watcher International Observatory, 2022) and to the national average (28 kg/year/inhabitant and 31 kg/year/inhabitant for the years 2020 and 2021, respectively; Waste Watcher International Observatory, 2022). Among the districts, MC achieved the higher per capita results: +20% and +18% compared to the average Marche values (per 2018 and 2019, respectively). These scores are +2 to 10% of those in the AN district (the second). Smaller per capita amounts are obtained in the case of the other districts, if counterposed to those of the Region. Percentage contribution of the seFWsorted was estimated to be around 56–99% of the whole index (Supplemental Figures S7 and S8).
As reported in the methodology section, results at regional scale were then extended to the Italian level. Table 1 shows the seFW values from unsorted (a) and sorted (b) municipal waste in Italian Regions.
Results are depicted using a gradual colour shade to identify higher seFW production potential. Regions with worst scores are in red: Lazio, Lombardia and Sicilia for the seFWunsorted; Lombardia in the case of seFWsorted. Orange shade includes the bigger number of Regions: six for residual waste (Campania, Puglia, Toscana Emilia Romagna, Piemonte and Veneto) and seven if the sorted fraction is considered (Campania, Veneto, Lazio, Toscana, Puglia Emilia Romagna and Sicilia). The others fall into the lower potential production (yellow and green). As stated above in the methodology, a linear extrapolation was adopted. Therefore, we assumed that Regions with greater amount of waste (both sorted and unsorted) and number of inhabitants may have an increasing likelihood of producing seFW. This is the reason why the potential results for Lazio, Lombardia and Sicilia are higher than those of Valle d’Aosta, Friuli Venezia Giulia and Basilicata. Such values are not intended as proxy for the real situation, but may be used to orient and improve citizens’ behaviour. Regional seFWunsorted and seFWsorted values have been then added to estimate the whole amount per region and then total national score (seFWindex; Table S10). A huge amount is observed overall with a potential seFW more than 1.5 Mt in 2019, 29% of which in unsorted bins. Such data are impressive representing around 17 times the amount of food collected and re-distributed through the programme ‘Colletta Alimentare’ in 2020, one of the most important initiatives in Italy aimed at fighting poverty and FW (Fondazione Banco Alimentare Onlus, 2020). In addition, the quantity estimated is in line with those obtained by previous studies such as Grosso et al. (2019), that have calculated around 1.6 million tonnes per year, and Waste Watcher International Observatory on Food and Sustainability (2021, 2022). In the latter case, average values per week and capita were extrapolated by obtaining around 1.6–1.8 Mt yearly (for 2020 and 2021, respectively). Actually, the same procedure was carried out on other studies which followed a top-down approach obtaining comparable findings, for example, around 1.1 Mt/year in the case of Scalvedi and Rossi (2021) and 1.4 Mt/year obtained by Societ Italiana di Medicina Ambientale (SIMA, 2015)
Tendency relating to the per capita amounts is shown in Figure 6. According to these estimations, 2019 seFWindex per capita achieved an average value of 25 kg seFW/inhabitant, quite far from the 92 kg per person per year achieved at European level (Stenmarck et al., 2016). The result calculated here for the national scale is sensibly lower when compared to those extrapolated in the literature concerning Spain (43 kg/inhabitant/year), UK (49 kg/inhabitant/year), the United States (73 kg/inhabitant/year), Israel (95 kg/inhabitant/year), Mexico (116 kg/inhabitant/year) and Canada (59–218 kg/inhabitant/year). At the same time, it approaches the values obtained for countries such as Pakistan (22 kg/inhabitant/year), Austria (33 kg/inhabitant/year) and Russia (35 kg/inhabitant/year). In addition, our value seems to be in line with the average amount calculated from the yearly national values estimated by the following literature: 19 kg/inhabitant (Scalvedi and Rossi, 2021), 21 kg/inhabitant (SIMA, 2015), 28 kg/inhabitant (Waste Watcher International Observatory on Food and Sustainability, 2021) and 31 kg/inhabitant (Waste Watcher International Observatory on Food and Sustainability, 2022). Full list and references are reported in Supplemental Table S12.
As shown in Figure 6, seven Regions have potential higher amounts compared to the national average. Among these, Marche is included with a +20% in the score.
Cumulative results for both case studies (Marche Region and Italy) were used to estimate the potential environmental and economic burdens following the methodology described in the dedicated paragraph. Results from the simplified environmental assessment show that Marche region achieved a potential carbon footprint related to the seFWindex of 69 kgCO2e/inhabitant/year. Overall, Italy may have contributed to climate change with a potential release of 3.5 MtCO2e in 2019, almost the 1% of the national CO2 emission (Ritchie and Roser, 2020), corresponding to around 57 kgCO2e per capita. Results seem to confirm the estimation already published by Grosso et al. (2019), which reported 3.7 MtCO2e/year (nationally) and 62 kgCO2e per capita. Finally, results on carbon footprint were used to evaluate the potential economic implications related to the GHGs using SCC. Values from the European Central Bank (Andersson et al., 2020) were applied to the overall 3.5 MtCO2e in 2019. The result is that the SCC cost ranges from 35 to 700 M$, which on average is in line with the 395 M$ obtained using Stern (2007) value.
Conclusion
In this research work, we presented a data elaboration of results obtained from a 2-year monitoring campaign carried out in Marche Region aimed to quantify the seFW fraction within the sorted and unsorted waste flows. The reason that pushed the study is the lack of primary data regarding quantities and household behaviours on FW. Recently, Italian situation on such issues has been excellently analysed almost exclusively using a top-down approach (e.g. questionnaires). This approach is nimble and able to reach higher numbers of interviewed, sufficient to have a statistical response. However, sometimes, surveys may suffer for subjectivity and could lead to qualitative responses only. For this reason, in our opinion, the results from questionnaires may be corroborated by those of a waste composition analysis (bottom-up). In the study, we estimated a potential seFW at regional scale, with a focus on each district. Results achieved for Marche (32 kg per capita in 2018 and 30 kg per capita in 2019) are in line with those already reported in the literature regarding the average amount of FW in Centre of Italy. For this reason, assuming a linear regression, they were extrapolated also for the national scale by achieving a cumulative value of 1.5 Mt of potential seFW. This amount seems to confirm the scores already published on national and international peer review. At the same time, result per capita (25 kg/inhabitant/year) is comparable to similar countries (e.g. Austria) and lower than the average EU. Results at national level were then used to quantify the potential impacts on climate change and society (SCC). Scores of the latter analysis have shown that during 2019, in Italy, the values on seFW correspond to a potential emission of 3.5 MtCO2e (around 57 kgCO2e/inhabitant and 1% of the national carbon footprint) with an estimated SCC cost which ranges from 35 to 700 M$. Despite the fact that we were able to estimate some quantitative results, the approach here presented has some limitations. First, different from the top-down, it needs resources on site, with higher costs and difficulties in collecting more samples. In our case, only one sample was collected to minimize time and not exceed the budget allocated. This, of course, will affect the possibility to carry out a full statistical analysis of the results. However, despite the concise number of samples, they were collected to be as representative as possible of the entire Region. In addition, as described above, the results seem to confirm the trend already published. There is the necessity of financing new campaigns to upgrade the results here presented by extending the assessment to the sorted organic fraction (right now only estimated).
However, the results of the study can be used to support public authorities during stakeholder engagement activities and focus groups aimed to discussing and fighting the problem of FW. Our intent was to investigate the topic by adopting a scientific approach based on a quantitative analysis. At the same time, it is necessary to make these data available, to use figures to support the discussion within schools and surveys among citizens. We hope the results of the study do not enrich the peer review literature only, but can assist policymakers in promoting the right behaviours, and set fixed monitoring campaigns to keep under control the trend.
Supplemental Material
sj-docx-1-wmr-10.1177_0734242X221105447 – Supplemental material for Still edible wasted food from households: A regional Italian case study
Supplemental material, sj-docx-1-wmr-10.1177_0734242X221105447 for Still edible wasted food from households: A regional Italian case study by Massimiliano Boccarossa, Daniele Cespi, Ivano Vassura and Fabrizio Passarini in Waste Management & Research
Footnotes
Acknowledgements
Lanz AM and Frittelloni V from ISPRA, for providing regional data on sorted and unsorted waste generation.
Manuritta L a Master Degree student of the Resources Economics and Sustainable Development at University of Bologna, for the support during the environmental and economic analyses
Declaration of conflicting interests
The authors declared no potential conflicts of interest with respect to the research, authorship and/or publication of this article.
Funding
The authors received no financial support for the research, authorship and/or publication of this article.
Supplemental material
Supplemental material for this article is available online.
References
Supplementary Material
Please find the following supplemental material available below.
For Open Access articles published under a Creative Commons License, all supplemental material carries the same license as the article it is associated with.
For non-Open Access articles published, all supplemental material carries a non-exclusive license, and permission requests for re-use of supplemental material or any part of supplemental material shall be sent directly to the copyright owner as specified in the copyright notice associated with the article.