
Abstract
The SWAN platform is an integrated suite of online resources and tools for assessing industrial symbiotic opportunities based on solid industrial waste reuse. It has been developed as a digital solid waste reuse platform and is already applied in four countries (Greece, Bulgaria, Albania and Cyprus). The SWAN platform integrates a database with the spatial and technical characteristics of industrial solid waste producers and potential consumers, populated with data from these countries. It also incorporates an inventory of commercially implemented best practices on solid industrial waste reuse. The role of the SWAN platform is to facilitate the development of novel business cases. Towards this end, decision support services, based on a suitable matching algorithm, are provided to the registered users, helping them to identify and assess potential novel business models, based on solid waste reuse, either for an individual industrial unit (source/potential receiver of solid waste) or a specific region.
Introduction
According to the Directive 2008/98/EC, “waste” is defined as any substance or object that the holder discards or intends to or is required to discard. On the contrary, an output stream is characterized as “by-product” and not “waste” when certain criteria are met (EC, 2008). The same directive recognizes material management as a way of decreasing waste and reducing raw material inputs to the economy. The European Union (EU) economy currently loses a significant amount of potential secondary raw materials, which are found in waste streams. In 2016, total waste generation in the EU amounted to approximately 2.3 billion tons. However, only slightly more than half (52.6%) of the waste generated in the EU was treated and only a limited share (36.7%) of the waste was recycled, with the rest being landfilled (40.3%), incinerated or disposed of otherwise (Eurostat, 2020).
For this reason, the EC introduced in 2014 a series of actions towards promoting a circular economy (CE), leading to a zero-waste Europe (EC, 2014). The targets have been revisited in 2018 and an updated set of measures has been approved, to make EU waste legislation fit for the future, as part of the EU’s wider CE Policy (EC, 2020). Turning waste into a resource is an essential part of increasing resource efficiency and closing the loop in a CE. Even though several recycling initiatives have been implemented in existing product cycle, there are various key waste streams and materials that need to be further addressed.
This challenge is even greater in the Balkan and Mediterranean region, where the economic crisis had the greatest impact and, thus, any new investments should have an absolute minimum cost and new growth options for the regional economies and societies are sought after. Moreover, the countries in that region do not have effective national or regional management strategies for solid waste, which has been the category with the largest increase in terms of annual generation over the last decade (EEA, 2015). The lack of waste management schemes is also due to the fact that the directly involved stakeholders do not have full view of the available options.
Towards that end, the development of novel symbiotic schemes is highly promoted. This is the main objective of the Interreg V-B “Balkan Mediterranean 2014–2020” SWAN project (acronym of “a digital Solid Waste reuse plAtform for BalkaN”). The project focuses on the creation of links between industrial partners in the Balkan–Mediterranean region, leading to the development of an ecosystem that will develop local and transnational symbiotic schemes based on solid waste reuse, among industrial solid waste producers and potential solid waste re-users. The implementation of such schemes will ensure the diversion of an important fraction of waste from further treatment or landfilling and will contribute to saving raw materials. The goal of the project is achieved through the design and development of the SWAN digital platform, an open access tool that is able to map and match solid waste sources with potential waste re-users, and propose waste reuse loops and value chains in the region. SWAN platform acts as a monitoring system, by identifying and recording potential sources and receivers, who will be able to exchange information about technical, financial and matching of supply and demand.
Stakeholders from four countries of the Balkan and Mediterranean region (Greece, Albania, Bulgaria, Cyprus).provided data for the SWAN digital platform, towards developing the SWAN digital ecosystem. The final output is a novel map of solid waste flows in the region, which will help to establish a common and transnational strategy towards resource efficiency according to EU policies, applied through the prism of sustainability.
The scope of this paper is to present the main characteristics and functionalities of the SWAN platform. The following section outlines the theoretical background and the approach followed for the development of the Platform, while subsequent sections present the technical and the functional design. The usability of the services provided by the platform is demonstrated by characteristic examples. The final section summarizes the conclusions from the work.
Theoretical background
CE has been trending over the last few years, both among researchers and businesses. Although there has not been a commonly agreed definition – Kircherr et al. (2017), for example, have collected 114 different definitions from both scientific papers and consultancy reports – the application of the CE concept is considered to be of utmost importance for improved resource efficiency and sustainable development (Ghiselini et al., 2016). CE is most commonly applied in the industrial sector, through the implementation of Industrial Symbiosis (IS) business models. Such models have occasionally arisen over the last 30–40 years, before the CE concept was formulated and formalized; however, their development was not performed in a systematic way and was primarily driven by the limited financial imperatives of individual companies on an ad hoc basis, rather than by the collective and cooperative good, underpinned by formalized methodologies and systems. The process of developing and implementing IS is complex and can be divided into five phases: (i) opportunity identification; (ii) opportunity assessment; (iii) barrier removal; (iv) commercialization and adaptive management; and (v) documentation, review and publication (Grant et al., 2011). Over the last few years, this development has stalled in Europe due to several, mostly financial, barriers, such as new infrastructure and physical space required, economic crisis and strict financial budget implemented for the majority of companies (Iacondini et al., 2015). Thus, there is currently the need for national or regional policy frameworks that will facilitate the implementation of IS, resulting in economic benefits for all the stakeholders involved and improvement in the environmental performance of the system. The most important aspect of this process is the technical matching, especially since there is an endless number of potential waste streams created (characterized by varying composition and quantities) and an equally vast range of resources used in industrial systems.
Since IS involves the collaboration of two or more industrial plants that develop a link based on material/service exchange, the simplest method to identify symbiotic schemes would be by using a taxonomy considering spatial and organizational factors. Such an approach is applicable in a specified area/region and can be applied through an extensive field survey (using interviews/questionnaires) in order to identify potential input/output matchings (Liu et al., 2015). In this case, three different levels of IS are defined (Chertow, 2004):
- Individual firm level, where resources are exchanged within a facility, firm or organization and material exchanges can extend along the supply chain of a product under single ownership.
- Inter-firm level, which is associated with the exchange among firms collocated in a defined eco-industrial park but can also be extended to other local partners.
- Regional level, when the symbiotic schemes can be implemented among local firms that are not collocated and bring the industries together to benefit based on input–output matching.
IS Information and Communication Technology (ICT) tools and frameworks
Policy and decision-making processes can be enhanced by ICT tools. In the early 2000s, there were various attempts to develop ICT tools for IS (17 are listed by Grant et al., 2011); however, the results of those efforts were ambiguous and only three of the tools became operational. Nowadays, only one of them remains active, the Core Resource for Industrial Symbiosis Practitioners (CRISP) portal, which also acted as the support system for the UK’s National Industrial Symbiosis Programme (Jensen et al., 2011), and has now been evolved to SYNERGie® (2018). Moreover, these early efforts were only focusing on the identification of potential symbiotic schemes, neglecting assessment and barrier removal, and there was a lack of compatibility between the industry supplied data and the applied frameworks (Benedict et al., 2018).
In recent years, more elaborate methods have been used for the development of such tools. Various reviews have been performed on IS ICT tools (Boix et al., 2015; Kastner et al., 2015; Van Capelleveen et al., 2018; Yeo et al., 2019a) and another similar analysis is beyond the scope of this paper. The most recent attempt, by Maqbool et al. (2019), has reviewed and assessed ICT tools and frameworks developed to support IS in Europe, following the five-phase methodology, introduced by Grant et al. (2011). Twenty tools were chosen for further analysis, and the results showed that the second wave of ICT tools is still focusing on the opportunity identification. However, the other phases are not neglected but are gradually introduced, with varying focus. Five tools were characterized as having strong focus on symbiosis assessment but only one as having strong focus on barrier removal. Moreover, the authors concluded that a tool, which involves a facilitator of IS in its development or dissemination stage, has greater chances of surviving over time and becoming operational.
Regarding the methodologies used to support the ICT tools, there is a wide range of techniques applied. One of the first attempts to develop an IS tool was by Cecelja et al. (2015), who have introduced a semantic matching methodology, using ontology engineering, towards the creation of an IS network and have applied it to the e-Symbiosis online platform. The platform has been validated using real-life data from small and medium enterprises (SMEs). The “ontology matching process” is performed based on the characteristics of the involved industrial plants and the defined metrics in the ontology domain. The characteristics/attributes of the industrial plant include the type, quantity and availability of resource(s) required, the pattern of supply (batch or continuous) and the location of the site (described by the longitude and latitude). Each proposed matching between a group of industries is described through a similarity index/performance ranking, which depends on distance and matching of attributes. Moreover, the environmental performance of the proposed networks is evaluated by four other environmental metrics. The main outputs of the algorithm combine exact solutions, similar types of available resources, report of their semantic similarity and registered industries with partial similarities.
Alvarez and Ruiz-Puente (2017) developed a similar ontological framework to identify potential synergies among industries. For that purpose, they used two different types of information: (i) dynamic information from participating companies, including the name, location, coordinates, industrial area and number of workers; and (ii) an IS-related knowledge base, consisting of implicit knowledge from existing partnerships, experience from industrial experts and case studies from the scientific literature. The latter part is the most critical in the development of the algorithm, as it matches the raw materials and the waste types that can be combined, by achieving costs savings and reduction of the waste produced. This approach has been applied to SymbioSyS, an online tool aiming to identify and visualize IS in a given region, which has been validated in an existing industrial park with 25 SMEs.
Aid et al. (2015) introduced a generic heuristic visualization methodology, aiming to simplify the matching process, by identifying regions that are potentially good candidates for IS implementation and to assess strategies to promote such schemes. The approach has been applied to the Looplocal tool and has been validated using real data in a Swedish region.
Agent-based modelling has also been introduced to study the interaction between the different stakeholders and the potential success on an IS scheme. Raabe et al. (2017) developed the By-product Exchange Network (BEN) model, a collaboration platform using an agent-based modelling approach with an objective function maximizing the transaction value of the model, validated using real-life data from Singapore, whereas Fraccascia (2020) examined the effectiveness of various alternative platforms, based on the characteristics of the industries involved, using an agent-based simulation approach.
Other novel techniques have also been used to study and facilitate the development of IS, such as big data analytics (Song et al., 2017), artificial intelligence (Yeo et al., 2019b) and blockchain architecture (Nallapaneni and Chopra, 2020). However, these attempts have not yet transformed into a publicly accessible platform and, thus, have not been further studied before the development of the SWAN platform.
The SWAN platform is a mapping and matching simulation tool, integrating key characteristics from many the above-mentioned tools. However, apart from the technical matching algorithm, it also incorporates two novel characteristics: an economic matching based on the assessment of financial viability for each symbiotic schema, and a screening of the technically feasible options, based on the preference of the industrial users. The following two sections present, in detail, the technical and functional design specifications of the SWAN platform.
Swan platform technical design
The SWAN platform is a web application requiring only network access and a web browser for end-user access. Web application architecture provides the ability to roll out new applications and upgrades to the entire organization simultaneously. Moreover, by utilizing web applications, organizations can reduce the cost and complexity of all IT functions, making it easier to implement, deploy, manage and monitor applications and information resources. The platform has been designed with a standard “look and feel” to facilitate ease of use, software design simplification and branding. It employs a three-tiered architecture consisting of the following:
Presentation tier: this is the topmost level of the application. It communicates with other tiers by outputting results to the browser/client tier and all other tiers in the network. The presentation tier uses standardized, reusable components that provide the application with a common, consistent end-user interface. The benefit of this approach is that it allows for the upgrade, exchange and reuse of products with minimal retooling or disruption to the overall environment.
Application tier (business logic tier): the logic tier is pulled out from the presentation tier and, as its own layer, it controls the platform’s functionality by performing detailed processing.
Data tier: this tier consists of database servers where information is stored and retrieved. This tier keeps data neutral and independent from application servers or business logic. Data having its own tier also improves scalability and performance. Figure 1 presents the entity–relationship model for the SWAN platform database, which classifies the main entities/classes involved (industrial unit and material stream, either input, waste or product) and specifies relationships that can exist between instances of those entity types.
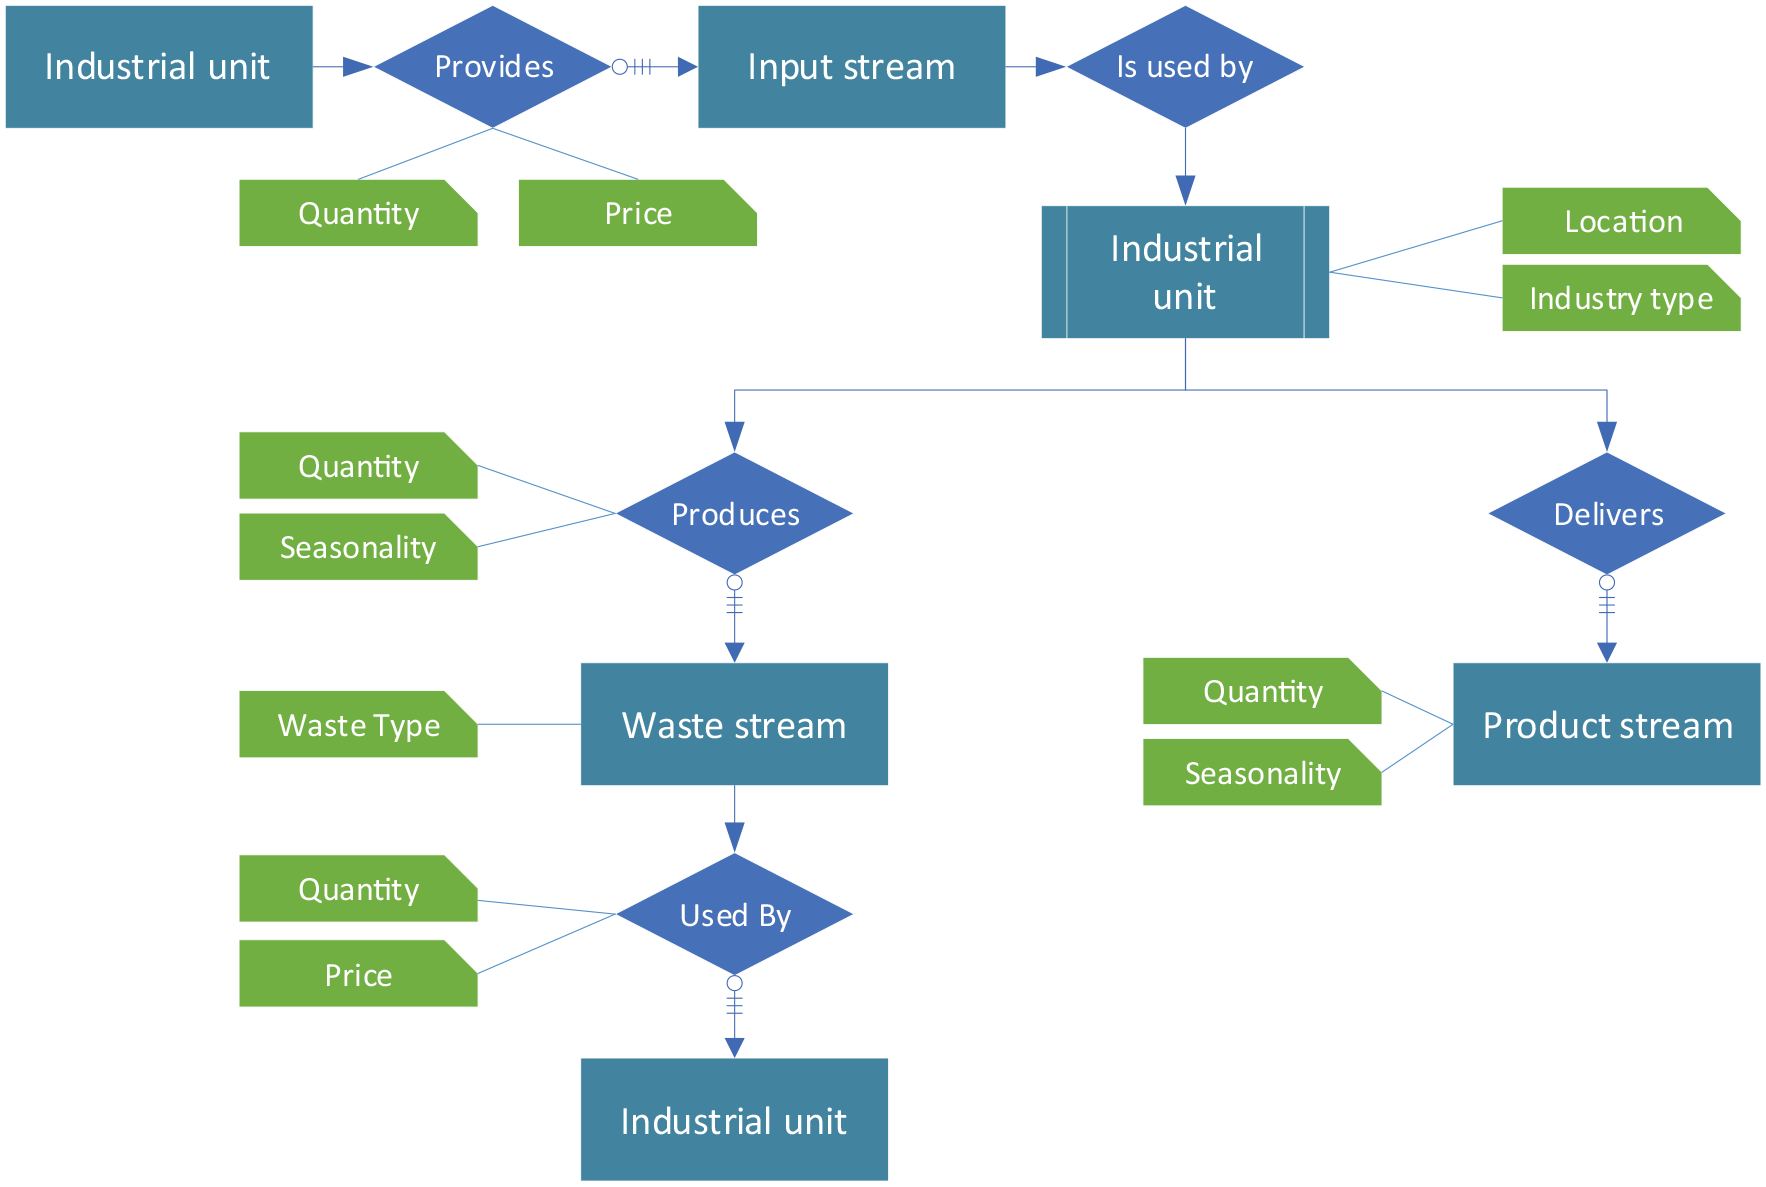
SWAN platform database entity–relationship model.
Swan platform functional design
The role of the SWAN platform is to facilitate the development of one-to-one solid waste reuse value chains, through the collaboration of an industrial solid waste source and a potential solid waste user. This can be achieved by adopting a three-step process: (i) map and characterize the potential sources and sinks of solid waste in the corresponding countries; (ii) match them based on technical criteria; and (iii) identify and assess potential business models for opportunity exploitation, at both the national and transnational level. Thus, the main functionalities of the platform are: (i) the mapping of all the industrial sources of solid waste and all the potential receivers (Figure 2) and (ii) their technical and economic matching to identify the economically viable national and transnational symbiotic schemes.
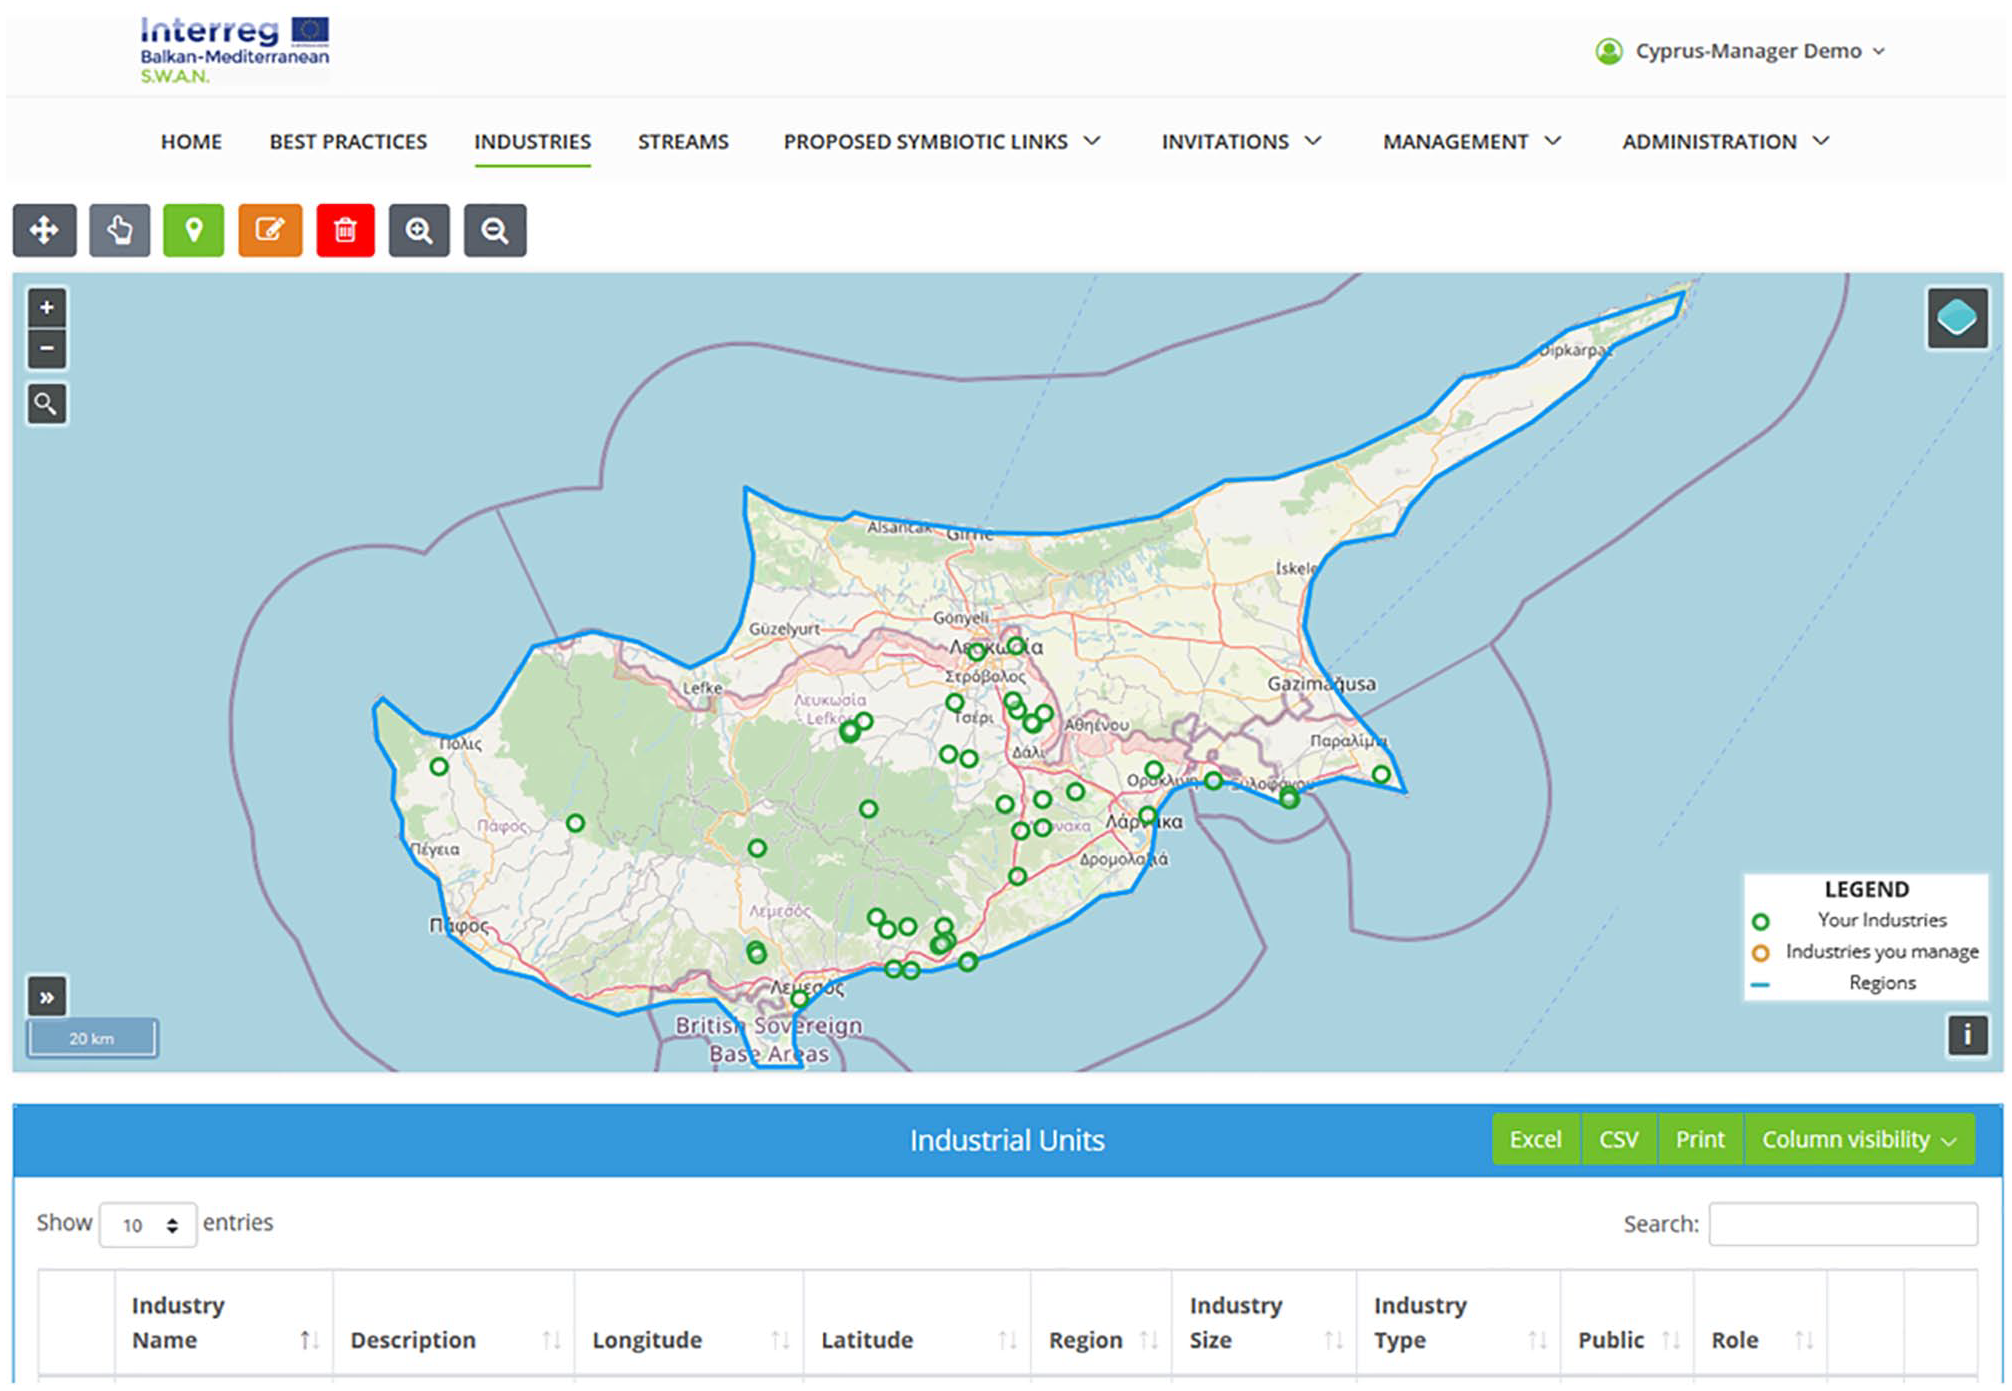
Mapping functionality of the tool.
Six user groups (Public, Industry Managers, Industry Participants, Regional Authority Managers, Regional Authority Participants and System Administrators) have been defined for the platform, each one with their specific user functionalities and permissions.
The database of the platform has already been populated with all the necessary information for the industrial solid waste sources and potential receivers from four countries (Greece, Albania, Bulgaria and Cyprus). All the relevant data were collected using questionnaires, filled in by industrial actors.
Database of best practices
A number of already implemented best practices, towards solid waste reuse, have been collected, harmonized and integrated into the platform (Figure 3). This inventory greatly facilitates matching functionality of the SWAN algorithm and serves as an evidence base for successfully implementing IS schemes. The inventory has been populated based on commercially applied symbiotic solutions. For each IS practice/technology, the following characteristics have been collected:
(i) The type of the industrial plant supplying the waste stream and of the plant receiving the waste stream. For that purpose, the “statistical classification of economic activities in the European Community”, abbreviated as NACE, is used. It is a four-digit classification providing the framework for collecting and presenting a large range of statistical data according to the economic activity.
(ii) The type of the waste stream exchanged between source and sink. For that purpose, the European Waste Classification for Statistics (EWC-Stat) has been used, a mainly substance-oriented aggregation of 51 different waste types defined in the European List of Wastes.
(iii) An indication about the technology readiness level of this option.
(iv) A scientific reference.
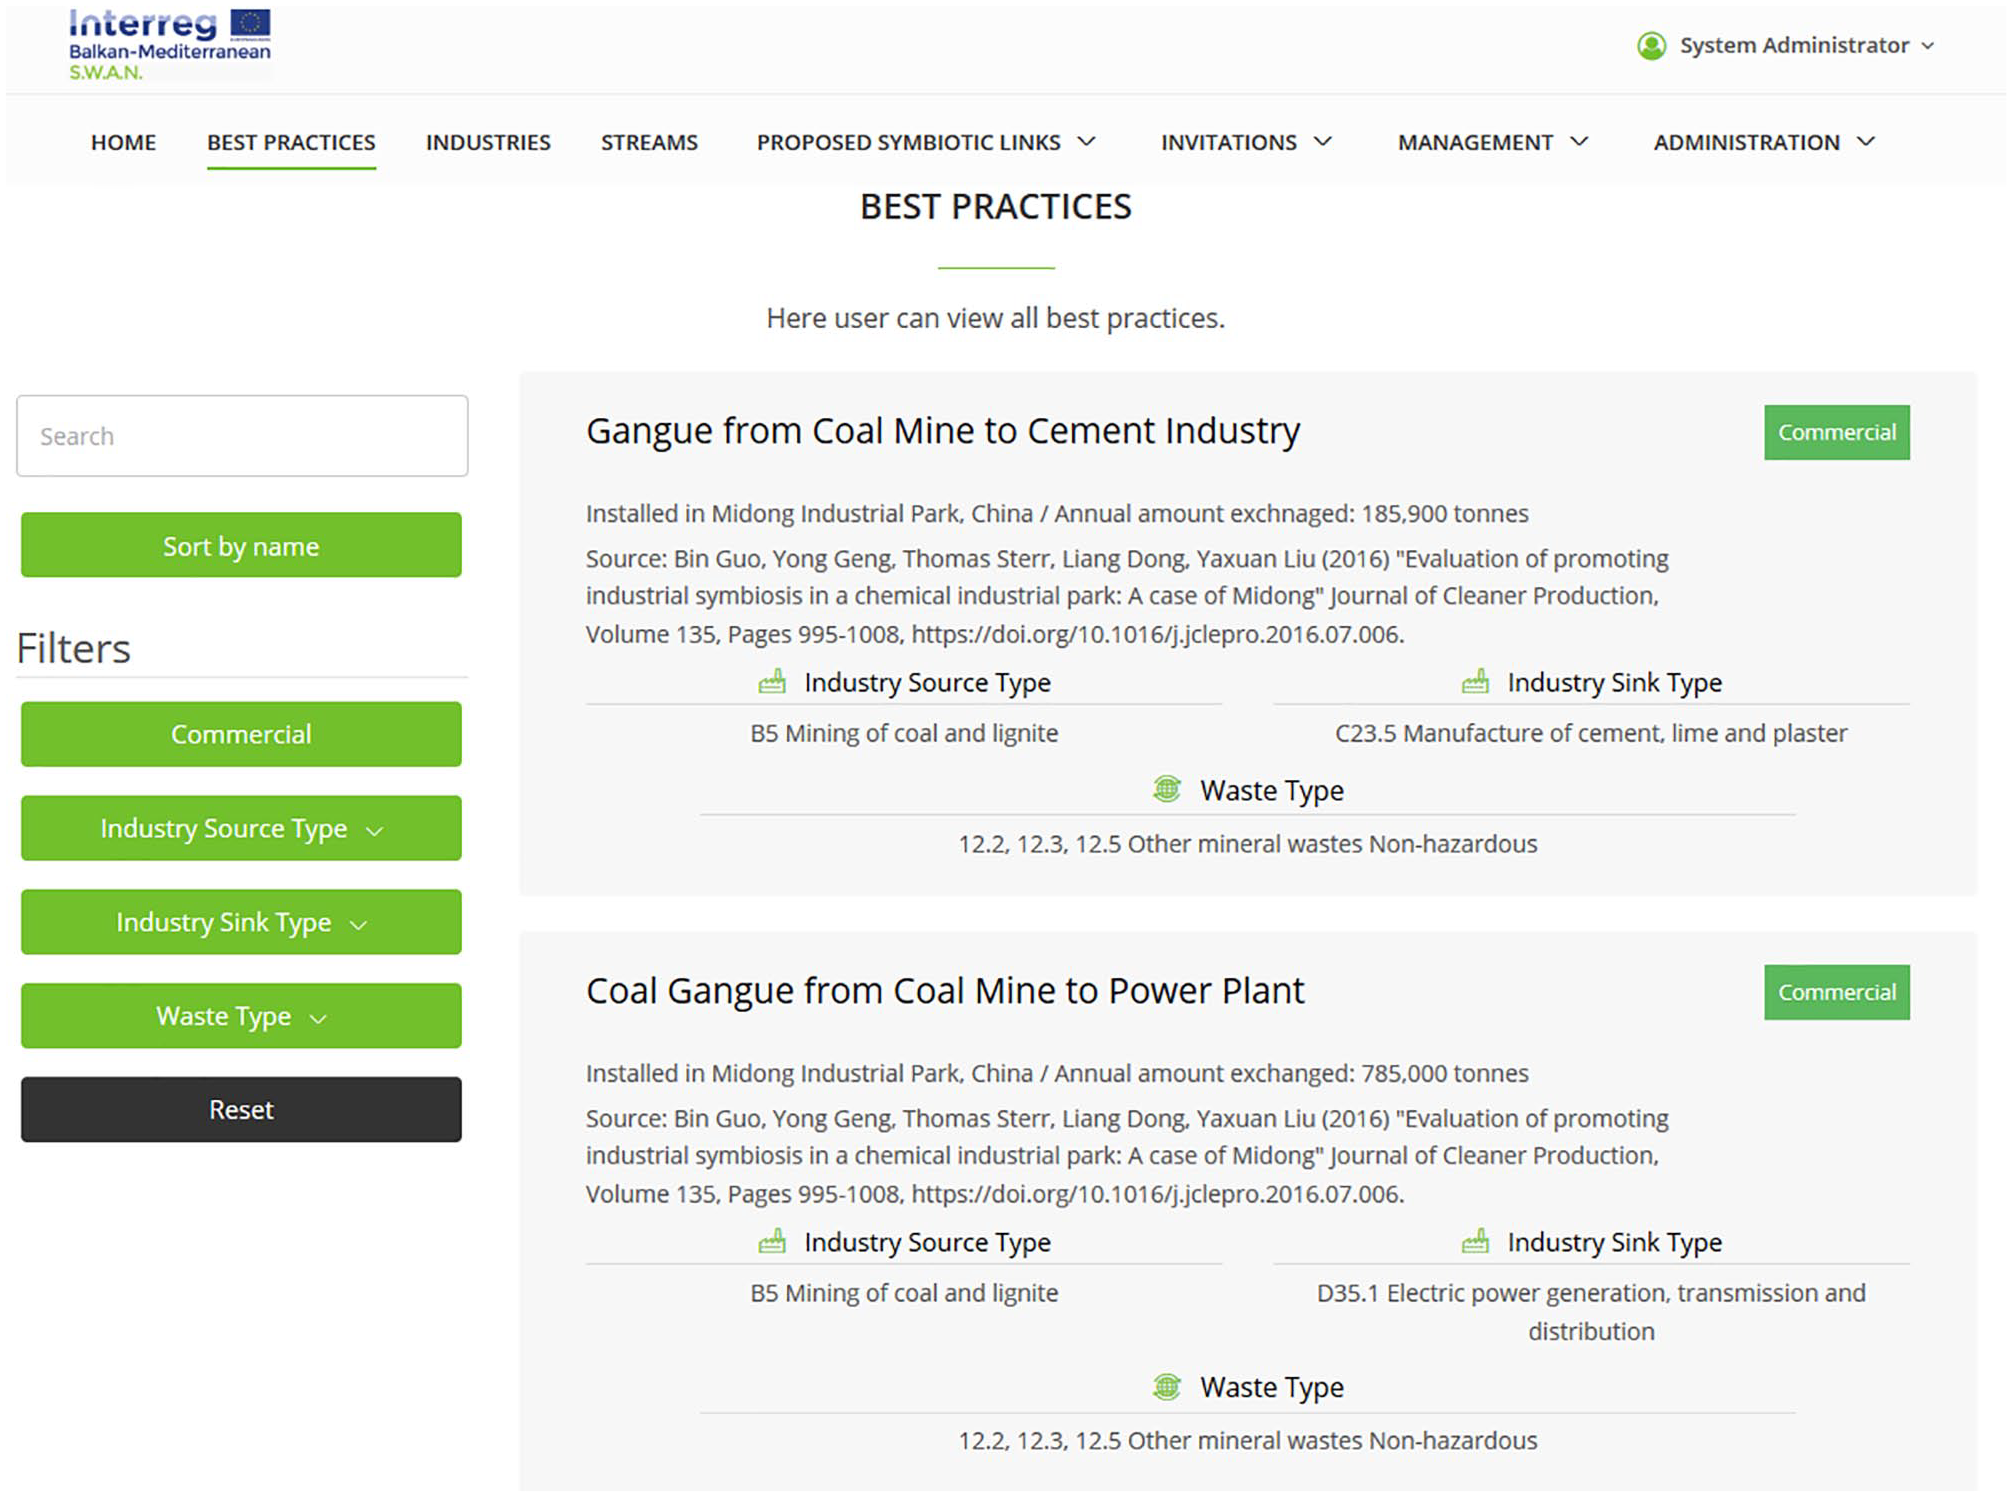
Inventory of best practices on industrial solid waste reuse.
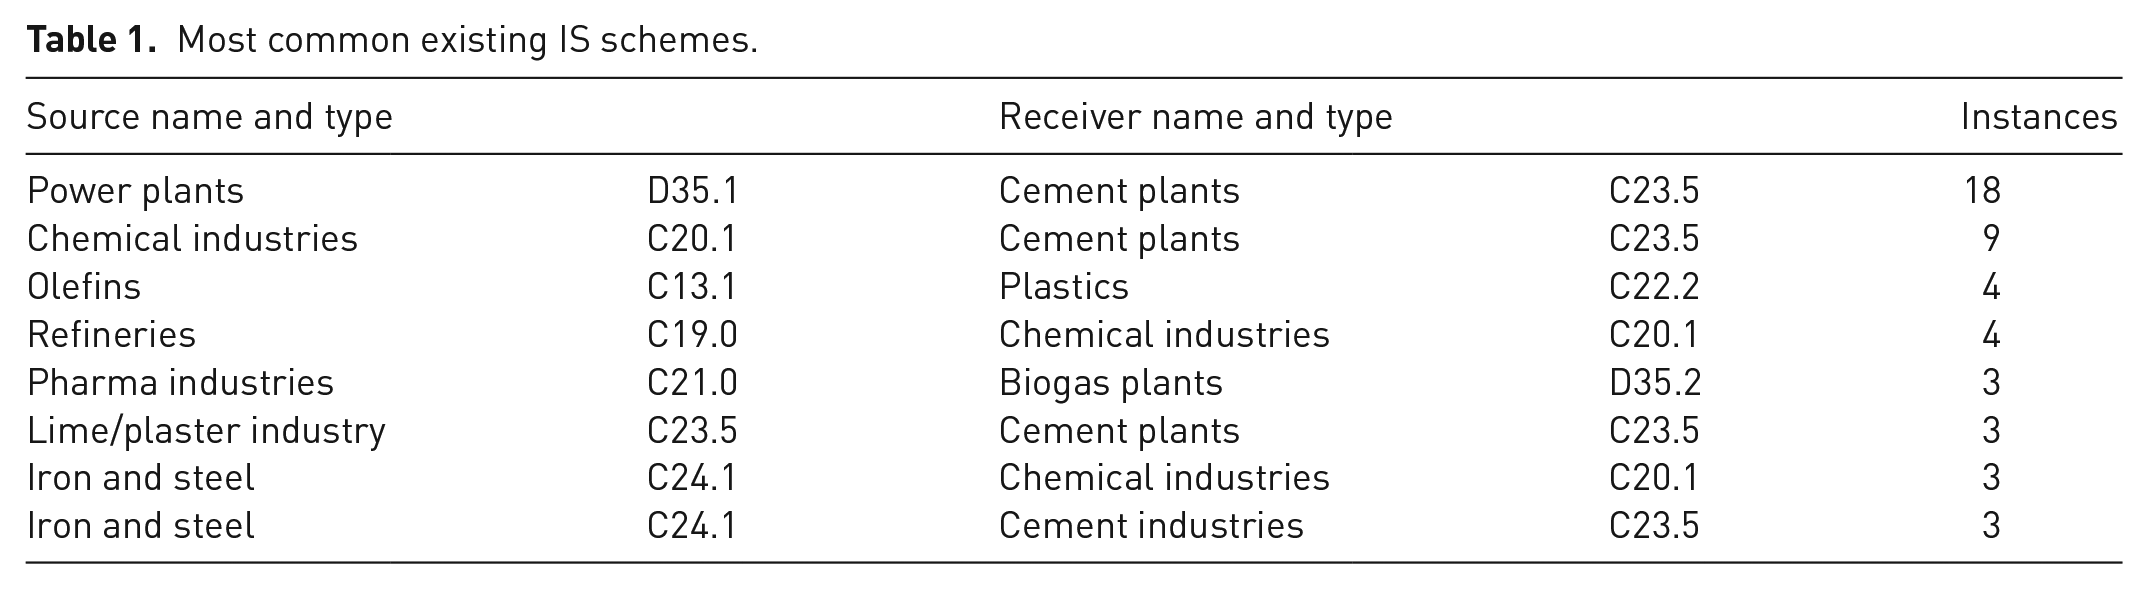
Based on the information collected, a list of the technically plausible pairings is developed, which also includes the information on how common such a pairing is (based on the number of occurrences). From the data collected so far (Table 1), it can be seen that the most common source of the implemented industrial symbiosis schemes are the power plants (NACE Code D35.1), which participated in 18 of them, usually supplying fly ash (as the major waste stream). On the other hand, the most common receiver are the cement plants (NACE Code C23.5), being supplied with different aggregate material (e.g. fly ash with EWC Stat Code 12.2) from a variety of industrial plants (with the power plants being, again, the most common option).
Most common existing IS schemes.
Technical matching
The technical matching of the SWAN platform combines characteristics from the three above-mentioned methodological approaches. Following Alvarez and Ruiz-Puente (2016), two different sources were used for the technical matching of the industries: (i) a knowledge base, consisting of existing IS schemes and case studies from the scientific literature; and (ii) continuously updated input from the participating industries. Based on Cecelja et al. (2015), the SWAN platform incorporates both qualitative and quantitative characteristics of each industrial site (type using NACE code, location using coordinates) and the corresponding solid waste streams (produced amount and pattern of supply) or any solid resources that could be potentially replaced in a symbiotic scheme (required quantity and purity).
However, one of the novelties of the SWAN platform is that it also introduces cost-related data for both the waste streams (existing management method and the corresponding cost) and the solid resource (existing supply method and the corresponding price). Since it is realistically difficult to collect data from all participating industries, qualitative cost data are also accepted as input, but in this case the economic feasibility assessment of the symbiotic schemes cannot be performed. Finally, each solid resource input is characterized by the managing industrial partner as “favourable for IS” or not, in order to avoid including in the proposed schemes, options that would not be acceptable by the potential waste stream receivers. The overall algorithm for the technical matching is illustrated in Figure 4, and the four steps are presented in detail in the following sections.
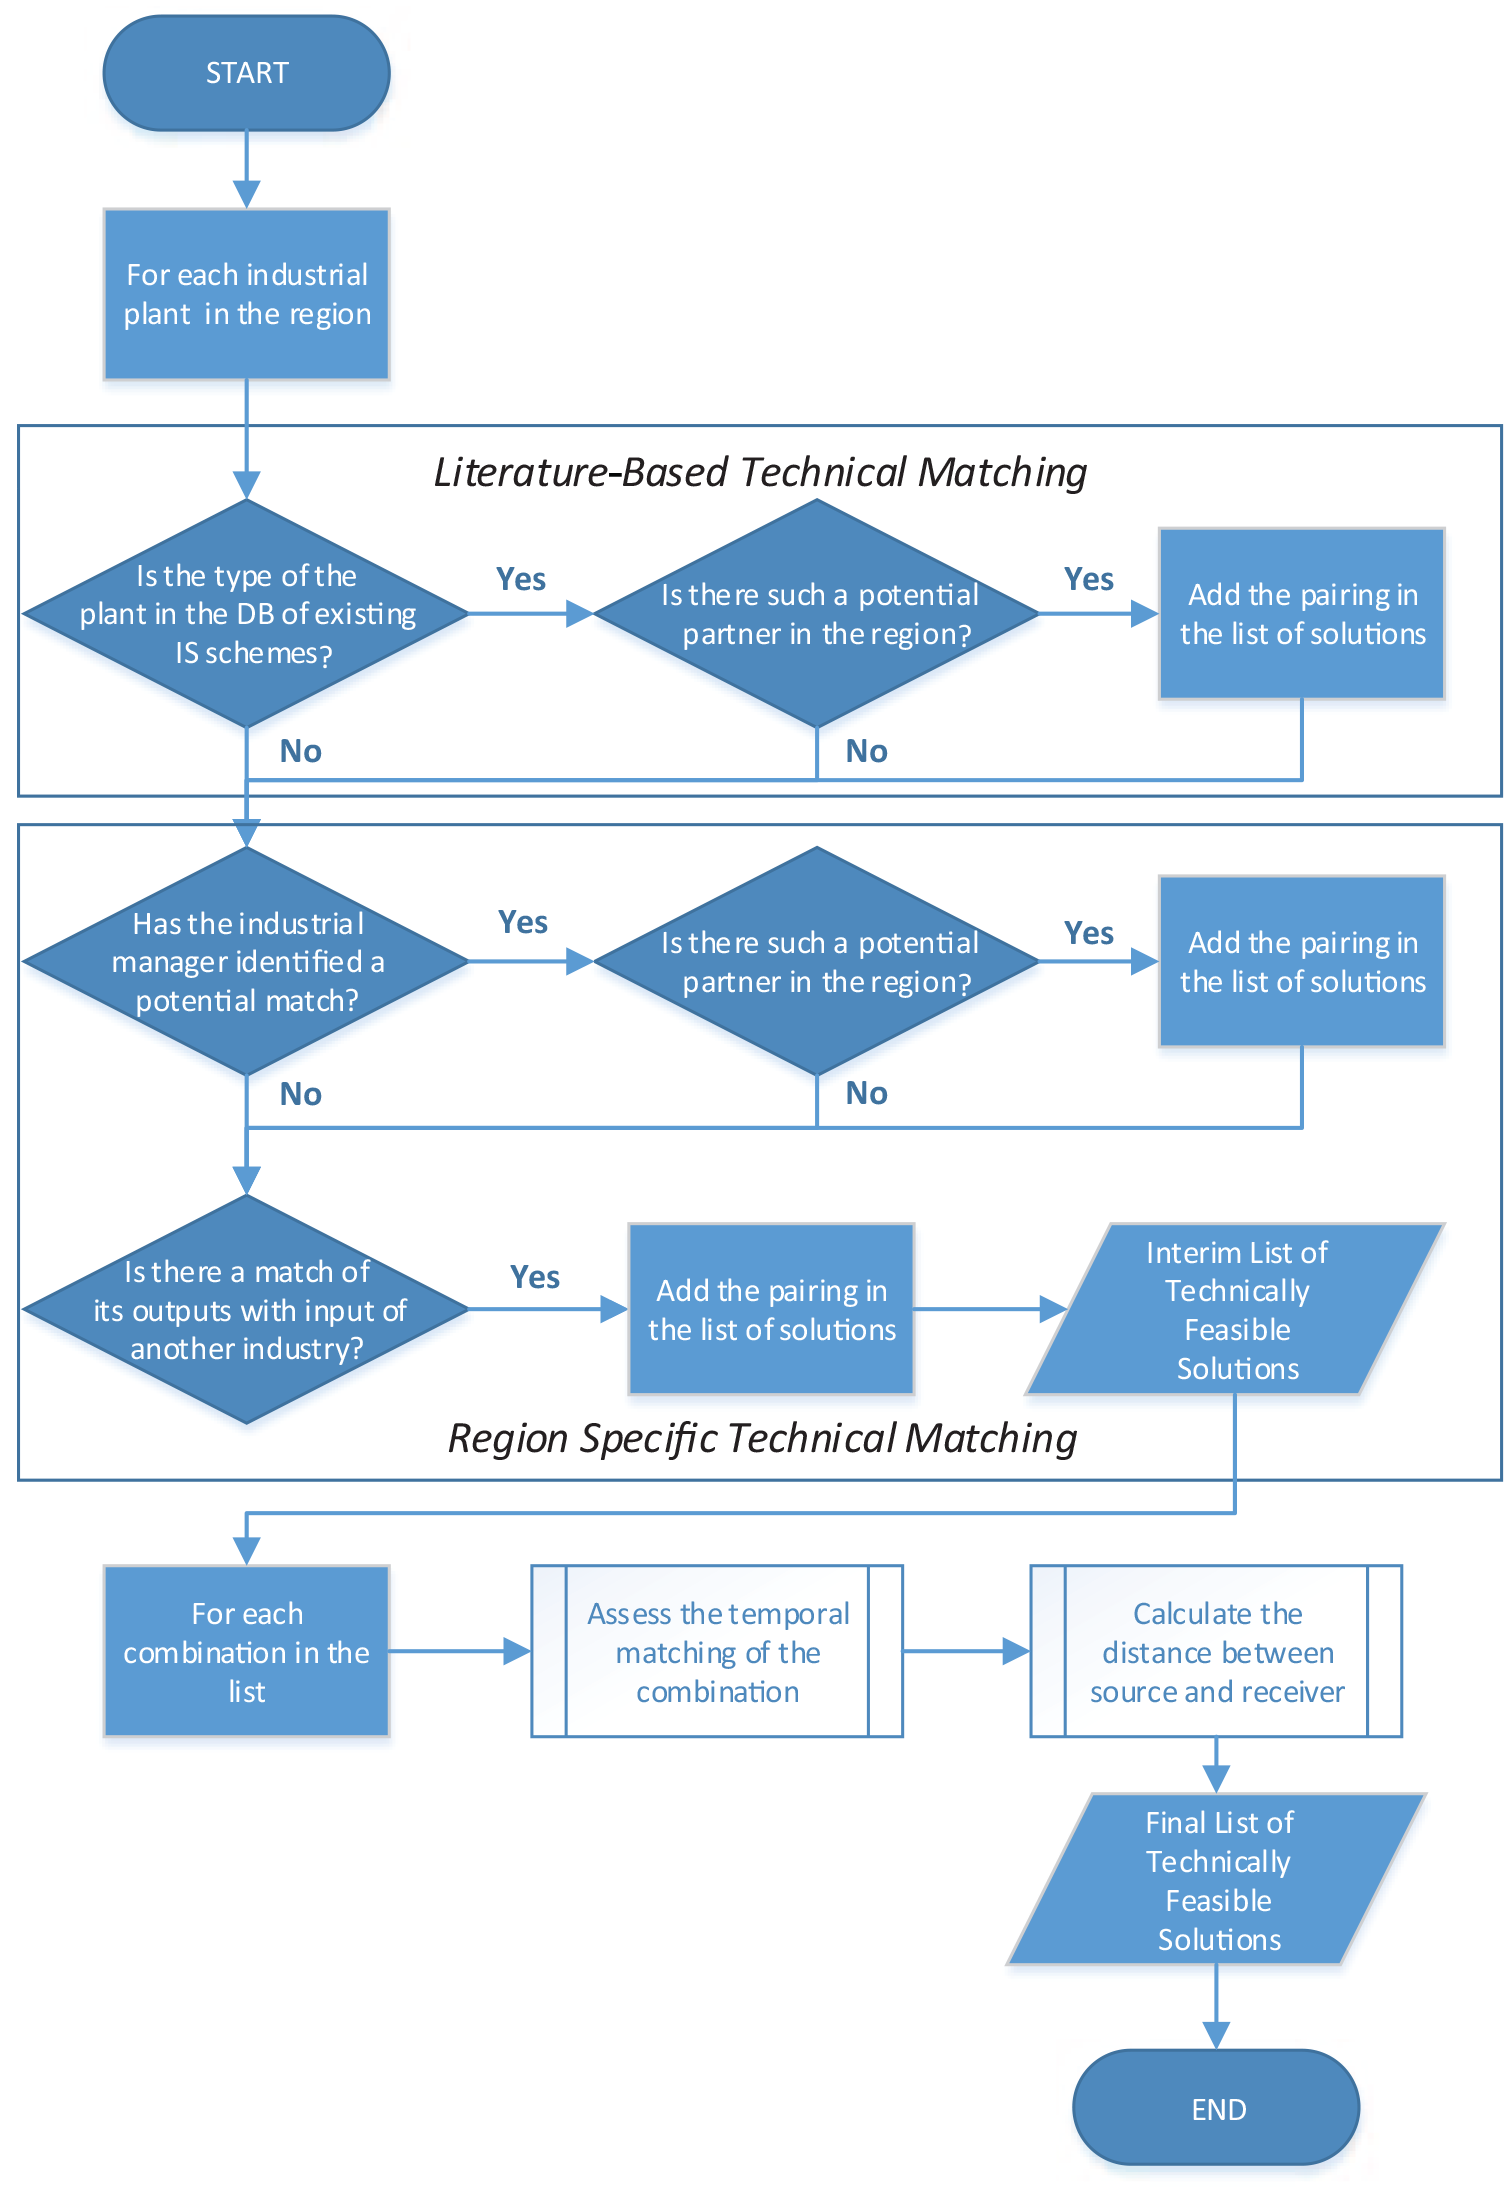
Algorithm for the list of technically feasible solutions.
Step 1: Literature-based technical matching
The first step of the technical matching (Literature-based technical matching) uses the data collected in the Best Practices Database. More specifically, the algorithm develops a list of the technically plausible pairings based on the list of Best Practices, using only the basic details, supplied by the industry or regional manager (i.e. NACE code of waste source and potential receiver in a symbiotic scheme).
Step 2: Region-specific technical matching
The second step of the matching algorithm is based on a waste stream database related to the industrial plants of the corresponding region. The database (populated with data provided by the regional industrial actors) contains a list of the waste streams produced (with the corresponding EWC Stat Code) as well as a list of the solid input streams, used as resources, which could be potentially replaced by a waste stream (and the industrial plant would consider that as an option). Based on the codes of both these streams, a one-to-one matching is used, which could lead towards the identification of the potential (region-specific) symbiotic schemes.
Step 3: Region-specific temporal matching
The third step is to check the temporal matching of the proposed symbiotic schemes utilizing the data provided by the industrial actors regarding the seasonal availability of the waste streams and the operation of the industrial units. No combinations are eliminated at this stage; however, if there is no seasonal matching, then an extra component is added later on in the economic matching, regarding the storage of the waste streams.
Step 4: Distance calculation
The fourth and final step of the technical matching process is to calculate the distance between the source and the potential receiver for each of the proposed symbiotic schemes. Due to the nature of the waste (solid), the only realistic options for the transportation is via truck (pipe transportation is not plausible). Thus, the distance calculated is not a straight line between the two points, but a valid route using existing road infrastructure.
Economic matching
The economic matching part of the algorithm focuses on the assessment of financial viability for each symbiotic scheme identified in the technical matching. In order to achieve that, the following two values need to be calculated, as a function of the agreed selling price of the waste (PW in €/tonne):
- the profit for the source; and
- the profit for the receiver.
In the following calculations, it has been assumed that the waste source will be responsible for the transportation cost of the solid waste stream, whereas the waste receiver will be responsible for the storage cost (if necessary).
Waste source
By implementing the symbiotic scheme, the industrial plant – source of the waste stream – will have a new income by selling the waste stream (W in tonnes per year). Moreover, the industrial plant will save money, which was previously allocated to the current management method of the respective waste stream (CMMW in € per tonne).
However, an additional cost is also incurred due to the transportation of the waste stream from the source to the receiver location. Due to the nature of the waste stream, the main mode of transportation will be via truck, so the total cost is a function of the truck capacity (C in tonnes), the truck fuel consumption (FCT in litres per km), the fuel price (PF in € per litre) and the distance covered (D in km).
The total profit of the waste source (Sprofit) is defined as follows:
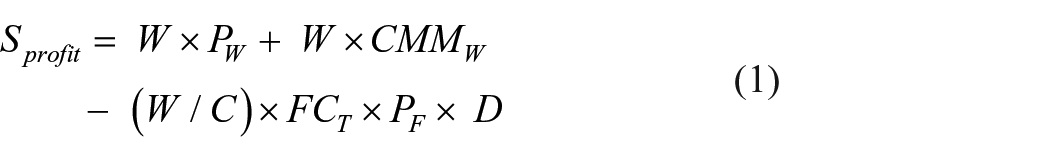
From equation (1), the minimum selling price of the waste that makes the Sprofit positive (the break-even waste price for the source – PWBES) can be determined. For that purpose, it has also been assumed that there are no additional costs incurred for the separation and collection of the waste stream, since it is already collected and treated separately as part of the current management method. However, if the waste stream needs to be further purified/treated, and brought up to receiver purification standards, then an additional cost will be incurred and needs to be added in equation (1).
Waste receiver
A similar approach is followed for the estimation of the break-even waste price for the receiver (PWBER). By implementing the symbiotic scheme, the industrial plant – potential receiver of the waste stream – will save money by purchasing a resource at a price (PW) lower than the commercial price of the same resource (PCOM in € per tonne).
However, an additional cost might be incurred due to the storage of the resource (STW in € per tonne), especially when there is no temporal matching between the source and the receiver availability.
The total profit of the waste receiver (Rprofit) is defined as follows:

From equation (2), the maximum selling price of the waste that makes the Rprofit positive (the break-even waste price for the potential receiver – PWBER) can be determined.
It has been assumed that there are no additional costs for the modification of the industrial process of the potential waste receiver, by assuming that the quality/characteristics of the waste stream is appropriate and similar to the commercial resource. If modification is required, then an additional cost is incurred and needs to be added in equation (2).
Economic viability assessment
If the break-even waste price for the source is lower than the break-even waste price for the potential receiver (PWBES < PWBER), the proposed symbiotic scheme is economically viable. An agreed selling price for the waste can be proposed as the average value of the two break-even points (PWBES + PWBER / 2).
If the break-even waste price for the source is greater than the break-even waste price for the potential receiver (PWBES > PWBER), then an agreed price cannot be determined with the existing economic figures and the assumptions made. In this case, a trade-off analysis can be performed independently by the platform user, assessing alternative options for the transportation or storage costs (full responsibility for the waste source/full responsibility for the waste receiver/split cost between the two involved parties). Equations (1) and (2) are used again, appropriately altered to calculate the new break-even prices. If an agreed selling price still cannot be determined, then the symbiotic scheme under investigation is characterized as non-economically viable and is rejected.
Algorithm output and interpretation
The main output of the algorithm, when applied in a given region, is a list of the technically feasible and economically viable symbiotic combinations between two industrial sites, one acting as the source of the solid waste and the other as the potential receiver. For each combination, the following characteristics are presented: (i) name, type and coordinates of source; (ii) name, type and coordinates of source; (iii) waste type and quantity exchanged; (iv) distance between source and sink; (v) cost of transportation and storage; and (vi) agreed price for the exchanged waste stream (if the combination is economically viable). This information can be used by all the involved users of the platform in different ways meeting their specific needs and goals.
The industrial managers (i.e. the users who are responsible for registering an industry in the platform) or the industrial participants (i.e. the users who are allowed to search for possible synergies for a specific industry registered to the platform) can identify all the potential symbiotic schemes that the industry in question can participate in. From this list, they can select this/these that better fit the industry. This decision depends on the specific characteristics of the industry and is left on the individual user. The criteria for the selection can range from simply the solution with the highest return on investment/lowest payback period to more complex ones (e.g. the environmental/waste management strategy of the company, storage availability, etc.)
Similarly, regional managers (i.e. users who are responsible for managing the information concerning the industrial region where the platform has been deployed) and regional participants (i.e. users who are allowed to view all existing synergies between all industries registered to the platform and to search for possible synergies based on holistic/regional objectives) can access the whole list for the region and identify (i) the waste stream that is more prominent in these symbiotic schemes, and (ii) the type of industries that is involved the most in such symbiotic schemes. This information is critical for policymakers (either at a regional or at a national level), since they can base on this their decisions regarding incentives to promote industrial symbiosis.
Conclusion
A novel platform is presented for assessing IS opportunities based on solid industrial waste reuse. The platform integrates key characteristics from previously developed tools and advances them by proposing a composite matching approach. The methodology consists of three interoperable matching algorithms: (i) a literature-based technical matching algorithm, which is supported by a detailed best practices database integrated into the platform; (ii) a region-specific technical matching algorithm, which is based on waste stream data collected from regional industrial actors; and (iii) an economic matching algorithm based on the assessment of financial viability for each symbiotic schema.
The platform has been finalized and is available at http://www.swanplatform.eu/. Currently, the platform includes details of more than 500 industrial plants from four countries (Greece, Albania, Bulgaria and Cyprus). The next steps in the platform development are, in the short term, to validate the algorithms using the real-life data, which have been already provided, and make the required amendments to support the four case studies. In the longer term, the aims are to (i) include a more dynamic calculation of the cost; (i) improve the matching algorithm by incorporating more flow characteristics; and (iii) extend the application to other types of waste streams (aqueous, air).
Footnotes
Declaration of conflicting interests
The authors declared no potential conflicts of interest with respect to the research, authorship, and/or publication of this article.
Funding
The authors disclosed receipt of the following financial support for the research, authorship, and/or publication of this article: The SWAN project is co-financed (85%) by the European Regional Development Fund (ERDF) under the umbrella of the European Union programme Interreg V-B “Balkan-Mediterranean 2014-2020”.