
Abstract
Policymakers, practitioners, and scholars have long-lauded digital technologies, such as smart waste containers or artificial intelligence for material recognition and robotic automation, as key enablers to more effective and efficient waste management. While these advances promise an increasingly digitalized future for collecting, sorting, and recycling waste material, little is known about the current extent of digitalization by waste management firms. Available studies focus on firms’ digitalization intentions, largely neglecting the level of actual adoption of digital technologies, and do not differentiate the level of digitalization alongside different steps of the waste management value chain. Our study reports on a cross-sectional descriptive survey that captures current digitalization efforts and strategies of 130 public and private waste management firms in Germany. We analyze their levels of digitalization along with different steps of the waste management value chain, explore their different objectives, approaches, and transformational measures with regard to digitalization. Our findings reveal that while the perceived importance of digitalization in the waste management sector continues to grow, the actual adoption of advanced digital technologies falls notably behind intentions reported in 2016 and 2017. We explore the reasons for this gap, point out so far largely ignored research opportunities, and derive recommendations for waste management firms and associations.
Introduction
Waste management has traditionally been a physical and mechanical sector focussing on the collection, sorting, and recycling or incineration of waste material. However, it is increasingly being targeted by solution providers that promise more effective and efficient operations through digital technologies, such as smart bins (e.g. Bigbelly, 2020), on-demand semi-autonomous trucks (e.g. Rubicon, 2020), or artificial intelligence (AI) for material recognition and robotic automation (e.g. AMP Robotics, 2020; ZenRobotics, 2020). In recent years, a number of new methods for waste management have emerged that are embodied in and enabled by digital technologies 1 , such as waste treatment on the basis of image recognition and machine data analysis (Waste Management World, 2021) or onsite waste separation through bin-integrated material detection sensors (Green Creative, 2018).
Notwithstanding these innovative use cases, little is known about the waste management sector’s current extent of digitalization, that is, the conversion of physical or analog processes, contents, or objects into a digital format by help of digital technologies (Fichman et al., 2014; Fitzgerald et al., 2014). Existing literature on the digitalization of waste management has focused on explorations of future digital technologies, such as concepts for digital waste management in sustainable cities (Anagnostopoulos et al., 2017; Esmaeilian et al., 2018), simulations for digital dispatching and routing (Ramos et al., 2018; Shah et al., 2018), smart bin prototypes (Rovetta et al., 2009), or software-enabled image classification for waste sorting (Wagland et al., 2012). Only three quantitative studies exist (Mavropoulos, 2017; Mechsner, 2017; Sarc and Hermann, 2018). However, these studies focus on firms’ digitalization intentions, largely neglecting the level of actual adoption of digital technologies, and do not differentiate levels of digitalization alongside different steps of the waste management value chain, such as between customer management & sales, dispatching & logistics, weighing & sorting, marketing of recyclable materials, recycling, disposal, or container management.
We address these limitations through our study that asks the research question: “What is the status-quo of digitalization by private and public waste management firms in Germany?” We report on a cross-sectional, descriptive survey that captures current digitalization efforts and strategies of 130 public and private waste management firms in Germany.
Method
Survey design
We conducted a quantitative cross-sectional online survey (Pinsonneault and Kraemer, 1993). The purpose of our survey was description, not explanation or prediction (Malhotra and Grover, 1998). Our aim was to ascertain facts about the status of digitalization such that a systematic basis of empirical data is laid out for future hypothesis development.
To design the survey, we consulted the literature, carried out four practitioner interviews, and visited three waste management firms (Appendix A) to understand the German waste management sector in terms of market structure, industry forces, typical value chain, and digital technologies relevant to the industry. Our unit of analysis were waste management firms (Karanja and Zaveri, 2013). We focused on capturing their current levels of digitalization, across (a) all steps of the waste management value chain, and (b) the variety of currently available digital technologies.
Regarding (a), we differentiated the waste management value chain into four successive and one cross-sectional step (Kerdlap et al., 2019; Sarc et al., 2019). Appendix B summarizes our conceptualization of a waste management value chain.
Regarding (b), we identified relevant digital technologies from prior digitalization studies in waste management (Mechsner, 2017; Sarc and Hermann, 2018) as well as other industrial sectors (Justenhoven et al., 2019; Reker and Böhm, 2013) and from our interviews and observations. Appendix C summarizes the technologies we consider.
Instrument development and testing
We followed the instrument development procedure by Moore and Benbasat (1991). First, we defined key measurement categories on basis of our understanding of the literature, our interviews, and site observations. To ensure comparability to prior waste management digitalization studies we included key measurements from prior studies, such as perceived impact of digitalization (Mechsner, 2017; Sarc and Hermann, 2018). In total, we identified seven measurement categories for our survey:
Second, in total, we created 61 measurement items (43 nominal, 18 ordinal) across these categories. For attitudinal measurements, we used 5-point scale matrices balancing the scales with an odd number of points and a neutral midpoint (Brace, 2004). For behavioral measurements, we used a 4-point scale with the pre-codes “not relevant,” “planned,” “in implementation,” and “in use.” We ensured that the items were mutually exclusive, as exhaustive as possible, and of appropriate detail (Brace, 2004). We incorporated no-response answer options for all questions except for demographics (Dillman, 2000; Ryan and Garland, 1999). All ordinal scales were controlled for order effects (Artingstall, 1977) and acquiescence (Kalton et al., 1980). We rotated some items to prevent bias (Brace, 2004).
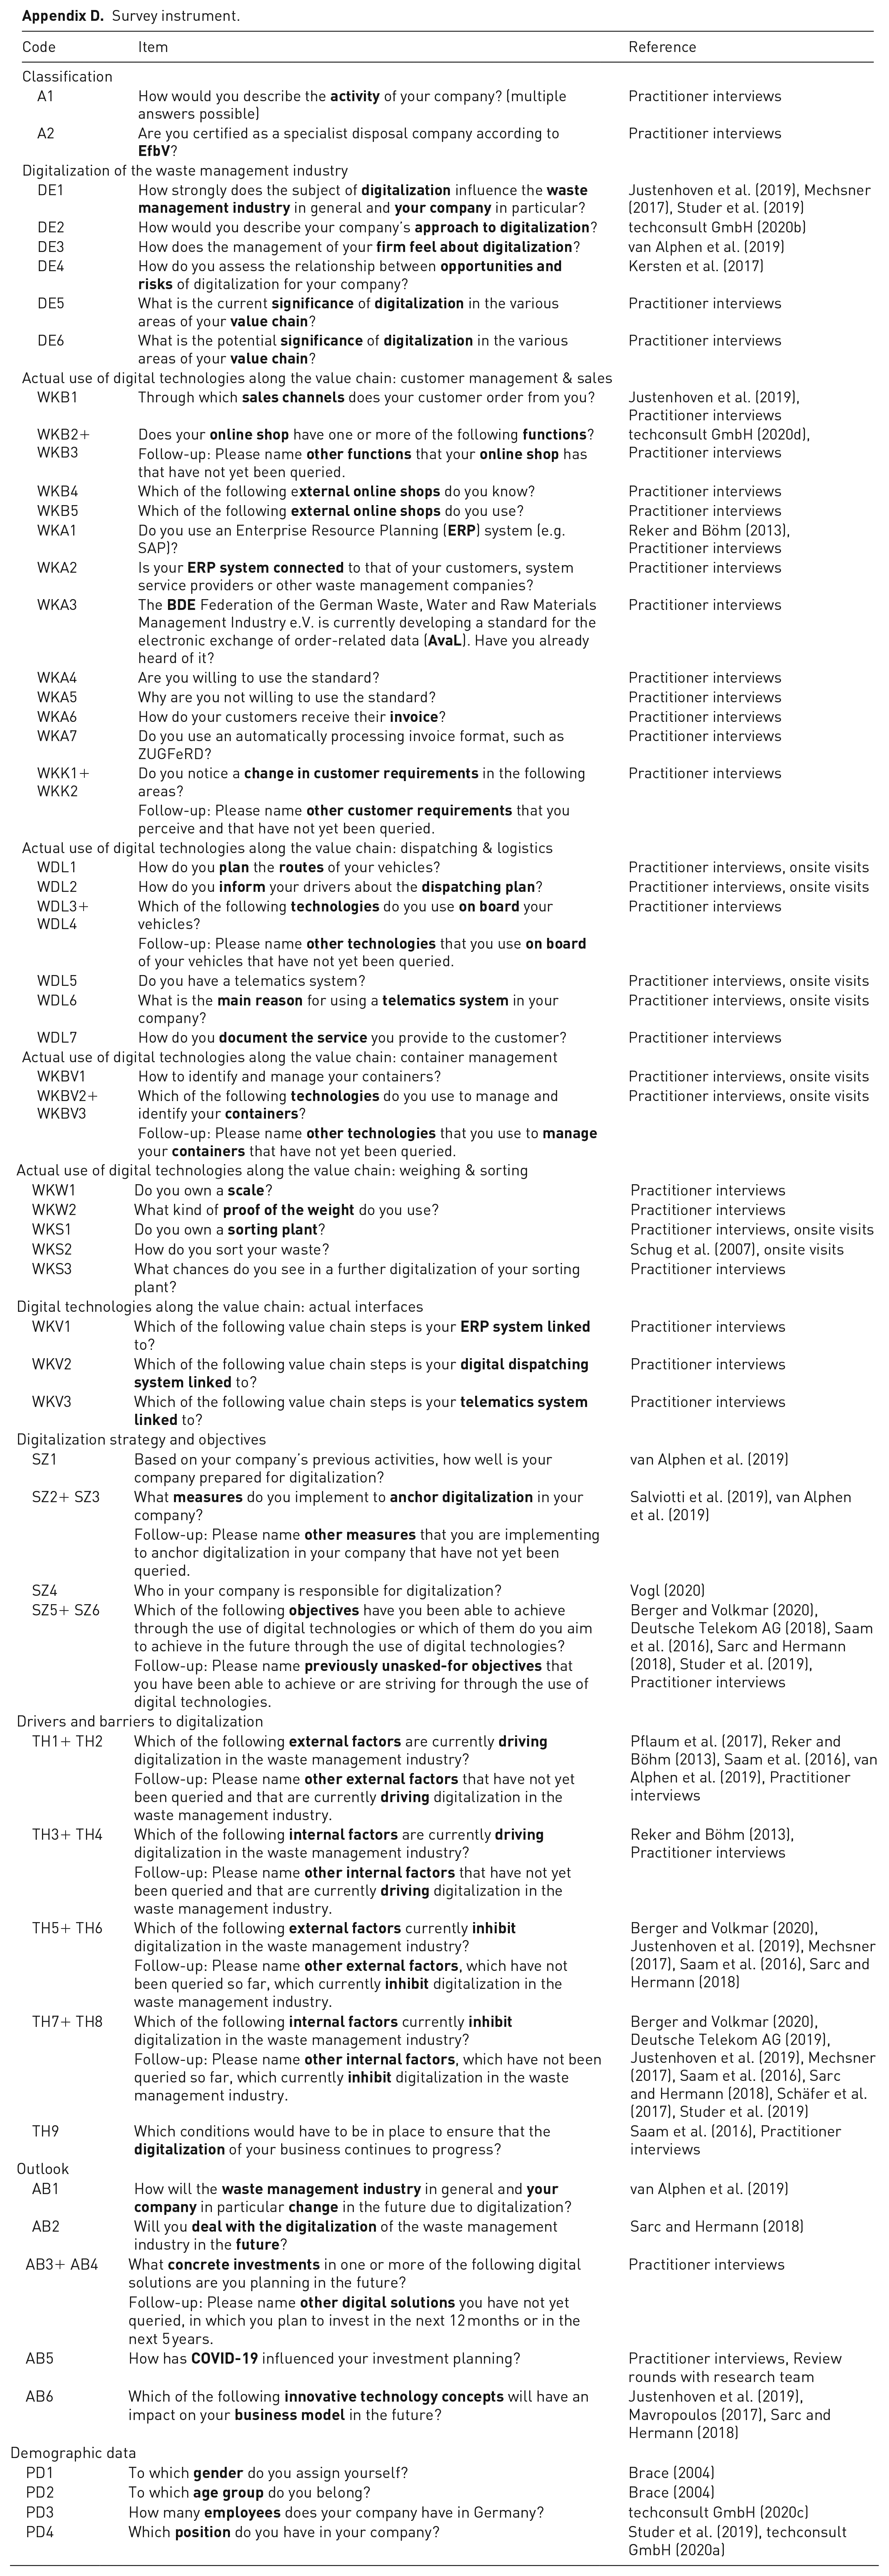
Third, we ensured content validity and face validity (Straub, 1989) by conducting an informal survey pilot with eight practitioners from a medium-sized waste management system service provider (Andrews et al., 2003). Based on the feedback, we revised the survey by adjusting the wording of some items and codes that were unclear and adopted the order of some pre-codes to align them with the value chain logic. The final survey questionnaire comprises 65 items (Appendix D).
Participants and procedures
We used non-probabilistic convenience plus unrestricted self-selected sampling (Schonlau et al., 2001; Truell, 2003). First, we contacted 831 private certified German waste management firms specialized in waste collection with the help of a medium-sized system service provider who distributed the link to the online survey by email. Second, to include public waste management firms, public–private partnerships, and non-certified waste management firms, we published a call for survey participation in German waste management trade magazines (EUWID Recycling und Entsorgung, 320grad.de, Recyclingmagazin, ZfK Zeitschrift für Kommunalwirtschaft, e-mag Entsorgungsmagazin, and RecyclingPortal.eu).
The online survey was live between June 15 and July 3, 2020. We sent two reminders, via post on June 22, 2020 and via email on June 29, 2020. Observing response spikes shortly after these dates, we considered the reminders effective.
Data screening, cleansing, and analysis
We received 241 responses. We removed 111 responses from participants who started the questionnaire but did not proceed beyond the first page (94 in total), showed biased response patterns, such as unrealistic survey completion times, extreme tendencies, or systematic answer patterns (5), or did not match our target population (12).
The large majority (91%) of the 130 respondents are commercial waste management firms. Eight municipal waste management firms and four others, such as a public-private partnership, participated in the survey. In total, 120 companies (92%) were certified as specialist waste management firms.
Most respondents (58%) were between 40 and 59 years old. The most often reported positions (28%) were owner, board member, or top manager, followed by other managerial positions (24%). The highest share of respondents (39%) worked for mid-size waste management firms that employ between 50 and 249 employees. Firms with less than ten employees, who make up about 60% of the German waste management sector (Statistisches Bundesamt, 2020), are underrepresented in our study (3%). Contrarily, firms with more than 50 employees are overrepresented in our study.
Before we commenced data analysis, we compared response means for 41 variables between early and late respondents through a Mann-Whitney-U test. Six variables (Management’s attitude toward digital change, Relationship between opportunities and risks, Potential impact of digitalization on customer management & sales, Potential impact of digitalization on weighing & sorting, Relevance of online marketplaces for future business model, Sum of the averages of internal drivers) showed a statistically significant difference, with early respondents reporting higher scores on these variables than late respondents. However, since our analysis of our data shows that small firms are on average less digital than larger firms, the difference between early and late respondents may also have emerged from the different distribution regarding the number of employees. We therefore decided to proceed with 130 survey responses in our analysis.
Because our survey’s purpose was descriptive, our data analysis strategy primarily relied on identifying relevant summative statistics (such as means, medians, standard deviations) and visualizations (such as box plots, pie charts, bar charts). But where appropriate, we also used inferential statistics to examine the statistical significance of between-group variations and correlations through chi-square, Mann-Whitney-U, and Kruskal-Wallis tests (Tabachnick and Fidell, 2014). We also performed cluster analysis based on the k-means algorithm (Ward method) to identify groups of respondents. We computed these tests using SPSS version 27.
Findings
Perceived relevance of digitalization to waste management
About 60% of all respondents currently perceive a strong or very strong impact of digitalization on their industry and on their firm (Figure 1). Approximately one out of ten respondents perceive only a small impact of digitalization on the industry and the firm. More respondents expressed a very strong influence of digitalization on their firms (29%) than on the industry (17%). Contrary to that, a strong impact of digitalization is indicated more often for the industry (44%) than for the firm (36%).
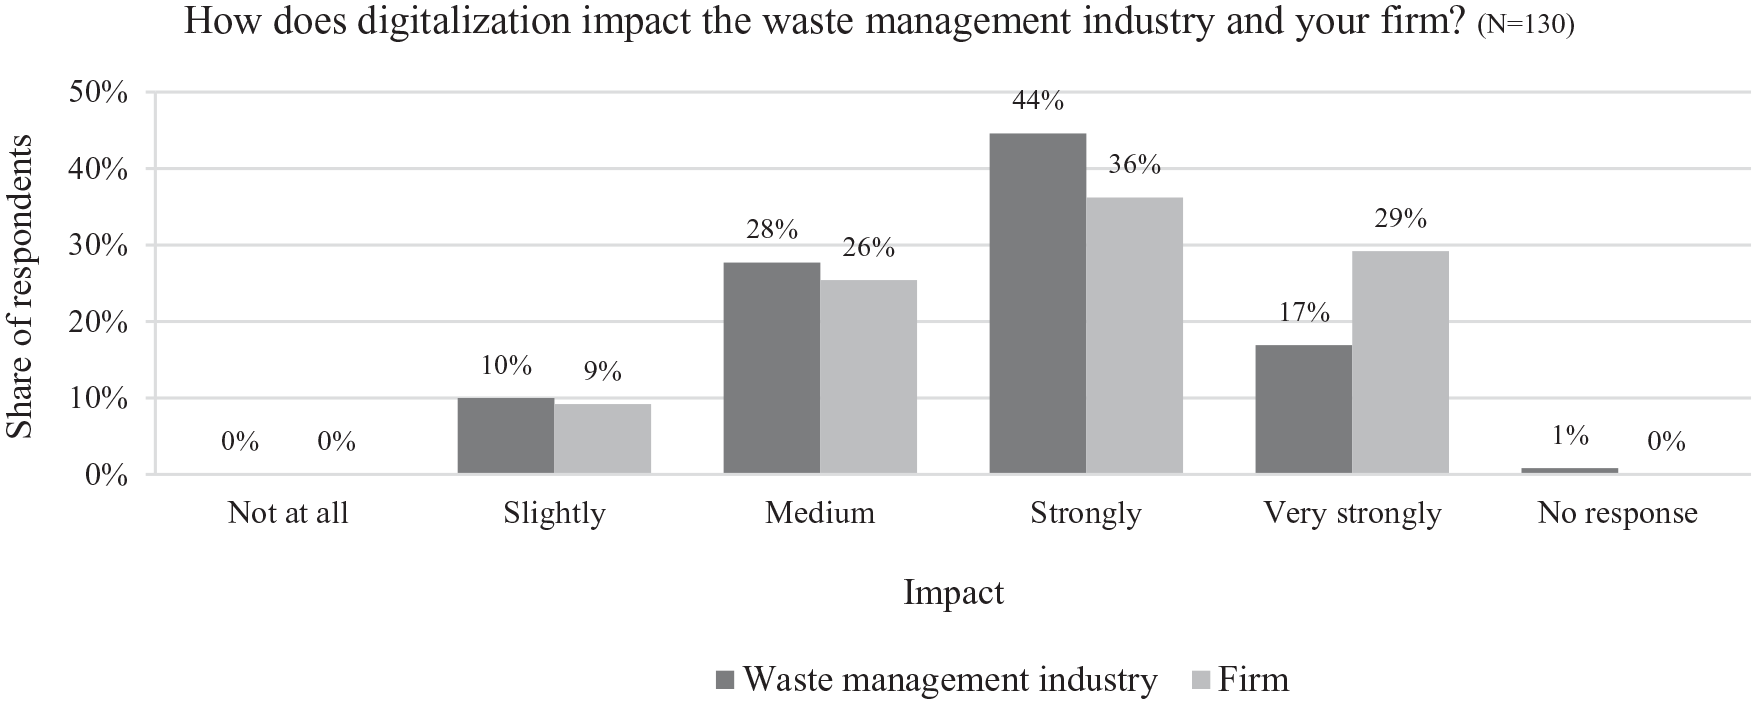
Influence of digitalization on waste management industry and firms.
We statistically explored differences in responses by organizational size. Our data shows that respondents with less than 50 employees feel on average statistically significantly less impacted by digitalization than respondents with more than or equal to 50 employees (Mann-Whitney-U test: z = -2.197, p = 0.028). Small firms are also statistically significantly more dispersed in their responses than larger firms. While about 20% to 30% of the small waste management firms each indicated a small, medium, strong, and very strong impact of digitalization on their firm, larger firms perceive majorly a strong or very strong impact (71%) (χ2 [3, n = 99] = 15.482, p = 0.001).
We discovered that 30% of the respondents believe that digitalization impacts their own firm more than the industry. 21% indicate that digitalization has a stronger impact on the industry than on their firm, the remaining 49% see an equally strong impact of digitalization on their firm and the industry. The number of employees has no influence on this distribution.
The majority of respondents (66%) view the digital change with confidence and observe either only opportunities or more opportunities than risks (74%). Approximately one quarter of the respondents has a neutral attitude toward the digital change (28%) and observes balanced risks and opportunities (22%). A small minority observes more risks than opportunities (5%) and feels concerned about the change (7%).
Current extent of digitalization in waste management
Digitalization along the waste management value chain
Digitalization has the highest impact on dispatching & logistics followed by weighing & sorting and customer management & sales (Figure 2). Two third of the respondents believe that dispatching & logistics is currently difficult (42%) or even impossible (26%) to be carried out without digitalization. Roughly half of the respondents believe that weighing & sorting and customer management & sales are difficult or impossible to be carried out without digitalization. Marketing of recyclable materials, recycling & disposal was indicated to be less impacted by digitalization. Today, less than 5% assume that this value chain step cannot be carried out without digitalization.
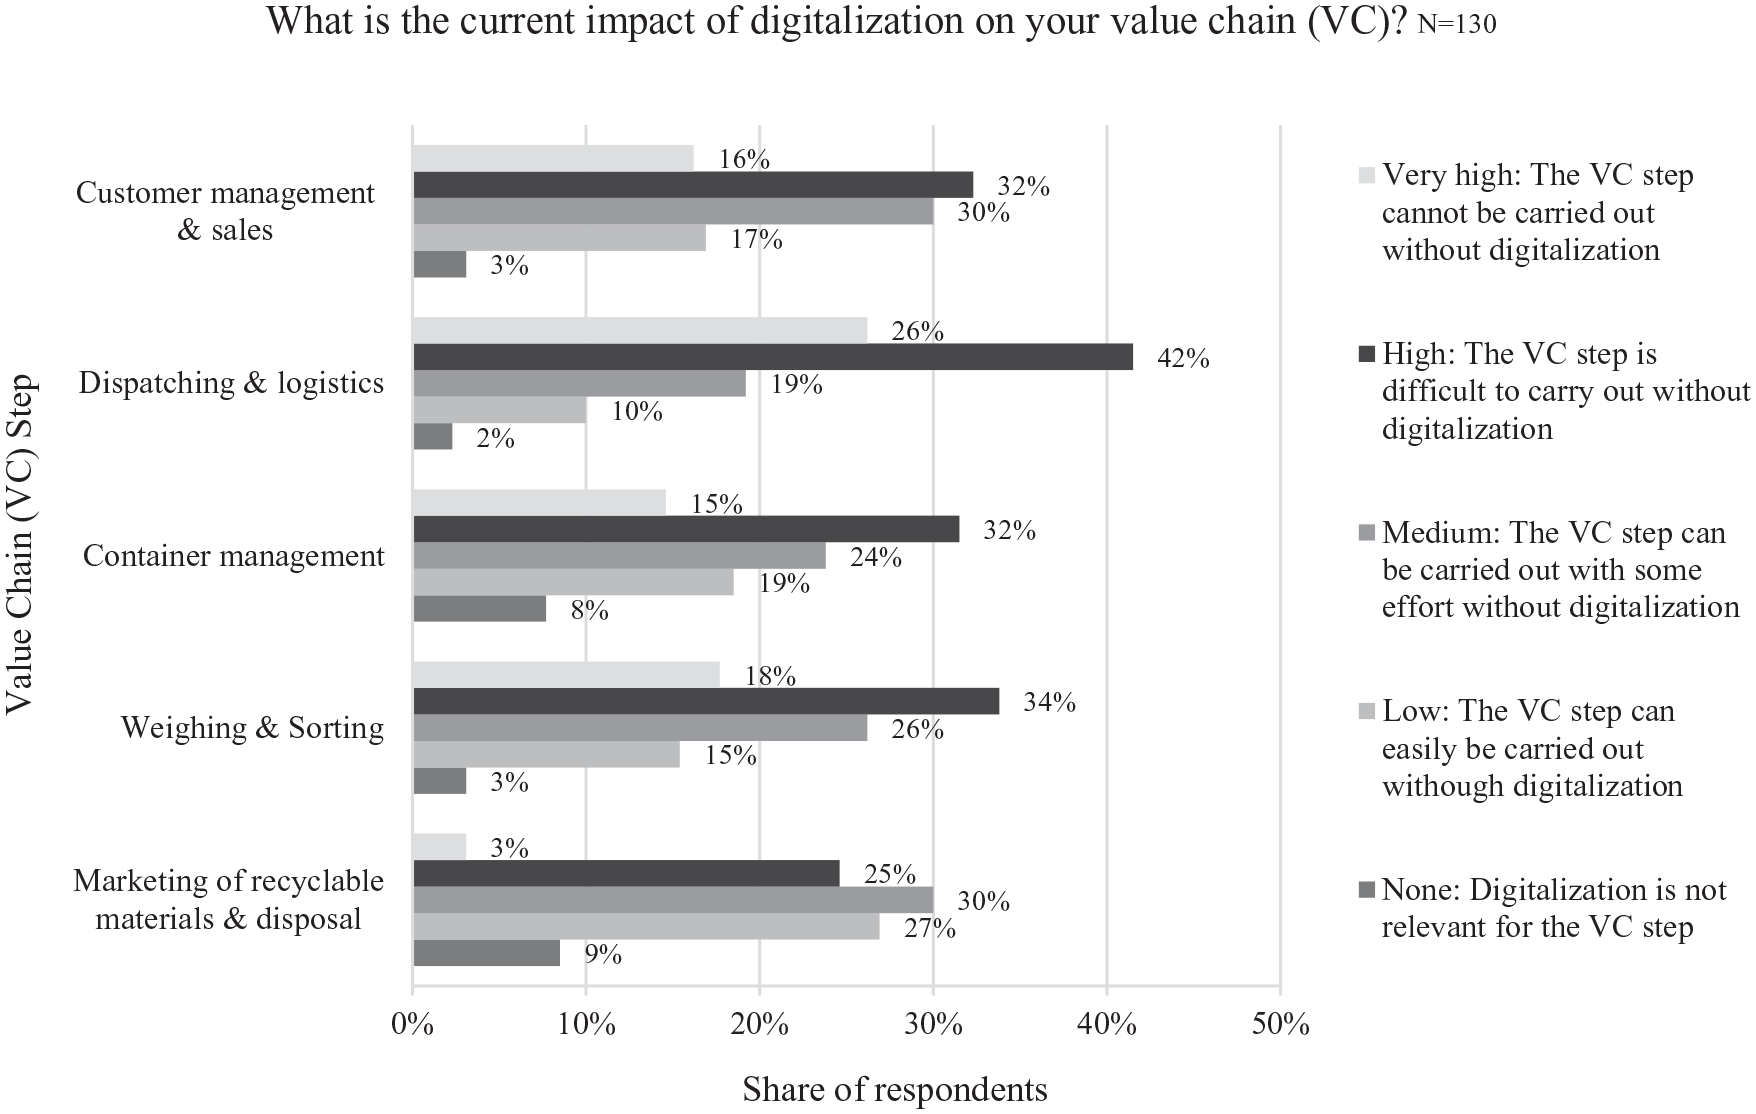
Current impact of digitalization on waste management value chain.
Analyzing the impact of digitalization on the five value chain steps in more detail, we discovered statistically significant differences in responses between commercial and non-commercial waste management firms. Commercial waste management firms feel a stronger current impact of digitalization in customer management & sales (Mann-Whitney-U test: z = -2.501, p = 0.012) and marketing of recyclable materials, recycling & disposal (Mann-Whitney-U test: z = -1.999, p = 0.046) than non-commercial waste management firms.
For
Existing internal online shops differ in their degree of functionality. About half of the respondents’ online shops offer digital methods of payment (50%) and real-time information on the price (55%). Real-time information on the delivery date and time and automated offer generation are included by one quarter of the online shops. In contrast to those respondents who use the functions, three out of ten respondents do not regard automated offer generation and real-time information on container availability to be relevant.
While almost 60% of the participants use an Enterprise Resource Planning (ERP) system, only 13% of them have it connected to systems of their customers, system service providers, or other waste management firms. This lack of interfaces and standards can also be noticed when examining the familiarity of the respondents with the standard for the exchange of order-related data, AvaL. Only 31% of all respondents have heard about AvaL. Furthermore, only 24% of the respondents use an automatically processing invoice standard such as ZUGFeRD. Instead, 95% of all waste management firms send their invoices via mail. 82% of the participants send invoices by email.
In
The most frequently used technology on board of vehicles is a simple navigation system (69%) (Figure 3). Other technologies (e.g. smartphone app for driver assistance, digital status monitoring of the vehicles, real-time transmission of data to office) have been implemented by between 21% and 40% of the respondents. In contrast, between 16% and 40% of the participants do not regard these digital technologies to be relevant.
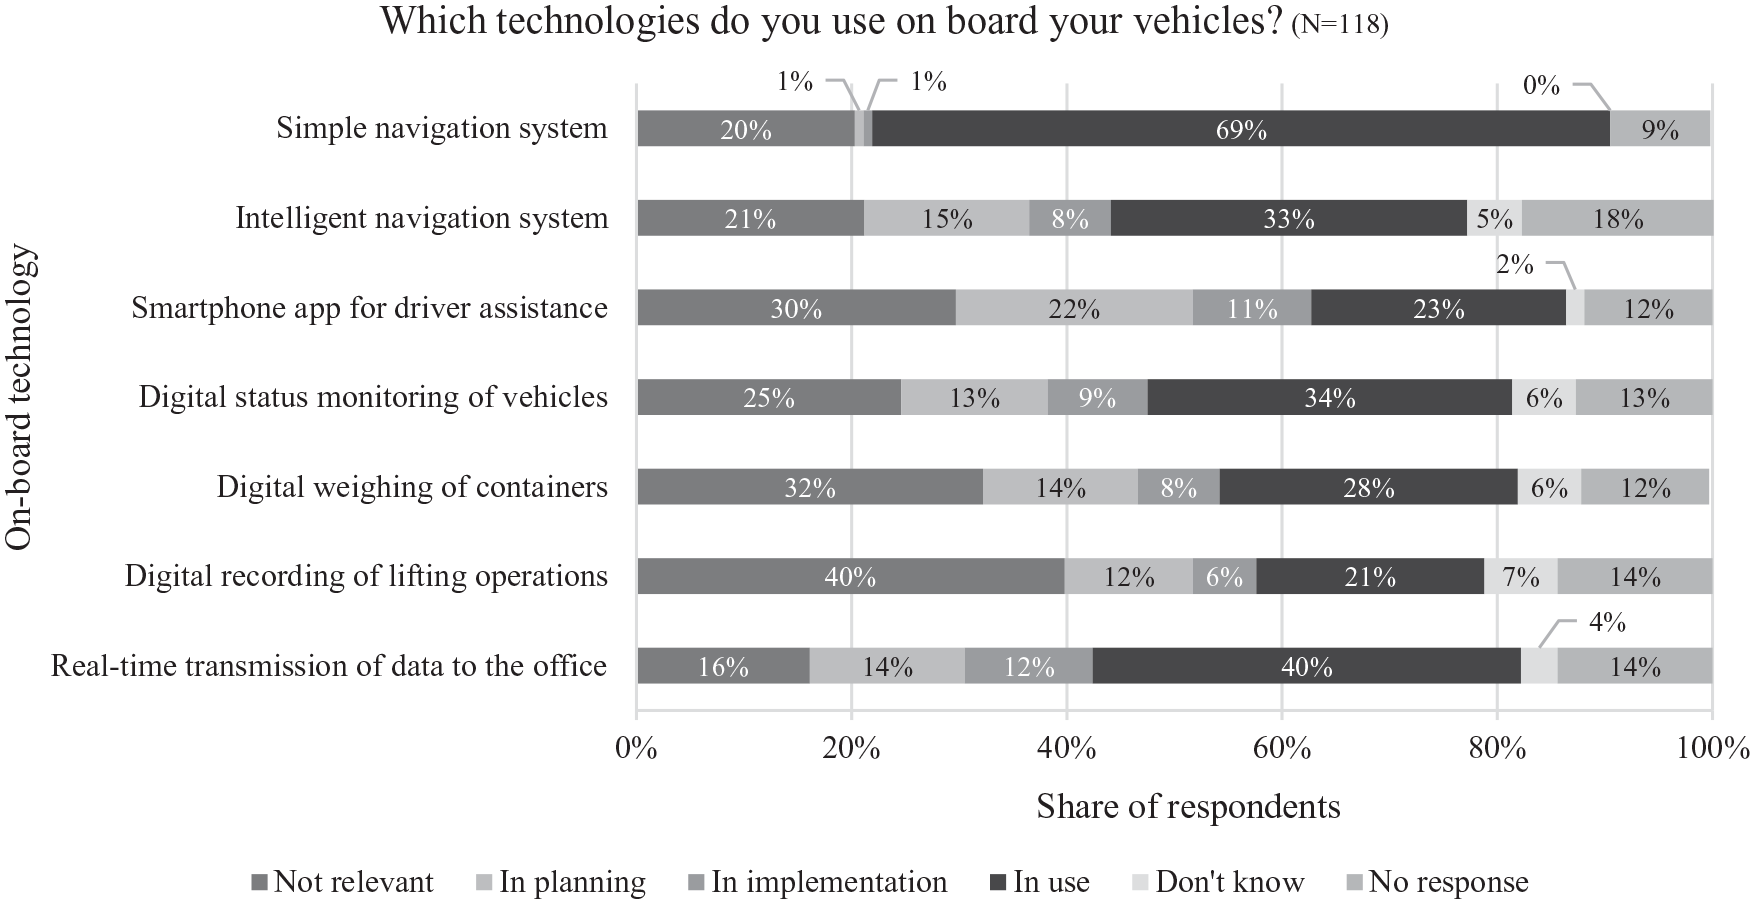
Use of digital technologies on board of vehicles.
Of all respondents, 68% use a telematics system, of which 69% use it for process optimizations and 17% for control purposes. 73% of the respondents using a telematics system also use a digital dispatching system. Firms that use an ERP system employ a telematics system statistically significantly more often than firms that do not (Mann-Whitney-U test: z = -2.192, p = 0.028).
73% of respondents use a printed proof of performance that needs to be signed with a pen; 35% of respondents use geocodes and time stamps; only 29% store the proof of performance on a digital device where the customer provides a digital signature. Often, more than one kind of documentation of service provision is used.
Almost 90% of all respondents indicate they use digital technologies to perform
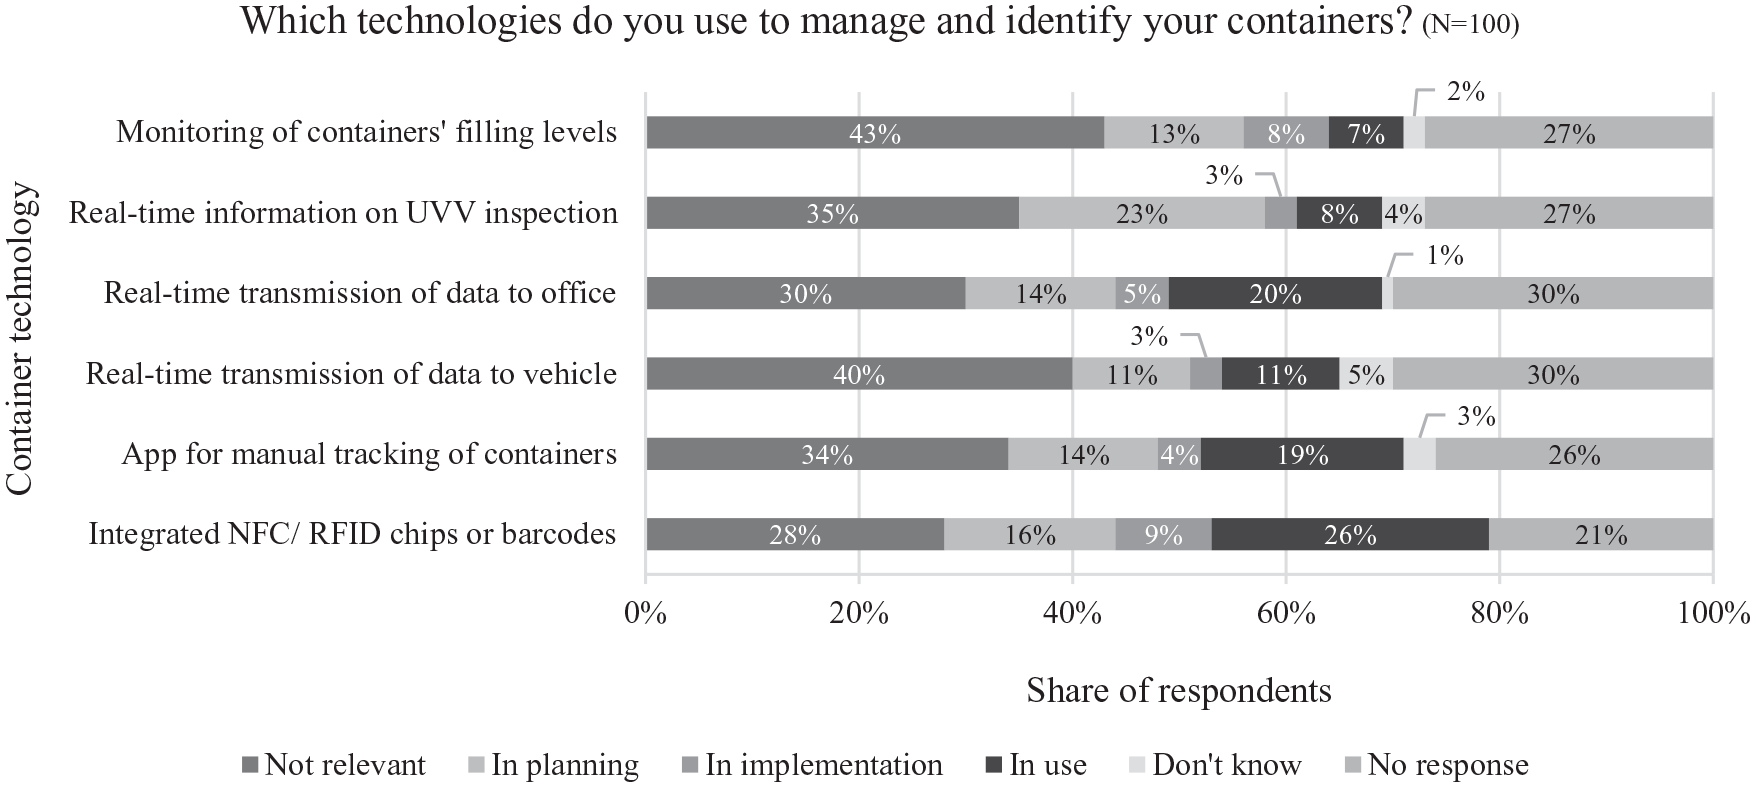
Use of digital technologies to manage and identify containers.
For
We further investigated the number of digital technologies reported as most relevant by the respondents for customer management & sales, dispatching & logistics, and container management (i.e., digital sales channels, ERP, digital dispatching, telematics, onboard driver app, digital container management). The distribution of used digital technologies differs considerably with regard to the number of employees (χ2 (18, n = 99) = 37.234, p = 0.005). While almost 50% of the respondents with 10–49 employees use zero or one digital technology, more than half of the respondents with 250–1000 employees use four or five technologies.
Running a k-means cluster analysis, we could differentiate the respondents based on their use of six digital technologies into three statistically significant (p = 0.000) groups: (1) analog waste management firms, (2) firms that use “basic” digital technologies, and (3) digital waste management firms (Figure 5). Group 1 (25% of the respondents) does not use any of the digital technologies. Group 2 (52%) implemented digital sales channels, an ERP system, a digital dispatching system, and a telematics system but no onboard computer and no digital container management. Group three (24%) uses on average all six digital technologies.
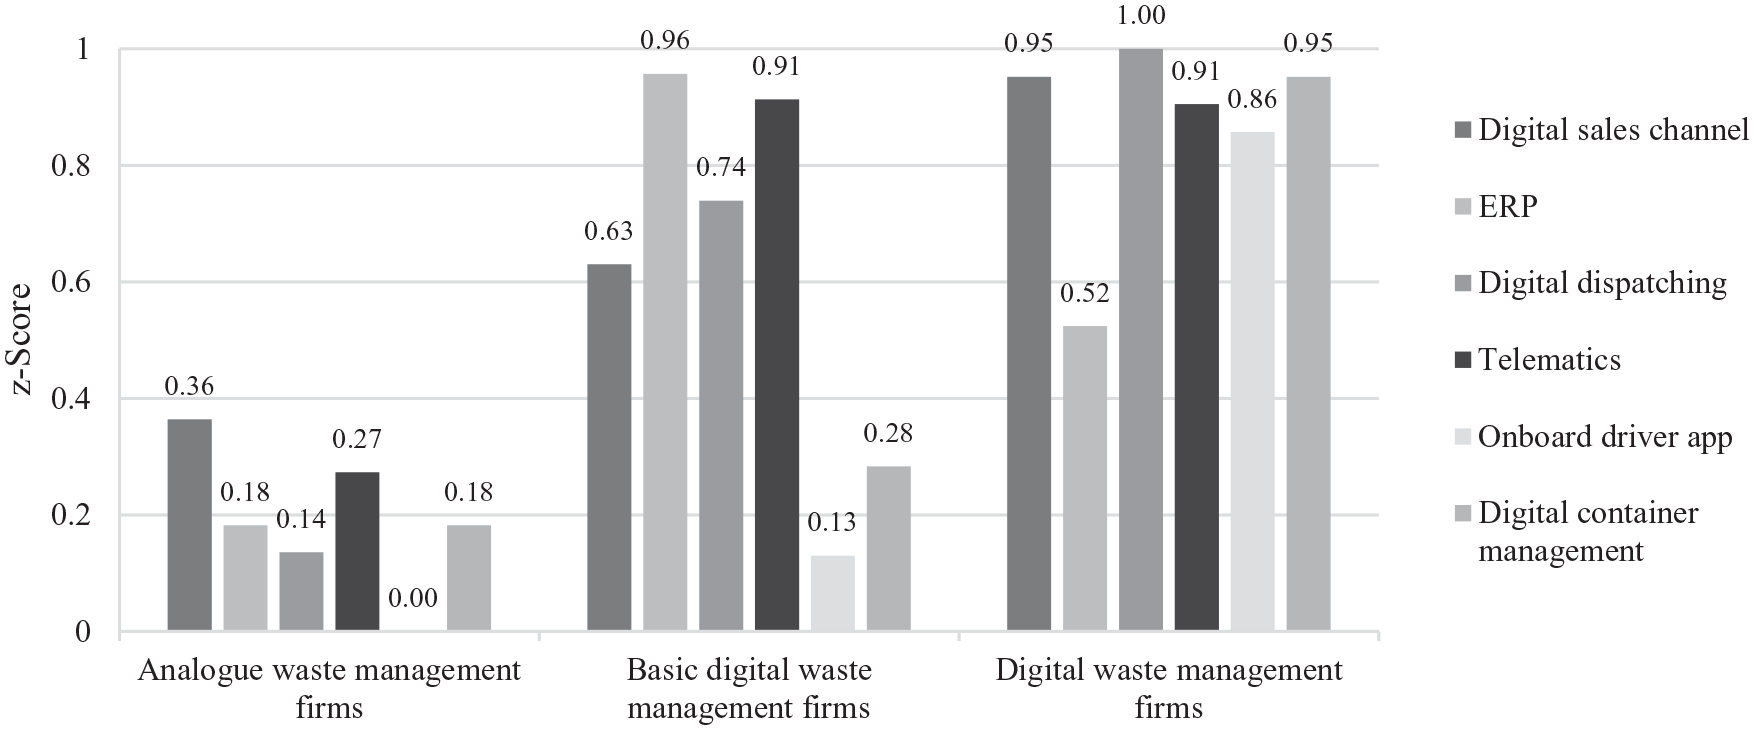
Cluster analysis of current use of digital technologies.
Digitalization strategy and objectives
Figure 6 describes
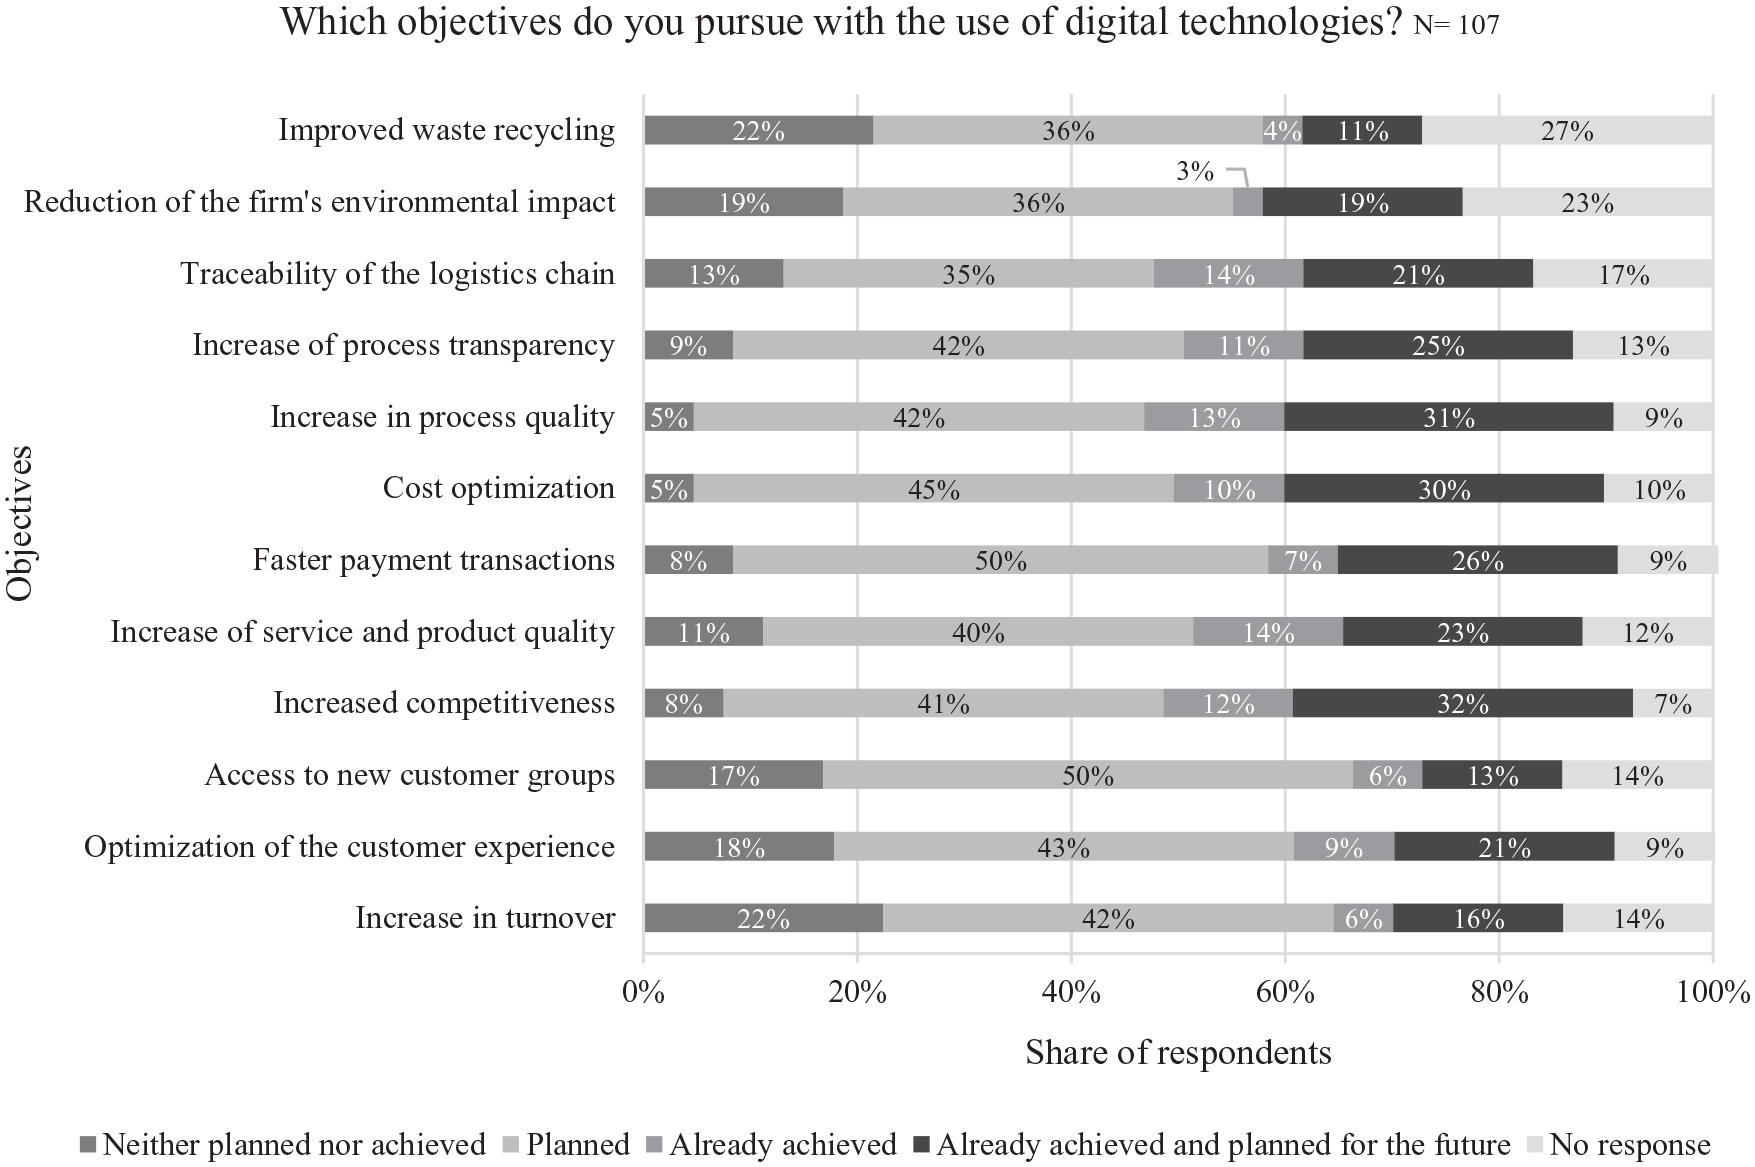
Objectives of digitalization.
More than half (57%) of survey respondents felt sufficiently or satisfactorily
To anchor their digitalization strategies within the firms, the three most preferred
We found statistically significant differences in the implementation of the measures between firms of different size, except for training employees, which was implemented in all firms. Larger firms significantly more often implement measures to anchor digitalization inside their business (Kruskal-Wallis test: H = 22.829, p = 0.000).
Finally, our results show that the
Digitalization drivers and barriers
Figure 7 displays the top-five
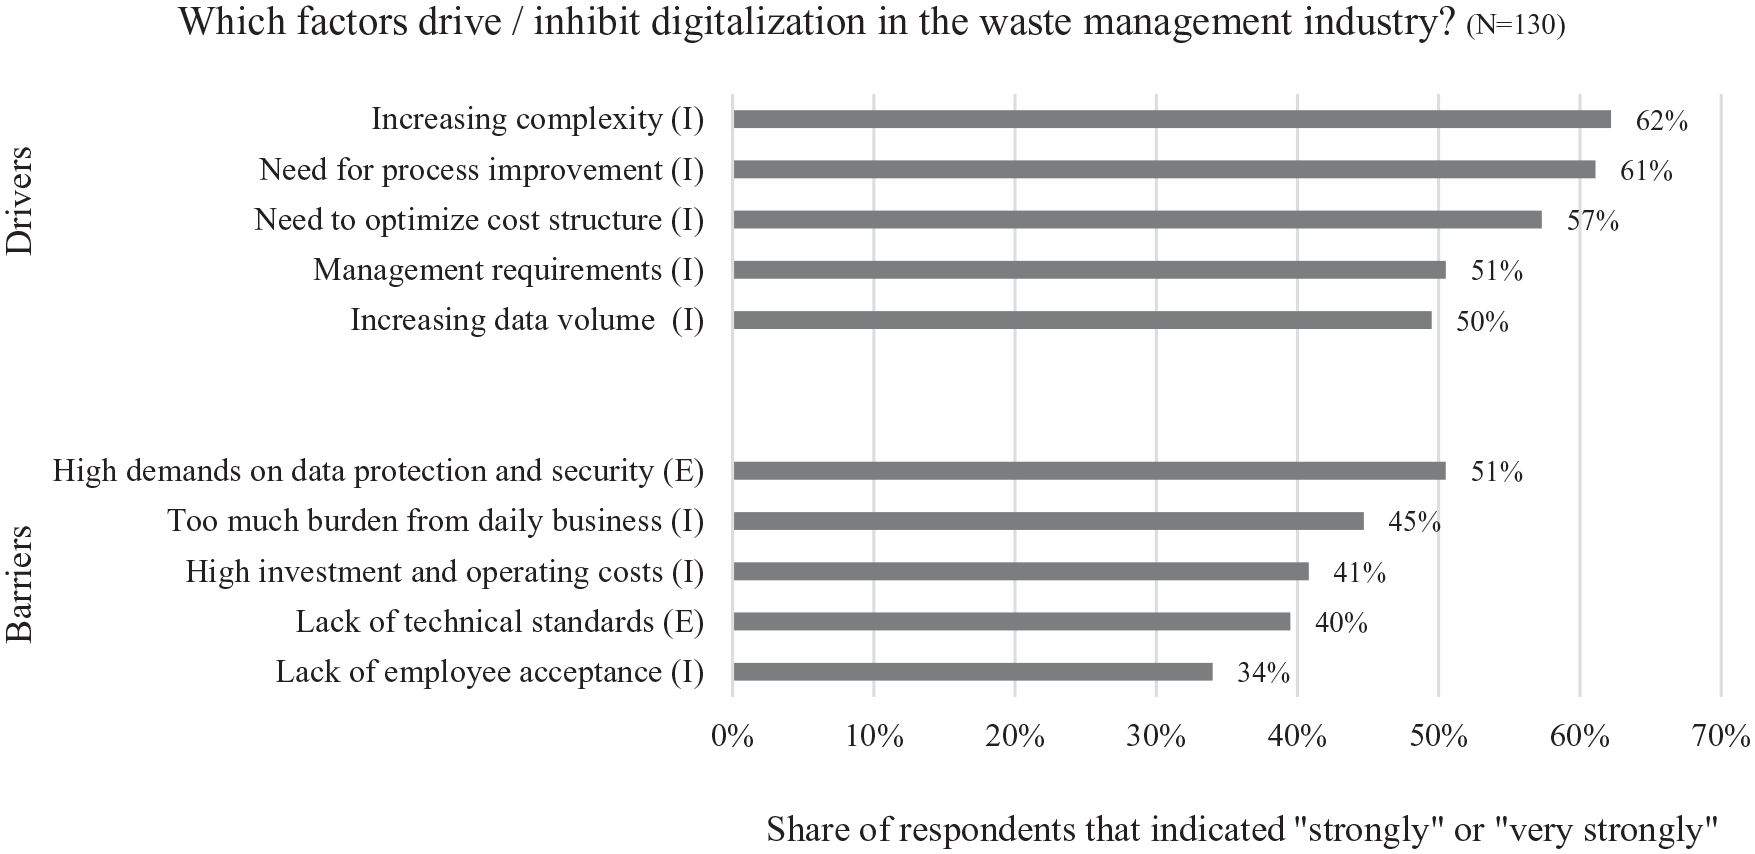
Top five drivers and barriers to digitalization.
In general, internal factors drive the digitalization of both small and large firms more than external factors. On average, 30% of the respondents feel strongly or very strongly driven by internal factors, such as an increasing complexity in daily operations, the needs to improve its processes and cost structures, or growing amounts of data that need to be handled. In contrast, respondents specified both internal and external barriers that hinder digitalization. Top barriers concern high demands on data protection and security (strong or very strong: 51%) followed by the burden from operating business (45%) and high investment and operating costs (41%).
Smaller firms feel statistically significantly less driven by internal (Mann-Whitney-U test: z = -2.153, p = 0.031) and external factors than bigger firms (Mann-Whitney-U test: z = -2.518, p = 0.012). We could not find any statistically significant differences between small and large firms with respect to internal (Mann-Whitney-U test: z = -0.038, p = 0.979) and external barriers (Mann-Whitney-U test: z = -0.893, p = 0.372) to digitalization.
Besides observing already existent drivers, we asked the participants which conditions would need to be in place to further progress digitalization in their firms. 61% of all respondents state that digital standards would need to be available, 49% see the need for a digital culture and management style, 42% regard the pressure on part of the customers as necessary, and 39% indicate that a pressure on part of the competitors would be required.
Future impact of digitalization on waste management
We examined how survey respondents looked at future digitalization of waste management. Almost 60% of the respondents assume that digitalization will strongly or very strongly change their firm and the industry in the future. 66% of all respondents plan to increasingly deal with digitalization in the future. Notably, our findings show that not all firms who feel a very strong impact of digitalization on their firm and on the industry today also believe that digitalization will very strongly change their industry and firm in the future. 30% of the respondents expect to keep the current level of engagement into digitalization.
Looking into the future, we examined the impact of ten innovative digital technology concepts such as AI or big data analytics on waste management firms. Our frequency analysis revealed that the Internet-of-Things, AI, drones, blockchain, and autonomous driving are not assumed relevant by a large number of respondents. More than 60% consider these technology concepts either not relevant or only relevant in more than 5 years. For the remaining five technology concepts that we investigated (robotics & sensor technology, online marketplaces, predictive analytics, cloud computing, and big data analytics) almost 50% of the respondents consider these technology concepts already relevant or believe that they will become relevant within the next 5 years.
We used a k-means cluster analysis to split the surveyed sample into three statistically significant (p = 0.000) groups: Group 1 (42% of the respondents), who on average assumes that the five innovative digital technology concepts big data analytics, cloud computing, online marketplaces, predictive analytics, and robotics & sensorics are relevant within the next 12 months; group 2 (32%), who believes that these technologies will be relevant within the next 5 years (cloud computing and online marketplace) or in more than 5 years (big data analytics, predictive analytics, robotics & sensorics); and group 3 (26%) that either do not know these digital technologies (predictive analytics and robotics & sensorics) or believe that they are not relevant (big data analytics, cloud computing, online marketplaces).
The respondents in group 1 are more aware and informed about digitalization projects in the industry, such as the development of AvaL. 64% of the firms in group 1 have heard about AvaL in comparison to those in group 2 (21%) and group 3 (15%) (Kruskal-Wallis test: H = 9.639, p = 0.008).
Discussion
Contributions in comparison to prior studies
Our study complements and expands three comparable prior studies on digitalization of the waste management industry (Mavropoulos, 2017; Mechsner, 2017; Sarc and Hermann, 2018). Our findings suggest a growing
In terms of implemented
Our analysis of
Three of the top four
Implications
Our findings suggest that waste management firms do not fully exploit the potential benefits of digital technologies available today. These findings lead to two main implications. First, because waste management firms implement digital technologies not to substitute but rather complement existing analog solutions, they need to manage both physical and digital processes, which we call the burden of parallel worlds. Second, waste management firms predominantly use digital technologies to reduce costs of operations, which is a risky strategy considering the changing business landscape as well as regulatory and societal requirements for waste management practices. We label this challenge the efficiency optimization limit of digitalization.
The burden of parallel worlds
When implemented, digital technologies are often used not exclusively for, but rather in addition to, analog tools or processes. For instance, digital sales channels are often used in parallel with traditional, analog sales channels. While 55% of the respondents employ at least one online sales channel, only 3% of them use it in an exclusive manner. Further, only 19% of the respondents who document their provided service via geocodes and time stamps use them exclusively, while almost 75% report that the delivery note is still signed by pen and paper.
Either waste management firms see no need to abolish analog processes because they are part of a well-functioning system or the installed customer base inhibits the exclusive use of digital technologies through existing analog path dependencies. First, the waste management sector can be understood as the epitome of an old, well-functioning system, in which, for instance, the three types of vehicles and containers have not changed over the past 60 years. Further, since the adoption of the first recycling and waste management act in 1996, the fundamental regulatory framework of the German waste management sector has not changed, effectively shielding public waste management firms against private competitors. This history has created a culture of inertia and reluctance to change impeding potentially disruptive digitalization.
Second, customers often demand analog processes, such as a proof of service provision by pen and paper, even though they can also be provided with geocodes and time stamps. As long as customers do not accept or demand a digital service provision, waste management firms are not willing to implement, let alone exclusively use, digital technologies. This “network effect” is particularly detrimental for the adoption of digital standards, such as AvaL or ZUGFeRD, in which a one-sided adoption means failure of the standard essentially impeding an advanced digitalization of customer-related interfaces.
We argue, this non-exclusive adoption of digital technologies risks the unfolding of parallel worlds that impose unnecessary burden on waste management firms. With parallel worlds, waste management firms must not only manage the infrastructure for analog processes but also deal with the operation of less familiar digital infrastructure. Further, both worlds still exhibit touch points, which are more commonly known as “media breaks.” For instance, if orders arrive via telephone, an additional step is required where the analog information is digitally recorded in the system, which is prone to potential flaws arising from manual recording (e.g. typos or process delays). Lastly, the burden of parallel worlds risks negative feedback loops, where negative experiences from non-exclusionary adopted digital technologies affect decisions on future digital technologies hampering an ongoing digitalization of the waste management firm.
The efficiency optimization limits of digitalization
Our survey showed that efficiency optimization is the main digitalization driver at present and in the future. Different explanations for this focus on digitalization as an efficiency driver exist. First, waste management firms may not be sufficiently informed about the potential functionality of digital technologies. For instance, only 31% of the respondents have heard about the availability of order-related data exchange standards. Second, perceived barriers, such as high data protection requirements (51%) and the lack of industry standards (41%), may impede the full exploitation of digital solution benefits. Third, waste management firms might see no need to innovate their processes by exploiting more potentials of digitalization. Waste management firms may simply not be incentivized to exploit the full functionality of their online shops or provide customers with live information on the delivery time of their containers.
By focussing on efficiency optimization, however, waste management firms may overlook the optimization limits of digitalization running the risk of pursuing objectives, which in the mid to long-term do not live up to increasing regulatory, societal, and economic requirements. We are not the first to point out this risk; it was also flagged by Mavropoulos and Nilsen (2020) who call for a disruption of “business as usual” optimizations. Three points about such a change appear worth highlighting:
Waste management firms have been traditionally understood as economic actors that efficiently take care of the waste of others. Changing regulations (e.g. extended producer responsibility) as well as large-scale societal trends calling for more sustainable production and consumption practices (Vergragt et al., 2014), impose new, more challenging roles on waste management. It remains questionable that digitalization employed as a cost efficiency driver will suffice to meet these growing requirements.
Digital-first waste management start-ups (e.g. Rubicon, 2020) occur on the horizon. While incumbent waste management firms feel safeguarded by high regulatory and economic barriers to entry, the digital promises by start-ups influence the perception of waste producers and policymakers raising the expectations about digitalized waste management.
Commercial waste producers start integrating disposal and recycling processes into their own business. This reduces demand for incumbent waste management firms and creates new competitive pressures.
Limitations and future research opportunities
Several limitations need to be mentioned. First, we used a non-probability convenience sampling approach and distributed the questionnaire via the network of the system service provider resulting in a sample primarily representing private waste management firms with more than or equal to ten employees. Our second sampling technique, the unrestricted self-sampling approach, bears the limitation that the survey needed to be openly accessible. We justify this limitation by the fact that we wanted to open our survey to waste management firms other than those in the network of the system service provider.
Second, our findings are limited to the German waste management sector. It would be interesting to investigate, however, how waste management firms from other regions answer our survey.
Third, future research should expand the temporal reach of our study. Our openly available survey instrument (Appendix D) could be used to build a digitalization progress indicator tool that measures progress in the actual digital transformation of the global waste management industry over time, if a survey such as ours were to be repeated in regular time intervals (e.g. annually).
Fourth, data collection was impeded by the concurrent onset of the Covid-19 pandemic in Europe. While our invitations to participate were distributed digitally and via mail, the onset of the pandemic may have contributed to a perceived lack of time or lack of current relevance.
Fifth, our study did not address the entire waste life cycle. Digital technologies increasingly also feature in new solutions for waste reduction and recycling. For example, image recognition and machine data analysis technologies are being explored to improve waste treatment (Waste Management World, 2021). Future research should therefore expand the topical coverage of our survey to study the progress of digitalization not only in waste management but also waste reduction and recycling.
Conclusions and recommendations
Our findings show that digitalization is an increasingly important topic on the agenda of waste management firms. Yet, many firms only half-heartedly engage with digitalization resulting in non-exclusive implementations of digital technologies that predominantly aim at the optimization of existing, intra-organizational business processes for efficiency.
Our findings confirm the need for further research on the digital transformation of incumbent, largely non-digital infrastructures for waste management. Findings from other domains suggest that network effects may play a significant role in the adoption of digital technologies in incumbent infrastructures with multiple actors (Constantinides et al., 2018). It remains to be investigated whether digital technologies will contribute to a platformization of such infrastructures and whether these technologies will change traditional underlying market and governance structures.
Our findings indicate a gap between reported digitalization intentions and actual adoption for advanced digital technologies. Our insights imply that waste management firms may find that the burden of their operative business and high adoption costs are hindering them in pursuing more ambitious digitalization objectives. As a possible lightweight mitigation strategy, we suggest training existing employees and let them engage with digital technology providers, who offer modular solutions that can be quickly ramped up and tested without large financial and operational risks.
Further, advanced digital technologies tend to exhibit increasing returns to adoption (Fichman and Kemerer, 1999), that is, their benefits grow with more users adopting the digital technology (Katz and Shapiro, 1986). We, therefore, recommend digital technology providers to either employ platform rather than product-centric business models or, at least, ensure that their digital product complies with industry-wide data standards. A platform business logic stresses that digital technology providers are not only selling a digital solution to a waste management firm but essentially to its customers (waste producers) and business partners (waste recyclers) as well. Established data standards ensure that data can flow with the waste stream through the entire waste management value chain, thereby, enabling its end-to-end digitalization.
Our findings also highlight an obligation for waste management associations to continue investing into educating waste management firms about the benefits, barriers, and approaches to digital technologies, and extend these efforts to waste producers as they play an important role in adopting digital technologies as well. New education is required on emergent data protection concerns that hinder many waste management firms in pursuing more ambitious digitalization objectives.
Lastly, we suggest facilitating the exchange between waste management firms and digital start-ups. While digital start-ups were framed as “not very threatening disruptors in the rear-view mirror” in practitioner interviews, we suggest considering them at least as digitalization drivers, valuable informants, and potential technology providers.
Footnotes
Appendix
Survey instrument.
| Code | Item | Reference |
|---|---|---|
| Classification | ||
| A1 | How would you describe the |
Practitioner interviews |
| A2 | Are you certified as a specialist disposal company according to |
Practitioner interviews |
| Digitalization of the waste management industry | ||
| DE1 | How strongly does the subject of |
Justenhoven et al. (2019), Mechsner (2017), Studer et al. (2019) |
| DE2 | How would you describe your company’s |
techconsult GmbH (2020b) |
| DE3 | How does the management of your |
van Alphen et al. (2019) |
| DE4 | How do you assess the relationship between |
Kersten et al. (2017) |
| DE5 | What is the current |
Practitioner interviews |
| DE6 | What is the potential |
Practitioner interviews |
| Actual use of digital technologies along the value chain: customer management & sales | ||
| WKB1 | Through which |
Justenhoven et al. (2019), Practitioner interviews |
| WKB2+ WKB3 | Does your |
techconsult GmbH (2020d), Practitioner interviews |
| Follow-up: Please name |
||
| WKB4 | Which of the following e |
Practitioner interviews |
| WKB5 | Which of the following |
Practitioner interviews |
| WKA1 | Do you use an Enterprise Resource Planning ( |
Reker and Böhm (2013), Practitioner interviews |
| WKA2 | Is your |
Practitioner interviews |
| WKA3 | The |
Practitioner interviews |
| WKA4 | Are you willing to use the standard? | Practitioner interviews |
| WKA5 | Why are you not willing to use the standard? | Practitioner interviews |
| WKA6 | How do your customers receive their |
Practitioner interviews |
| WKA7 | Do you use an automatically processing invoice format, such as ZUGFeRD? | Practitioner interviews |
| WKK1+ WKK2 | Do you notice a |
Practitioner interviews |
| Follow-up: Please name |
||
| Actual use of digital technologies along the value chain: dispatching & logistics | ||
| WDL1 | How do you |
Practitioner interviews, onsite visits |
| WDL2 | How do you |
Practitioner interviews, onsite visits |
| WDL3+ WDL4 | Which of the following |
Practitioner interviews |
| Follow-up: Please name |
||
| WDL5 | Do you have a telematics system? | Practitioner interviews, onsite visits |
| WDL6 | What is the |
Practitioner interviews, onsite visits |
| WDL7 | How do you |
Practitioner interviews |
| Actual use of digital technologies along the value chain: container management | ||
| WKBV1 | How to identify and manage your containers? | Practitioner interviews, onsite visits |
| WKBV2+ WKBV3 | Which of the following |
Practitioner interviews, onsite visits |
| Follow-up: Please name |
||
| Actual use of digital technologies along the value chain: weighing & sorting | ||
| WKW1 | Do you own a |
Practitioner interviews |
| WKW2 | What kind of |
Practitioner interviews |
| WKS1 | Do you own a |
Practitioner interviews, onsite visits |
| WKS2 | How do you sort your waste? | Schug et al. (2007), onsite visits |
| WKS3 | What chances do you see in a further digitalization of your sorting plant? | Practitioner interviews |
| Digital technologies along the value chain: actual interfaces | ||
| WKV1 | Which of the following value chain steps is your |
Practitioner interviews |
| WKV2 | Which of the following value chain steps is your |
Practitioner interviews |
| WKV3 | Which of the following value chain steps is your |
Practitioner interviews |
| Digitalization strategy and objectives | ||
| SZ1 | Based on your company’s previous activities, how well is your company prepared for digitalization? | van Alphen et al. (2019) |
| SZ2+ SZ3 | What |
Salviotti et al. (2019), van Alphen et al. (2019) |
| Follow-up: Please name |
||
| SZ4 | Who in your company is responsible for digitalization? | Vogl (2020) |
| SZ5+ SZ6 | Which of the following |
Berger and Volkmar (2020), Deutsche Telekom AG (2018), Saam et al. (2016), Sarc and Hermann (2018), Studer et al. (2019), Practitioner interviews |
| Follow-up: Please name |
||
| Drivers and barriers to digitalization | ||
| TH1+ TH2 | Which of the following |
Pflaum et al. (2017), Reker and Böhm (2013), Saam et al. (2016), van Alphen et al. (2019), Practitioner interviews |
| Follow-up: Please name |
||
| TH3+ TH4 | Which of the following |
Reker and Böhm (2013), Practitioner interviews |
| Follow-up: Please name |
||
| TH5+ TH6 | Which of the following |
Berger and Volkmar (2020), Justenhoven et al. (2019), Mechsner (2017), Saam et al. (2016), Sarc and Hermann (2018) |
| Follow-up: Please name |
||
| TH7+ TH8 | Which of the following |
Berger and Volkmar (2020), Deutsche Telekom AG (2019), Justenhoven et al. (2019), Mechsner (2017), Saam et al. (2016), Sarc and Hermann (2018), Schäfer et al. (2017), Studer et al. (2019) |
| Follow-up: Please name |
||
| TH9 | Which conditions would have to be in place to ensure that the |
Saam et al. (2016), Practitioner interviews |
| Outlook | ||
| AB1 | How will the |
van Alphen et al. (2019) |
| AB2 | Will you |
Sarc and Hermann (2018) |
| AB3+ AB4 | What |
Practitioner interviews |
| Follow-up: Please name |
||
| AB5 | How has |
Practitioner interviews, Review rounds with research team |
| AB6 | Which of the following |
Justenhoven et al. (2019), Mavropoulos (2017), Sarc and Hermann (2018) |
| Demographic data | ||
| PD1 | To which |
Brace (2004) |
| PD2 | To which |
Brace (2004) |
| PD3 | How many |
techconsult GmbH (2020c) |
| PD4 | Which |
Studer et al. (2019), techconsult GmbH (2020a) |
Declaration of conflicting interests
The authors declared the following potential conflicts of interest with respect to the research, authorship, and/or publication of this article: This study has been conducted with partial financial support from Zentek Services GmbH & Co. KG. Zentek provided the authors with contacts to waste management firms and waste management magazines to distribute the survey. Zentek was not involved in research design, data analysis, or reporting of findings. All faults remain with the authors.
Funding
The authors disclosed receipt of the following financial support for the research, authorship, and/or publication of this article: The authors received partial financial support from Zentek Services GmbH & Co. KG.