
Abstract
In the UK, the majority of offensive waste is disposed of at landfills. However, producers have a duty of care under the Waste Hierarchy to divert waste away from landfill. Using case studies from the East of England, the East Midlands and West Midlands in England, this study sought to quantify the waste arisings disposed of to landfill and to understand the reasons why. The findings show that offensive waste arisings, treatment method and costs varied by region, only a fraction of the waste disposed of to landfill in the East of England, compared with the majority being disposed of to landfill in the East Midlands and West Midlands. Despite the financial implications of landfilling being the lowest cost per tonne option, the key barriers to moving away from disposal to landfill was a lack of available alternatives, and it being the only option offered by the waste contractor.
Introduction
In addition to representing the loss of valuable resources from the resource chain, disposal of waste to landfill presents environmental hazards and requires careful management to reduce negative environmental impacts, such as acute toxicity, carcinogenic effects, habitat alteration and contributions to climate change (Gupta et al., 2015; United Nations Environment Programme, 2015).
Waste producers in the United Kingdom (UK) have a duty of care for the waste they generate, and are obligated to ensure that, along with all other statutory instruments, the Waste Hierarchy is adhered to during its disposal (Department for Environment Food and Rural Affairs, 2011). The Waste Hierarchy places waste disposal options, such as landfill, as the least desirable waste treatment methods that should be considered only once alternative options have been exhausted.
Some 590,955 t of waste were produced by the National Health Service (NHS) in 2016/17, of which 88,594 t were disposed of to landfill (NHS Digital, 2018). In contrast to a downward trend for overall landfill disposal, a comparative increase for landfill of offensive waste has been observed since 2006 (Williams, 2018). This study therefore sought to examine how much offensive waste was being disposed of at landfill by NHS Trusts in the Midlands and East region of England, and what were the barriers or financial costs to its diversion to an alternative means of disposal? An understanding of how best to divert the waste from landfill is crucial, as even though the wastes are not hazardous, their bulk means that they are a key contributor to the filling of void space in landfills. In addition, the management of the waste also has cost and regulatory implications for the healthcare sector.
Landfilling of waste
Historically, landfill has been widely available in the UK (HM Government, 2018). The overreliance on landfill for waste disposal has resulted in many UK landfills reaching capacity. Consequently, despite 330 out of 516 permitted landfills accepting waste in England in 2017, only 6.3 years of non-hazardous landfill lifespan was available (Environment Agency, 2017). This is a decrease from the 6.8 years stated in the year prior (Environment Agency, 2016a). The East Midlands observed the biggest reduction in landfill capacity, from 13.6 years of capacity in 2016, to 9.8 years in 2017 (Environment Agency, 2016a, 2017). In contrast, the South East and the Yorkshire and Humber regions observed an increase in landfill capacity in 2017 when compared with 2016 (Environment Agency, 2016a, 2017). Within the geographical focus area for this study, the East Midlands contains 16% (n = 82) of all landfills in England compared with 13% in the East of England (n = 67) and 7% (n = 37) in the West Midlands (Department for Environment Food and Rural Affairs, 2016).
Offensive waste
Non-hazardous wastes represent around 85% of global healthcare waste arisings (World Health Organization, 2018). While also referred to as ‘human hygiene’ and ‘sanpro’ waste, wastes defined under code 18-01-04 of the List of Wastes (England) Regulations 2005 are stipulated as ‘offensive waste’ – the recognised term for such wastes (Department of Health, 2013). Offensive wastes are defined as wastes that are not subject to special collection and disposal requirements to prevent infection, but may be unpleasant to those coming into contact with them owing to smell, appearance or odour (e.g. feminine hygiene waste and nappies).
In 2016, some 143,465 t of offensive waste were sent to landfill or treatment by permitted waste facilities in England (Environment Agency, 2016b). The majority of this waste was deposited to landfill (80% – 114,968 t). While there was a decrease in waste deposited to landfill in 2016/17, conversely, for offensive waste, there was a 39.7% increase for the same period (Williams, 2017).
After landfill, Williams (2018) found that healthcare and municipal waste to energy (WtE) technologies were the next most used. At the time of the study, the region from which the majority of offensive waste originated was the South East, with the Midlands and East regions producing 27% (38,725 t) of offensive waste. Offensive waste in the Midlands and East accounted for 30% (34,796 t) of all offensive waste landfilled in England, but only 14% (3928.98) of all offensive waste treated. In total, 90% of offensive waste in the Midlands and East region was landfilled, with only 10% being sent for treatment. During the time of the study, some 12% (17,257.78 t) of offensive waste was sent to landfill (Environment Agency, 2016b). Despite the waste being routinely disposed of at landfill, it is also permitted for this waste stream to be recycled or incinerated (preferably with energy recovery) (Department of Health, 2013). At the time of the study, the East region contained six incineration facilities, representing 7% of all facilities in England and 21% of facilities in the Midlands and East region (Environment Agency, 2017).
While regulatory drivers have been important in influencing the options for managing offensive waste (Williams, 2018), costs are also a factor (Lee et al., 2016). Indeed, the Royal College of Nursing (2018) noted that between 2009/10 and 2015/16, there was a decrease in the median disposal costs for offensive waste, from £469 per tonne, to £241 per tonne.
Methods
The research implemented an explanatory research approach, as outlined by Kumar (2008), to critically evaluate the cost and barriers of diverting offensive waste from landfill. A descriptive approach was also required, as outlined by De Vaus (2001), in order to establish weights, costs and treatment methods of offensive waste to obtain an overview of the management of the waste.
Sampling
Based on previous studies (e.g. Acharya et al., 2016; Alkassim et al., 2016), a homogenous purposive sample was used. This presented a research population of 70 NHS Trusts. The Midlands and East region was selected as the focus region, as it encompasses a geographically diverse area, representing 30% of all NHS Trusts in England.
Questionnaires were issued under the Freedom of Information (FOI) Act (HM Government, 2000), which required participants to respond to the initial enquiry within 21 working days. However, to aid in engagement with the research and in recognition of the questionnaire being distributed in April (a time when NHS organisations prepare end-of-year reports), participants were extended a 12-week completion deadline. A follow-up questionnaire was issued to non-respondents 6 weeks after the initial survey was distributed.
Questionnaire design
Self-completion email questionnaires were employed for the study. The benefits of minimal cost, assured consistency of question formulation and convenience for participants were deemed to outweigh the limitations of this method (Hague et al., 2013; Rasinski et al., 2000). A short introduction to inform participants of the research validity and aims was included. To further aid comprehension, a definition of offensive waste was included at the beginning of the questionnaires to prevent misinterpretation. It was imperative for the formatting to be ‘clean and neat’ to increase response rates. Thus, a pilot, as recommended by Hague et al. (2013), was conducted between 20 February and 20 March 2018.
The questionnaire, which focused on the most recent complete NHS financial year (1 April 2017–31 March 2018), took place over 13 weeks, with surveys being issued on 6 April 2018, for return on 6 July 2018. Closed questions, as well as multiple-answer questions were employed. Open questions were used when the range of responses could not be predicted, including for the offensive waste weights and costs.
Participants were asked to disclose the weights of offensive waste produced and disposed of via landfill, and five pre-determined waste treatment technologies, namely, municipal WtE, clinical WtE, incineration without energy recovery (incineration), composting and alternative treatment. Only incineration was included within the pre-determined list of treatment technologies, though participants were also presented with an open-ended ‘other’ response option for any treatment methods that were not listed. Participants were also asked the cost per unit for offensive waste disposal at landfill, and by other means where applicable, to establish the financial cost of diverting this stream from landfill. To ensure that commercially sensitive data were not disclosed, participants were not asked which contractor they utilised for disposal of the waste during the specified time period.
Data analysis
Closed-question responses were allocated a code prior to issue of the questionnaires and open-questions were post-coded following questionnaire return. Missing data, where participants omitted a response, were allocated a non-response code. Analysis of questionnaire data was undertaken within SPSS (Version 22.5).
The weight of waste disposed of by each treatment method by each participant was evaluated to establish the total weight of waste sent to landfill. Furthermore, a frequency distribution of the treatment methods utilised was implemented to establish whether alternatives to landfill were used, and how frequently these methods were implemented. An analysis of waste treatment type and cost of disposal was conducted to establish links between treatment method and cost. The interquartile range in costs for waste disposal, by each treatment method, was conducted to establish a financial cost to diverting offensive waste away from landfill. Hubers M-Estimators, as described by Ball and Whitley (2002), at a weighting constant of 1.339, were utilised alongside interquartile range to ensure that outlier data did not influence the price analysis. The pre-defined barriers to offensive waste disposal and thematic analysis of any qualitative responses provided by participants were used to establish similarities regarding barriers to treatment of offensive waste by alternative means to landfill.
Ethics
Self-completion questionnaires were administered to each NHS organisation via email, under the Environmental Information Regulations (HM Government, 2004) and Freedom of Information Act (FOI) (HM Government, 2000), which entitles individuals to request information held by public authorities. Consequently, organisations were informed that return of a completed questionnaire indicated consent for the data to be used for the specified research, under the Re-use of Public Sector Information Regulations (HM Government, 2015). Participants were assured that personal/organisational identifiable data would not be disclosed within the results of the study, and that all data would be held on a secure, password-protected computer in line with the Data Protection Act (HM Government, 1998).
Results
The sample
An overall response rate of 84% (n = 59) was observed. However, 20% of respondents (n = 11) did not meet the scope of the research. Of those not meeting the research criteria, five respondents did not have the information available and six had not implemented the offensive waste stream, and thus were omitted. Thus the participation rate was 69% of the initial sample.
The final participant sample (n = 48) comprised NHS Trusts in the East (n = 17), East Midlands (n = 14) and West Midlands (n = 17) of England, broadly categorised as the Midlands and East Region by NHS England (n.d.). The East Midlands represents only 23% of NHS Trusts in the Midlands and East Region; despite that a response rate of 88% was observed. In comparison, the East of England, which comprises 41% of NHS Trusts in the Midlands and East region, had a response rate of only 61%. The response rate for the West Midlands was comprised of 36% in the Midlands and 68% in the East.
Weight and treatment of offensive waste produced
Overall 8609.48 t of offensive waste were produced throughout April 2017 to March 2018. Respondents in the East produced the highest weight of offensive waste, 39% (3357.72 t). The East Midlands produced only 29% of offensive waste within the region (2515.76 t), with the West Midlands producing slightly more at 32% (2650.73 t).
Some 50% of respondents (n = 24) stated that they disposed of some or all offensive waste at landfill during the target timeframe. Table 1 shows that most, 42% (n = 10), were from the East Midlands (n = 8). Only 33% (n = 16) disposed of all waste at landfill, primarily from the East Midlands, 38% (n = 6).
Proportion of offensive waste disposed of to landfill, by region.
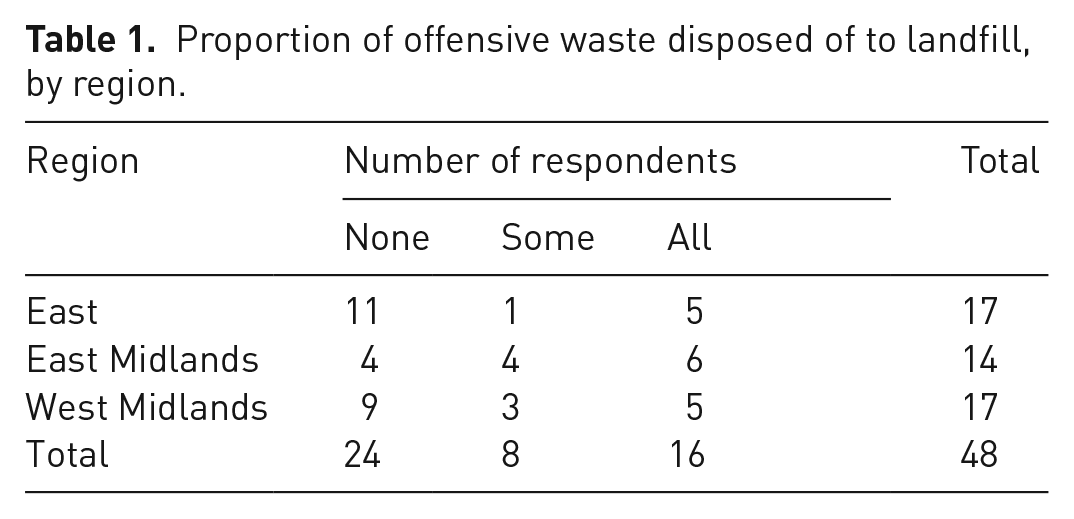
In total, 17% (n = 8) of respondents disposed of a proportion of their waste at landfill, with 50% from the East Midlands (n = 4). Half (n = 24) diverted all offensive waste from landfill, utilising treatment technologies instead. The majority (46%), diverting all waste from landfill were from the East (n = 11) compared with 38% (n = 9) in the West Midlands and only 17% (n = 4) in the East Midlands. In total, some 3844.30 t of offensive waste were disposed of at landfill, accounting for 45% of that produced (Figure 1).
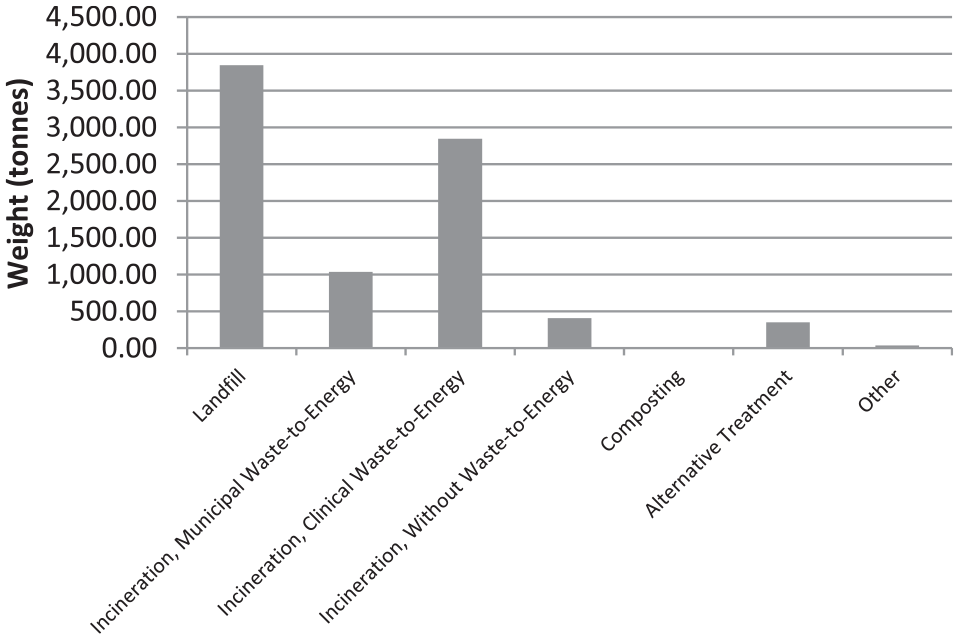
Weight of offensive waste by treatment method.
The majority of the waste produced in the East Midlands and West Midlands was disposed of at landfill, accounting for 64% (1617.35 t) of waste produced in the East Midlands and 61% (1673.37 t) of waste produced in the West Midlands (Figure 2). In contrast, only 16% of all offensive waste (533.59 t) produced in the East was sent to landfill. After landfill, the second most commonly used disposal method was clinical WtE, utilised by 35% of respondents (n = 17) for 33.40% (2846.88 t). Clinical WtE was employed for the majority of offensive waste produced in the East region, accounting for 73% (2459.05 t), but only for 12% (307.16 t) from the East Midlands and 3% (80.67 t) in the West Midlands.
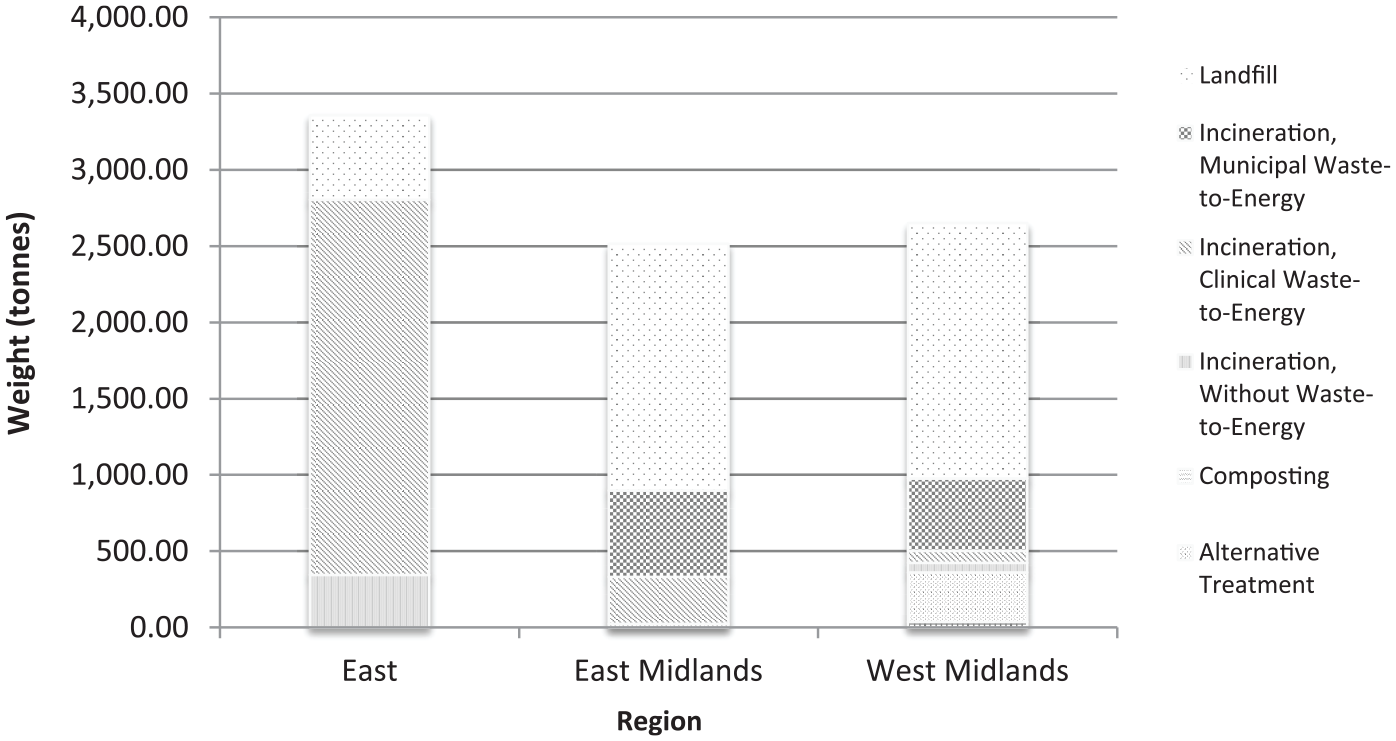
Weight of offensive waste disposed of by each treatment method, by region.
Disposal via alternative treatment accounted for 4% (350.23 t) of all offensive waste produced, and incineration for 4.77% (406.32 t). The area utilising alternative treatment the most was the West Midlands, using this method for 12% (324.98 t) of all offensive waste produced. Alternative treatment was not used in the East of England. Incineration was most utilised in the East of England, 10% (344.43 t). No offensive waste was disposed of by incineration in the East Midlands and only for 2% (61.89 t) of the waste produced in the West Midlands.
Municipal WtE was only utilised by 6% (n = 3), but accounted for the disposal of 12.19% (1039 t). Municipal WtE was utilised for only 22% (566 t) of waste produced in the East Midlands, and for 17% (473 t) in the West Midlands, but was not utilised in the East of England. Some 4% (n = 2) of respondents from the West Midlands employed ‘other’ treatment methods (including heat disinfection and use as refuse derived fuel (RDF)), for 36.83 t of the waste. Composting was not used by any respondent.
Financial Implications of diverting offensive waste from landfill
Of the respondents (n = 35) providing a unit cost for offensive waste, the majority 85% (n = 30) provided a price per tonne. To enable accurate comparison with other respondent data, costs per unit that were provided for measures other than per tonne (n = 5) were converted using the Environment Agency (2018) conversion factors tool. The conversion factors tool was used to provide a per tonne cost, with a 75% weight reduction adjustment suggested for light materials, such as healthcare sanitary wastes (Table 2).
Price per unit for the waste.
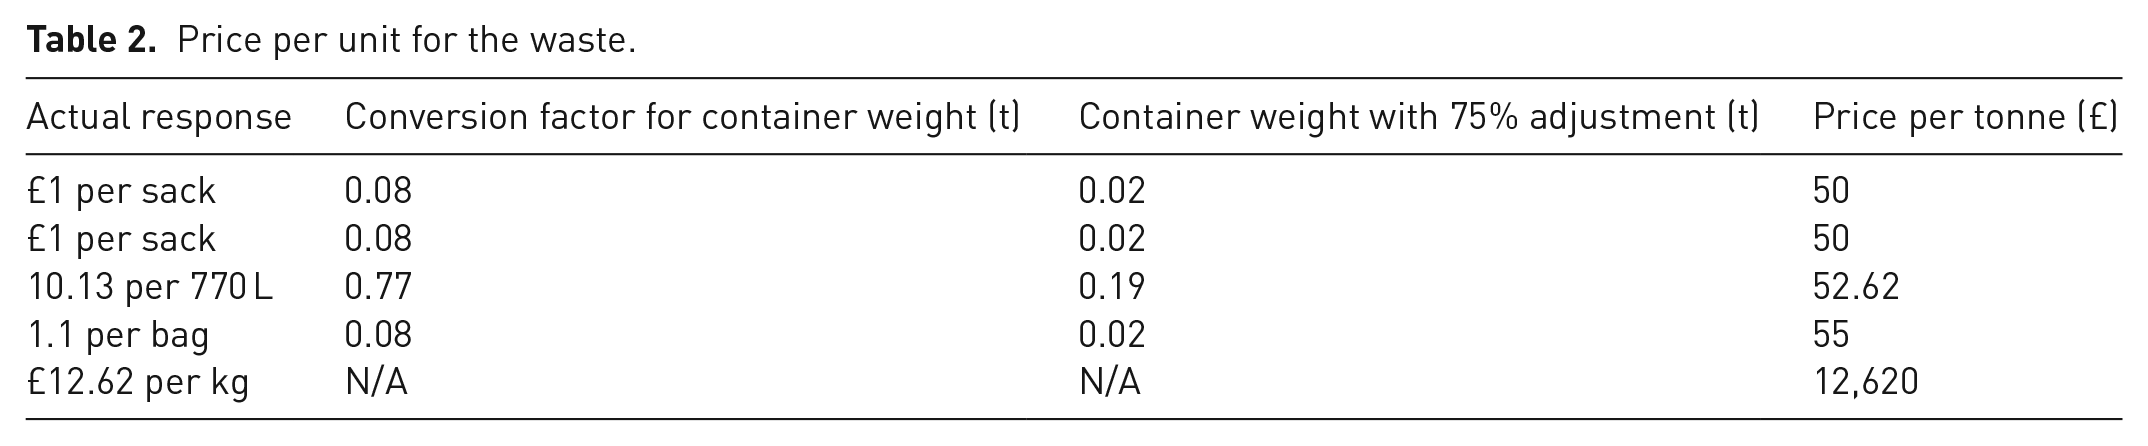
The interquartile range and Hubers M-Estimator were established for each treatment method, to take into account the range in cost and any outliers. The disposal method with the greatest interquartile range for cost per tonne was alternative treatment, at 9483, with no clear outliers. This was followed by incineration with an interquartile range of 3874. Landfill presented the smallest interquartile range at 202, followed by clinical WtE at 355.50, which presented two outliers. An interquartile range for municipal WtE could not be configured as only three respondents using this treatment method for the majority of their offensive waste provided a unit price. As all prices for municipal WtE were closely aligned at £175, £246.90 and £300 per tonne, the standard deviation for this treatment method was only 62.74.
As shown in Table 3, the median and Hubers M-Estimator for landfill, municipal WtE, clinical WtE and alternative treatment were very similar, with a difference of less than 10. Incineration also presented a similarity between the median and Hubers M-Estimator, with a difference of only of 29.81 between these figures. The Hubers M-Estimator was used to define an overall cost per tonne for each treatment method, to reduce the impact of outliers on the price per tonne.
Interquartile range and Hubers M-Estimator price per tonne, by treatment method.
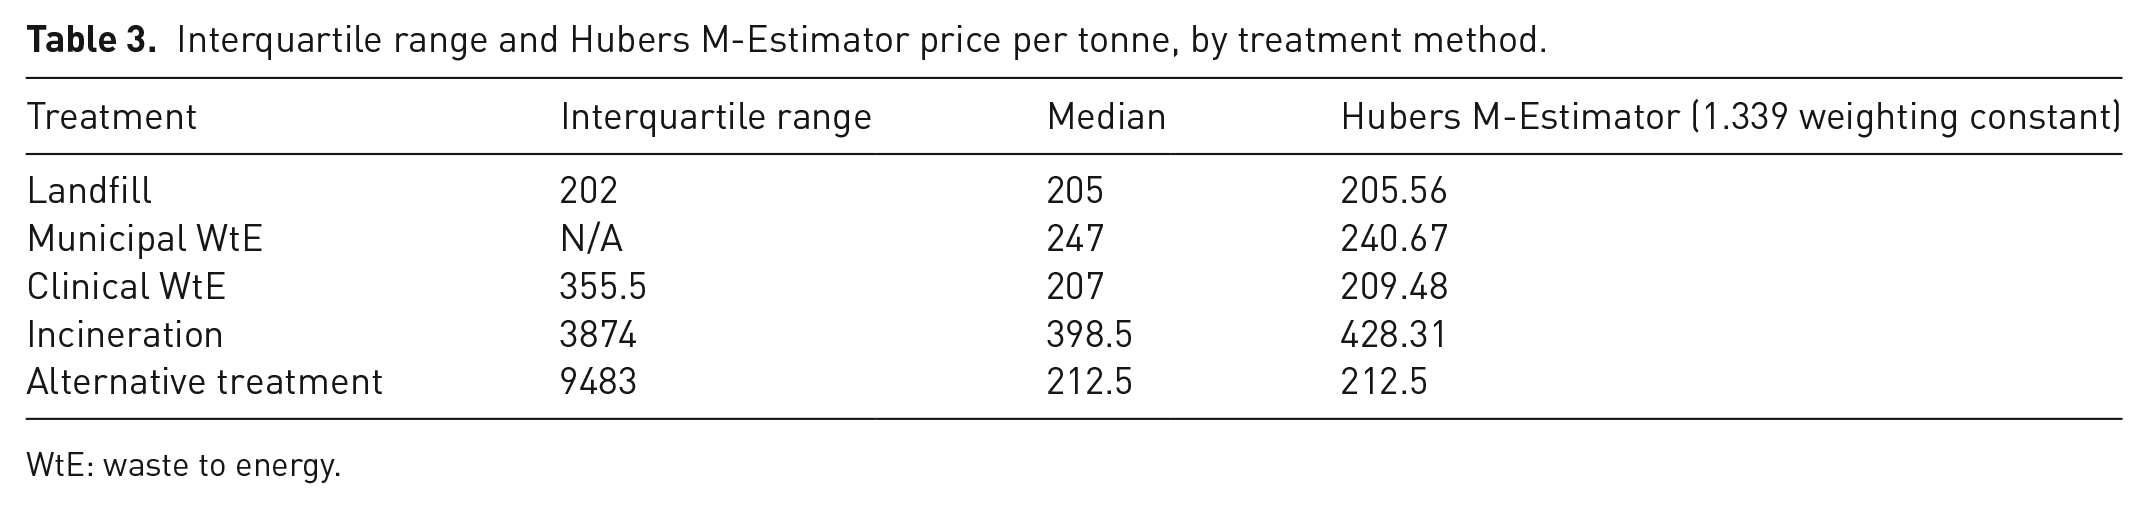
WtE: waste to energy.
Respondents utilising landfill as the main means of offensive waste disposal paid less per tonne compared with other methods, at £205.56 per tonne. Clinical WtE presented the second least expensive cost at £209.48 per tonne, followed by alternative treatment at £212.50. Respondents utilising municipal WtE for the majority of their offensive waste paid £240.67. However, incineration presented the highest cost per tonne at £428.31. While a difference of £35.11 was observed between landfill and municipal WtE among respondents, the difference in cost between landfill and clinical WtE was only £3.92.
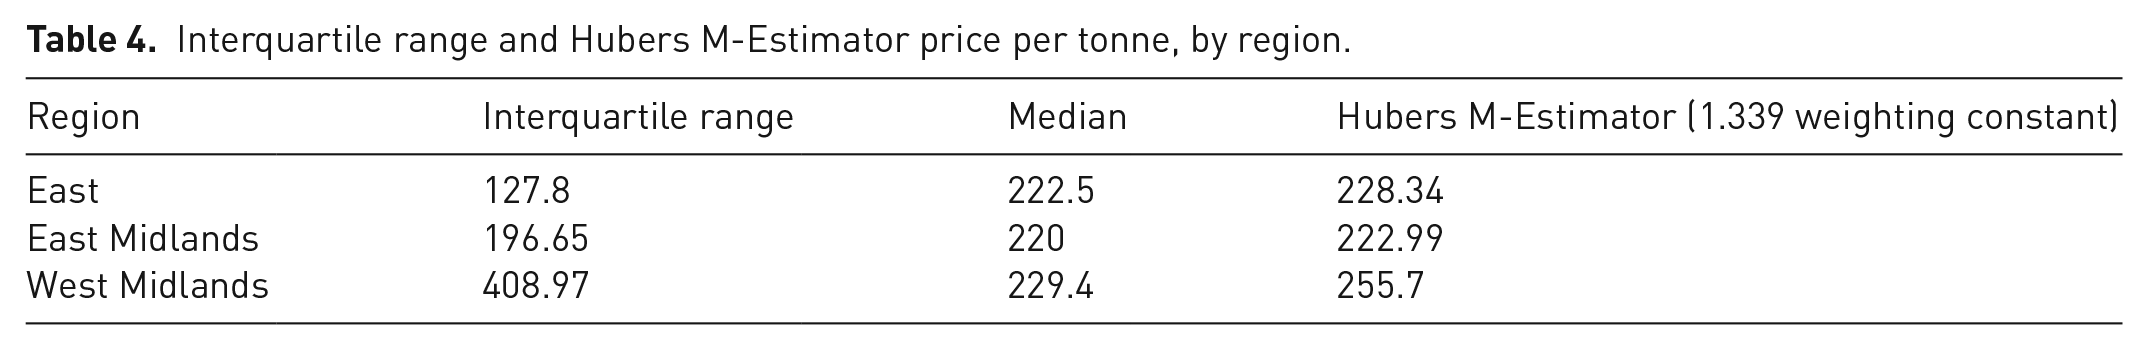
Table 4 shows that the West Midlands (n = 10) presented the highest interquartile range at 408.97, compared with the East Midlands (n = 11) at 196.65 and the East (n = 14) at 127.80. While the median and Hubers M-Estimator figures are similar for each region, it was imperative to take the Hubers M-Estimator figure into account owing to the high interquartile range for the West Midlands and outliers in each region. The price per tonne paid by respondents in the West Midlands was highest at £255.70 compared with only £228.34 in the East and £222.99 in the East Midlands.
Interquartile range and Hubers M-Estimator price per tonne, by region.
Owing to the differences in costs for each treatment method there would be a cost implication if all NHS offensive waste generated in the Midlands and East region were to be diverted from landfill (Table 5). At a cost of approximately £205.56 per tonne, disposal of all 8609.48 t of offensive waste produced in the Midlands and East region to landfill would present a cost of £1,769,765 per annum. In comparison, disposal of all offensive waste produced in the region via clinical WtE would cost approximately £33,749 per annum more, alternative treatment £59,750 more, increasing to £1,917,763 more for incineration and £302,279 for municipal WtE.
Cost to dispose of all offensive waste in the Midlands and East of England, by each treatment method.
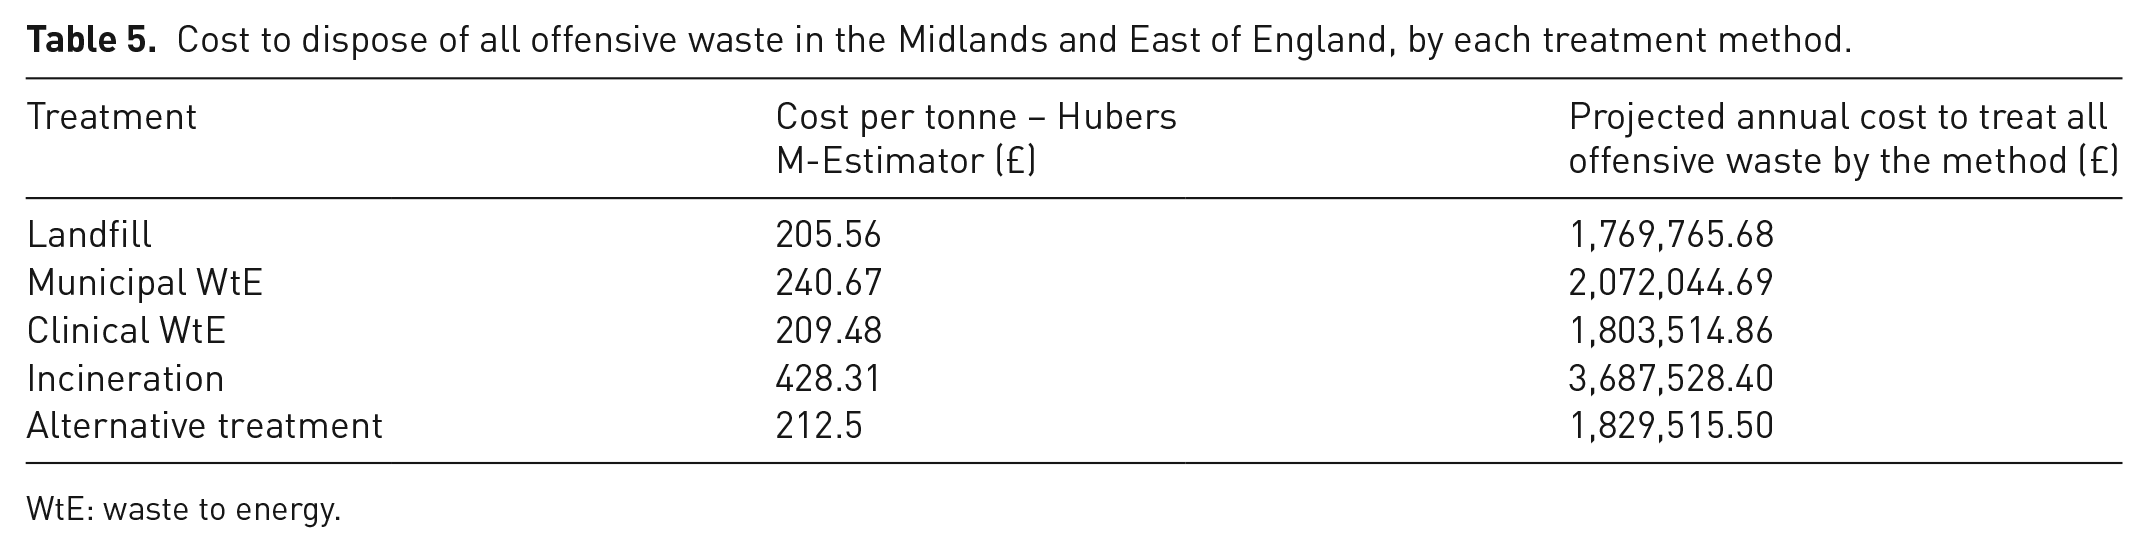
WtE: waste to energy.
Barriers to diverting offensive waste from landfill
The majority (67%) of respondents (n = 32) stated that they did not have targets for the diversion of offensive waste from landfill. Overall, 52% (n = 25) stated that their organisation faced barriers to diverting the waste from landfill. Of those disposing of all the waste to landfill, 95% (n = 15) stated that they faced barriers to its diversion to alternative means of disposal. Most 35% (n = 17) noted that the key barrier faced was that landfill was the only treatment option offered by their waste contractor (Table 6). Some 23% (n = 11) contended that a lack of alternative treatment options presented a barrier to the diversion of offensive waste from landfill. Financial barriers were faced by 13% (n = 6) and regulatory barriers by 8% (n = 4).
Barriers to diversion of offensive waste from landfill, by region.
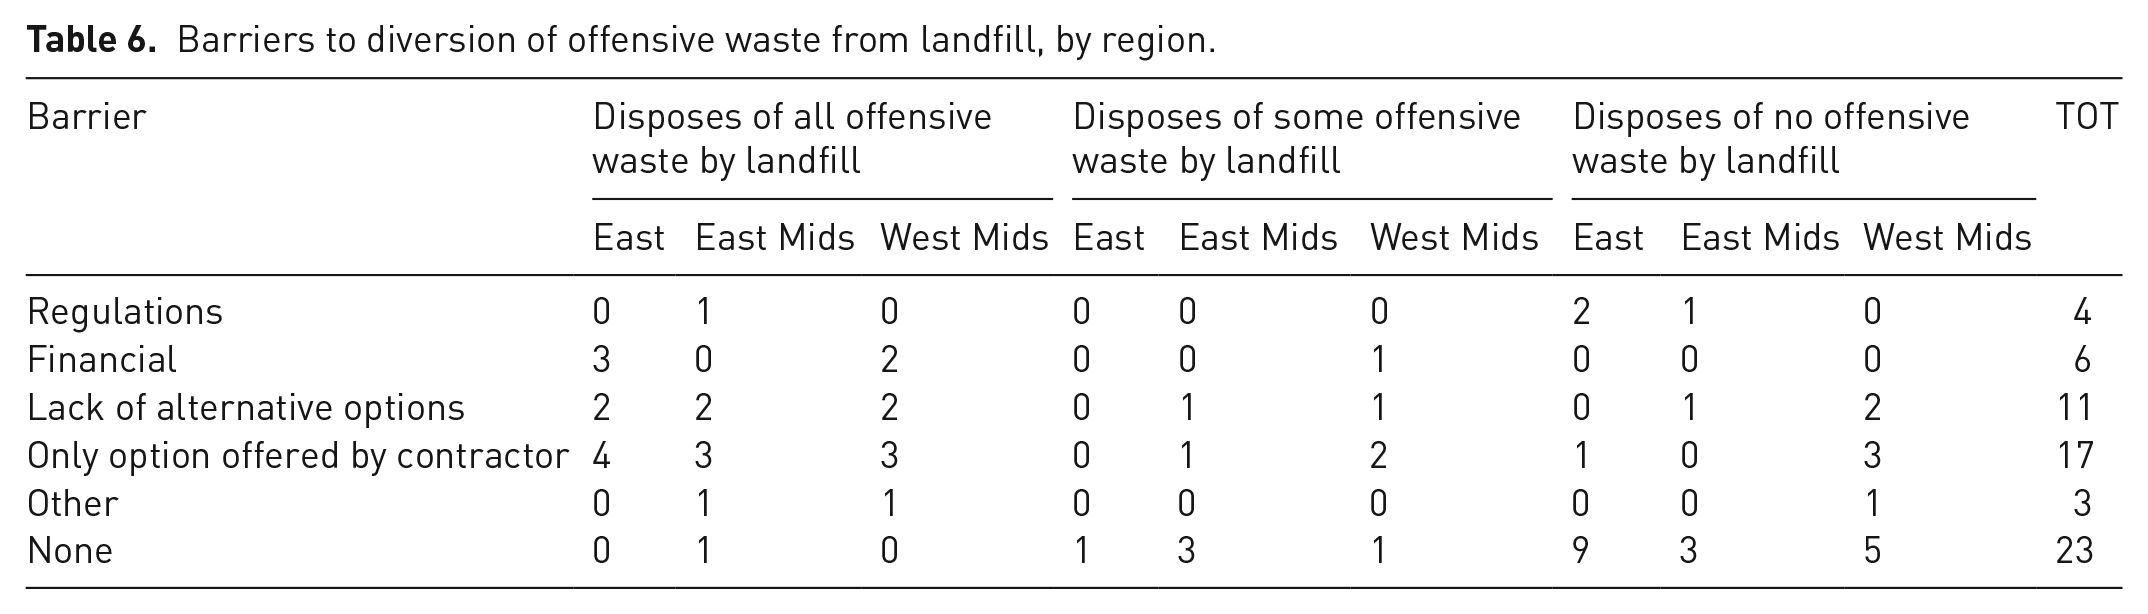
Of the respondents whose organisation faced regulatory barriers, 75% (n = 3) sent no waste to landfill. Some 50% (n = 2) regulatory barriers were based in the East of England, and 50% (n = 2) in the East Midlands. In contrast, of those facing financial barriers, 83% (n = 5) sent all their offensive waste to landfill, and 17% (n = 1) sent some of the waste to landfill. Some 50% (n = 3) facing financial barriers were based in the East of England, while 50% (n = 3) were based in the West Midlands. A lack of available treatment options was stated as a barrier by 23% (n = 11), of which 55% (n = 6) sent all their offensive waste to landfill, 18% (n = 2) sent some to landfill and 27% (n = 3) sent none to landfill. Most, 45% (n = 5), facing this barrier were from the West Midlands. Of the 36% who stated that landfill was offered as the only option by their waste contractor as a barrier to landfill diversion, most, 59% (n = 10), sent all their waste to landfill, while 24% (n = 4) sent none to landfill. Most, 47% (n = 8), highlighting this as a barrier were from the West Midlands. Other key factors noted included infection control requirements and assurances that offensive waste was not contaminated.
Of the 48% (n = 23) of respondents that did not face barriers to diversion of the waste from landfill, 74% (n = 17) already diverted all the waste from landfill, with only 4% (n = 1) disposing of all waste at landfill. Of the six respondents that did dispose of waste at landfill, but did not face any barriers to its diversion, three had targets to reduce landfilling of the waste. Of those facing no barriers, most, 43% (n = 10), were from the East of England.
Discussion
Overall, the legal obligation under regulation 12 of the HM Government (2011), for waste producers to uphold the Waste Hierarchy was not met by half of the respondents, leading to the landfill of 3844.30 t of offensive waste in 2017/18 (Roddis, 2019). This has implications for costs and environmental impacts (United Nations Environment Programme, 2015).
The East region produced the most (39%) offensive waste. These findings are in contrast to those of the Environment Agency (2016b), in which the majority of offensive waste produced in the Midlands and East region originated from the East Midlands. Only 16% of all offensive waste (533.59 t) produced in the East was sent to landfill. This is much lower than the Environment Agency (2016b) data, which showed that for example, 96% of offensive waste from the East Midlands was disposed of at landfill.
The use of landfill for either some or all offensive waste by half of the respondents aligns with prior research (e.g. Williams, 2018). However, this is lower than across England, where as much as 80% of the waste was disposed of at landfill in 2016 (Environment Agency, 2016b). The East sent only a fraction of the waste to landfill compared with the East Midlands and West Midlands. This finding maps to Environment Agency (2016b), which showed that 87% the waste originated in the East Midlands and 91% in the West Midlands was disposed of via landfill, compared with 79% in the East of England.
The two main barriers to moving away from landfill were that it was the only option offered by the waste contractor, and a lack of available alternatives to landfill. This finding is a concern, given the limited landfill capacity in the region, particularly in the East of England with capacity of only 4.4 years (Department for Environment Food and Rural Affairs, 2016; Environment Agency, 2016a). These barriers also contrast with Williams (2018) as regards the impact of regulations on practices. Other barriers included infection control requirements and assurance that offensive waste is not contaminated with hazardous substances. This coincides with Williams’ (2017) concern that the requirement for healthcare staff to undertake assessments, to determine the suitability of wastes for disposal within the offensive waste stream, may lead to incorrect segregation.
Clinical WtE was the second most utilised treatment method employed, which coincides with the findings of Williams (2018). While clinical WtE accounted for the disposal of one-third of all offensive waste produced, it was mostly used in the East of England, for 2459 t of waste. In contrast to Williams (2018), municipal WtE was used for only 12% of all offensive waste and was not utilised by all in the East of England. In total, the use of all three incineration technologies detailed in the survey (clinical WtE, municipal WtE and incineration without energy recovery) was greatest in the East of England, where these technologies were employed for more than 80% of all offensive waste produced. This is in spite of the Eastern region containing only six incineration facilities. While the West Midlands contained 17% of all operational incinerators in England, and 54% of those within the Midlands and East region, less than a quarter of the waste produced was disposed of by incineration technologies. The rationales for these ‘discrepancies’ requires further evaluation.
The overall price per tonne for offensive waste was £231.83, corresponding with the Royal College of Nursing (2018), in which the median cost per tonne for offensive waste was £241. In contrast, the cost per tonne for landfill within the Midlands and East region was £205.56, below the median, the lowest cost of all disposal methods. While landfill presented the cheapest price per tonne overall, clinical WtE presented a price per tonne of only £3.92 more than landfill when taking Hubers M-Estimators into account.
Despite only six respondents stating that their organisation faced financial barriers to the diversion of offensive waste from landfill, financial implications would be faced by the NHS if all offensive waste were to be treated by other means. Taking only the Midlands and East region into account, disposal of all offensive waste by the second cheapest treatment method, clinical WtE, would cost approximately £33,749 per year more than if all waste was disposed of at landfill. While this may be considered a small cost compared with the entire waste spend for the NHS, £87 million in 2014/15 (Perchard, 2017), any additional costs attributed to diversion of offensive waste from landfill would result in the diversion of NHS funds, which may otherwise be spent on patient care. Overall, within the Midlands and East Region, the financial implications of diverting offensive waste from landfill would affect the East Midlands and West Midlands most, as they sent the most waste to landfill.
There are some limitations in the study. As noted by Schreuder et al. (2001), purposive sampling does not provide a probabilistic or representative sample. Consequently, while assumptions for the NHS as a whole may be made, the research can only be applied to the geographical area identified for the sample. The study focused only on NHS Trusts. It did not for example, take account of general practices, nurseries, independent sector healthcare organisations and nursing/care homes. Future studies should take these sources of the waste into account.
Conclusions
The 3844.30 t of offensive waste disposed of to landfill was in contrast to Environment Agency (2016b), which indicated that 90% of all offensive waste produced in the Midlands and East region was disposed of at landfill.
Landfill being the cheapest option for managing offensive waste has implications, particularly as cost can be prioritised over carbon reduction within the NHS at a time when cost savings are key, must be carefully managed (Lee et al., 2016; NPAG Waste Best Value Group, 2018). Budd (2017) states that this approach, without ‘proper training, assessment and control’ has led to increased misclassification of healthcare waste and use of landfill, rather moving waste up the Waste Hierarchy. The award of contracts based on the lowest price owing to financial pressures within the NHS has led to the narrowing of margins for waste management companies and subsequent reduction in investment in the waste sector. Consequently, NPAG Waste Best Value Group (2018) suggests that waste producers, contractors and regulators must develop a consistent approach to improve compliance with the waste hierarchy without waste producers incurring additional costs.
Footnotes
Declaration of conflicting interests
The authors declared no potential conflicts of interest with respect to the research, authorship, and/or publication of this article.
Funding
The authors received no financial support for the research, authorship, and/or publication of this article.