
Abstract
This article focuses on quantitative prevention of municipal solid waste among the 28 member countries of the European Union. A strict definition of waste prevention is used, including waste avoidance, waste reduction at source or in process, and product reuse, while recycling is outside the scope of this article. In order to provide a solid overview of the European situation, the study selected six countries (Belgium, Bulgaria, Italy, the Netherlands, Romania and Spain). Several selection requirements have been considered, such as geographic location or municipal solid waste per capita production trends from 1995 to 2017. A review of prevention programmes and other national strategic documents has been conducted. Extended producer responsibility, Pay-As-You-Throw schemes, Deposit-Refund Systems and Environmental Taxes implementation among the selected countries have been studied in order to understand how these market-based instruments can be used for the sake of waste prevention. Each market-based instrument has been further analysed using the Drivers Pressures State Impact Response model. Based on the results of this study, the effectiveness of market-based instruments implementation is strictly related to the context they are enforced in. It is particularly important to tailor the market-based instruments based on the implementation area. Nevertheless, market-based instruments, which are now mostly meant to boost the recycling sector of the considered Member States, should be designed to improve waste prevention performances, ensuring the achievement of the highest level of waste hierarchy promoted by the European Union.
Keywords
Introduction
The Waste Framework Directive indicates waste prevention as the most favourable option in the so-called waste hierarchy, above reuse, recycling and recovery (Directive 2008/98/EC, Article 4). Prevention is the best option from an environmental point of view: the potential for CO2 emissions savings is much greater when waste is prevented rather than recycled (Hoog and Ballinger, 2015). Recycling requires additional energy and resources, even if it leads automatically to prevention of extraction materials and extraction waste. Furthermore, prevention contributes in increased resource efficiency, one of the main goals of the circular economy. Nevertheless, as stated by the European Environment Agency, the efforts and activities aiming for a transition to the circular economy primarily focus on waste management – particularly recycling– and creating markets for secondary materials rather than on waste prevention (European Environment Agency, 2016b).
According to the definition given in European Commission Directive 2008/98, it is possible to distinguish three kinds of prevention.
Quantitative prevention, aiming at limiting the quantity of waste.
Qualitative prevention related to adverse impacts of the generated waste on the environment and human health.
Qualitative prevention of content of harmful substances in materials and products.
Under the Directive 2008/98/EC, European Union (EU) Member States had to adopt national waste management plans by 12 December 2010, and waste prevention programmes by 12 December 2013 (art. 29). Each nation maintains a certain level of autonomy in developing its own regulatory model and set of measures to meet the Directive objectives (Tencati et al., 2016). So, each Member State has the responsibility to define appropriate and specific qualitative or quantitative benchmarks for waste prevention, adopt measures in order to monitor and assess the progress of the performances and determine specific qualitative or quantitative targets and indicators (art.29, Directive 2008/98/EC). This responsibility remains with Member States also considering the reviews to Directive 2008/98/EC introduced by Directive 2018/851/EU. European Union Directive 2018/851/EU, amending Directive 2008/98/EC on Waste, does not set specific quantitative targets on waste prevention, except for food waste (reduction by at least 30% by 2025 and 50% by 2030, see whereas 31 of the Directive). It only specifies a minimum set of prevention measures that have to be included in the prevention programmes written by the Member States (art. 29, as amended by the Directive 2018/851/EU).
Even considering packaging waste prevention, the EU does not set a quantitative target; article 4 of Directive 94/62/EC on Packaging and Packaging Waste, as modified by Directive 2018/852/EU, states that: Member States shall ensure that (. . .) other preventive measures are implemented in order to prevent generation of packaging waste and to minimise the environmental impact of packaging. Such other preventive measures may consist of national programmes, incentives through extended producer responsibility schemes to minimise the environmental impact of packaging, or similar actions adopted, if appropriate, in consultation with economic operators, and consumer and environmental organisations, and designed to bring together and take advantage of the many initiatives taken within Member States as regards prevention.
On the other hand, Member States are obliged to reach quantitative targets in recycling and recovery. The absence of an EU-wide defined target on quantitative waste prevention may have the effect that recycling is prioritised over prevention in the practical implementation in the Member States (Wilts, 2012; Wilts et al., 2016; Zacho and Mosgaard, 2016). Sometimes the existence of a functional recycling system even diminishes motivation to prevent waste (Hutner et al., 2017; Zorpas et al., 2015).
Prevention requires different decisions and different policy measures from recycling or recovery (Arcadis et al., 2010). Its philosophy is completely different, since it really tackles the causes of waste generation (Bartl, 2014).
The prioritisation of recycling over prevention seems to be confirmed by the analysis of European industries conducted by Cainelli et al., 2017. Investigating the role of European environmental policy and green demand drivers to sustain the adoption of resource efficiency-oriented eco-innovations by European industries, it seems that while the effect of environmental regulations is robust across typologies of circular economy innovations, it is more relevant for innovations linked to recycling behaviours, lagging waste reduction behind. This has been already documented by some authors, who have stated that the innovations efforts have been more frequently directed to sorting and recycling techniques rather than to product design (Walls, 2006; Massarutto 2014).
Furthermore, monitoring systems of performances of waste prevention activities are difficult to implement (Gentil et al., 2011; Sharp et al., 2010; Wilson et al., 2012). This can be an additional barrier to the implementation of waste prevention policies. Monitoring is one of the main tools to build strategic plans for effective waste prevention initiatives (Zorpas and Lasaridi, 2013). Waste prevention is difficult to be measured, as it can only be measured indirectly as the amount of waste that would have been generated if no prevention measures had been taken (Bartl, 2014; Sharp et al. 2010). So far, there is no a general method to monitor and evaluate the effects of waste prevention measures (Yano and Sakai, 2016; Zacho and Mosgaard, 2016): This implies that developing a system of incentives related to the quantity of waste prevented is still challenging.
This article aimed to study the link between municipal solid waste (MSW) prevention and the implementation of prevention programmes and market-based instruments (MBIs), on a national level. The study has been conducted on six EU Member States. The following paragraphs focus on the selection methods of the countries and on the results of the analysis.
Materials and methods
Waste prevention is a long-term process (European Environment Agency, 2002) that requires modifying the behaviours of households, producers and other participants in the economy (Salhofer et al., 2008). Both the consumer and the producer, or supply and demand, need incentives to produce less waste and, ideally, the incentives would come from each other. However, the supply chain is more complex than this and involves many players who are both consumers and producers. So, incentives do not happen naturally and may need a third party to introduce them (European Commission, 2011b; Wilts et al., 2013).
Prevention can be realised using legal provisions (licencing, laws, product standards, etc.), voluntary agreements (public-private agreements, certifications and labels, etc.), economic instruments (subsidies, incentive taxes, charges, etc.), communication and suasion (presenting information, persuading about options, etc.), leading to strategic decisions or technical measures (Arcadis et al., 2010). Considering prevention measures that are deliberate policy interventions, they can be classified as a policy response, on the basis of the Drivers Pressures State Impact Response (DPSIR) model, a causal framework for describing the interactions between society and the environment, as adopted by the European Environment Agency. In this case, they interact with mainly driving forces and pressures, and in case of harm prevention, also with state and impact (Arcadis et al., 2010). As is shown in Figure 1, a response is always related to other elements in the DPSIR model.
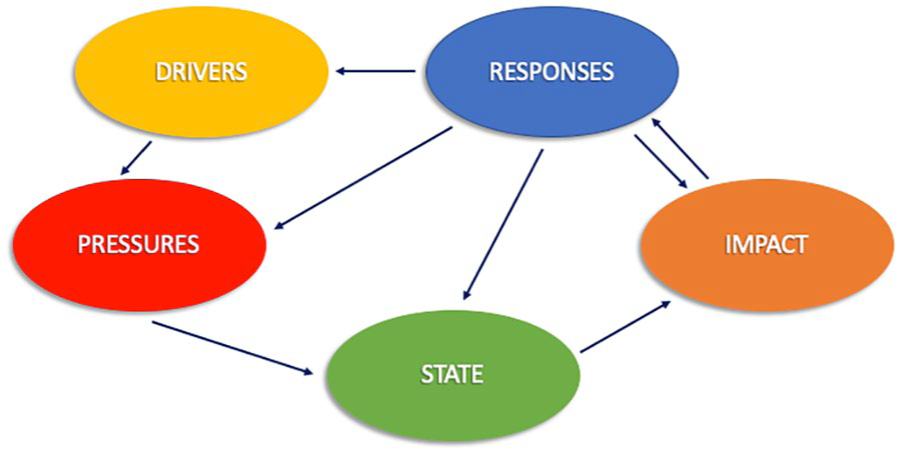
DPSIR framework.
Prevention measures can influence the driving forces because they interact on the market mechanisms, but also the pressures on environment. Prevention actions influence indirectly the state, aiming at changing the quality or the amount of waste to be managed. Only qualitative waste prevention actions can be considered as influencing the impact of the generated waste.
Scope of the study: Prevention and MSW
Waste prevention is different from waste minimisation. At the Berlin meeting in 1996, the Organization for Economic Co-operation and Development (OECD) defined waste prevention as one of the measures for waste minimisation, which includes preventive measures, as well as some other kinds of waste management measures. This definition of waste prevention was adopted in this study. Accordingly, preventive measures cover ‘prevention’, ‘reduction at source’ and the ‘reuse of products’, while waste minimisation additionally includes the waste management measures of ‘quality improvements’ and ‘recycling’ (European Environment Agency, 2002).
In particular, this article studies quantitative prevention for MSW. MSW is defined as the waste collected by or on behalf of municipal authorities and disposed of through the waste management system. It consists to a large extent of waste generated by households, though similar wastes from sources, such as commerce, offices and public institutions may be included (Eurostat, 2017).
In the EU-28, municipal waste accounts for about 9.65% of total waste generated (Eurostat, 2014). The advantage of limiting the study to only MSW is that it might be considered less conditioned by economic and social factors than total waste. Furthermore, it has a high potential for waste prevention (Arcadis et al., 2010).
In Communication 29/2018 (European Commission, 2018a) on a monitoring framework for the circular economy, the European Commission suggests three indicators to monitor waste generation.
Generation of municipal waste per capita (kilogram per capita).
Generation of waste excluding major mineral wastes per gross domestic product (GDP) unit (kilogram per thousand Euro).
Generation of waste excluding major mineral wastes per domestic material consumption (percentage).
Considering the DPSIR framework, the three indicators are pressure indicators. They do not evaluate impact on environmental factors, neither do they measure directly the impact on waste generation of prevention measures and policies applied; they measure an outcome. This study assumes the first indicator stands with the aims of quantitative waste prevention, considering municipal waste. The amount of waste generated per capita is also one of seven indicators used to measure the circularity level of an economic system and to indicate opportunities to accelerate the transition towards a circular economy by the Ellen MacArthur Foundation. The evolution of the generation of municipal waste per capita indicator for EU-28 countries in the period 2008–2017 is shown in Figure 2. After a period of gradual decline, the MSW production quantities per capita started to rise in 2014, in spite of a long history of EU waste policy.
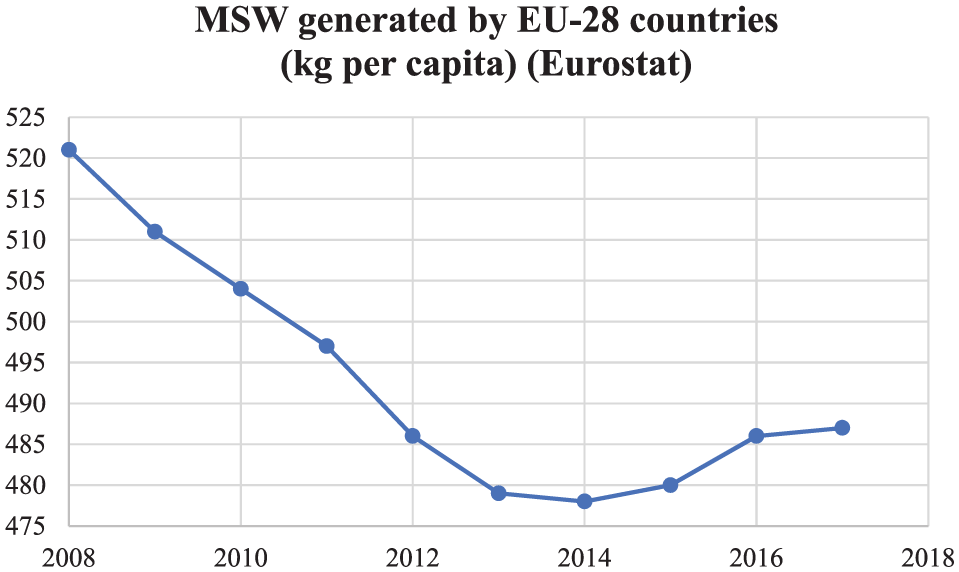
MSW generated by EU-28 countries (kilogram per capita).
Countries selection method and boundaries’ definition
The study started from the analysis of the trend of the indicator at country level, for EU-28 countries. In Appendix 1 the value of this indicator for the EU Member States in the period 1995–2017 is reported. The trend analysed (1995–2017) has been used as a parameter to select six virtuous EU countries.
Even if general waste statistics are available at an EU-wide level, it is not suggestable to compare data reported by different Member States (European Environment Agency, 2000), because of the differences in the kind of waste collected by the municipalities. So, the study considered each Member State’s indicator trend separately. This analysis would have been more effective if an EU-wide definition of MSW existed, together with a uniform methodology to collect and elaborate waste data: This way, setting a common target would be easier, and a quantitative comparison of performances between different countries would be possible.
Analysing the waste production per capita among all the EU-28 Countries, six virtuous countries were selected through three different criteria.
Consistency and availability of data: The database considered contains a complete record of waste production per capita from 1995 to 2017. Only countries with complete datasets were considered.
Data trend: Since the aim of this article is to look up at countries that are actually tackling their MSW production, only the ones with decreasing waste production per capita trends were considered for the selection among all the EU-28 countries. As said before, the choice of this indicator is aimed to assess the quantitative prevention of MSW at national level.
Geographic area: Countries were selected in order to provide the widest picture possible – two eastern Europe countries, two southern Europe countries and two northern Europe countries.
At the end of the analysis, the resulted countries are Belgium, Bulgaria, Italy, the Netherlands, Romania and Spain. Figure 3 shows the trend of MSW production per capita in the 1995–2017 period for each selected country.
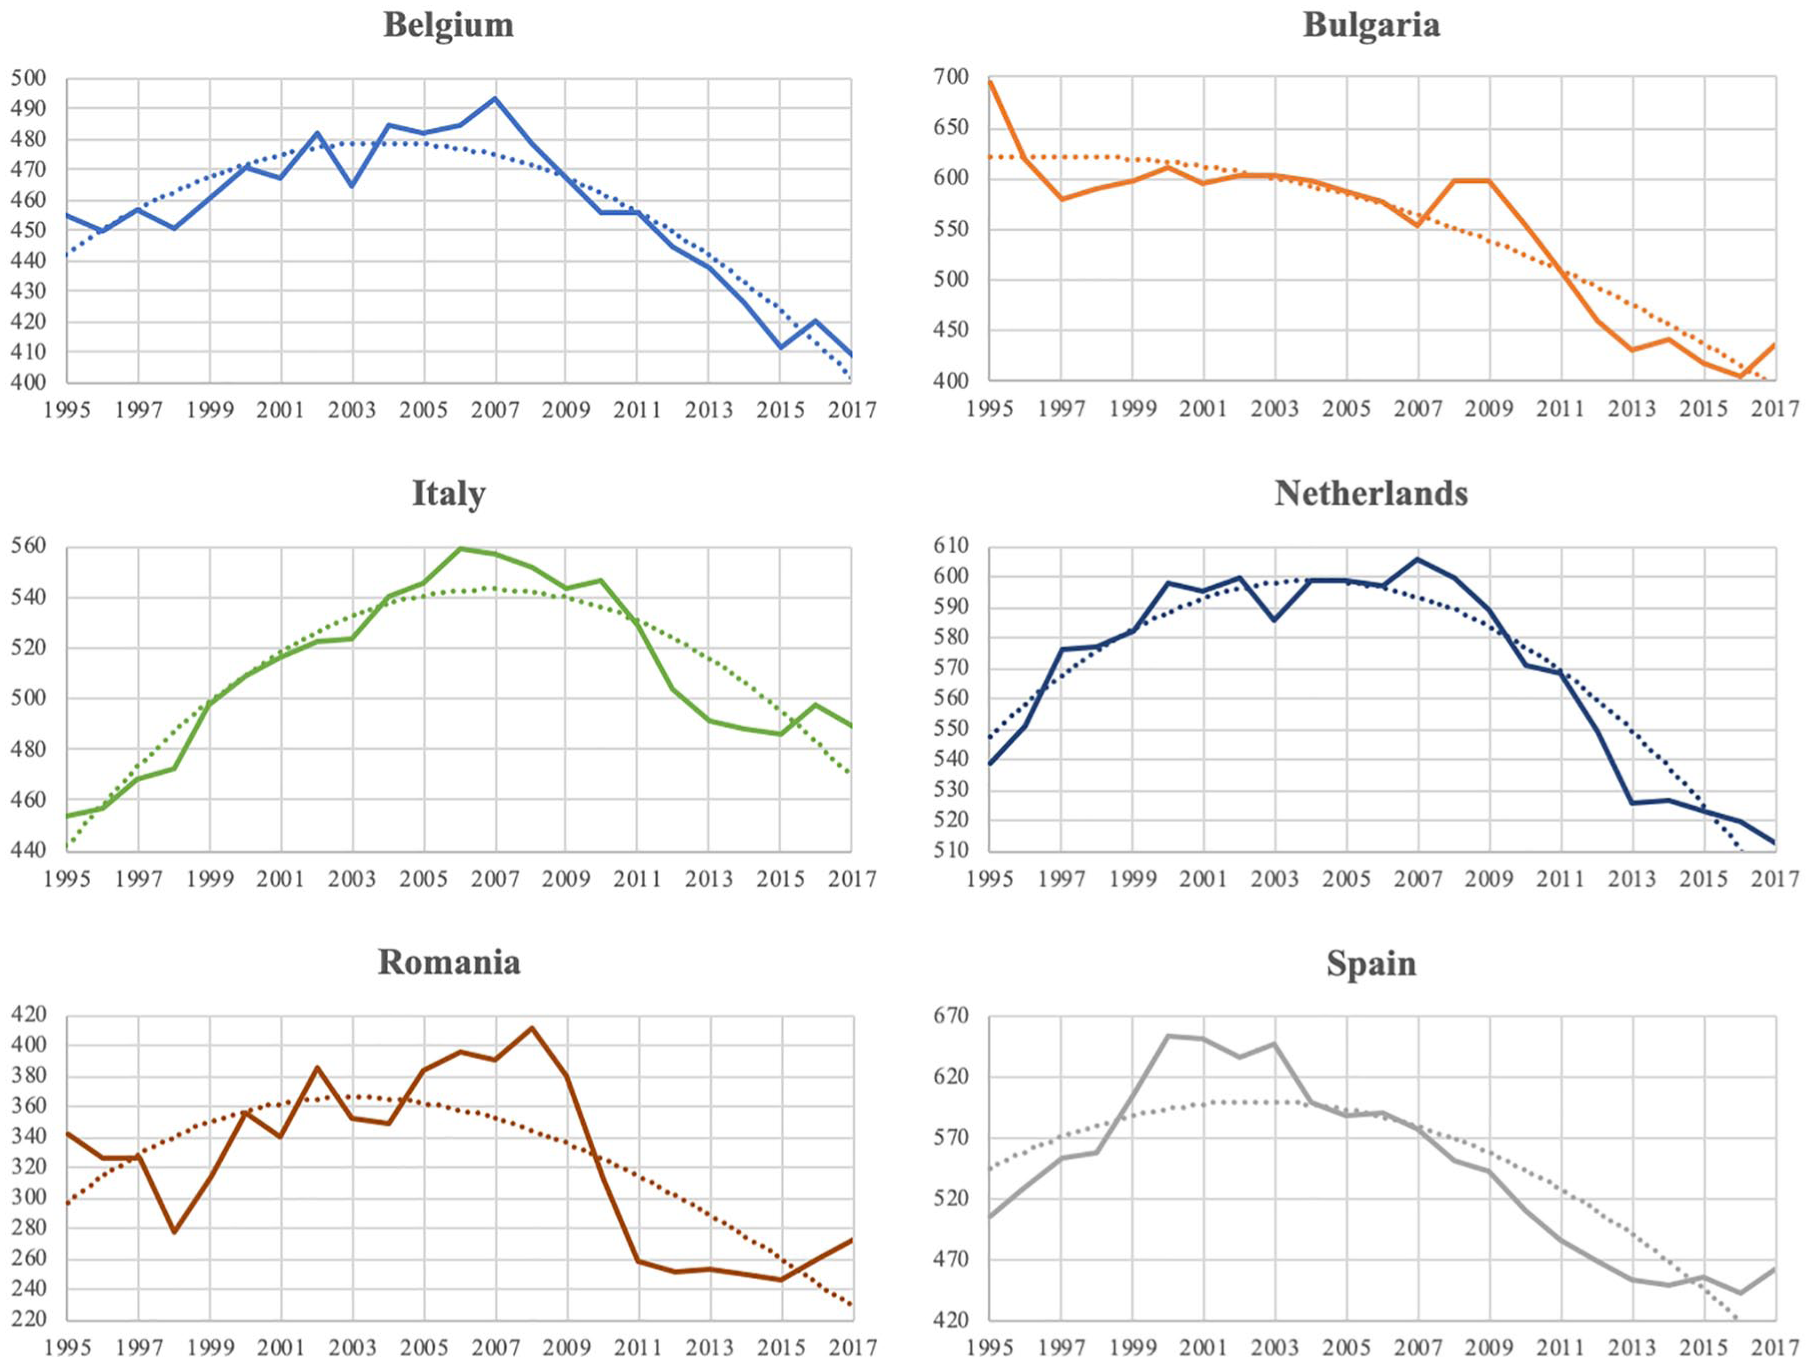
MSW production trends in case study countries.
Prevention programmes and other important strategic documents published by governments of these countries have been analysed and matched with the implementation of MBIs in those areas. Regulatory measures can play a role, but they are rarely effective in isolation (European Commission, 2003). Following the debate during the 1970s on whether ‘command and control’ regulations or market-based incentives were most appropriate to meet public objectives, incentives in the form of economic instruments have become increasingly popular in environmental programmes, because they are believed to trigger people’s attitudes and behaviour to serve public purposes (Bailey, 2002; Johansson and Corvellec, 2018). Policymakers need to keep in mind that multiple policy instruments are necessary for efficiently accomplishing multiple environmental goals (Walls, 2006).
This study has considered just a few of the many existing MBIs, assessing their usefulness to achieve quantitative waste prevention. The selected instruments will be furtherly detailed. According to the definition of the DPSIR model, the considered instruments - Extended Producer Responsibility (EPR), Pay-As-You-Throw (PAYT), Deposit-Refund System (DRS) and Environmental Taxes - are mainly a response action influencing the pressure.
Results and discussion
Prevention programmes analysis
Prevention targets with clear deadlines are important instruments for the sakes of waste prevention (Zorpas and Lasaridi, 2013). Specific waste prevention targets, such as recycling targets, should be legally binding in order to strengthen waste prevention (Mazzanti, 2008; Wilts et al., 2016). In particular, prevention targets are one of the most effective and most frequently applied household waste prevention policies (Cox et al., 2010). According to the DPSIR model, they have effect on quantitative prevention, thus on the pressure, and on qualitative prevention and thus on the impact state. The targets and measures for waste prevention should be specified with regard to the particular waste stream concerned (Salhofer et al., 2008). The analysis of national prevention programmes has been conducted with a focus on quantitative targets on reduction of waste and on the monitoring system adopted to assess the progress. In particular, the waste streams analysed are MSW or households waste. Table 1 summarises the key findings of the research.
Overview of waste prevention programmes in the selected countries.
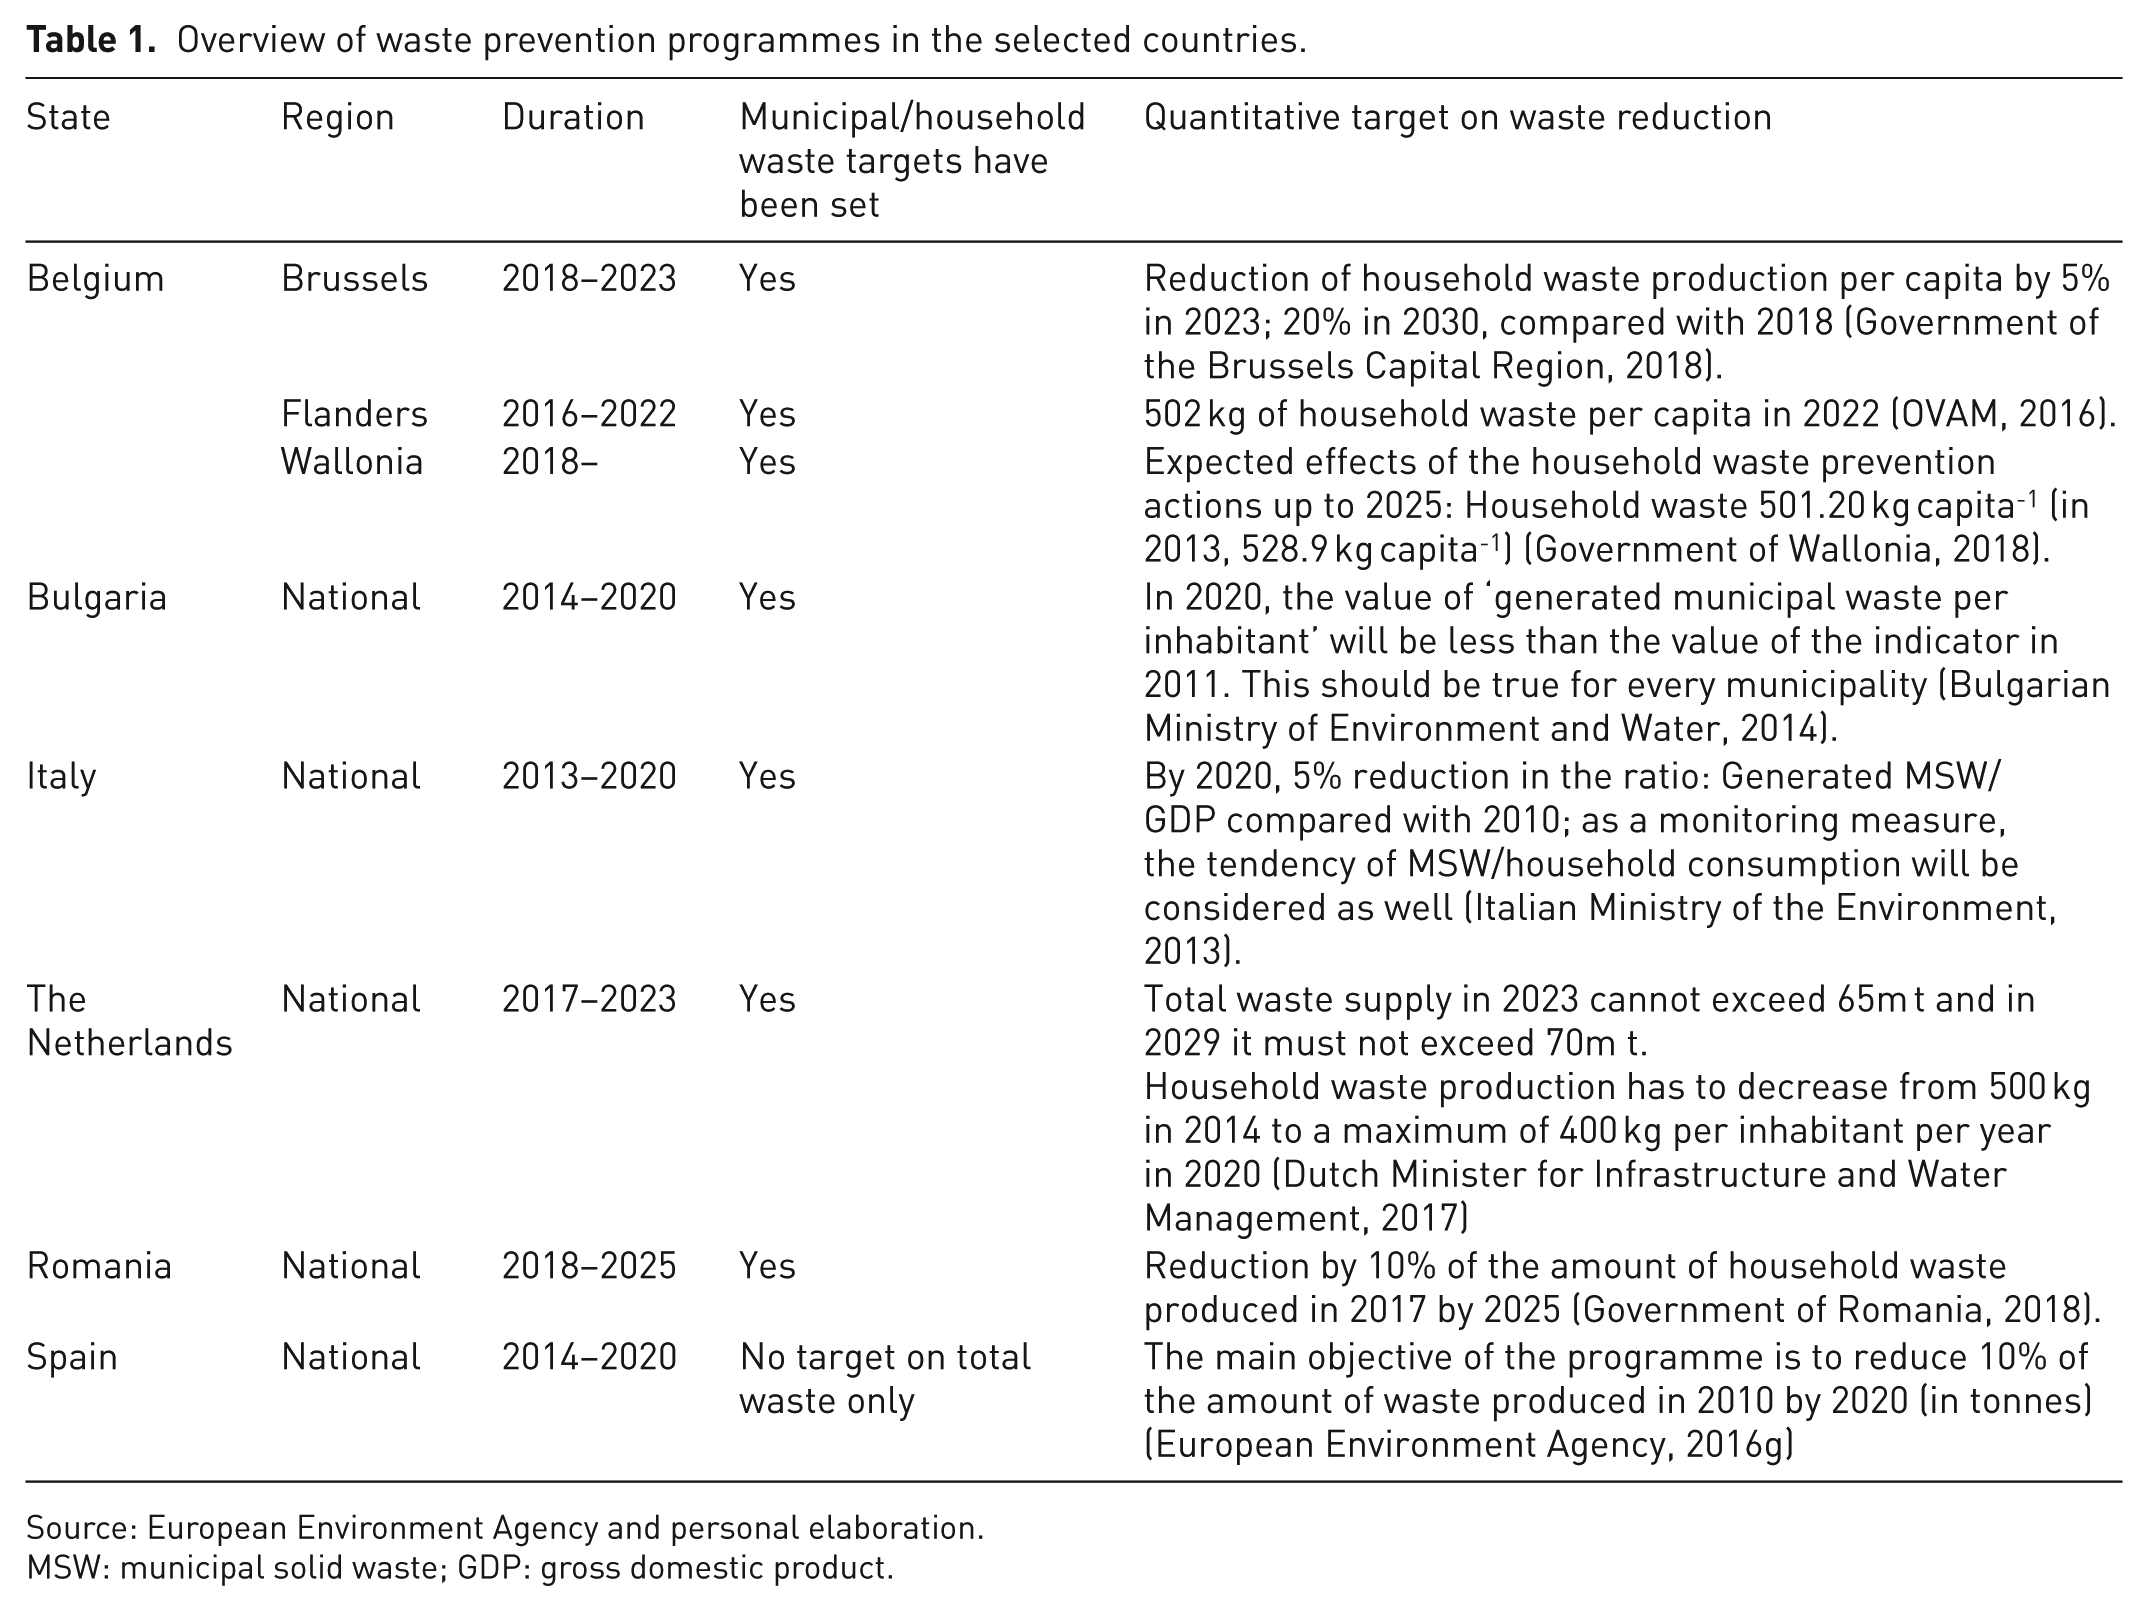
Source: European Environment Agency and personal elaboration.
MSW: municipal solid waste; GDP: gross domestic product.
Belgium
Belgium is a federal State, divided into three regions: Flanders, Wallonia and Brussels, respectively with 57.6%, 31.9% and 10.5% of the total national population in 2018 (Statista, 2019). Regions are competent for waste management.
In November 2018, Brussels region approved a plan, ‘Plan de Gestion des Ressources et des Déchets 2018–2023’ (Government of the Brussels Capital Region, 2018), whose mission is to determine the main lines of waste management and prevention policy over several years. It sets quantitative targets on household and non-households waste reduction. For households, the target is a reduction of waste production per capita by 5% in 2023 and by 20% in 2030. A constant monitoring of the programme is planned.
Flanders seems to be the most virtuous region in waste prevention. On 23 December 2011, the ‘Materials Decree – Decree on the sustainable management of material cycles and waste’ (Flanders Government, 2011) established that the Flanders Agency for Public Waste, Materials & Soil (OVAM) has to ‘coordinate the design of prevention programmes and their possible review, and follow up their implementation’ (article 17). Furthermore, ‘(. . .) with a view to the design and implementation of the prevention programmes, consultation platforms shall be set up’ (article 17). The ‘Implementation plan for household waste and comparable industrial waste’ of Flanders (OVAM, 2016) has the aim to plan waste management and prevention in 2016–2022 period. Moreover, it wishes to decouple consumption from waste generation. The plan sets the target of 502 kg of household waste per capita in 2022 (the average in 2012, 2013 and 2014 is around 522 kg per capita). All current prevention programmes, strategies and initiatives are continuously monitored and evaluated as part of the legislative process (European Environment Agency, 2016c).
Another document that proves the commitment of this region is The Flanders’ Materials Programme (OVAM, 2012). As reported by the Ellen MacArthur Foundation (https://www.ellenmacarthurfoundation.org/case-studies/belgium-flanders-materials-programme), from 2012 to 2015 OVAM and its strategic partners invested €5.5 million in Flanders Material Programme projects.
In June 2016, Wallonia presented the new plan on waste prevention, ‘Plan wallon des Déchets-Ressources’ (Government of Wallonia, 2018), adopted on 22 March 2018. The plan reported expected evolutions of household waste levels between 2013 and 2025, in a business-as-usual projection compared with a scenario that considers prevention. The expected effect of the household waste prevention actions up to 2025 for household waste is achieving the target of 501.20 kg capita−1 (in 2013, 528.9 kg capita−1). Prevention is also mentioned in ‘The Marshall Plan 4.0 (2015–2019)’ (Government of Wallonia, 2015), the economic redeployment programme for Wallonia, intended to refocus the priorities of economic restructuring programme around the digital economy and circular economy.
At a national level, in 1996, a cooperation agreement on the prevention and management of packaging waste was made in order to adapt the European Directive 2004/12/EC to the specific characteristics of Belgium. A new version of the agreement came into force in 2009 (Belgian Interregional Packaging Commission, 2008). The cooperation agreement is an Inter-regional Law, valid on the entire Belgian territory. The Cooperation Agreement requires every company that packages products in Belgium or which has products packaged in Belgium, to take back used packaging and satisfy certain recycling and reuse quotas. It includes specific recycling and recovery targets, but also the introduction of a packaging prevention plan: Companies that bring at least 300 t of single-use packaging onto the market every year or which package products in Belgium or which have products packaged within Belgium must submit a general prevention plan every 3 years (see https://www.fostplus.be/en/fost-plus/about-fost-plus/legal-framework). The prevention plan: shall include the prevention measures completed during the previous year by the responsible company, those that are ongoing and those that are planned for the term of the prevention plan, in accordance with the regional waste plans. It shall describe (. . .) at least the measures planned and the targets relating to reducing the amount of packaging waste created (. . .) (art. 4., Belgian Interregional Packaging Commission, 2008).
Bulgaria
In 2014, Bulgaria published a National waste prevention programme, in accordance with Article 50 of the Waste Management Act adopted in July 2012 (Bulgarian Government, 2012). The National waste prevention programme is integrated with a National Waste Management Plan (Bulgarian Ministry of Environment and Water, 2014). The approximate value of the prevention programme is 98.27 million BGN, equivalent to 50.23 million Euro (Bulgarian Ministry of Environment and Water, 2014). The programme does not set a real quantitative target, as it is stated that ‘In 2020, the value of “generated municipal waste per inhabitant” is less than the value of the indicator in 2011. This should be true for every municipality’. The evaluation and monitoring of the programme is designed. Every 3 years, after initial approval by the Government of the National Waste Prevention Programme, the Minister of Environment and Water shall submit a report to the Council of Ministers for its implementation. In case of failure to achieve the objectives described above, the report should state the reasons and the measures to be taken to ensure future performance (European Environment Agency, 2016e).
Many activities related to objectives are defined in the action plan attached to the programme, together with deadline for implementation, expected results, performance indicators and responsible institutions. One important indicator is the number of municipal waste management programmes developed by municipalities with waste prevention measures included. Regarding packaging, the plan set a quantitative target, stating that the amount of used polymer bags for single use should be up to 5% of the amount used in 2010 by 2020.
Italy
In Italy, the main document addressing waste prevention policies is the ‘National Waste Prevention Programme’, adopted by the Ministry of the Environment (MATTM, Ministero dell’ambiente e della tutela del territorio e del mare) with Directorial Decree of 7 October 2013 (Italian Ministry of the Environment, 2013). The Programme indicates prevention objectives by 2020 compared with 2010 levels based on unit of GDP. The target for MSW prevention is a 5% reduction in the ratio: Generated MSW/GDP. There is no information specifically indicating how the overall programme is to be monitored and/or evaluated, nor the frequency with which evaluations will be carried out or other requirements (European Environment Agency, 2016f).
Italian Regions are in charge of planning the integrated system of waste management via the adoption of Regional Waste Management Plans. The regions shall integrate the national targets fixed in the National Waste Prevention Programme within their plans and programmes. Municipalities are then required to implement the measures provided by the regional plans for waste prevention. For example, in the ‘Circular Economy’ Regional Law 16/2015, Emilia-Romagna Region set a target for the reduction of per capita urban waste generation, from 20% to 25% compared with 2011 by 2020 (Regional Law 5 October 2015, N.16, ‘Provisions to support the circular economy, the reduction of municipal waste production, the reuse of end-of-life assets, separate waste collection and amendments to the Regional Law of 19 August 1996 n. 31’).
At a national level, the activities carried out during the creation of the ‘National Prevention Plan of Food Waste’, led to the approval of the Law 166/2016 on food waste, which does not set a specific prevention target (Azzurro et al., 2016; Italian Parliament, 2016). Moreover, considering packaging, in 2019 the main packaging organisation, CONAI (National Consortium for Packaging), has written a Specific Programme for prevention and management of packaging and packaging waste (CONAI, 2019), but it does not set a quantitative target on packaging waste reduction.
The Netherlands
In the Netherlands, the first National Waste Management Plan (Landelijk Afvalbeheer Plan – LAP) was published by the Ministry for Housing, Spatial Planning and the Environment in 2003; the document is drawn up every 6 years (Dutch Ministry for Housing, Spatial Planning and the Environment, 2003).
A prevention programme was prepared in consultation with various stakeholders by the Dutch Ministry of Infrastructure and the Environment published in 2013 (Afvalpreventieprogramma Nederland, Waste Prevention Programme, The Netherlands: better design – less waste – smarter consumption), not included in the LAP. The waste prevention programme must be reviewed by 2019 at the latest.
The elaboration of prevention activities started with the From Waste To Resource programme (VANG) in 2013 (Dutch Ministry of Infrastructure and the Environment, 2013). This implementation programme was carried out between 2014 and 2016. The programme produced several implementation programmes, such as the ‘VANG for Household Waste implementation programme’ (Dutch Ministry of Infrastructure and Water Management, 2014a), which originated from the ‘Public framework for household waste 2025’ (Dutch Ministry of Infrastructure and the Environment, 2014b), the ‘More and Better Recycling programme’, and the ‘VANG Outside the Home programme’. The VANG programme is a precursor to the government-wide programme ‘A Circular Economy in the Netherlands by 2050’ (Government of the Netherlands, 2016), primarily aimed at reducing the use of raw materials. This programme set a target in 2030 of a 50% reduction in the use of primary raw materials (minerals, fossils and metals).
In section A.3.2, the last version of the waste management plan, released in 2017 (LAP3, 2017–2029), includes some ambitious targets on waste prevention (Dutch Minister for Infrastructure and Water Management, 2017):
The total waste generation in 2023 may not exceed 65m t, and in 2029, it may not exceed 70m t (in 2014, the amount of waste generated was 60m t).
The production of household waste is reduced from 500 kg in 2014 to a maximum of 400 kg per resident per year in 2020.
Romania
In December 2013, the Romanian Government adopted Decision 870 regarding the National Strategy on Waste Management 2014–2020 (Official Gazette of Romania No. 750 dated 4 December 2013 – http://mmediu.ro/new/wp-content/uploads/2014/01/NationalWasteStrategy.pdf ), which considers waste prevention and reuse for a more efficient use of resources. Romania started a project to develop a waste prevention programme in 2014.
On 5 January 2018, National Waste Management Plan was published in the Official Gazette of Romania (Government of Romania, 2018). This Plan also contains the National Waste Prevention Programme. The objective is the reduction by 10% of the amount of household waste produced in 2017 by 2025. The proposed measures in prevention are addressed to priority streams: Household waste, packaging waste, waste from wood processing, chemical and steel industry. Another relevant document is ‘Romanian Green Growth Strategy 2013-2020-2030’ (Government of Romania, Ministry of Environment and Sustainable Development, United Nations Development Programme National Centre For Sustainable Development, 2008). It states that in field of waste the activities (. . .) will concentrate on the implementation of integrated projects for waste management at national and regional levels through a hierarchical allocation of investments in accordance with the established priorities: prevention, selective collection, recycling and re-use, treatment and elimination.
Considering food waste, the Law 217/2016 establishes the general legal framework for prevention of food waste and seven sets of measures for prevention, without setting any quantitative targets.
In general, it should be considered that regulation for managing MSW is in its early stages and the accession to the EU in 2007 has put the Romanian solid waste management under the regulative influence of the European Directives (Almasi, 2013; Atudorei, 2006; Ferronatoa et al., 2019). An important issue of the waste management system in Romania is represented by the low area of coverage with collection services. Thus, at a national level in 2011 only 76% of the population was served by sanitation services; the urban share being approximately 90% and only 59% in rural areas (Romanian Ministry of Environment and Climate Change, National Agency for Environmental Protection, 2014). The improvement of this coverage rate might be prioritised over quantitative waste prevention.
Spain
In Spain, waste prevention and management policies and strategies are featured in Law 22/2011 on waste and contaminated soil, the State Framework Plan for Waste Management and, at a regional level, the Waste Management Autonomic Plans elaborated by the Autonomous Communities. The Autonomous Communities shall elaborate prevention programmes in their territorial scope. Local entities may then elaborate this type of programme for those residues that fall within its competence, on an optional basis. The Spanish National Programme for Waste Prevention 2014–2020 (Spanish Government, 2014) defines several strategies and measures in each of the different waste streams, including packaging waste. Its main objective is to reduce 10% of the amount of waste produced in 2010 by 2020. There is not a specific target for households waste or municipal waste. Several measures are defined to reach the goals for each strategy. The prevention strategies are aimed at reducing the quantity of waste, promoting reuse and extending products’ life, reducing the hazardousness and the environmental impact. In addition, several measures are defined for each strategy (Rubio et al., 2019). The programme’s results will be monitored every 2 years, with 2014 as the reference year (European Environment Agency, 2016g).
Moreover, the Spanish Ministry of Agriculture, Food and the Environment developed the ‘More food, less waste’ strategy in 2013 (Spanish Ministry of Agriculture, Food and the Environment, 2013), without setting a quantitative target. As example of virtuosity, the region of Catalonia has its own regional plan on food waste reduction. This regional plan ambitiously sets a target to halve 2010 food wastage quantities in the retail, hospitality, restoration and households by the end of 2020.
In Spain, the law on packaging stated the set of indicators that has to be used by companies to assess and report their performance in their prevention plans (Tencati et al., 2016). The Royal Decree 782/1998 develops the so-called ‘dual system’ for packaging and packaging waste management.
Furthermore, the decree establishes the obligation to draw up a Business Prevention Plan of packagers that put on the market a number of packaged products likely to generate packaging waste in amounts exceeding certain thresholds in the course of a calendar year. The plans must serve for packagers to set an objective for the reduction of the packaging waste generated when marketing products. These plans must be approved by the competent body of the autonomous community in which the measures envisaged in the plan are implemented (the 17 autonomous regions).
Market-based and economic instruments and waste prevention
Economic instruments can play a crucial role in the achievement of waste prevention and management objectives (Directive 2008/98/CE; Directive 2018/851/EU). Waste can have value as a resource, and the further application of economic instruments may maximise business and environmental benefits.
The considered MBIs seek to address the market failure of ‘environmental externalities’ either by incorporating the external cost of production or consumption activities through taxes or charges on processes or products, or by creating property rights and facilitating the establishment of a proxy market for the use of environmental services. The use of such instruments at the appropriate level should therefore be encouraged while stressing that individual Member States can decide on their use.
These are tools that influence behaviour through economic signals rather than explicit directives. If they are well designed and implemented, they encourage individuals or companies to undertake prevention efforts that are in their own interests and those collectively meet policy goals. Two types of economic instruments can be distinguished:
Instruments influencing prices (e.g. taxes and subsidies).
Instruments influencing quantities (e.g. tradable permit schemes) (Arcadis et al., 2010).
Of the four considered MBIs, environmental taxes, EPR and DRS might influence prices of the goods, while EPR and PAYT are supposed to influence the quantity of waste produced. However, it is difficult to spot the connection between the implementation of these instruments and the actual reduction in waste production among the selected countries. This section focuses on the role the MBIs can play on a national level. The analysis of the implementation of these instruments can bring up some disadvantages.
In general terms, the costs of implementation and management of the MBIs can discourage the member states from implementing these instruments on national scale.
EPR
EPR is defined as an environmental policy principle in which a producer’s responsibility is extended to the post-consumer stage of a product’s life including take-back, recycling and final disposal (Lindhqvist, 2000; OECD, 2014). EPR systems can either be a legal instrument (specific wastes streams, e.g. waste electrical and electronic equipment (WEEE), end-of-life vehicles (ELVs), packaging) or a voluntary commitment. EPR is considered to be one of the major waste management policy instruments that support the implementation of the European waste hierarchy (Milios et al., 2018). EPR schemes may differ according to the target they are aimed to achieve (Massarutto, 2014; Walls, 2003). For example, they can be focused on end-of-life, or widened to include environmental impacts throughout the product life cycle. They may be intended to deal with waste volumes, the toxic constituents of waste, the method of waste disposal or a combination of these things. They might be expressed in terms of volumes of recycling or of waste prevention and green design (Massarutto, 2014). EPR is often classified as an economic instrument, because the producers become logistically and/or financially responsible for their products in the end-of-life phase, which brings about costs for collection, recycling and reuse. The national systems vary considerably in design, in terms of influence of pre-existing policy and systems, methods of achieving producer compliance, fee structures, targets, waste stream prioritisation and local authority involvement (Cahill et al., 2010). The topic of effectiveness of the EPR schema in waste reduction is discussed in the literature. EPR promised to induce manufacturers to incorporate waste considerations in their strategies, and therefore to foster green design and waste prevention. This argument was the strongest one in support of EPR at the beginning (Lindhqvist, 2000; Massarutto, 2014). According to Runkel, who investigates how EPR influences product durability, EPR induces increased durability (Runkel, 2003). So, a consequent decrease in waste quantity can be supposed. As highlighted by McKerlie et al., the German Green Dot system is an example of EPR that has stimulated more sustainable packaging design and resulted in significant waste reduction. Between 1991 and 1997, Germany achieved a total of 3% annual reduction in packaging, clearly reversing the previous trend of 2%–4% increase per year, prior to the packaging ordinance introducing EPR (McKerlie et al., 2006; OECD, 1998).
The analysis conducted by Rubio et al. shows that the implementation of EPR policies to packaging waste have had a positive impact throughout the years in Spain and in Portugal. Regarding the waste reduction goal, the systems have still not been completely able to detach packaging waste production from economic growth, but they have been able to promote material usage reduction directly through the Green dot fee model adopted and to invest and finance new and innovative studies projects and research and development related to packaging sustainability (Rubio et al., 2019). Generally speaking, in the packaging field some prevention has occurred owing to reductions in material use and product/packaging downsizing (Massarutto, 2014; Walls, 2006).
Nevertheless, it can be stated that the impact of EPR on green design and product innovation has been much lower than expected (Massarutto, 2014; Walls, 2006). For example, in the field where an effect on green design was most expected, that of engineered products such as electronic equipment, improvements have been insignificant (Massarutto, 2014; Yu et al., 2008).
The European Directive 2018/851/EU, amending Directive 2008/98/EC on waste, aims to define the general minimum requirements for EPR schemes (8a). Even though several considerations about EPR measures for waste prevention have been stated in the Directive (see whereas 14, 26, and art. 8a1a 8a1b), none of them are bonding to concrete quantitative reduction targets.
This Directive is innovative in terms of waste prevention and EPR, because it states that the financial and/or organisational responsibility of producers can include ‘a responsibility to contribute to waste prevention and to the reusability and recyclability of products’ (as 14).
So far, the EU forces Member States to adopt EPR systems for WEEE (Directive 2012/19), ELVs (Directive 2000/53), portable batteries and accumulators (Directive 2006/66). Moreover, the recent Directive 2019/904 on the reduction of the impact of certain plastic products on the environment forces the introduction of EPR for all single-use plastic products, listed in Part E of the Annex to the Directive, which are placed on the market of the Member States, while suggesting the implementation of EPR for fishing gear containing plastic.
Table 2 shows some of the EPR programmes in place in the considered six EU countries and their implementation year.
Types of EPR programmes and implementation year in the selected EU Member States (2013).
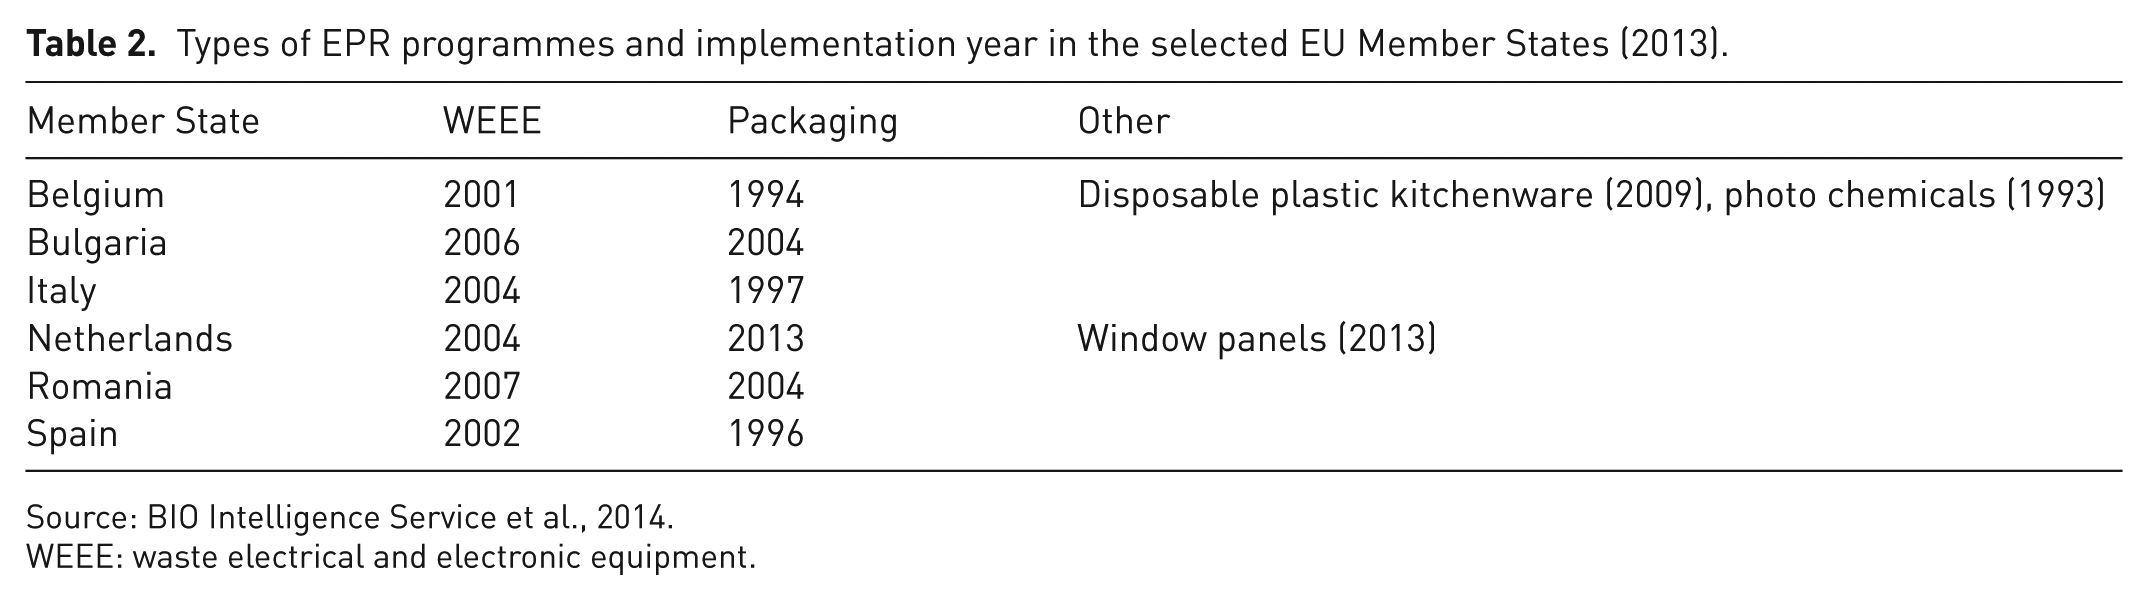
WEEE: waste electrical and electronic equipment.
According to the results obtained by Eurostat data elaboration (Eurostat, 2019a, 2019b), packaging and WEEE production trends among the past few years do not seem to be affected by the EPR implementation in terms of quantity. Despite datasets starting from the EPR implementation year (or even before) for every country, Figures 4 and 5 show how waste generation trends are constantly growing over time. Large dots, where present, indicate the implementation year.
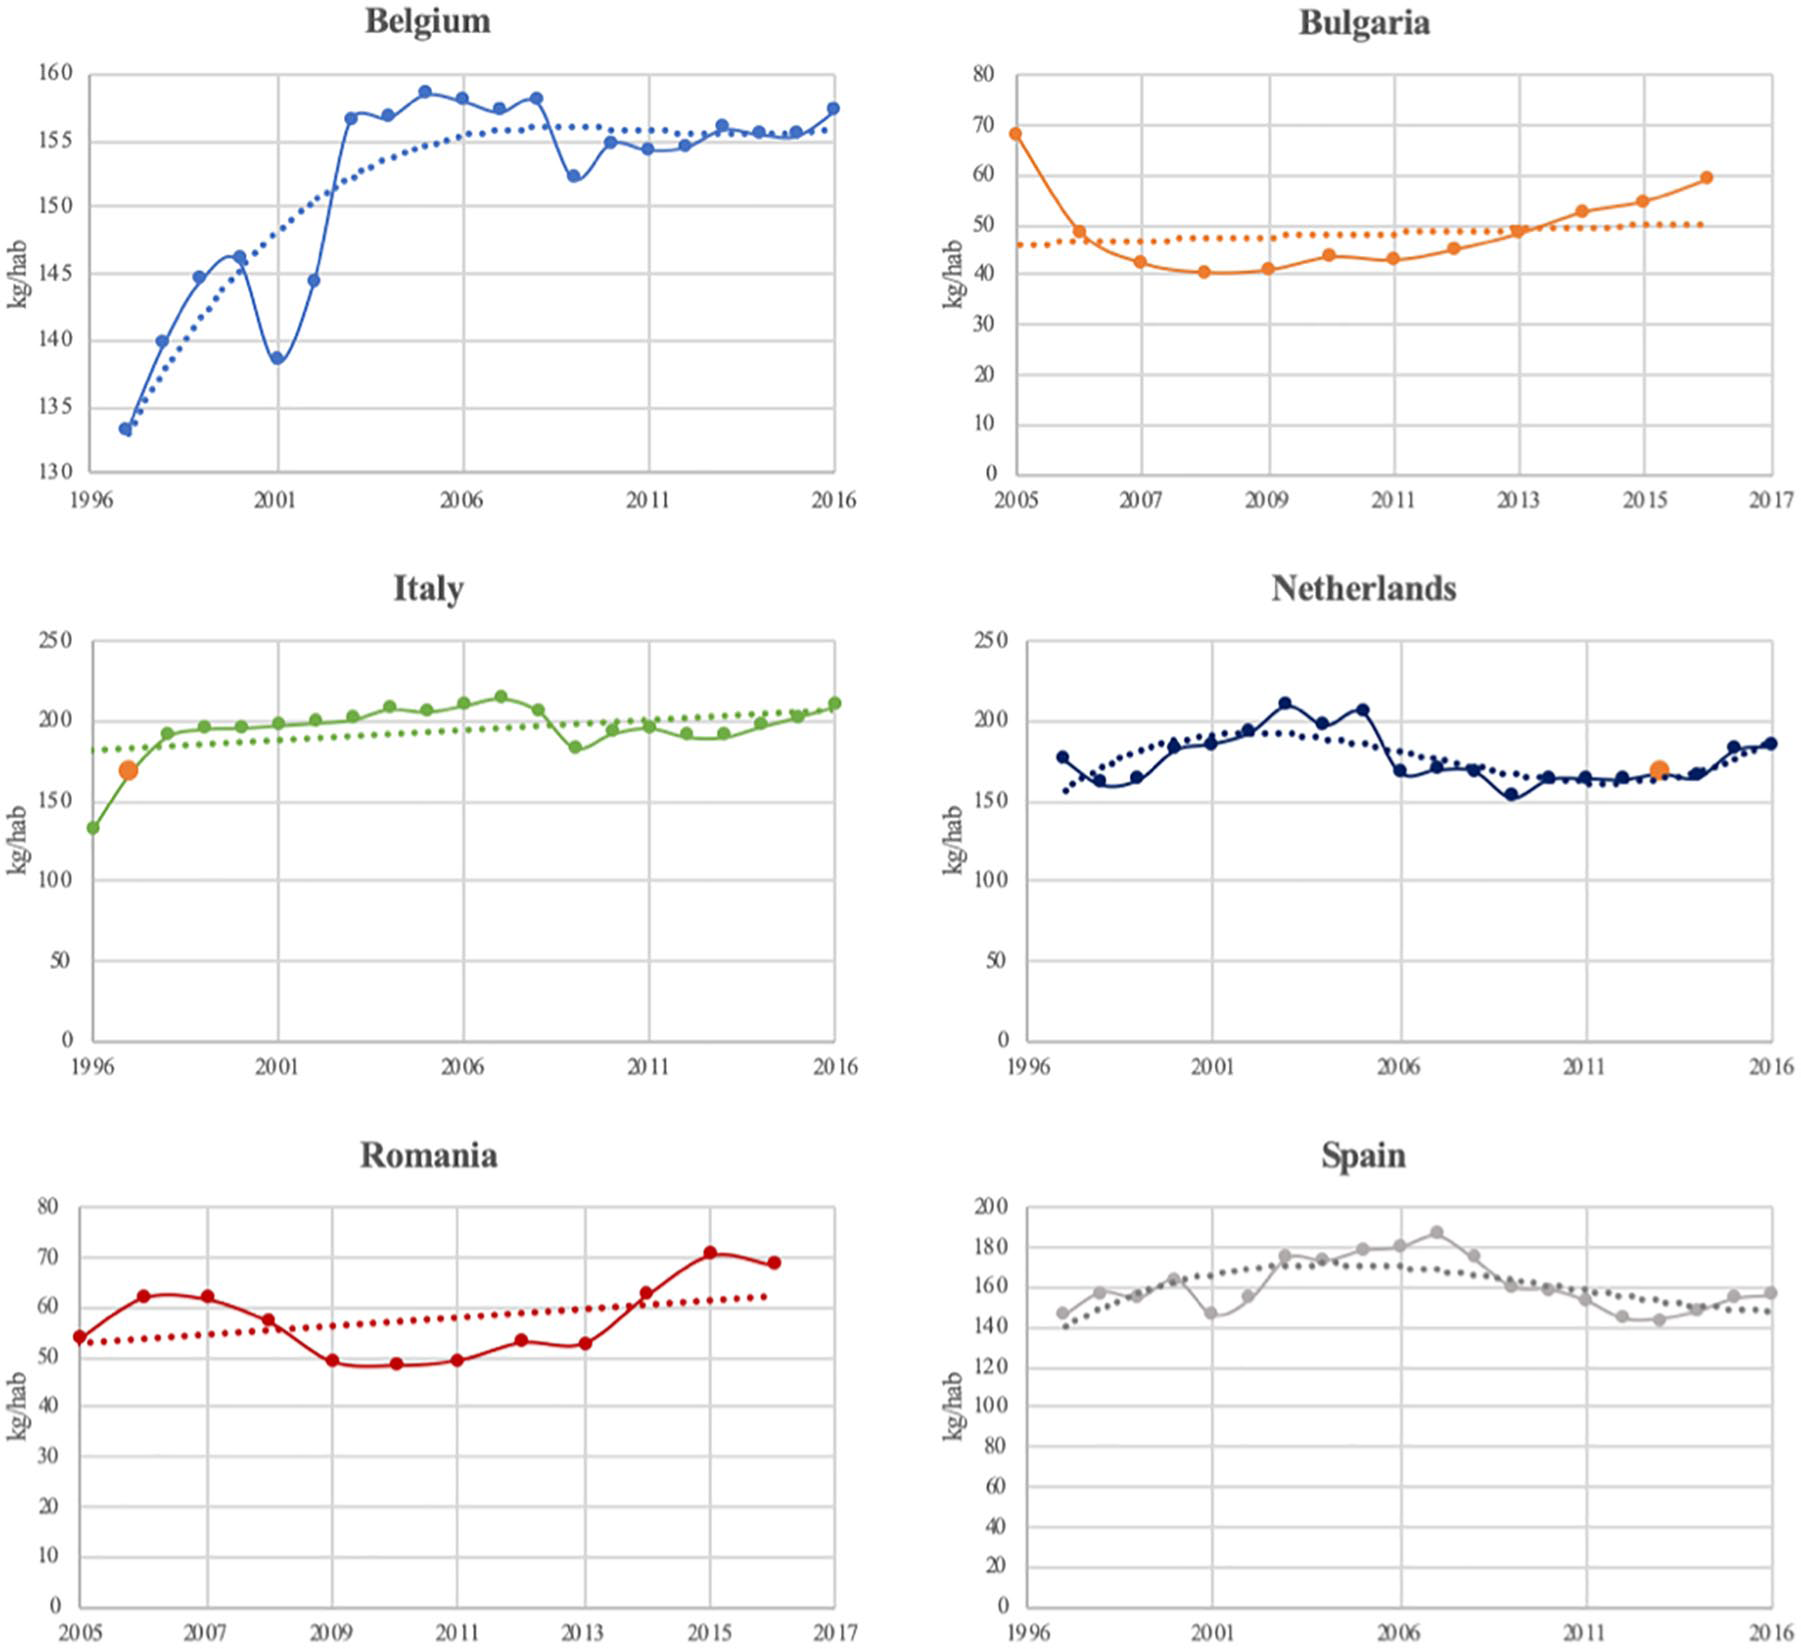
Municipal packaging waste generation trends, in the EU28 selected countries.
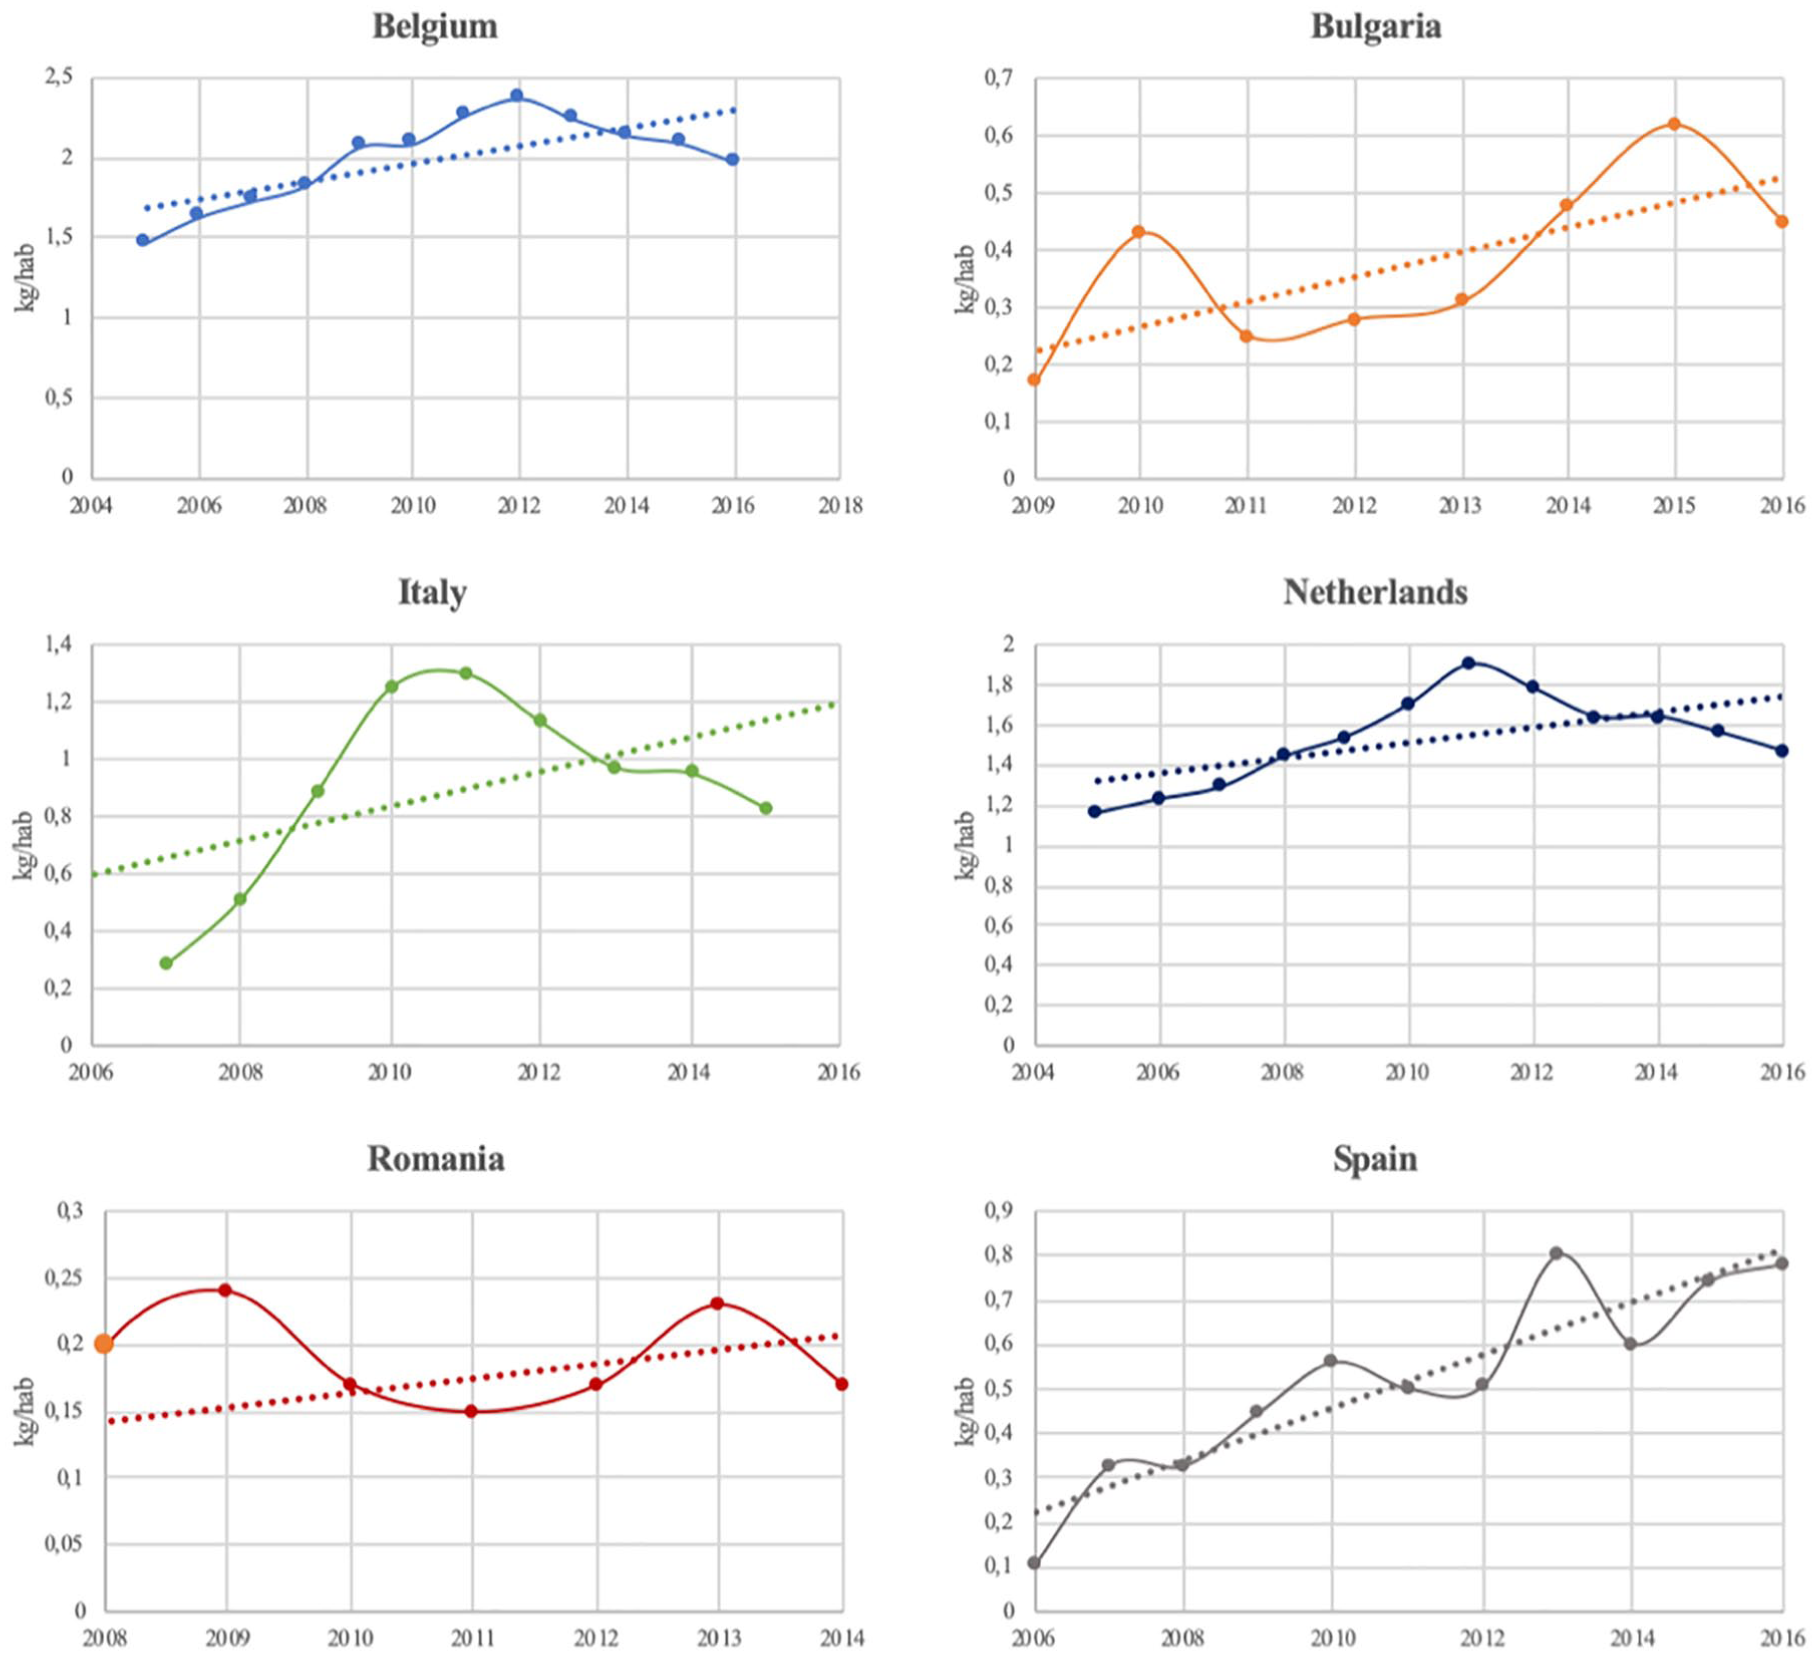
Generation trends of WEEE from households, in the selected EU28 countries.
Hence, it might be stated that among the selected countries, these kinds of EPR schemes do focus on recycling targets rather than prevention targets. In fact, most of the EPR schemes tend to achieve no more than the collection and recycling targets set in the waste legislation (Leal Filho et al., 2019).
PAYT
Traditionally, residents pay for waste collection through property taxes or a fixed fee, regardless of how much waste they generate. PAYT schemes breaks with tradition by treating waste services just like electricity, gas and other utilities. Households pay a variable rate depending on the amount of service they use. In communities with PAYT programmes, residents are charged for the collection of MSW based on the amount they throw away (US Environmental Protection Agency’s Web Archive).
In most PAYT schemes, the overall cost of the service is funded through a combination of flat rate fees or taxes and a variable element that may be linked to one or more of the following schemes:
Volume-based schemes: The choice of container size.
Sack-based schemes: The number of sacks set out for collection.
Frequency-based schemes: The frequency with which a container is set out for collection.
Weight-based schemes: The weight of material collected in a given container.
PAYT schemes can be applied to a specific waste stream, like residual waste, or to more than one stream.
PAYT schemes are not included in the list of waste prevention measures in Annex IV, Directive 2008/98/EC, while this tool is listed in Annex IVa to Directive (EU) 2018/851, which provides examples of economic instruments and other measures to provide incentives for the application of the waste hierarchy. PAYT can encourage a change in consumption patterns. The ‘Best Environmental Management Practice for the Waste Management Sector’ included PAYT among the best environmental management practice (BEMP) on waste prevention (Dri et al., 2018).
According to a literature review, some cases studies support the idea that PAYT application might be directly linked to total waste reduction. For example, since widespread implementation of PAYT in Ireland in 2004, the country has witnessed significant reductions in waste, despite some reports of problems with illegal dumping: Reductions as high as 45% were recorded in some municipalities after the first year of implementation (Dahl, 2010; Scott and Watson, 2006; Walls, 2006). The implementation of PAYT in the city of Dresden caused the drop of collected household waste per capita by nearly 12% within 6 months (Reichenbach, 2008). Considering additional EU countries, in 1994, the US Environmental Protection Agency (US-EPA) published a guidebook for the introduction of PAYT (Canterbury, 1994) and also proactively promotes PAYT. Communities using PAYT have seen reductions in the amounts of waste, savings in treatment costs and increases in recycling rates (Canterbury and Eisenfeld, 2006; Sakai et al., 2008). In the United States, waste reduction in PAYT municipalities is estimated to be about 16%–17%, which is equivalent to about 3.2% of the amount of residential waste discharged. Source reduction is estimated to be about 6%, which is equivalent to 1.2% of the amount of residential waste discharged nationwide (Sakai et al., 2008; Skumatz, 2000). In 1995, Korea started to introduce a nationwide PAYT programme in order to drastically reduce the amount of waste generated. The success of the programme in terms of waste reduction has been reported (Hong, 1999; Sakai et al., 2008). Some researchers are sceptical about PAYT programmes. Some criticisms are owing to a potential increase of illegal waste dumping, thus rising costs for the municipal solid waste management (MSWM) service, as well as reducing environmental benefits (Allers and Hoeben, 2010; Elia et al., 2015). In some cases, the amounts of waste generated rebound with time and revert to an upward trend. It is therefore necessary to design a comprehensive mechanism that includes PAYT and considers the specific features of each municipality, because the same PAYT programme can have different outcomes in different municipalities (Sakai et al., 2008). In general, PAYT schemes can raise citizen awareness of their own waste production, hence encouraging them to prevent excessive production. Furthermore, the incentive to waste reduction is bigger if various waste streams, including unsorted waste, are involved.
Volume-based schemes generally impart the weakest incentive for waste prevention and recycling (BIO Intelligence Service et al., 2012; OECD, 2006). This is partly related to the fact that once a bin of a specific size has been purchased (or subscribed to), the marginal cost of reducing the quantity of waste sent to the residual waste container is effectively zero. Considering waste prevention, weight-based schemes perform best, while schemes using sacks or based on frequency and volume of container are next best and broadly similar in performance. Schemes based only on choice of container size are the least effective (Card and Schweitzer, 2016; Dohogne et al., 2016).
PAYT has been in place across Europe for more than 25 years already. The policy now exists in a wide range of European countries in varying forms. Germany, the Netherlands, Belgium, Sweden, Austria and Finland have been experimenting with PAYT for a long time (ARS Ambiente, 2017).
Since the decision is left to counties and municipalities, PAYT schemes are often implemented on a sub-national level, so it is difficult to estimate the coverage (in terms of population or number of municipalities covered) of PAYT systems in the Member State that implement them. Considering the six selected countries, the coverage rate varies widely, from a very small proportion in Spain (Catalonia only), to over 20% of municipalities in the Netherlands.
Table 3 indicates the various PAYT schemes implemented in each country and its coverage rate (coverage rate and type/combination of schemes are not strictly related).
Application of PAYT schemes in the selected EU Member States.
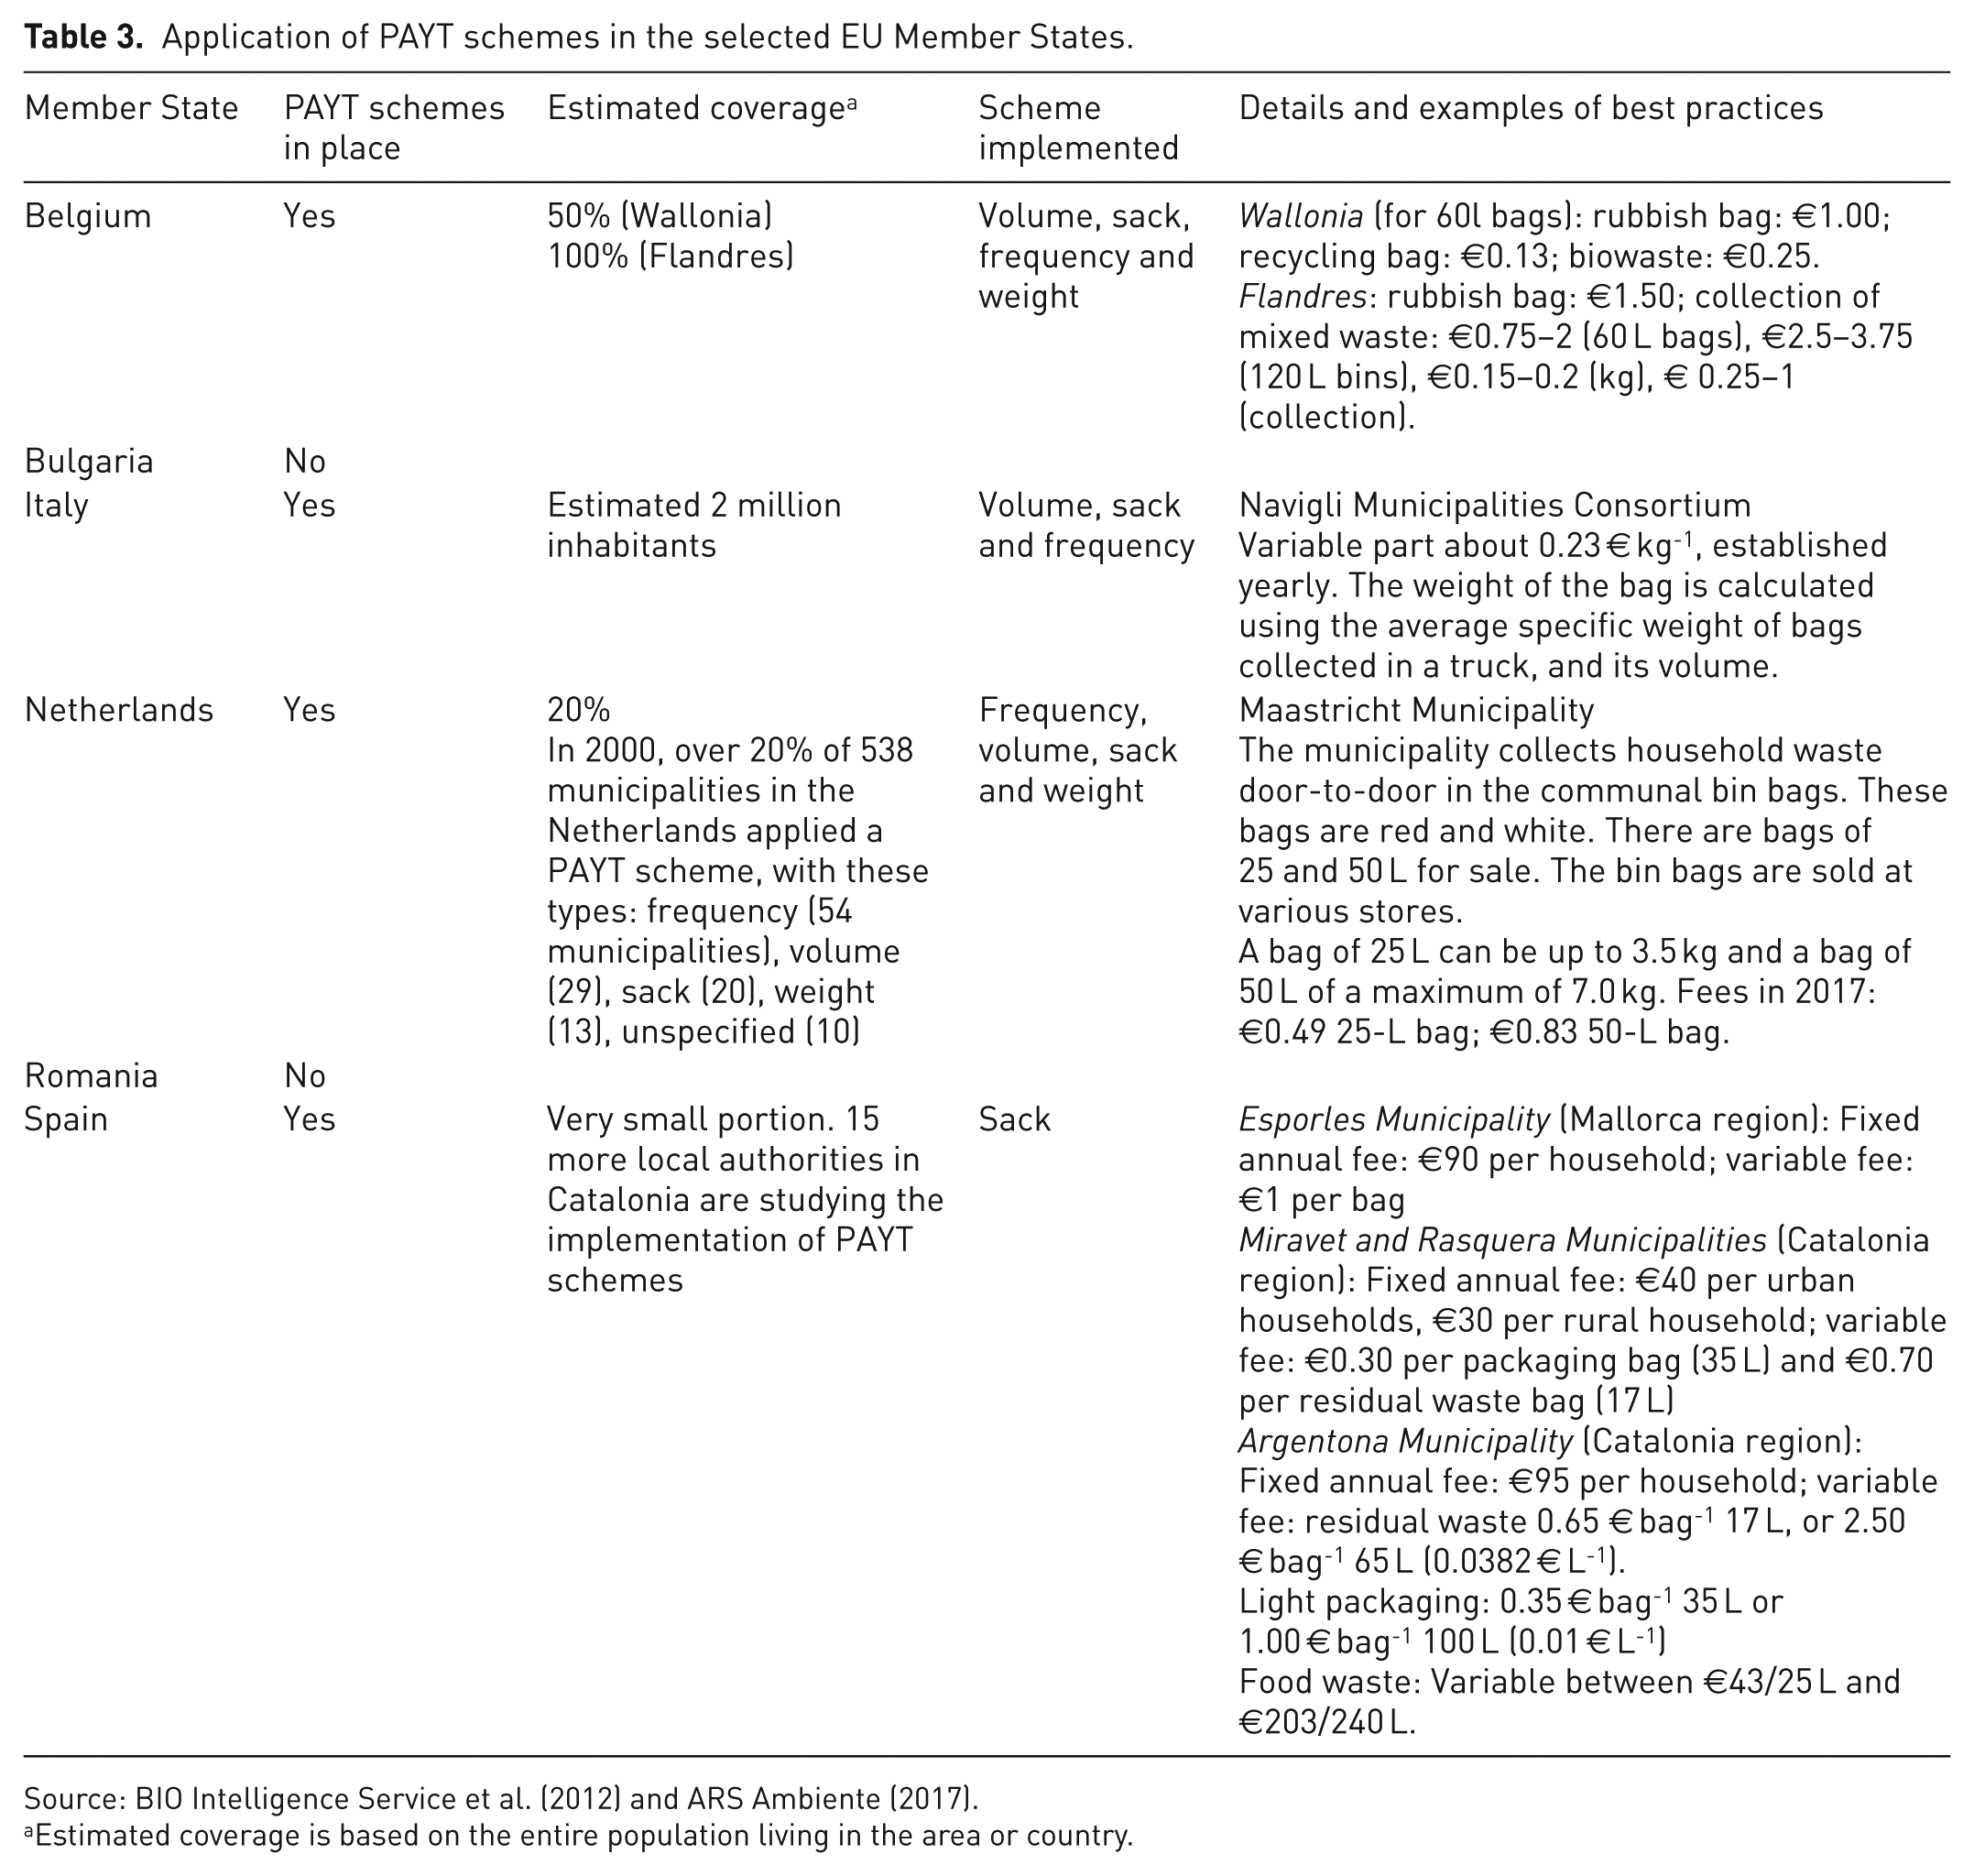
Estimated coverage is based on the entire population living in the area or country.
Analysing the findings reported by Table 3, it can be stated that few areas are currently implementing PAYT schemes and just the Flemish area reached 100% coverage (Regions for Recycling, 2014).
Bulgarian municipalities do not implement any type of PAYT scheme. The reason of this approach can be found in the Bulgarian National waste prevention programme (Bulgarian Ministry of Environment and Water, 2014), where it is stated that: Applying more directly the “Polluter pays” principle in determining the waste fee by measuring the waste quantities is likely to contribute to reducing the amount of municipal waste and encourage the participation of the population and businesses in systems of separate collection of recyclable waste at the source, but changing the way of defining the municipal waste fee is a major challenge for municipalities and the population.
Thus, PAYT systems are not implemented on a national level. Some PAYT systems are partly implemented for activities as companies, institutions and hospitals. Payment is mostly based on generated waste quantities (number of containers, collection frequency) (European Commission, 2011a).
Italian municipalities/regions are free to implement a waste management system of their choosing, but are still responsible for meeting the targets set by their Optimal Territorial Scope office. In the Emilia-Romagna Region, Regional law 16/2015 states that all the municipalities have to implement a PAYT system by 31 December 2020. Lazio Region did the same in 2016, with Regional Law of 10 August. The 2018 municipal waste report issued by the Italian Institute for Environmental Protection and Research (ISPRA), studied the implementation of PAYT systems in 2593 of the 7914 Italian municipalities. The study highlighted that 341 municipalities are actually implementing PAYT systems (ISPRA, 2018), and the ones who did, have gathered results, different from northern to southern regions. Although the most successful demonstrate some impressive results, in the Province of Trevisio, the amount of waste sorted by households (and therefore the amount of waste recycled) increased by 12.2% following the introduction of PAYT (BIO Intelligence Service, 2012).
As well as the Italian case, just a few Dutch municipalities implement PAYT schemes (Regions for Recycling, 2014). The adoption of this kind of scheme on a national level is under evaluation and has been brought out by many studies over the past few years.
In the recent Romania National Waste Management Plan, the voluntary implementation of PAYT is mentioned as an objective, starting from 2018, together with the implementation of PAYT system at national level by 2025.
Even though waste charges are widely implemented over the whole Spanish territory, the application of PAYT schemes is very limited. Just a few Spanish municipalities had implemented this kind of charge for household waste, and a few more for commercial waste.
In conclusion, it can be stated that PAYT schemes are difficult to track down and analyse, since all the countries considered leave the implementation decision up to the regions or municipalities.
The authors would suggest, for example, to associate an environmental impact parameter to each waste flow (e.g. the production of CO2, determined through emission factors expressed in kgCO2 per kg waste). This way, the variable fee determines the actual cost applied to the user based on the actual environmental impact generated and, above all, allows us to take into account different waste management actions. A further step would be taken providing fee reductions proportional to the amount of waste prevented by the implementation of preventive measures.
DRS
A DRS is the surcharge on the price of potentially polluting products. DRS are basically a combination of two instruments: a tax on the purchase of a certain product, and a subsidy on the separate collection of the same product in its after-use stage (Linderhof et al., 2019). When pollution is avoided by returning the products or their residuals, a refund of the surcharge is granted (Glossary of Environment Statistics, 1997). They can be efficient policy instruments to encourage reuse and recycling (Linderhof et al., 2019; Walls, 2011). Moreover, it might reduce the amount of waste and lead to a reduction of littering (Linderhof et al., 2019).
Today, DRSs for recycling are the most commonly implemented. They address one-way packaging (e.g. beer cans, soft-drink bottles) and incentivise the return of the packaging (once the beverage has been consumed) to collection points. DRSs for reuse were widely in use until the 1980s, while today the focus is on recycle. Since the development of EPR schemes requires less logistic and financial involvement from the companies, DRSs for reuse have been progressively abandoned (Condamine, 2019). By the way, DRS for reuse can achieve good results for waste reduction, taking advantage of the increased citizens’ awareness that comes with the system. DRS for reuse can be seen as an effective tool for helping citizens visualise the impact of their actions (Zero Waste Europe, 2019). Nevertheless, a study performed by Simon in 2016 highlighted how reuse systems have limits in terms of environmental benefit. Simon performed an LCA analysing the greenhouse gases (GHG) emission avoided by using DRS to refill plastic bottles, The study brought out that the reduction of GHG emission became less significant after 7–9 refills. This means that reuse systems have an asymptote where further increasing the number of refills does not generate significant environmental benefit (Simon et al., 2016).
The Dutch Environmental Protection Act gives the opportunity to implement mandatory DRS. This opportunity has not been seized yet by Dutch legislators and the DRS on one-way beverage packaging of the Netherlands is currently driven by voluntary actions. The Stichting Retourverpakking Nederland initiative covers polyethylene terephthalate bottles and achieved around 95% of collection percentage after the system implementation. There is a deposit and refund of €0.25 for each purchased bottle (Albrecht and Deprez, 2016; Reloop and CM Consulting, 2018; Spasova, 2019).
The implementation of the system is limited to voluntary actions or under evaluation in the remaining five considered countries. Starting from October 2017, Italy planned a 12-month trial for DRS, directed to the operators of bars, hotels and restaurants (therefore, no household waste was involved). The trial outcome was a total failure, since just a few dozen companies have joined the project, while the others have discarded it for too high costs and too complex bureaucratic procedures (https://www.polimerica.it/articolo.asp?id=18722).
The situation is different in Romania. In 2013, the Romanian Ministry of Environment and Forests signed a voluntary agreement aimed to develop tools for packaging waste and recycling performances. The agreement (implemented in 14 major cities) goal is to increase the collected packaging volume by 25%. One of the projects of this agreement involves offering vouchers to clients in several Romanian supermarkets when bringing end-of-life home appliances or plastic packaging (e.g. €20 voucher for a recycled refrigerator, €0.01 for plastic bottles, €0.02 for glass bottles and €2.5 for 1 kg of mobile phones) (European Commission, 2015). According to Zero Waste Europe, Romanian authorities are planning to implement a DRS starting in 2022, although involved goods have not been specified yet.
Finally, Directive 2019/904 suggests the application of deposit-refund schemes for products listed in Part F of the Annex (beverage bottles with a capacity of up to 3 L, including their caps and lids).
In conclusion, the study highlighted how just a few countries implement DRSs in their own territory. However, this kind of measure actually improves recycling performances rather than prevention. The authors suggest implementation of the ‘return on the go’ scheme developed by the Ellen MacArthur foundation (2019) designing a set of incentives tailored to the specific implementation areas.
Environmental taxes
Environmental taxes are price-growing instruments encouraging broad-based action to reduce environmental damage at least cost. Revenues can be used to provide incentives for further efficiency gains, green investments, innovation and shifts in consumption patterns (OECD, 2015c).
Figure 6 points out the environmental taxation as a percentage of each country’s GDP. Environmental taxes are mainly composed of:
transportation taxes;
energy taxes;
resources taxes.
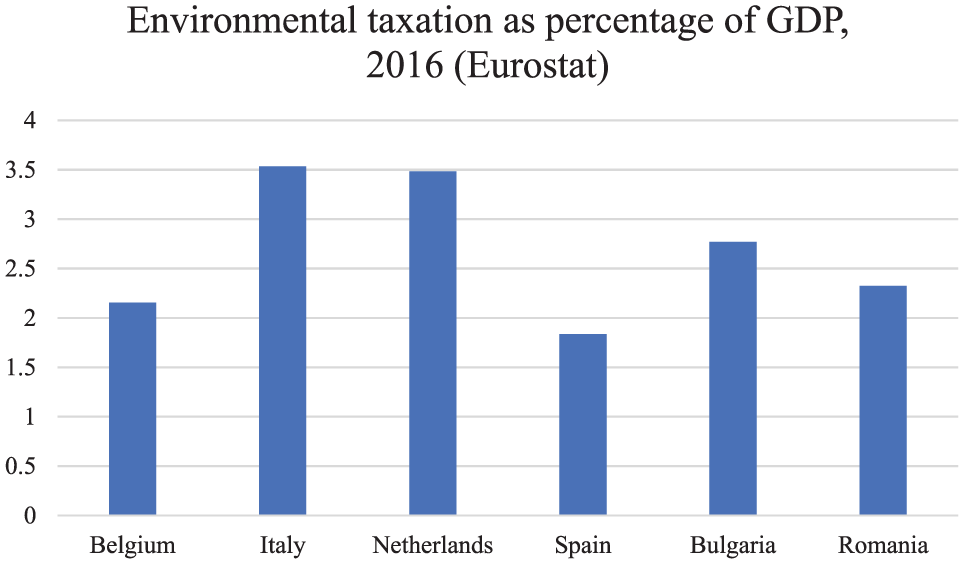
Environmental taxation as a percentage of GDP.
Despite taxation on resources providing the lowest contribution (6% as average in the six countries considered), this study will focus on this one, considering it as a prevention-driving MBI. According to Bruvoll, taxing virgin materials improves market efficiency, since current relative prices between virgin materials and other input factors promotes inefficient resource allocation. Using price incentives to combat the problems connected with material use is generally more efficient than using regulations (Bruvoll, 1998). The analysis of Söderholm, who investigates the efficiency of environmentally motivated taxes on virgin raw materials in Sweden, Denmark and the United Kingdom, indicates that taxing natural resource output or use typically represents a ‘second-best’ policy alternative, which can be used when, for instance, the monitoring of non-point source emissions is difficult or efficient property rights regimes cannot be established. The empirical analysis shows that the European aggregate taxes have assisted in reducing virgin resource use in spite of the relatively low own-price responses (Söderholm, 2011).
According to Bosquet, when environmental tax revenues are used to reduce payroll taxes, and if wage-price inflation is prevented, significant reductions in pollution, small gains in employment and marginal gains or losses in production are likely in the short to medium term, while investments fall back and prices increase. Results are less certain in the long term (Bosquet, 2000).
According to literature, most green tax reform models in Europe (Ekins et al., 2011, 2012; Withana et al., 2014; European Environment Agency, 2016b) suggest that green tax reforms could deliver positive impacts. The European Environment Agency study calculated that applying environmental tax reform (ETR) to achieve the 20% target of GHG reduction would help to create more than 1 million jobs with minor costs (0.04% of GDP). However, progress in this area at the EU level is faced with substantial obstacles. The EU has very limited competences in the area of taxation, as taxation lies generally within the competence of national Member States (Domenech and Bahn-Walkowiak, 2019).
Environmental taxes on products or on resources
Focusing the analysis on pollution, the article has studied the application of taxes on particular products. In particular, concerning plastic bags, Directive 2015/720/EU recommends the adoption of measures ensuring that the annual consumption level does not exceed 90 lightweight plastic carrier bags per person by December 31st, 2019 and 40 lightweight plastic carrier bags per person by December 31st, 2025, or equivalent targets set in weight,
setting a quantitative target on the reduction of this specific waste stream. Furthermore, it is required that the adoption of instruments ensuring that, by December 31st, 2018, lightweight plastic carrier bags are not provided free of charge at the point of sale of goods or products, unless equally effective instruments are implemented. Very lightweight plastic carrier bags may be excluded from those measures (article 4).
According to the arrangements of this Directive, some Member States decided to implement a tax on plastic bags, in order to have an impact on consumer behaviour; other states implemented voluntary agreements (e.g. the government encourages retailers to take measures aimed to reduce plastic bag usage, in particular by taxing them, but no obligation has been set so far); other countries decided to ban this product.
As for plastic bags, the EU does not set a European-wide tax rate on packaging waste. Rather each Member State can implement fiscal measures to reduce the amount of waste generated within its boundaries. Just three out of six considered countries implemented packaging waste taxes, as will be further discussed.
Table 4 provides an overview about the implementation of packaging and plastic bag taxes among the selected countries. Countries with plastic bags bans but without any economical measure have not been highlighted.
Implementation of environmental taxes on packaging and plastic bags in selected EU Member States.
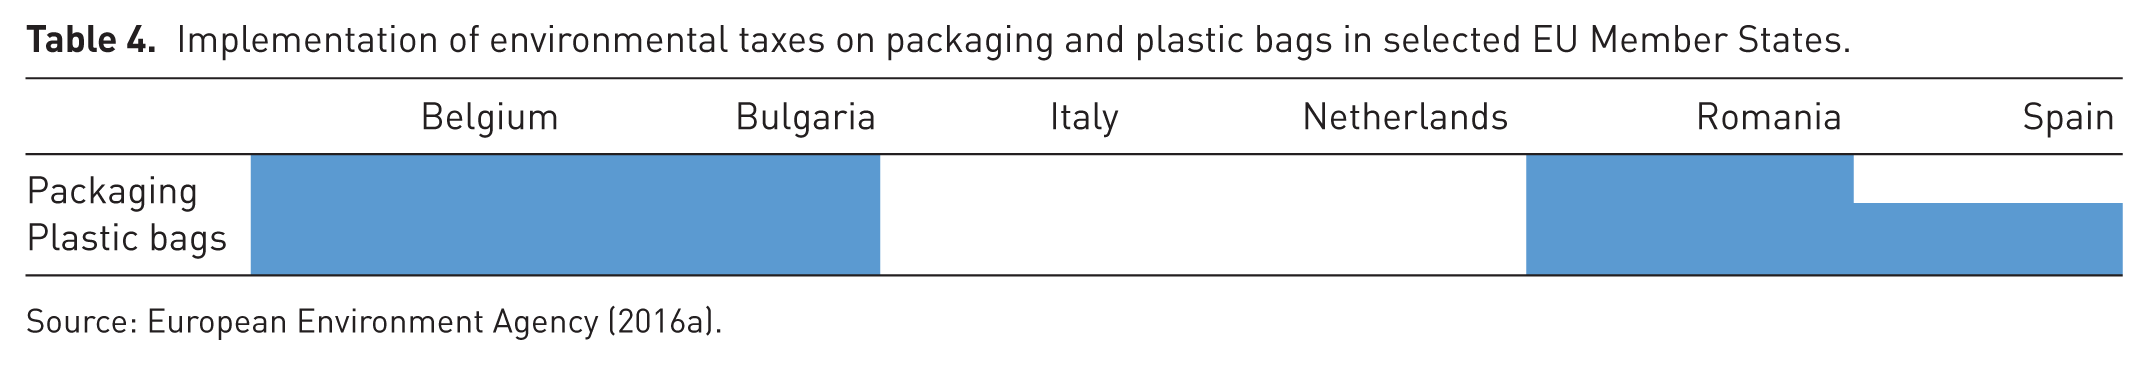
Source: European Environment Agency (2016a).
Looking deeper at the content of Table 4, two different charges on packaging can be found in Belgium. The ‘Packaging Charge’ (Haulotte et al., 2014) was introduced in 1993 and reformed in 2004, exempting all beverage container from value added tax (VAT), but also introducing much higher rates on tax, especially for non-reusable containers. By 2014, the packaging charge was €9.86 per hectolitre for non-reusable packaging and €1.81 per hectolitre for reusable packaging (Card, 2016).
The Belgian federal government had discussions about a law on plastic bags, but nothing has been adopted yet. In Wallonia, prohibition of light, single-use plastic bags entered in force on 1 December 2016 (Atzori, 2017). In Brussels Region, since September 2017, single-use plastic bags are prohibited at counters and since September 2018, all single use plastic bags are prohibited in retails. In Flanders region, no measures have been adopted yet.
In March 2004, Bulgaria have introduced the first taxes on packaging. Producers and importers of packaging on Bulgarian market are required to pay a tax defined in BGN per kilogram of packaging material. However, there are exceptions. Companies achieving the recycling and recovery targets individually and for the producers and importers of packed goods which sign a contract with a Recovery Organization, are all relieved from paying this kind of tax to the State. Among all the EU Member States, Bulgaria has been a forerunner on environmental taxes on plastic bags. An ecotax on polyethylene bags with a thickness of up to 25 microns and size smaller than 390/490mm, which are defined as single-use bags under Bulgarian legislation, is in place since October 2012. The tax on polyethylene bags increased to about € 0.28 in 2014. Retailers are not allowed to freely provide bags between 25 and 50 microns, but no fee has been set on National level.
The Italian situation is quite different. Environmental taxes are not widely implemented in Italy among the categoriesconsidered in this study. However, a ban on single use plastic bags has been implemented since 2011. In 2018, this led to a reduction of plastic bags consumption of more than 50% since 2011 (Surfrider Foundation Europe, 2018).
The Dutch Government is not currently implementing a tax over packaging products. However, businesses over the national territory have the freedom to decide how much they will charge customers for a plastic bag. The national official guideline is currently €0.25 per bag. While free plastic bags are prohibited since January 2016.
Romanian authorities have set a tax over business operators placing packaged goods on the national market. These are impelled to pay a packaging tax of equivalent €0.44 per kilogram of product placed on the market (Hogg et al., 2014). Producers and retailers can make consumers pay this tax to encourage them to use fewer plastic bags. Moreover, since 1 July 2018, a ban has been placed on the introduction on the market carrier lightweight and very lightweight plastic bags (under 50 µm) and on 1 January 2019 the ban has been further implemented to the commercialisation of these bags on the market.
Spanish Royal Decree 293/18 of May 2018 prohibits the free distribution of lightweight plastic bags from July 2018. It excludes very lightweight and ticker-recycled bags. The same decree foresees a ban on lightweight and very lightweight plastic bags (except for compostable bags) as of 2021.
In conclusion, taxes can play a strong and central role in inducing behaviour changing and promoting waste prevention. It is important to consider this in tax policy design. The examination of the existing taxation rates applied in EU Member State for the limitation of the environmental impact of plastic bags has indicated that there is no single solution that can be used in all countries. In addition, there is not one specific solution addressing both the reduction of plastic bag consumption and plastic bags littering (Kasidoni et al., 2015).
Conclusions
This study has brought out the lack of quantitative targets set for waste prevention at a EU level, in contrast to the common tendency for some other environmental issues (e.g. a common quantitative target is set by the EU on CO2 emissions reduction by 2020). A wide variety of national and sub-national targets are implemented by each Member State. The EU is currently committed to providing guidelines and directions toward waste prevention. Nevertheless, Member States are free to choose their own quantitative goals.
The indicator considered in this study only assesses quantitative prevention of total MSW. Given that the environmental effects of waste depend not only on the quantity but also on its composition, qualitative waste prevention and reduction in the hazardousness of waste generated should also be included in waste management targets and indicators. Considering the DPSIR model, it is important to assess the impact of generated waste and its potential improvement caused by prevention activities. Indicators assessing the impact of each waste stream might also be useful in the process of designing the MBIs.
The goal of the research has mainly been oriented to map some of the most advanced policies in waste prevention, in order to identify trends and common features emerging.
The study has highlighted the importance of the integration of command and control with economic incentives and MBIs. Every considered country implements a mix of different MBIs. It is important to design MBIs that are tailored on the implementation area, as there is no single solution that can be used in all countries (Rademaekers et al., 2011). The effectiveness of this kind of instrument on waste reduction is strictly related to their design phase. Hence, the authors of this article believe that PAYT schemes, taxes (and incentives) and DRS for reuse can be the most effective MBIs in terms of waste reduction. Moreover, the best option would be achieved by linking economic benefits to environmental benefits generated by a measure or a behaviour in a specific place. A life-cycle assessment might help to analyse all the environmental impacts.
On the other hand, policymakers need to be aware that some instruments inadvertently encourage dumping, thus creating a potentially more serious environmental problem than legal disposal.
A further step beyond in this field could be achieved by researching a unique definition of MSW among all EU Member States. Moreover, it is recommended that quantitative targets are provided, to protect against the risk that waste prevention and waste management are equated.
Footnotes
Appendix 1
Declaration of conflicting interests
The authors declared no potential conflicts of interest with respect to the research, authorship, and/or publication of this article.
Funding
The authors received no financial support for the research, authorship, and/or publication of this article.