
Abstract
The biodegradable portion of solid waste generated in farmhouses can be treated for energy recovery with small portable biogas plants. This action can be done across the Netherlands and all around the planet. This study aims to appraise the performance of anaerobic digestion of different wastes (cow manure, food waste and garden waste) obtained from a regional farmhouse. Batch reactors were established under mesophilic conditions in order to investigate the impact of ternary mixtures on the anaerobic digestion process performance. Different mixing ratios were set in the batch tests. The upshots from the experiments connoted that ternary digestion with cow manure:food waste:garden waste mixing ratio of 40:50:10 yielded higher biogas amount. The kinetics’ results showed quite good congruence with the experimental study. The results from the kinetic analysis appeared to be in line with the experimental one.
Introduction
Depletion of non-renewable energy sources, overpopulation, food security issues, and environmental problems have accelerated the urge for sustainable energy production (Achinas et al., 2017; Bezama and Agamuthu, 2019; Fraga et al., 2019; Hönig et al., 2019; Theuerl et al., 2019a). Research efforts focus on the bioenergy deployment from agricultural and farming waste (Manni et al., 2017; Matsakas et al., 2017; Oreggioni et al., 2017; Valenti and Porto 2019). Several treatment methods are applied to treat organic waste, with the anaerobic digestion (AD) technology having, among others, economic value in large-scale applications (Franco et al., 2019; Ghanimeh et al., 2018; Lemões et al., 2018; Maroušek et al., 2018; Nelson et al., 2017; RedCorn et al., 2018; Rosero-Henao et al., 2019). AD is considered an alternative fuel production option for bioenergy production, as it is a biochemical process that converts organic waste into valuable products (Chen, 2017a; Đurđević et al., 2019; Efferth, 2019; Hildebrandt and Bezama 2018; Makarichi et al., 2019; Ruggero et al., 2019). Biogas is an energy-carrier and its composition consists of approximately 66% CH4, 33% CO2, 0.5% N2, 0.1% O2, and 103 mg H2S (L biogas)−1 (Achinas et al., 2019; Bienert et al., 2019; Sahajwalla, 2018). Based on the application, the biogas may undergo post-treatment (upgrading) to reach the natural gas specifications (Florio et al., 2019; Macedonio and Drioli, 2017; Santos-Clotas et al., 2019; Solarte-Toro et al., 2018). The versatile use of biogas for heat and electricity generation or vehicle fuel (upgrade biogas) can underpin the drive for its application (Achinas and Achinas, 2017; Chatzikonstantinou et al., 2018; Lyng and Brekke, 2019; Wang et al., 2018). It is also implicit that use of other energy sources (e.g. wind, nuclear, shale gas) may hinder the AD competitiveness (Cook, 2017; Davis, 2018; Koçer and Özçimen, 2018; Toselli et al., 2019; Zhang et al., 2019).
Nonetheless, mighty AD applicability can be perceived from both socioeconomic and environmental standpoints. Sustainable engineering has paved the way for AD technology to be widely applied in the European Union (EU) and, thus, biogas is a key component for the transition to the bioeconomy (Chen, 2017b; Chen et al., 2018). Government subsidisation has catalysed the inexorable growth in the number of biogas plants around the globe. To date, it is crucial to sustainably improve the rural areas life by materials recovery and reduced energy consumption (Lamidi et al., 2019). The use of highly lignocellulosic waste streams may be a constraint for the applicability of AD technology owing to their recalcitrance (Achinas and Euverink, 2016; Dalmo et al., 2019; Martínez et al., 2019; Smuga-Kogut et al., 2019).
Plenty of factors collude to establish an efficient bioreactor performance correlated to process conditions and microbiome dynamics. However, the vicissitudes during the operation of the wastes-treating bioreactors have procreated interest in investigating the co-digestion technique.The co-digestion technique has been previously pointed out as an alternative option to treat two or more substrates (Alatriste-Mondragón et al., 2006; Esposito et al., 2012c; Luo et al., 2019; Rabii et al., 2019; Theuerl et al., 2019b). The carbon to nitrogen (C:N) ratio (ideal ratio ranges from 20–30) is a key player for the efficient simultaneous treatment of different substrates (Esposito et al., 2012a). Maroušek et al. (2014) reported the conventional methods of nutrient management, namely total organic carbon/total nitrogen (TOC/TN) and total carbon/total nitrogen (TC/TN), are not sufficient to be applied to the advanced phytomass residue processing.
This report enunciates the importance of the small biogas units in farmhouses for methane capturing and a sustainable waste management. The experimental study attempted to investigate the digestion of ternary wastes mixtures and their effect on the AD performance. Cow manure (CM), food waste (FW), and garden waste (GW) were chosen as substrates for the experimental test. CM has been widely used as a substrate for the biogas production. FW consists mainly of remains of eggs, nuts, vegetables, pasta, fruits and potatoes (raw or prepared), and sweets. GW contains garden clippings, cut grass, leaves, and plants. The specific milestones of this study were to (1) determine the biogas yield of the ternary mixtures, (2) examine the impact of ternary digestion on the AD performance and stability, and (3) predict biogas production using a first-order model and cone model.
Materials and methods
Inoculums and substrate
The inoculum used in this study was obtained from a long-term operating anaerobic digester from the wastewater treatment plant (WWTP) of Garmervolde in Groningen, the Netherlands. The inoculum was stored at 6°C to maintain freshness and microbial activity. It was reactivated at 37°C for 3 days prior to use. CM, FW, and GW were garnered from a farm in Groningen province, the Netherlands. The organic fraction of household FW was selected manually and ground into small particles (<10 mm). All substrates were stored in the freezer prior to digestion.
Batch tests
Biogas tests were conducted in batch mode to assess the impact of ternary mixtures on the AD performance (Esposito et al., 2012b). Laboratory glass bottles with a total volume of 500 mL (400 mL working volume) were used as anaerobic digesters. The inoculum-to-substrate ratio (ISR) was set at two based on former studies (Fabbri et al., 2014; Gunaseelan, 1995). The ratios of the ternary mixtures applied during the tests are shown in Table 1. The glass bottles were filled with the appropriate amount of microbial inoculum, substrate(s), and distilled water. All the bottles were flushed with N2 for 5 min, sealed with butyl rubbers and thereafter placed in a rotating incubator in 150 r min−1 at 36°C. Triplicate bottles were used in all experiments, and all values reported are means of triplicate ± standard deviation.
Process conditions applied in the batch tests.
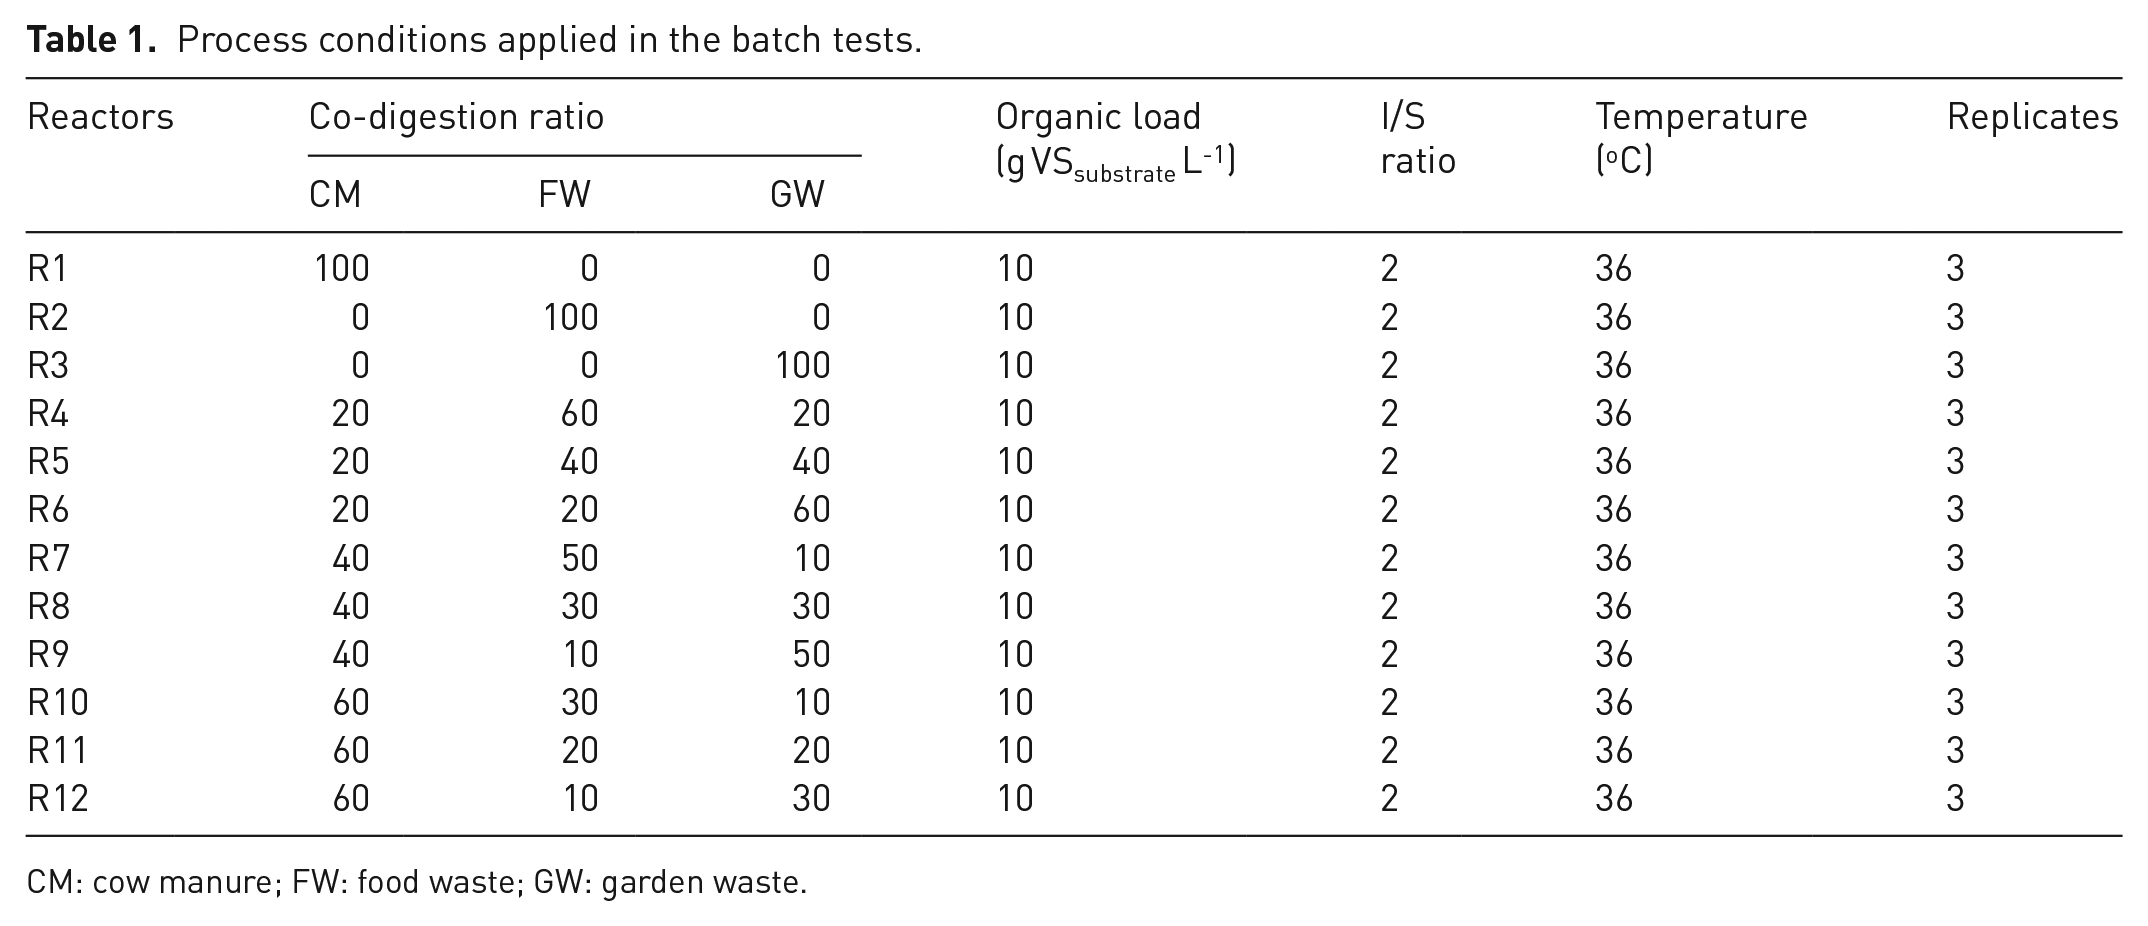
CM: cow manure; FW: food waste; GW: garden waste.
Analytical methods
Total solids (TS; g kg−1) and volatile solids (VS; g kg−1) were estimated according to the recommendations of the Standard Methods of APHA et al. (2005). PH was measured using a pH meter (HI991001, Hanna Instruments, USA). Total alkalinity (g CaCO3 L−1) was determined using the Nordmann titration method (Lossie and Pütz, 2008). The methane content was determined with a micro gas chromatography (GC) device (single channel 2-stream selector system, Thermo Fisher Scientific Inc, USA) equipped with a chromatographic column (PLOT-U). Helium was used as a carrier gas at a total flow of 10 mL min−1. A gas standard consisting of 50% (v/v) CH4, 20% (v/v) CO2, and 30% (v/v) N2 was used to calibrate the results from the micro GC device. The method used to estimate the biochemical biogas potential was based on a volumetric test, which considered the displacement of a liquid into gas to measure the biogas production (Morosini et al., 2016). The water displacement equipment used in this work was capable of providing biogas data within an accuracy of 5% (WRC, 1975).
The daily biogas volume (mL g VSsubstrate−1 day−1) was measured with the water displacement method and was standardised according to DIN 1343 (standard conditions: temperature (T) = 0°C and pressure (P) = 1.013 bar) (VDI, 2006). The biogas volume was normalised according to the equation (Dinuccio et al., 2010):
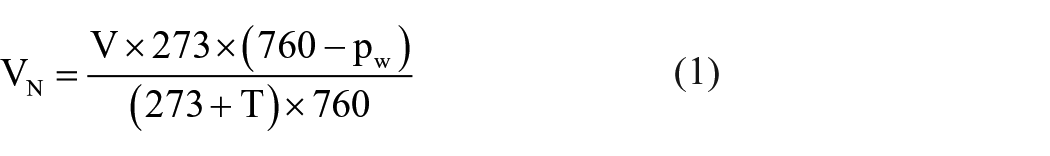
where VN is the volume of the dry biogas at standard temperature and pressure (mLN), V is the recorded volume of the biogas (mL), pw is the water vapour pressure as a function of ambient temperature (mmHg), and T is the ambient temperature (°K). The water vapour pressure (pw) was estimated according to the modified Buck equation (Buck, 1981):
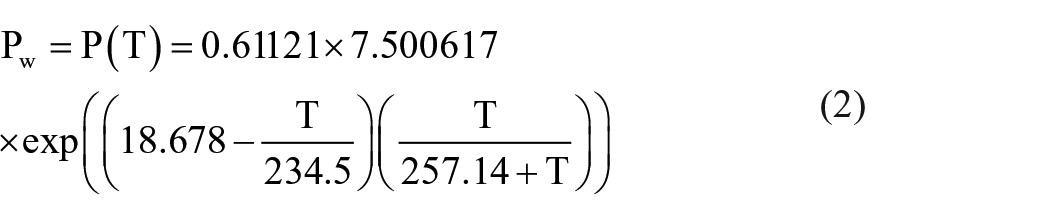
where P(T) is the vapour pressure in mmHg and T is the temperature at the ambient space (°C).
Kinetic study
The first-order kinetic model and cone model were applied for the hydrolysis of organic matter using Microsoft Office Excel (Microsoft Office 2010) and their equations are (Lay et al., 1998; Luna-del Risco et al., 2011):
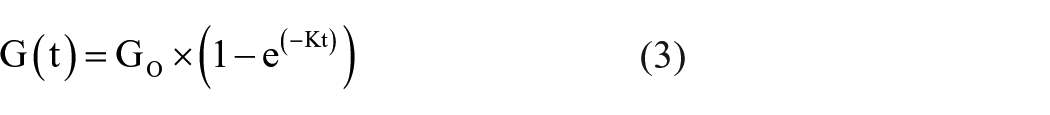
where G(t) is the cumulative biogas yield at digestion time t days (mL biogas g VSsubstrate−1),
Technical digestion time was used to apply the models and is regarded as the time needed to produce 80% of the maximal digester biogas production (Palmowski and Müller, 2000). The predicted data were plotted with the experimental biogas data. For the validation of the models, the statistical indicators root mean square error (RMSE) and correlation coefficient (R2) were calculated from the equations (Bhattarai et al., 2012):
where dj is the deviation between the jth measured and the predicted values and m is the number of data points; and
where Xj is the jth predicted value.
Statistical analysis
Statistical significance of the data was determined by one-way ANOVA using Microsoft Office Excel (Microsoft, USA) with a threshold p-value of 0.05.
Results and discussion
Characterisation of inoculum and feedstock
The characteristics of the anaerobic inoculum, CM, household FW, and GW are summarised in Table 2. All the substrates had contiguous content of total carbon, but varied in the contents of total nitrogen. Cellulose is encapsulated by hemicellulose and lignin, rendering a complex release of sugars. The recalcitrant nature of lignin hampers the deconstruction of the substrate. In addition, the high content of lignin elongates the digestion time and concomitantly results in lower biogas yields. It was anticipated that GW will show lignin values (31.4%) as it contains woody components and the upshot was similar to that in previous studies. CM also showed similar lignin content (12.6%) compared with that formerly cited.
Physical and chemical characteristics of the inoculums and substrates used in the batch tests.
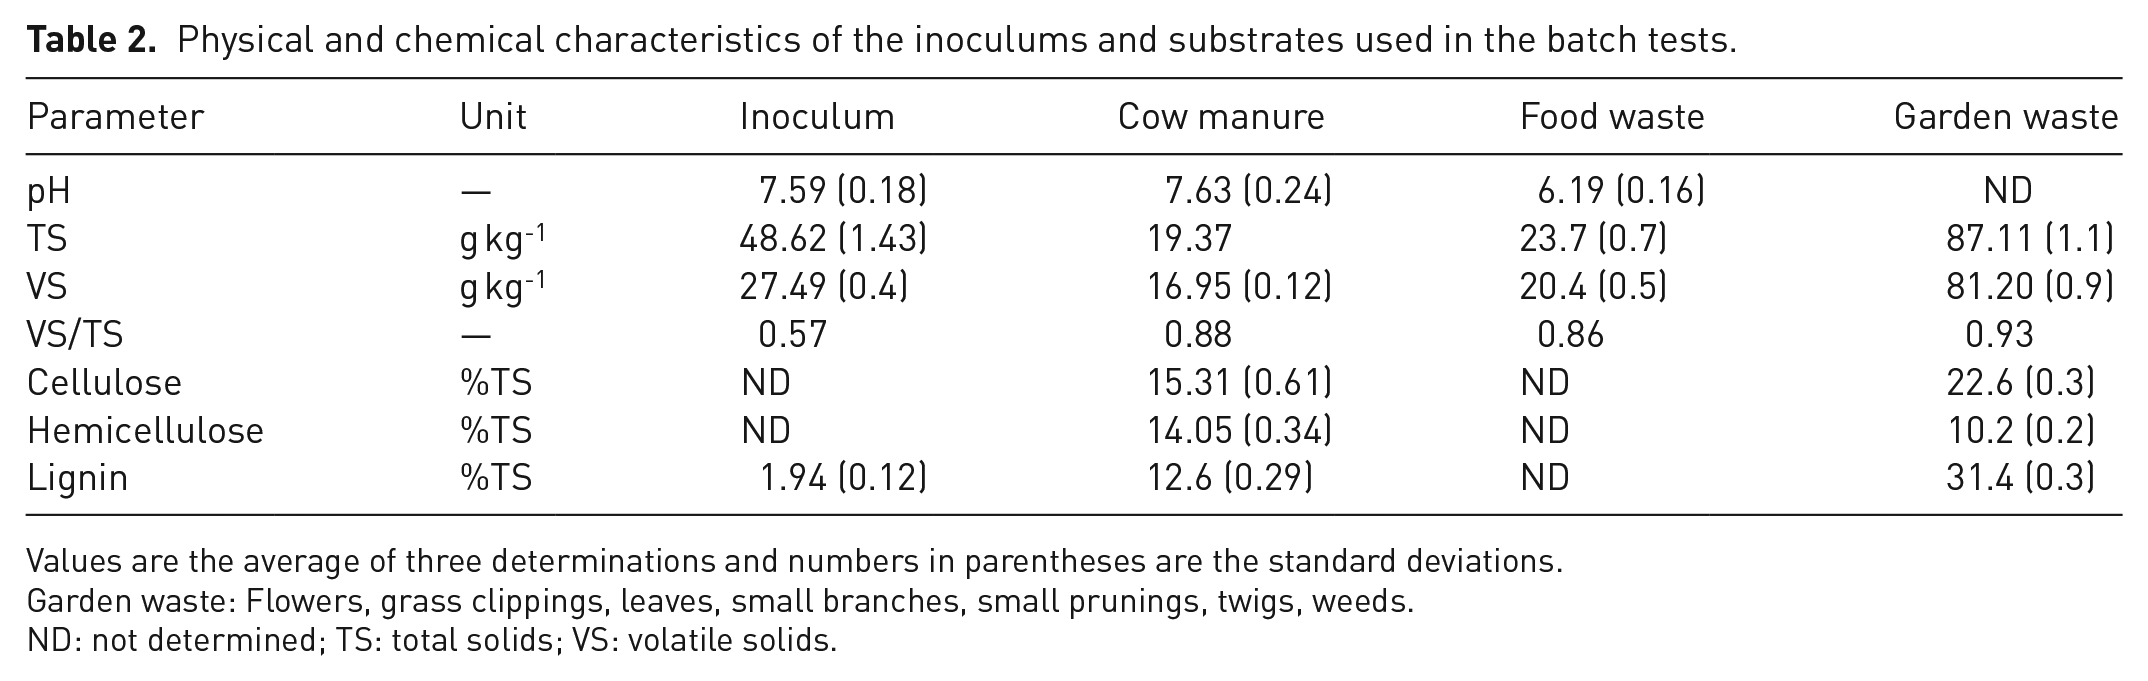
Values are the average of three determinations and numbers in parentheses are the standard deviations.
Garden waste: Flowers, grass clippings, leaves, small branches, small prunings, twigs, weeds.
ND: not determined; TS: total solids; VS: volatile solids.
Daily biogas production
During the AD of the individual substrates, R1 and R3, with 100% CM and GW, respectively, began to produce ⩾10 mL g VSsubstrate−1 day−1 on the third and sixth day, respectively (Figure 1). Low hydrolytic performance was observed owing to the presence of lignin and its derivatives. The highest daily biogas production rates for R1 and R3 were 15.5 and 12.7 mL g VSsubstrate−1 on the seventh day, respectively. The reactor with 100% FW (R2) began rapidly to produce a high amount of biogas reaching 55.1 mL g VSsubstrate−1 on day three. It remained for the first eight days in the range of 28.1–55.1 mL g VSsubstrate−1 day−1 and afterwards gradually declined to a lower level until the biogas production dropped to zero on day 25.
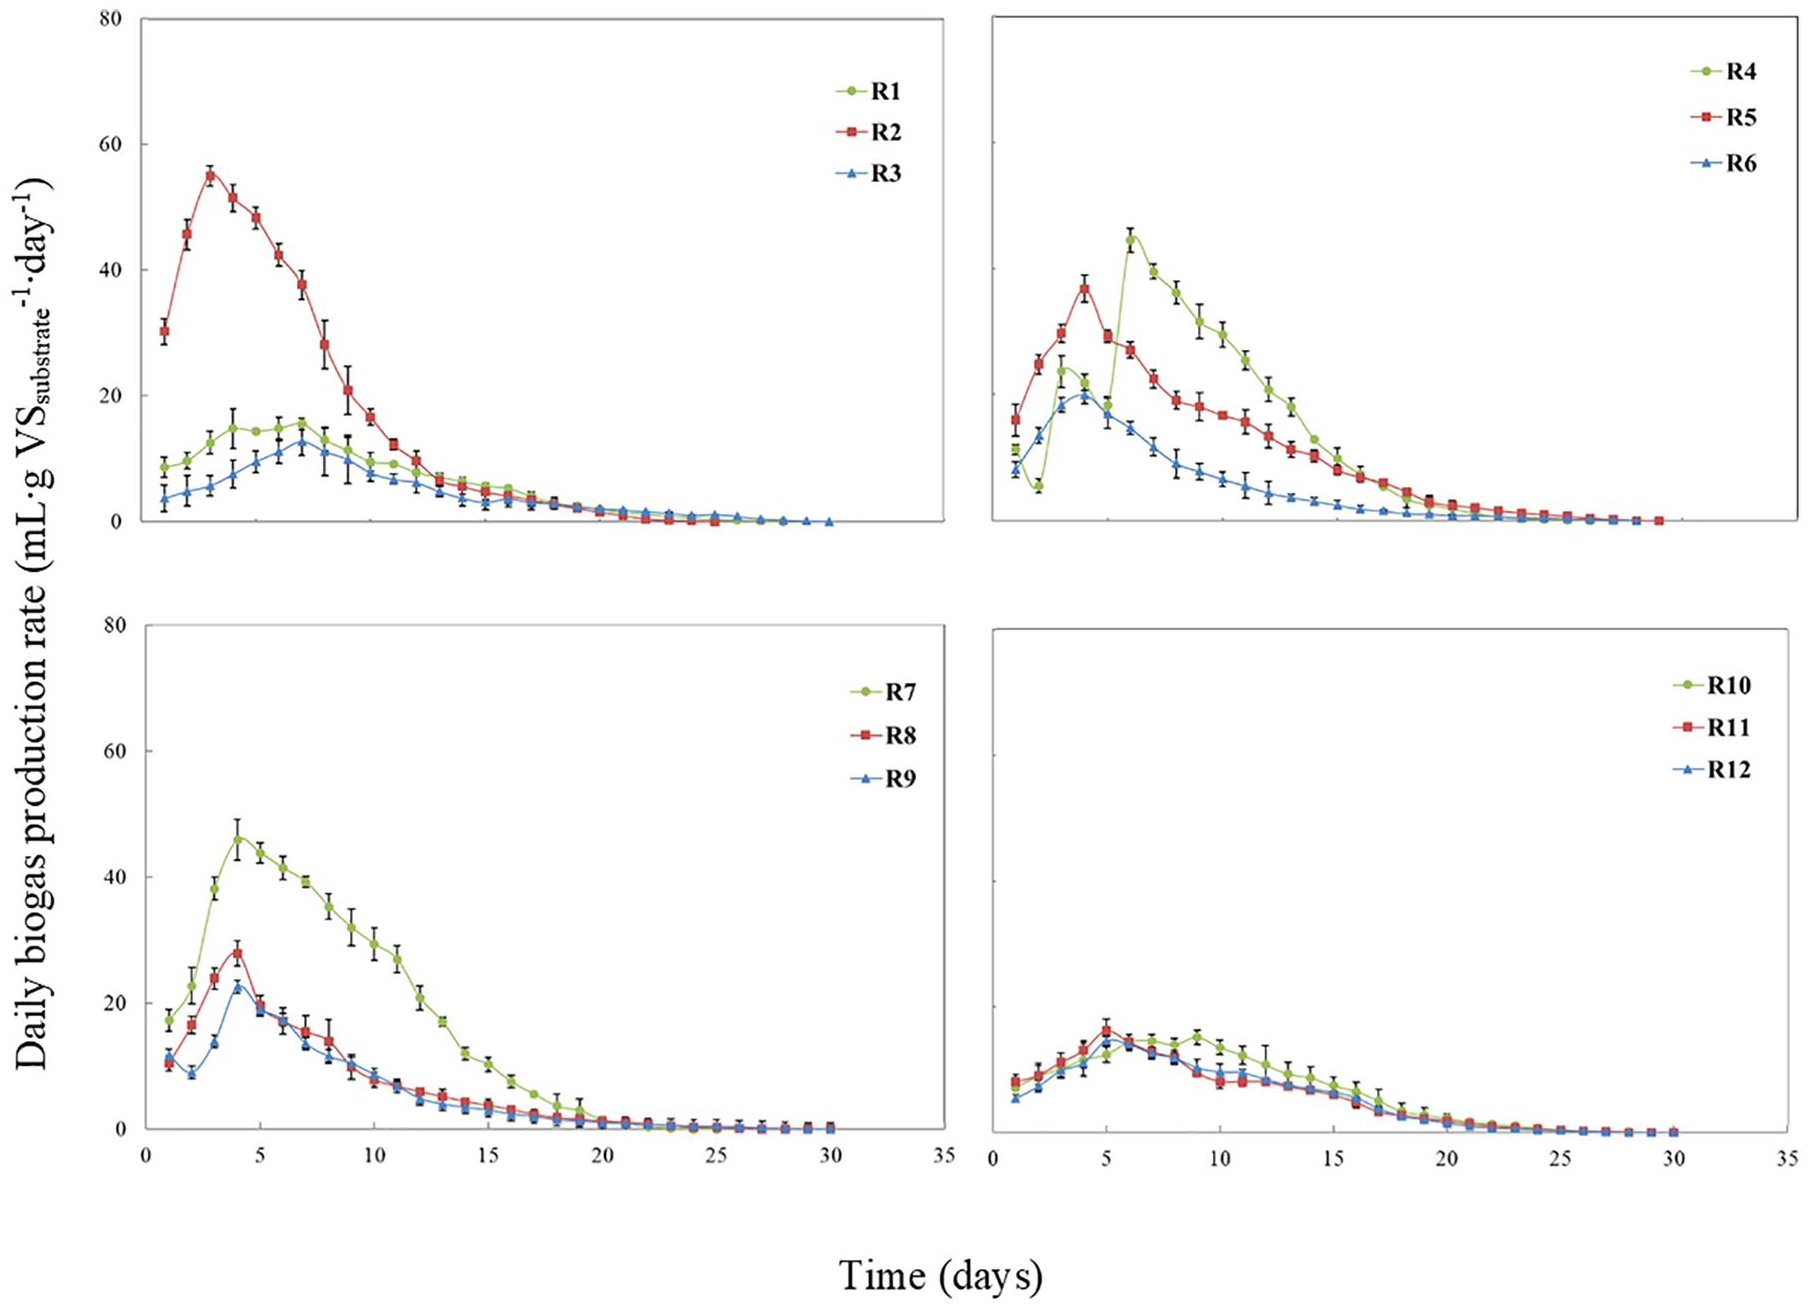
Daily biogas production for the mono-digestion (R1→3) and co-digestion (R4→12) tests.
Rapid biogas production began in the reactors treating ternary mixtures (Figure 1) even though it did not show any clear dependence on the substrate mixing ratio. The reactors containing 20% CM (R4→6) reached the maximum daily biogas production rate of 44.5, 36.8, and 20.0 mL g VSsubstrate−1 on days six, four, and four, respectively. The treatments with 40% CM (R7→9) showed similar trend reaching 45.9, 27.9, and 22.6 mL g VSsubstrate−1 on the fourth day of the digestion period. In contrast, the maximum daily biogas derived from the reactors (R10→12) containing 60% CM was 14.6, 16.2, and 14.6 mL g VSsubstrate−1, respectively. The daily biogas amount remained above 10 mL g VSsubstrate−1 for the first ten days and thereafter dropped to a lower level (<6 mL g VSsubstrate−1 day−1). The overall performance was at low ebb due to fast hydrolysis and the subsequent volatile fatty acids (VFAs) acidification that inhibits the methanogenic activities.
Cumulative biogas production
The cumulative biogas and methane yield from all the treatments are displayed in Figure 2 and Figure S1. From the mono-digestion, the highest cumulative biogas yield was obtained from the reactor treating 100% FW (429.9 mL g VSsubstrate−1), which was 2.4- and 3.3-fold higher than those reactors treating 100% CM and GW, respectively (Table S1). FW is a promising organic substrate in the AD owing to its easily digestible containing material. Nevertheless, the digestion of FW as sole substrate can induce the accumulation of VFAs or ammonia and thereupon lead to bioreactor instability. The reactor operation treating 100% GW may be interrupted owing to the high lignin content and a low cumulative biogas yield of 129.8 mL g VSsubstrate−1 was observed (Figure S2). Chiumenti et al. (2018) reported lower biogas yields from the treatment of high lignin-based waste. The use of CM as sole feedstock resulted in low biogas yield (180.8 mL g VSsubstrate−1) and is within the range that has been formerly cited.
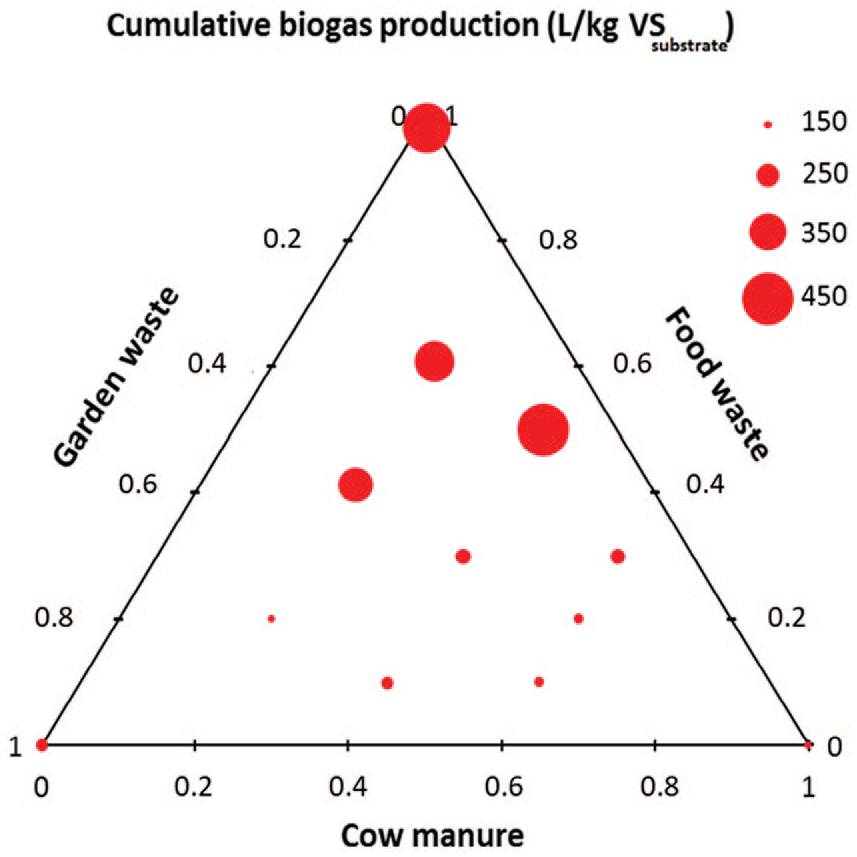
The cumulative biogas yields of the ternary mixtures were also varied with the ratios of three substrates. Treatments with 20% CM (R4→6) reached biogas yields of 371.9, 329.5, and 155.8 mL g VSsubstrate−1 (Figure S2). The increment of the fraction of GW attenuated the degradation showing a decline on the biogas yield. One contingent reason for the lower biogas production yield could be the hardly degradable lignocellulosic material contained in the GW. Among all ternary mixtures, the highest biogas production yield was obtained from the mixture with 40% CM, 50% FW, and 10% GW, which was 2.5-, 1.1-, and 3.5-fold higher compared with digestion of CM, FW, and GW, respectively (Table S-1). Animal manures have a high alkaline capacity, which turns them into suitable substrates for AD. Most notably, CM might reinforce the degradation activity of FW as it has active archaea endowed with an excellent capacity to produce biogas. A preceding study states that cow dung is superior to sheep manure as a microbial inoculum to produce biogas (Achinas et al., 2018).
Leung and Wang (2016), by reviewing the anaerobic treatment of FW, claimed that biogas generation can significantly depend on the process parameters of the bioreactors and this is ascribed to the complex biodegradability of FW. Masourek (2013, 2014) examined the two-fraction anaerobic fermentation of grass waste allowing faster and cost-efficient fermentation into methane. Furthermore, blending FW and CM is an economically viable approach as it allows the digestion of high organic loads (Li et al., 2009). The low C/N ratio of FW can inhibit the AD and lead the digester to a ‘sour’ situation. In the microbiome level, numerous challenges may induce changes in bioreactor behaviour, as it is construed by the physiological and biochemical interactions of microorganisms within the bioreactor. Former scientific reports refer ammonia being the principal reason of digester inhibition as it penetrates the bacterial cells causing proton imbalance, altering intercellular pH, and inhibiting specific enzyme responses. Thus, co-digestion with different waste is an efficient technique to balance the C/N ratio in the digester and avoid resurgence of NH3.
Another type of common co-substrate for FW is the lignocellulosic waste with a high C/N ratio and relatively high recalcitrance, for example yard waste and straw. This kind of feedstock can supplement the necessary amount of carbon for the nitrogen-rich FW and help to overcome the rapid acidification in AD using FW as the sole feedstock.
pH, alkalinity, and VS removal
Figure 3 depicts the pH values at the beginning and end of the experiments. The pH values ranged from 6.98 to 7.55, rendering a suitable environment for the substrate degradation. Reactors resulted in a final pH lower than the starting pH with the reactor treating only FW reaching a final pH 6.98. AD is efficiently facilitated in a pH range 6.8–7.4. However, the range of 5.5–6.5 is more favourable for the activity of hydrolytic and acidogenic bacteria. The pH of the bioreactor is a critical factor for the decomposition of the anaerobic digester as it may cause perturbations on the microbiome dynamics and the subsequent metabolomic pathways (Carotenuto et al., 2016). Microbial activity is inhibited when the microbiome is exposed to low pH values, which impedes the digester operation. Although bacteria under anaerobic conditions thrive in a broad range of pH, methanogens are notably sensitive in lower pH values. As a result, elevated concentration of VFAs subdues the methanogenic reactions, a fact that creates a deficit in methane (Anggarini et al., 2015).
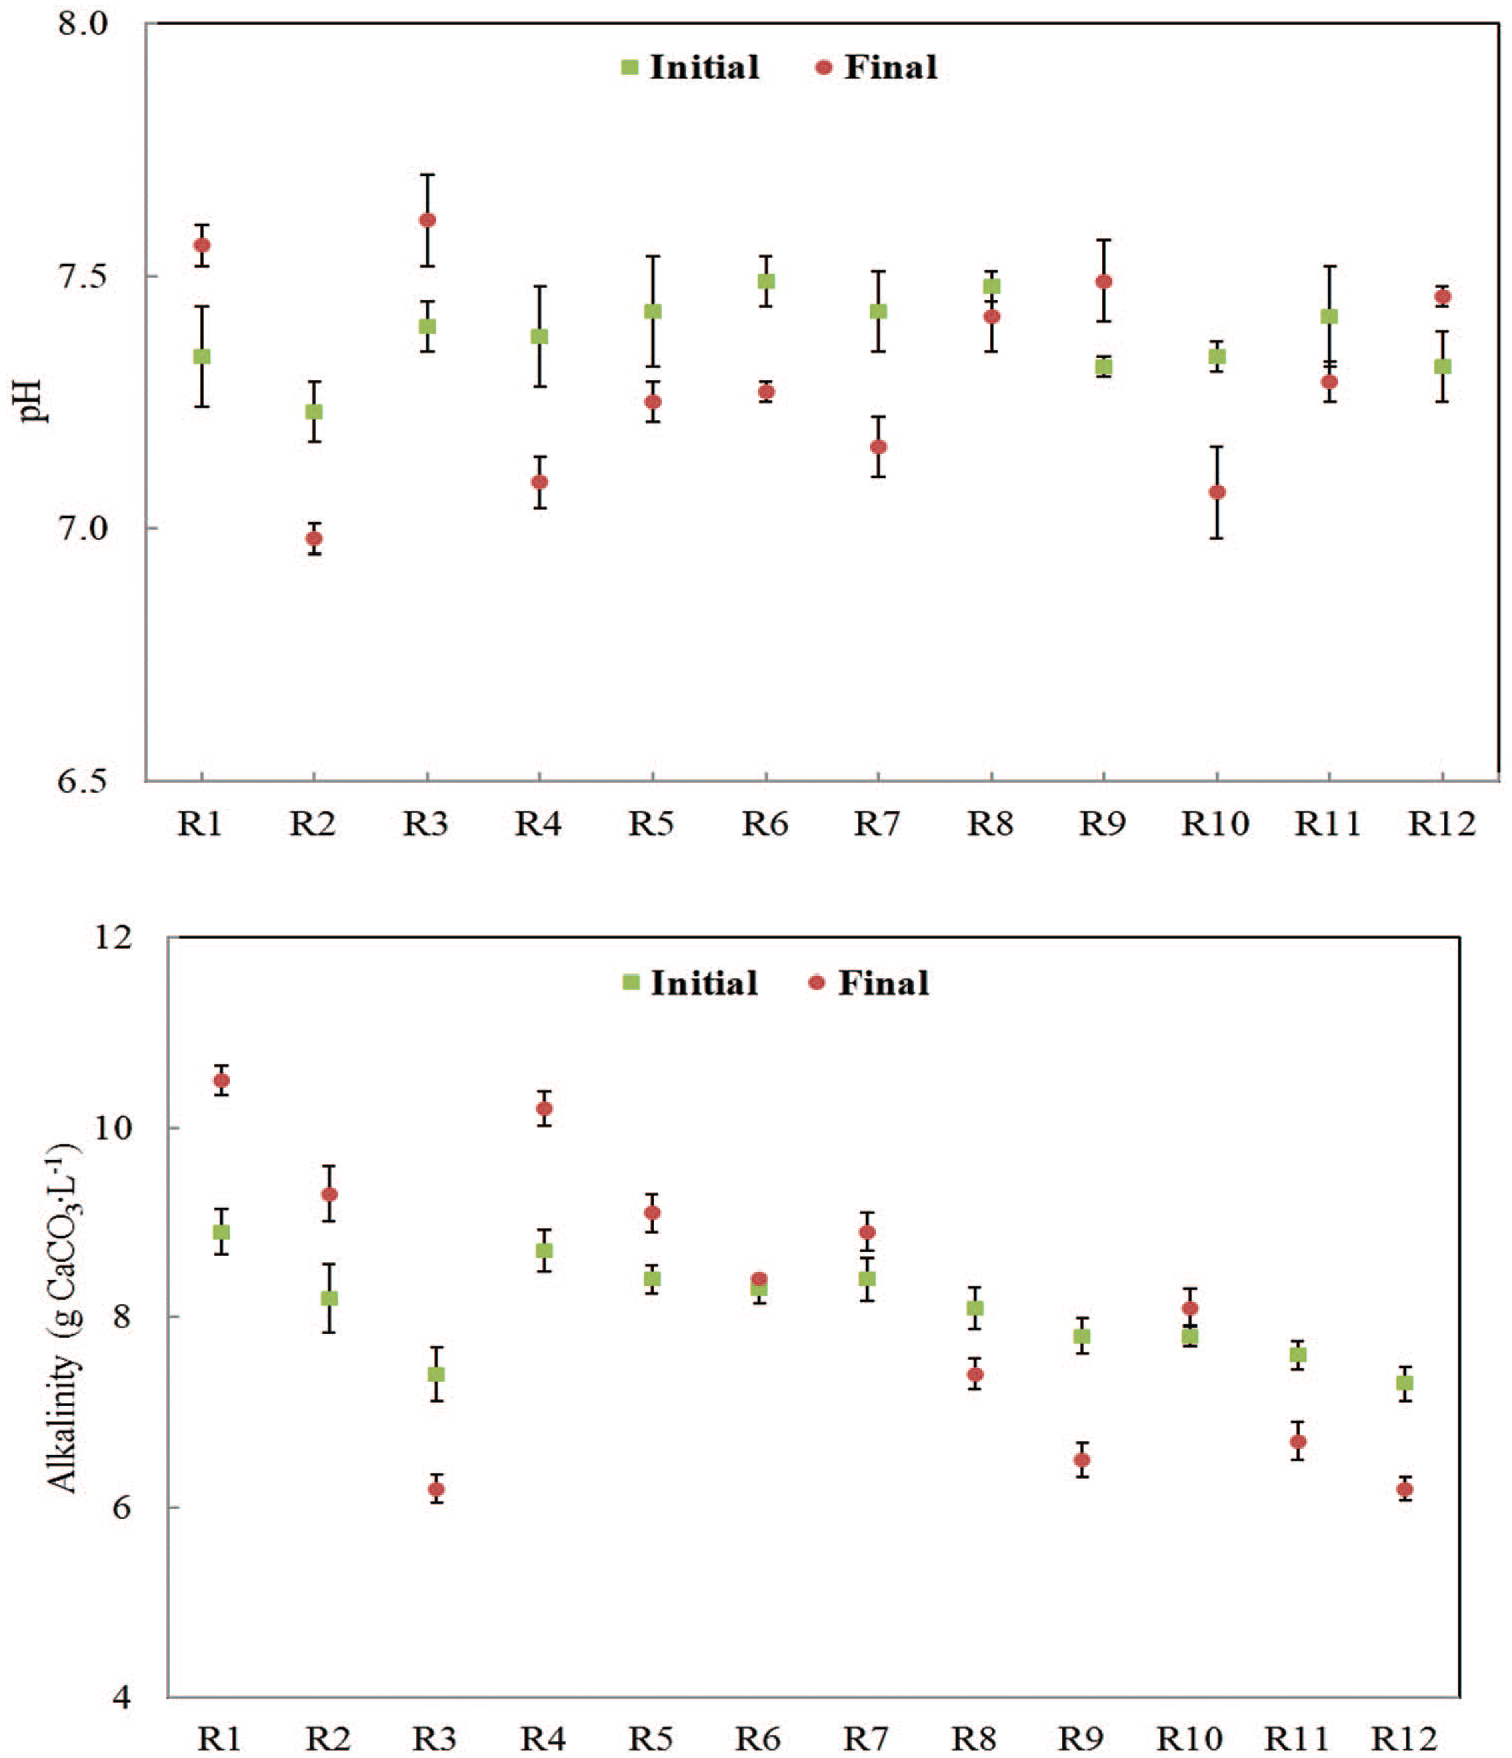
pH and alkalinity for the mono-digestion (R1→3) and co-digestion (R4→12) tests.
The microorganisms are also nifty at their tolerance in alkalinity of the bioreactor. Buffer capacity, the so-called alkalinity, is a parameter to evaluate the stability of anaerobic digesters (Cheng et al., 2016). The total alkalinity of the bioreactors at the beginning and end of the experiments is shown in Figure 3. In all the experimental sets, the ISR was set two, as this is considered optimal for maintaining buffering capacity. No extra alkalinity was added in this study as it was provided by the inoculum. Inoculum use is levied on the AD process as it can supply nutrients and alkalinity subduing, and therefore overcome the drawbacks of the digestion of hardly degradable materials. Franchi et al. insinuate that the choice of inoculum source must be nifty at its physiological interaction with the microbiomes within the digester (Franchi et al., 2018).
Gupta et al. (2012) ascertained the influential effect of different sources of microbial inoculum on the digestion of GW and the prevention from unavoidable disturbances. They concluded that paddy-field soil can enhance the biogas production compared with that using cow-dung, mine water, or termite guts as inoculums. The upshots of alkalinity showed a similar pattern with the one of pH. The pH decrease is offset by the elevated alkalinity from the presence of bicarbonate, carbon dioxide, and ammonia.
The determination of VS removal aimed to examine the degradation efficiency and correspondence with the biogas produced. The calculated VS removal of all reactors is appended in Table S1. R6 showed the highest VS degradation rate of 48.2% following by R4 and R5 with degradation rates of 45.4% and 44.0%, respectively. Oligomer solubility is a crucial regulator of the hemicellulose hydrolysis rate (Gray et al., 2003).
Battista et al. (2015) scaled-up the co-digestion of agro-food wastes and explored the effect of inhibitory substance-containing feedstocks in the bioreactor’s efficiency. They elucidated the importance of macro-elements (e.g. nitrogen, phosphorus) on the microbial growth. From another aspect, the functional relationship of cumulative biogas yield and VS% removal was plotted in Figure 4. A curve regression equation was established (Y = −0.0003X2 + 0.176X + 15.632, R2 = 0.2666) and as anticipated, cumulative biogas yield pursued the same incremental tendency as the VS removal.
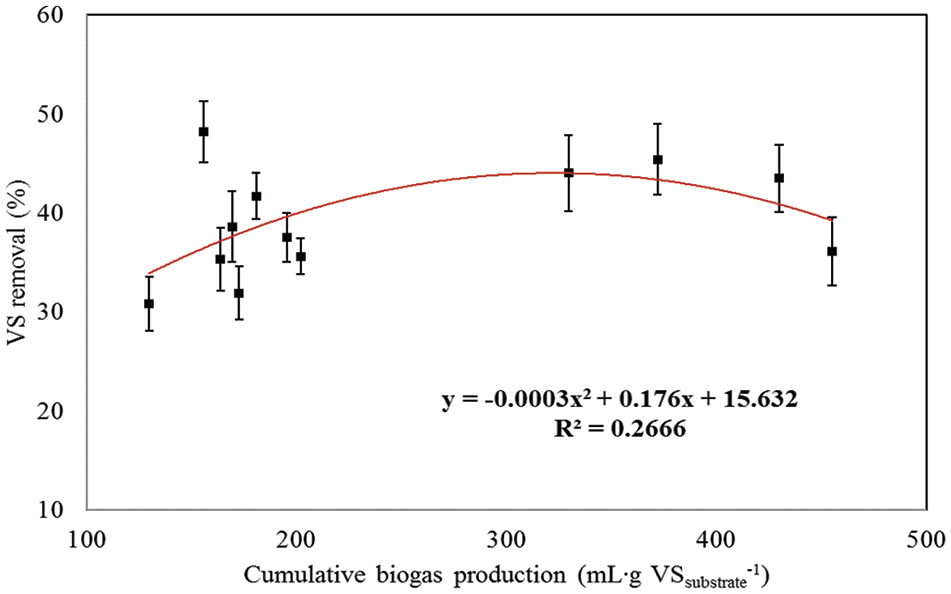
Correlation of biogas produced per gram of volatile solids (VS) and percentage of VS removal for all the experiments.
Kinetics results
The kinetic parameters obtained by applying the first-order and cone model are epitomised in Table 3, which evinces the picture of the kinetics. To ratify the soundness of the results from both models, the predicted values of biogas were plotted against the measured values (Figure S3). Both models were found to show good fitting with the experimental results. It is notable that the difference between the measured and predicted values of both models was less than 5% for all the reactors.
Results of the kinetic study using the first-order and cone model.
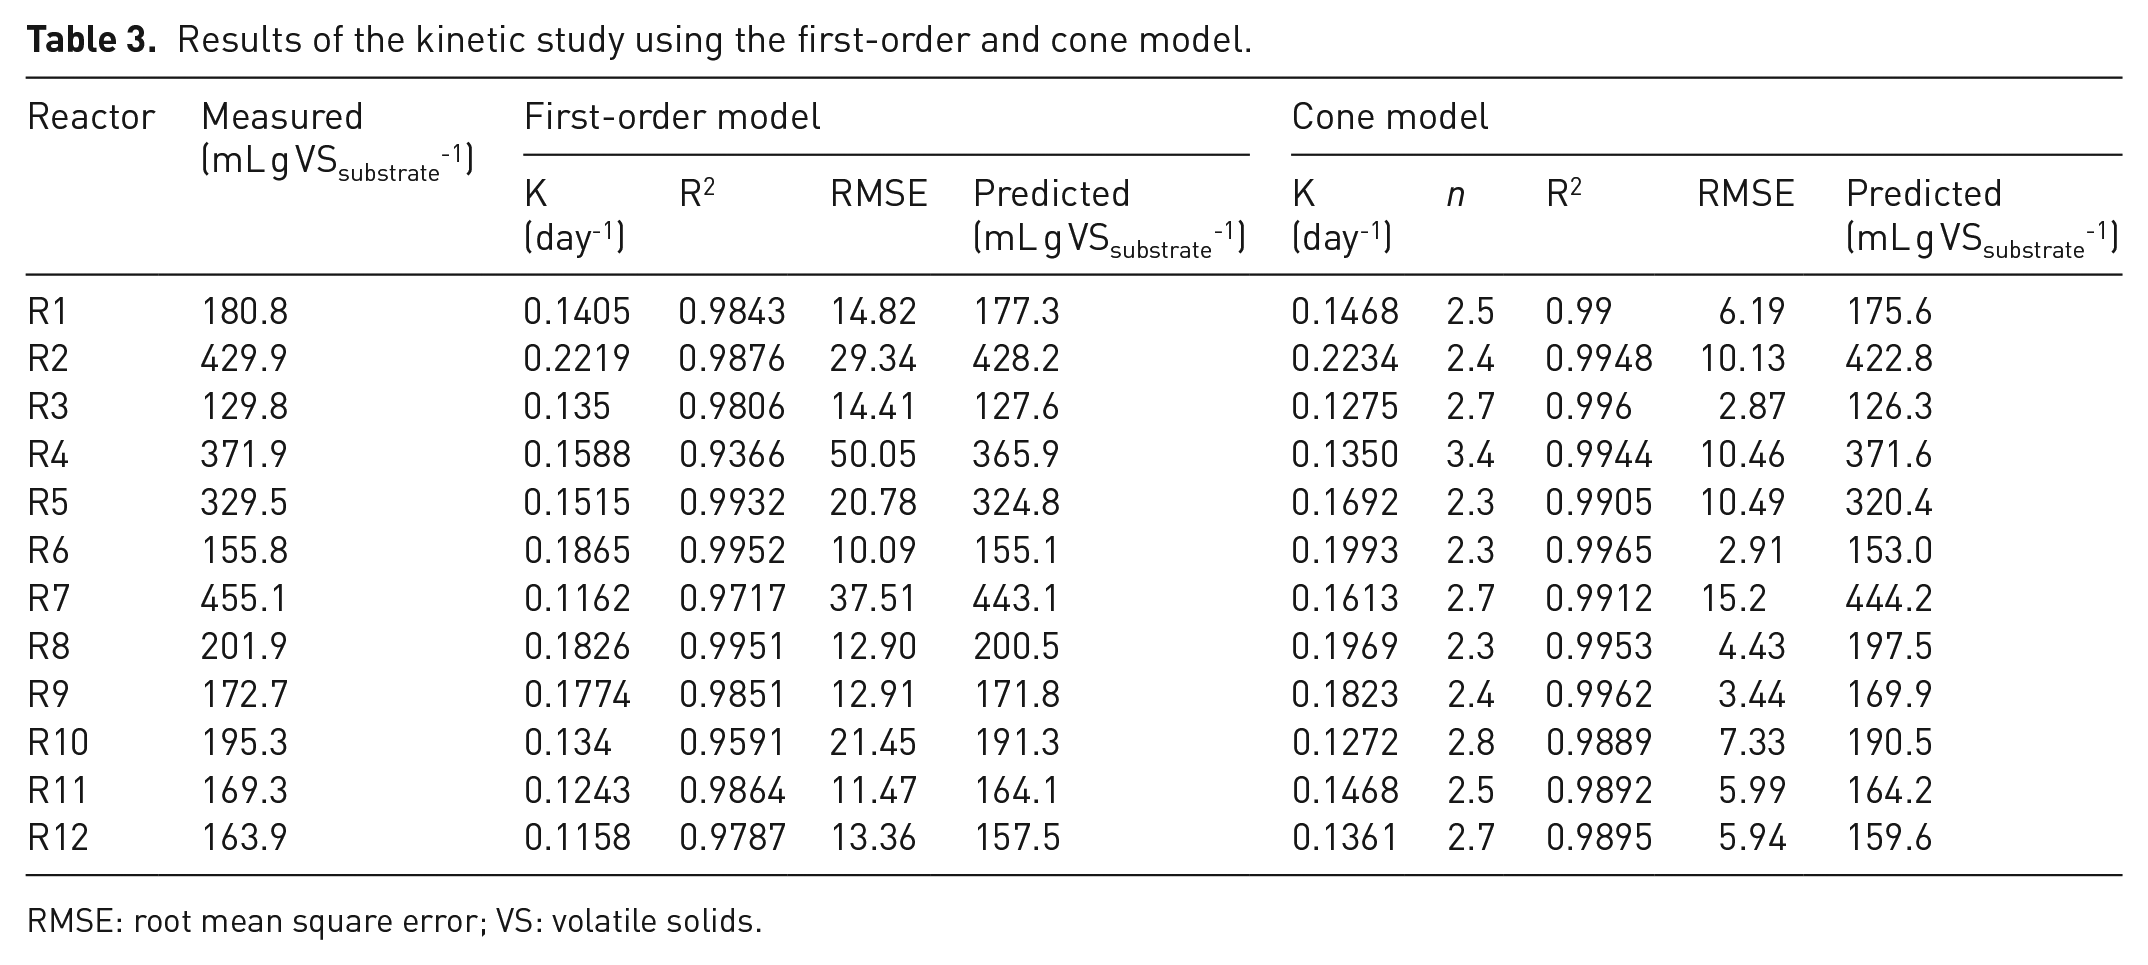
RMSE: root mean square error; VS: volatile solids.
Reactors treating only FW (R2 in both models) showed the highest hydrolysis rate with 0.2219 (R2 = 0.9876) and 0.2234 (R2 = 0.9948) in the first-order and cone model, respectively. One possible reason for the improved hydrolysis of the substrate is the easily digestible material contained in FW. Lower biogas yields appear owing to the inhibited methanogens growth from the rapid FW acidification resulting in a slow methanogenesis rate. Even though R7 showed low hydrolysis rates, microbial interactions from inoculum and manure might favour overall degradation performance.
Recommendations
Broadly speaking, research efforts provide insights into the technological barriers for sustainable transition to bioeconomy (Chen, 2016; Lauer and Thrän, 2018; Lindkvist et al., 2019). AD is regarded as an ecological approach for energy recovery in rural areas and the production of valuable products from organic waste can ameliorate the agricultural economy (Llewellyn, 2018). The versatile use of biogas as well as the production of valuable bio-fertiliser will play a key role in the agricultural chain. However, there are ambiguous facets not clearly investigated, namely the case of multiple waste streams, microbiome, or end-products (Baek et al., 2018; Éles et al., 2019; Huang et al., 2017; Koç et al., 2019; Owczuk et al., 2019; Xu et al., 2017).
Figure 2 limns the overall view of the AD upshots from the experimental tests. A wide consortium of microorganisms is involved in the mesophilic AD process, thus, mesophilic temperatures have been predicated more suitable for efficient biogas production than the thermophilic temperatures (Guo et al., 2018; Önen et al., 2019; Shin et al., 2019). The partial addition of FW and GW represents an efficient pathway for farm-scale digesters. Treating ternary mixtures can have significant impact on the adoption of AD technique owing to the incremental availability of wastes. The type of animal slurries is also crucial for the stability of the anaerobic bioreactors. According to Świątek et al. (2019), the bioreactor intaking with chicken manure has changed its microbiome. Considering the above inferences, the mesophilic co-digestion of ternary mixtures represents a promising solution to alleviate inhibitors of digesters and attain a high biogas yield. Begum et al. (2018) facilitated high-rate co-digestion of mixed organic wastes and reported positive ramification on the biogas yield. A techno-economic evaluation of pilot AD in continuous mode would be interesting in order to assess other factors than the mixing ratio for full-scale applications (Achinas and Euverink, 2019; Baccioli et al., 2019; Benato and Macor, 2019; Carlini et al., 2017; De Medina-Salas et al., 2019). In addition, we recommend an in-depth analysis of microbiome heterogeneity to assess the activity discrepancies between microbial communities. Alongside this, molecular tools can unveil the microbiomes–process conditions nexus in order to optimise the anaerobic digester operation and avoid pertubations that occur in full-scale.
Conclusion
This study explored the AD of three different waste streams and suggests an optimal mixing ratio for an efficient biogas production. Three different waste streams and their ternary mixtures were anaerobically treated in batch mode. The treatment of ternary mixtures showed positive impact on the AD performance. The results from the experimental tests revealed that ternary digestion with a CM:FW:GW mixing ratio of 40:50:10 yielded a higher biogas amount than that of the mono-digestion of FW. The high recalcitrance of CM and GW can be overcome by the addition of FW. In addition, small biogas units can be considered a beneficial option for farmhouse owners to convert bio-degradable waste into biogas and feriliser. Furthermore, the kinetics models fitted well with the experimental data enhancing the applicability of ternary digestion.
Supplemental Material
Supplementary_material – Supplemental material for Elevated biogas production from the anaerobic co-digestion of farmhouse waste: Insight into the process performance and kinetics
Supplemental material, Supplementary_material for Elevated biogas production from the anaerobic co-digestion of farmhouse waste: Insight into the process performance and kinetics by Spyridon Achinas and Gerrit Jan Willem Euverink in Waste Management & Research
Footnotes
Declaration of conflicting interests
The author(s) declared no potential conflicts of interest with respect to the research, authorship, and/or publication of this article.
Funding
The author(s) received no financial support for the research, authorship, and/or publication of this article.
Supplemental material
Supplemental material for this article is available online.
References
Supplementary Material
Please find the following supplemental material available below.
For Open Access articles published under a Creative Commons License, all supplemental material carries the same license as the article it is associated with.
For non-Open Access articles published, all supplemental material carries a non-exclusive license, and permission requests for re-use of supplemental material or any part of supplemental material shall be sent directly to the copyright owner as specified in the copyright notice associated with the article.