
Abstract
The market for products containing engineered nanomaterial (ENM) is constantly expanding. At the end of their lifecycle, a significant fraction of the products will be disposed as ENM-containing waste in thermal treatment plants. Up to now there are still uncertainties on the fate and behaviour of ENM during waste incineration. In our investigations, nano titanium dioxide (nTiO2) was selected as an example for ENM, because of its high amount in consumer products and its relevance to the ENM-containing waste stream. Two test series were conducted at the municipal solid waste incineration plant “Gemeinschaftskraftwerk Schweinfurt”. For each test series, background concentrations of titanium were measured first. Samples of bottom ash, bottom ash extractor water, fly ash (boiler ash, cyclone ash), flue gas cleaning products (spray absorber ash, fabric filter ash) and washing water from the wet scrubber were taken in order to determine the fate of nTiO2. The flue gas was sampled at three points: after boiler, after cyclone and before stack. The experiments showed that most of the used reference material was located in the solid residues (i.e. bottom ash) while a smaller part was detected in the products of the flue gas cleaning. In the purified flue gas before the stack, the concentration was negligible. The flue gas cleaning system at the Gemeinschaftskraftwerk Schweinfurt complies with the requirements of the best available techniques and the results cannot be transferred to plants with lower standards.
Keywords
Introduction
Nanotechnology is considered to be one of the six key enabling technologies for Europe (EC, 2011c). A further increase of products containing engineered nanomaterial (ENM) on the market is to be expected. As ENMs are designed for a specific purpose or function their applications extend to various fields and products (OECD, 2016). At the end of their lifecycle, parts of the products will be disposed as ENM-containing waste in waste pretreatment as well as in recycling processes but mainly in thermal treatment plants (Part et al., 2018). Sewage sludge and waste containing nanomaterial are considered to be the main sources for an input of ENMs in this disposal path (Börner et al., 2016). The knowledge about the behaviour and fate of ENMs during combustion in municipal solid waste incineration (MSWI) plants is still limited (OECD, 2016). Initial investigations regarding the fate and behaviour of ENM (nano cerium dioxide (nCeO2) and nano barium sulfate (nBaSO4)) in large-scale plants were carried out by Walser et al. (2012), Lang et al. (2015) and Baran and Quicker (2016). Table 1 contains detailed information regarding the executed trials.
Comparison of ENM fate during waste incineration in large-scale plants.
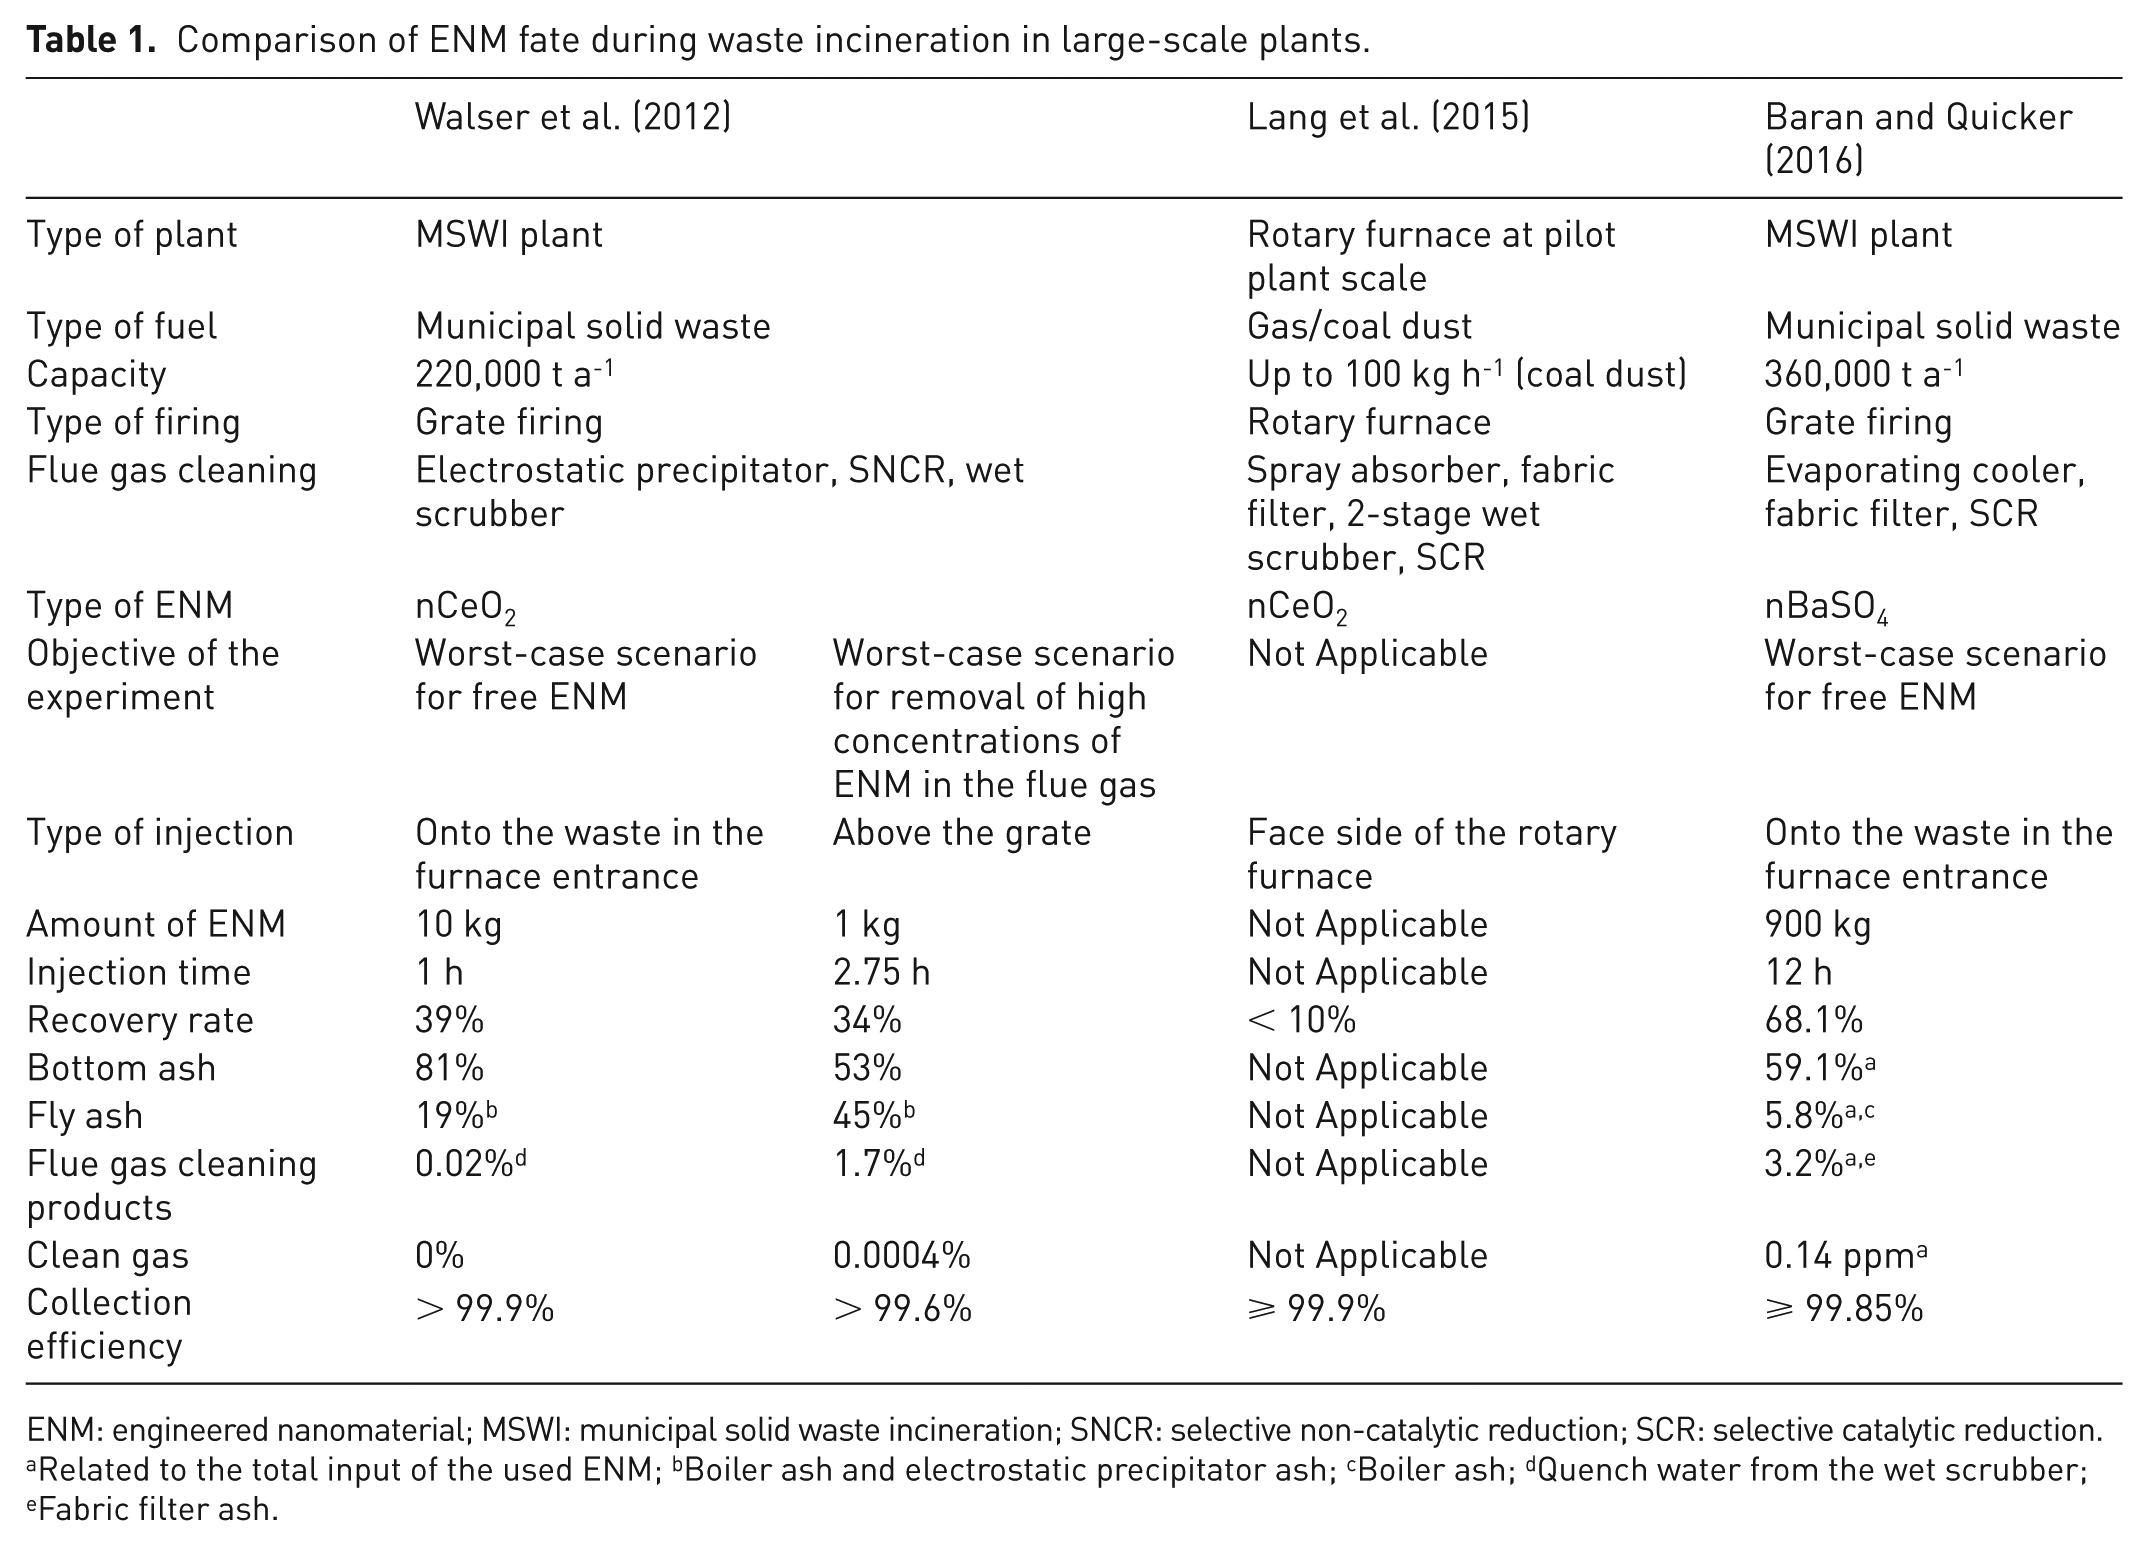
ENM: engineered nanomaterial; MSWI: municipal solid waste incineration; SNCR: selective non-catalytic reduction; SCR: selective catalytic reduction.
Related to the total input of the used ENM; bBoiler ash and electrostatic precipitator ash; cBoiler ash; dQuench water from the wet scrubber; eFabric filter ash.
It was indicated that most of the used ENMs in the combustion experiments were located in the solid residues (i.e. bottom ash) while a smaller part was detected in the products of the flue gas cleaning. In the purified flue gas before the stack, the concentrations were negligible. For two different ENM (nCeO2 and nBaSO4) a similar tendency for the fate and behaviour during waste incineration was observed. Whether this is valid for other ENM was and is unclear (Part et al., 2018). Therefore, as part of the research project “Assessment of the emission behaviour of nanomaterial-containing waste in thermal treatment plants” funded by the German Federal Environment Agency, we investigated the fate of nano titanium dioxide (nTiO2) during thermal waste treatment. One main objective of the project was to investigate whether emissions of ENM by the clean gas are to be expected or not. For the investigations, nTiO2 was selected as an example for ENM, due to its high amount in consumer products and its relevance to the ENM-containing waste stream (Keller and Lazareva, 2014). Based on investigations in a small heating system in our technical centre, we examined possible emission pathways of nTiO2 during incineration in a MSWI plant and in a sewage sludge incinerator (Börner et al., 2016; Vogel et al., 2016). This paper presents the experiments in the waste incineration plant.
State of the art
Titanium dioxide exists in two technical relevant modifications: rutile and anatase, whereby anatase undergoes a phase transformation to the more thermodynamically stable rutile at temperature of about 915°C (Winkler and Zorll, 2003). Lower temperatures are also reported in literature for the onset of the transformation ranging from 390°C to 720°C depending on various factors (Hanaor and Sorrell, 2011). Vejerano et al. (2014) observed a phase transition from anatase to rutile after the combustion of waste containing nTiO2 in their laboratory experiments. Massari et al. (2014) reported a reaction of nTiO2 to calcium titanate during the incineration of solid paint wastes containing nTiO2 in their lab scales tests. Winkler and Zorll (2003) specify a value between 1830°C and 1850°C for the melting point for rutile. Sintering of nTiO2 particles at temperatures between 450°C and 500°C for 30–60 min for dye-sensitized solar cells (DSSC) is reported in literature (Jung and Kim, 2010). The depicted emissions paths for nCeO2 and nBaSO4 during waste incineration in large-scale plants (Baran and Quicker, 2016; Walser et al., 2012) are comparable to the findings in lab-scale experiments with nTiO2 (Börner et al., 2016; Massari et al., 2014; Vejerano et al., 2014). According to Börner et al. (2016), the form of addition of nTiO2 (in the matrix, superficially applied, as master batch) had minor influences on the results of the lab-scale combustion experiments. The application of nTiO2 in terms of flame retardant is reported in literature (Aziz and Ahmad, 2016; Lam et al., 2011). Whether these sophisticated coatings play an important role in the ENM-containing waste stream and if they may behave differently during waste incineration compared with our examined nTiO2 (superficially applied) has not been part of scientific research so far to our knowledge. Some information regarding the behaviour of ENM, especially nTiO2 in the flue gas, can be found in literature. Mueller et al. (2013) assumes that under the prevailing temperature ratios in combustion chambers, evaporation (boiling point of nTiO2: 2900°C) and recondensation of nTiO2 particles is considered to be unlikely. Thermophoresis (movement of particles in a fluid due to a temperature gradient) in aerosols is an important transport mechanism which extends from microparticles (Zheng, 2002) to nanoparticles (Mädler and Friedlander, 2007) and even is observed during waste incineration (Lang et al., 2015). Transport of nTiO2 by thermophoresis is also observed in literature: Djenadic and Winterer (2012) used a thermophoretic particle collector to collect nTiO2 particles produced by chemical vapor synthesis. Based on modelling and lab-scale experiments on the fate and behaviour of airborne nanoparticles along the flue gas path, Förster et al. (2016) identified two competing processes (self-aggregation and diffusion scavenging). During a process-related cooling of hot flue gases, for example after the combustion chamber nanoparticles undergo Brownian collision and adhere to fly ash particles (scavenging), resulting in an increased removal efficiency of nanoparticles. Addition of fly ash or injection of additives could be a possibility to avoid self-aggregation and therefore favour scavenging especially during cleaning of the bag filter by reverse jet pulse cleaning. The authors argue that a sufficient thick dust layer resulting in a pressure drop of 500 Pa across the fibrous media at a face velocity of 2 m min-1 prevents penetration of nanoparticles and therefore emission of nanoparticles is hardly to be expected (Förster et al., 2016; Part et al., 2018).
Material and methods
In the experiments, the product Hombikat UV 100 WP from the company Sachtleben was deployed. Hombikat UV 100 WP is an aqueous suspension with a concentration of about 50% of nTiO2 and about 6.5% of poly acrylate used as stabilizer. The employed nTiO2 powder in the formulation of the suspension is the product Hombikat UV 100, which has a primary particles size of < 10 nm. As the nTiO2 is present in the anatase phase, the use of Hombikat UV 100 WP extends to photocatalytic applications, for example in paintings or coatings. (Sachtleben Chemie GmbH, 2006). Figure 1 illustrates the particle size distribution of the nTiO2 suspension at different dilution ratios, at which all the modes being below 100 nm indicate its nanoscale character. The suspension was measured at an external laboratory using a special nebulizer and a scanning mobility particle sizer. Further information regarding the deployed nebulizer and the nebulization process can be found in Fissan et al. (2014). With the help of the nebulizer, significantly smaller droplets compared with commonly used atomizers can be produced. From the data in Figure 1 it can be seen that smaller particles are measured at higher dilution ratios. Presumably the droplets produced during the nebulization process contain divers particles at low dilution ratios, resulting in single larger particles during drying of the droplets. According to the European Commission recommendation, nanomaterial is defined as “a natural, incidental or manufactured material containing particles, in an unbound state or as an aggregate or as an agglomerate and where, for 50% or more of the particles in the number size distribution, one or more external dimensions is in the size range 1 nm–100 nm” (EC, 2011a).
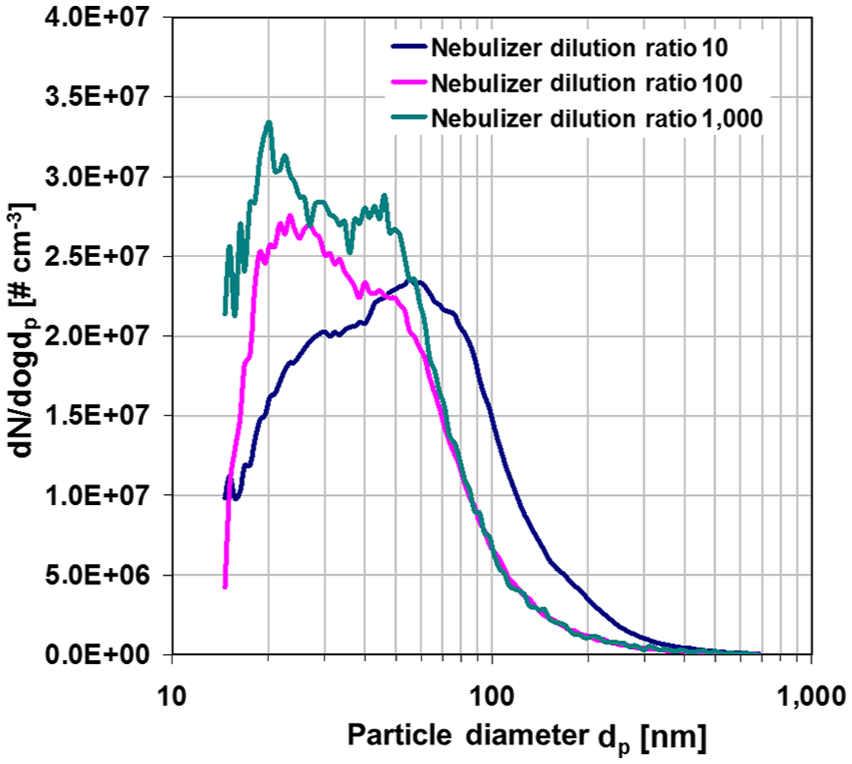
Particle size distribution of the deployed nTiO2 suspension at different dilution ratios. At a dilution ratio of 10 (100/1000) the mode is 55 nm (25 nm/20 nm) (Börner et al., 2016).
Investigations on the fate of nTiO2 during thermal waste treatment were performed at the MSWI plant “Gemeinschaftskraftwerk Schweinfurt” (GKS). The plant has three identical combustion lines. Each line has a capacity of 8 tonne per hour (t h-1) and is equipped with selective non-catalytic reduction, cyclone, spray dryer, bag filter and two-stage scrubber (Figure 2).
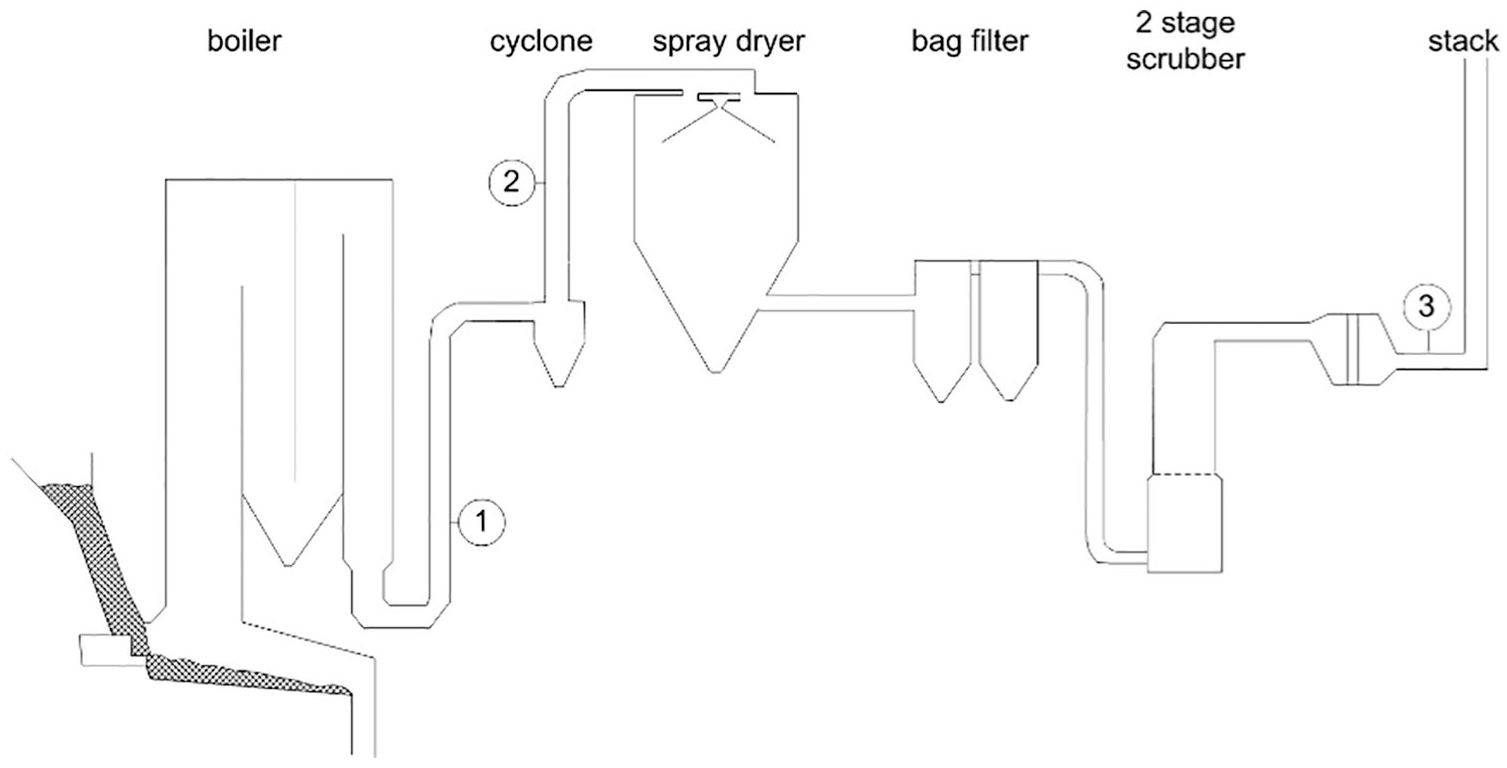
Schematic diagram of the MSWI plant GKS and indicated measurement points for the flue gas (Börner et al., 2016).
The nTiO2 suspension was sprayed through the firefighting water injection system onto the waste in the feeding hopper with the help of a peristaltic pump, representing a worst-case scenario for unattached ENM postulated by Walser et al. (2012). Two TS were conducted. For the first TS, the average amount of waste mounted up to 6592 t h-1 during the reference measurement and to 8373 t h-1 during the measurement with nTiO2 injection. In case of the second TS, a waste stream of 7303 t h-1 for the reference measurement and of 7545 t h-1 for the measurement with nTiO2 injection was recorded. In order to augment the titanium concentration in the waste of about 0.3 weight per cent (wt%) from the background concentration, 751 kg of the nTiO2 suspension were added over 10.8 hours during the first TS and 783 kg over 10.0 hours during the second TS. For each TS, the addition of nTiO2 to the waste started 6 hours before the measurement.
For each TS, background concentrations of titanium were measured first in the combustion residues, the flue gas cleaning products and the flue gas. For each measurement day, generally three samples of bottom ash, bottom ash extractor water, fly ash (boiler ash, cyclone ash), flue gas cleaning products (spray absorber ash, fabric filter ash) and scrubber wash water from the wet scrubber were taken in order to determine the fate of nTiO2. The solid residues were sampled on the basis of the recommendations of LAGA PN98 for moving waste, as far as they were applicable to the large-scale plant (Länderarbeitsgemeinschaft Abfall, 2001). The flue gas was sampled (a) after boiler; (b) after cyclone; and (c) before stack. The concentrations of dust along the flue gas path were measured and the particle size distributions were analysed using three Dekati® Low Pressure Impactors (DLPI). The DLPI classified the sampled particles of the flue gas according to their aerodynamic diameter in a range between 0.028 µm and 10 µm (one impactor: 7 µm). Aluminium foils coated with the high temperature vacuum grease Apiezon H (M&I Materials Limited) were used as collection substrates. Two DLPI were operating at sample flow rates of 10 l min-1 and one at 30 l min-1. For the measurement points after boiler and after cyclone, the flue gas was diluted in order to realize longer sampling time (from several minutes up to maximum 60 min). Standard diluters from Dekati were used. The impactor with a sample flow rate of 30 l min-1 was employed before the stack with measuring times of about 240 min in order to collect a sufficient amount of dust at each stage in a reasonable time. At the measurement point before stack no dilution system was deployed. The collected amount of dust collected on the impactor stages was measured using the analytical balance BM-22 (A&D Company, Limited). The balance has a resolution of 0.001 mg at a weighing capacity of 5.1 g with a repeatability of 0.004 mg and a linearity of ± 0.010 mg.
The analytical examination was realized in an external laboratory. All samples were digested by microwave pressure digestion analog to DIN 22022, except for the impactor samples, which were digested according to DIN EN 14385. Subsequently the samples were analysed for the content of titanium using ICP-MS according to DIN EN ISO 17294-2. The limit of quantification of titanium for all samples is 1 mg kg-1 except for the impactor samples for which it is 0.5 µg absolute.
Based on an existing balance regarding the mass (compare Table 2) and the composition of the input material of the GKS in 2011, we calculated the mass balance of titanium for our TS. Additives used in the flue gas cleaning process are not consumed and therefore are not part of the mass balance for titanium. The mass stream fly ash is constituent of 50% of boiler ash and 50% of cyclone ash. The coarse part of the boiler ash (second and third boiler pass) amount to 90%, while the fine part (fourth boiler pass) is 10%. The flue gas cleaning products are composed of spray absorber ash (10%) and fabric filter ash (90%). The flue gas was balanced with the impactor measurement. Based on the titanium contents in the residues and the existing mass balance of the GKS in 2011, the titanium content in the waste was calculated for the reference measurements. The averaged value of the reference measurement was taken as background concentration for the titanium content in the waste of measurements with nTiO2 injection. For both mass balances, the titanium contents of the reference measurements were subtracted.
Mass balance for the GKS in 2011.
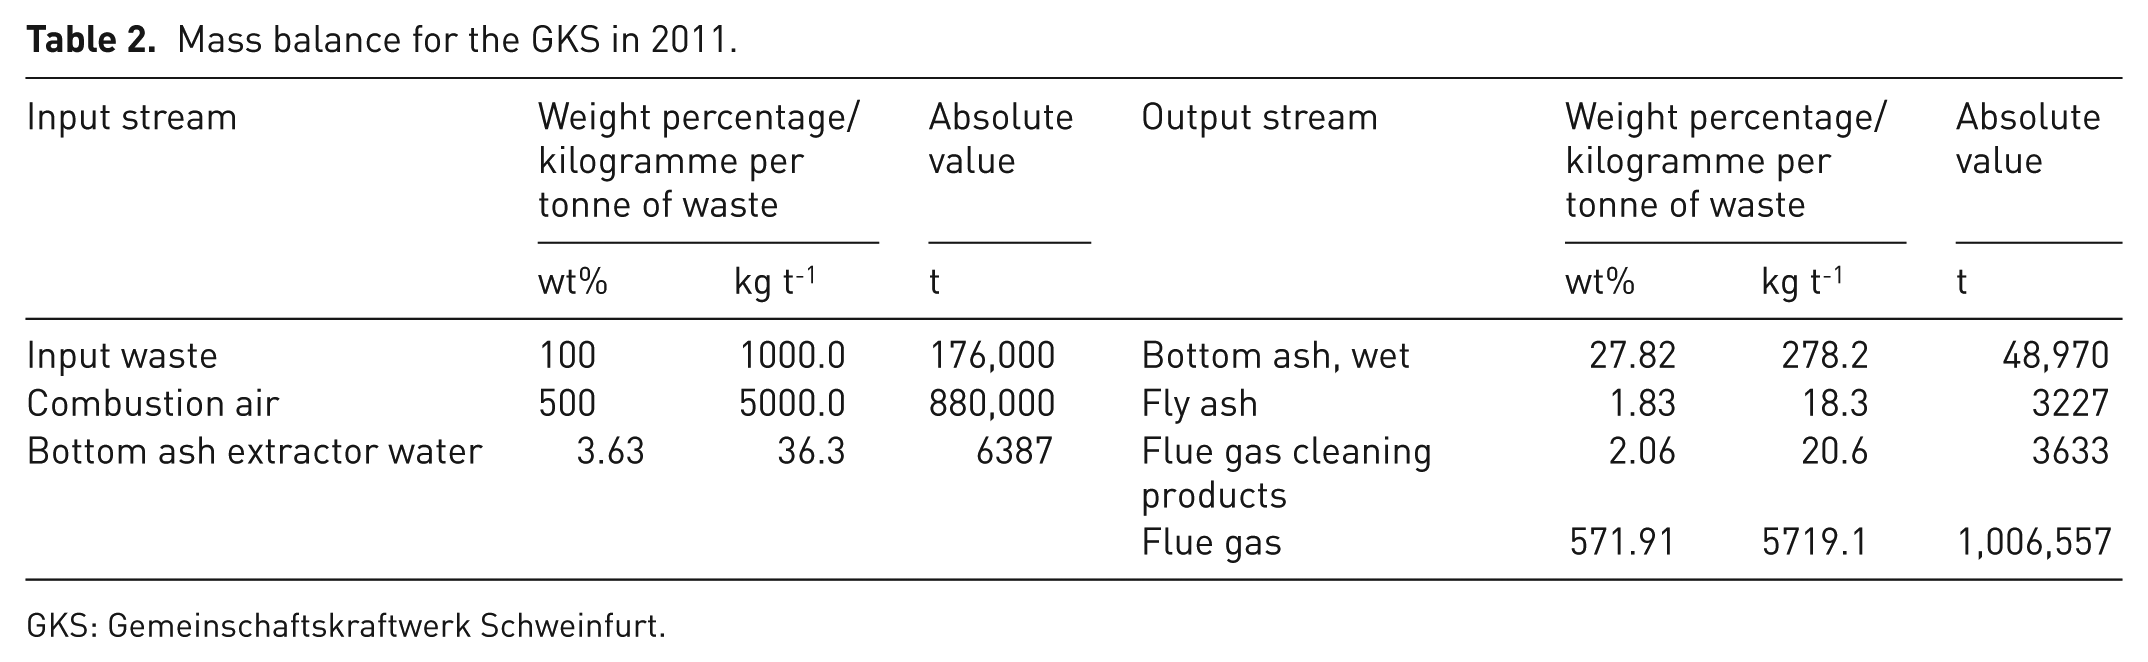
GKS: Gemeinschaftskraftwerk Schweinfurt.
Results
Figure 3 depicts the particle mass size distributions of dust and titanium along the flue gas path for the two TS. Unimodal mass size distributions for dust with a maximum of about 0.6 µm are observed after boiler and after cyclone for both TS. Likewise, unimodal mass size distributions for dust were measured before stack with a maximum of about 0.8 µm; except for the first reference measurement, which shows another maximum of about 0.06 µm in the particle size distribution.
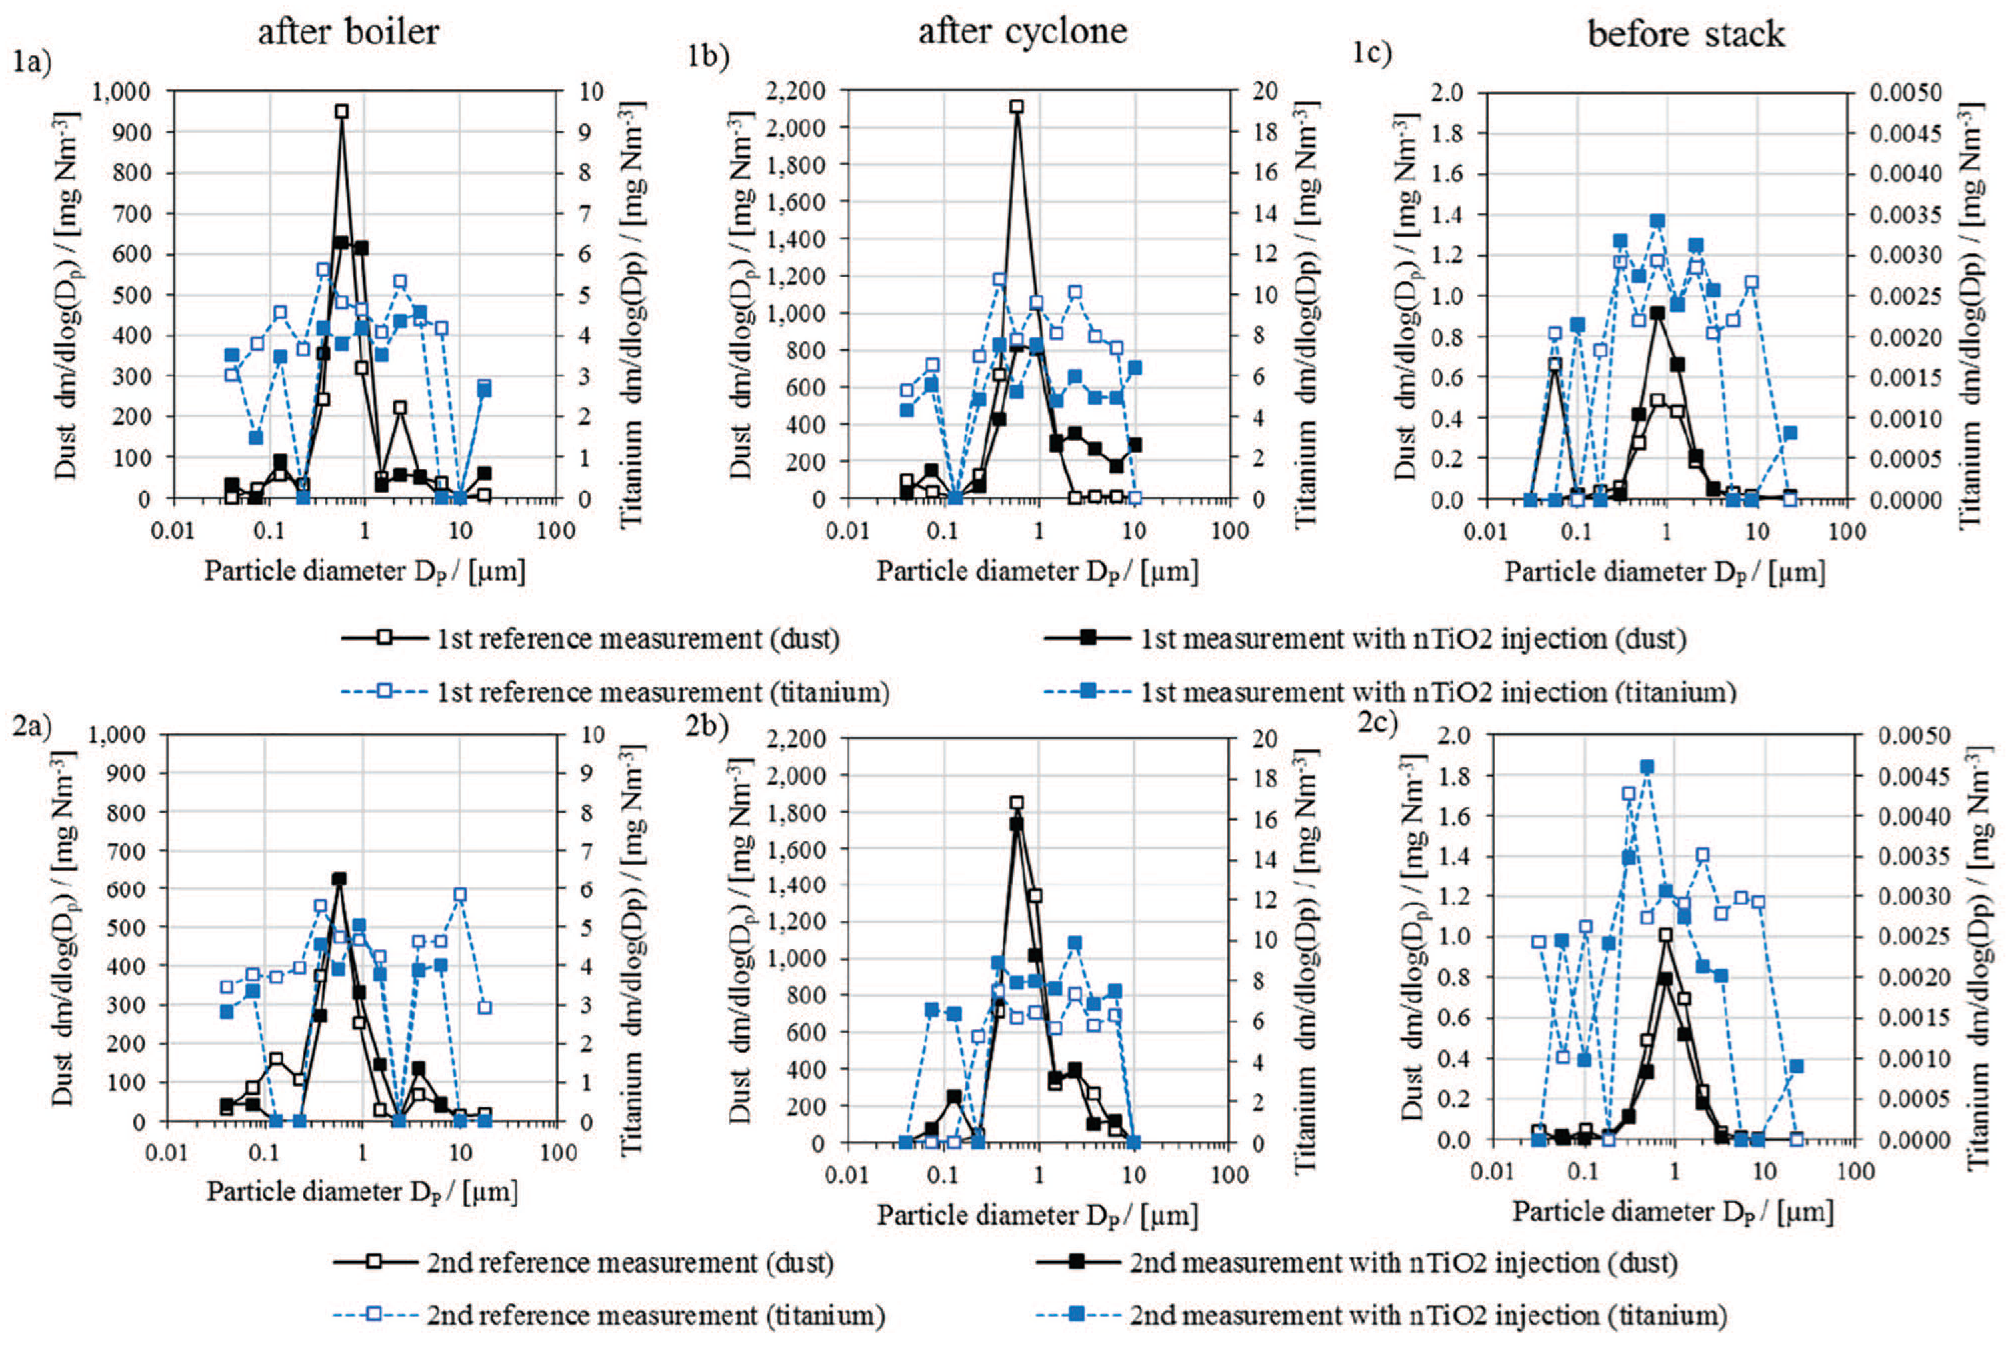
Particle mass size distribution measurements of dust and titanium along the flue gas path: (a) after boiler, (b) after cyclone, (c) before stack for the first (1) and the second (2) TS.
Before stack, the total titanium content of the three first stages with a cut diameter below 100 nm was 0.47 µg Nm-3 (standard conditions for dry gas: Tn=273.15 K, pn=1013.25 hPa) for the first reference measurement and 0.55 µg Nm-3 for the first measurement with nTiO2 injection. In relation to the dust concentration, titanium values of 0.10% for the first reference measurement and of 0.11% for the first measurement with nTiO2 injection are obtained. In case of the second TS we detected 1.51 µg Nm-3 (0.29%) of titanium for the second reference measurement and 0.80 µg Nm-3 (0.21%) of titanium for the second measurement with nTiO2 injection.
Table 3 shows the dust and titanium concentrations along the flue gas path for the first and the second TS derived from the impactor measurement. For titanium, also the percentage of titanium to the dust is presented. The dust concentrations increase after cyclone compared with the measuring point after boiler except for the first reference measurement. Via spray dryer, bag filter and two-stage scrubber, the dust concentrations are reduced to values < 0.6 mg Nm-3 before stack for all measurements. After boiler and after cyclone the percentage of titanium to the dust was slightly higher for the measurement with nTiO2 injection compared with the reference measurement, except for the second measurement with nTiO2 injection after boiler. The percentage of titanium to the dust for the first reference measurement before stack is 1.02%, whereas the value for the first measurement with nTiO2 injection is 0.94%. In the case of the second TS, the reference measurement has a value of 1.19%, and of 1.41% for the measurement with nTiO2 injection.
Dust and titanium concentrations along the flue gas path for the first and the second TS.
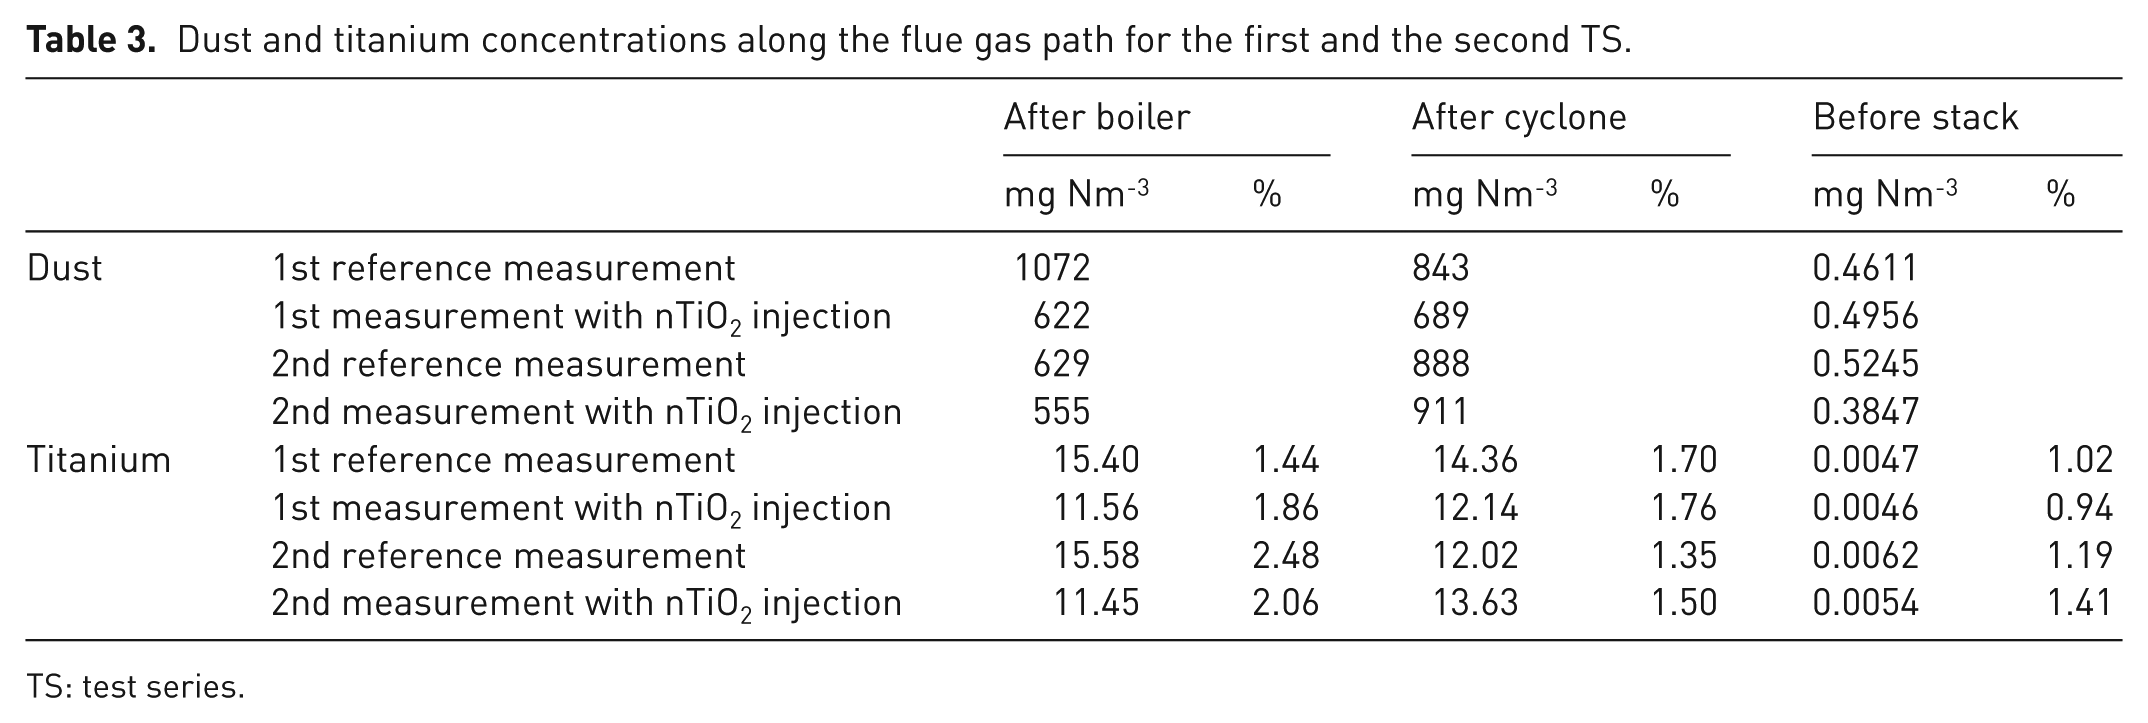
TS: test series.
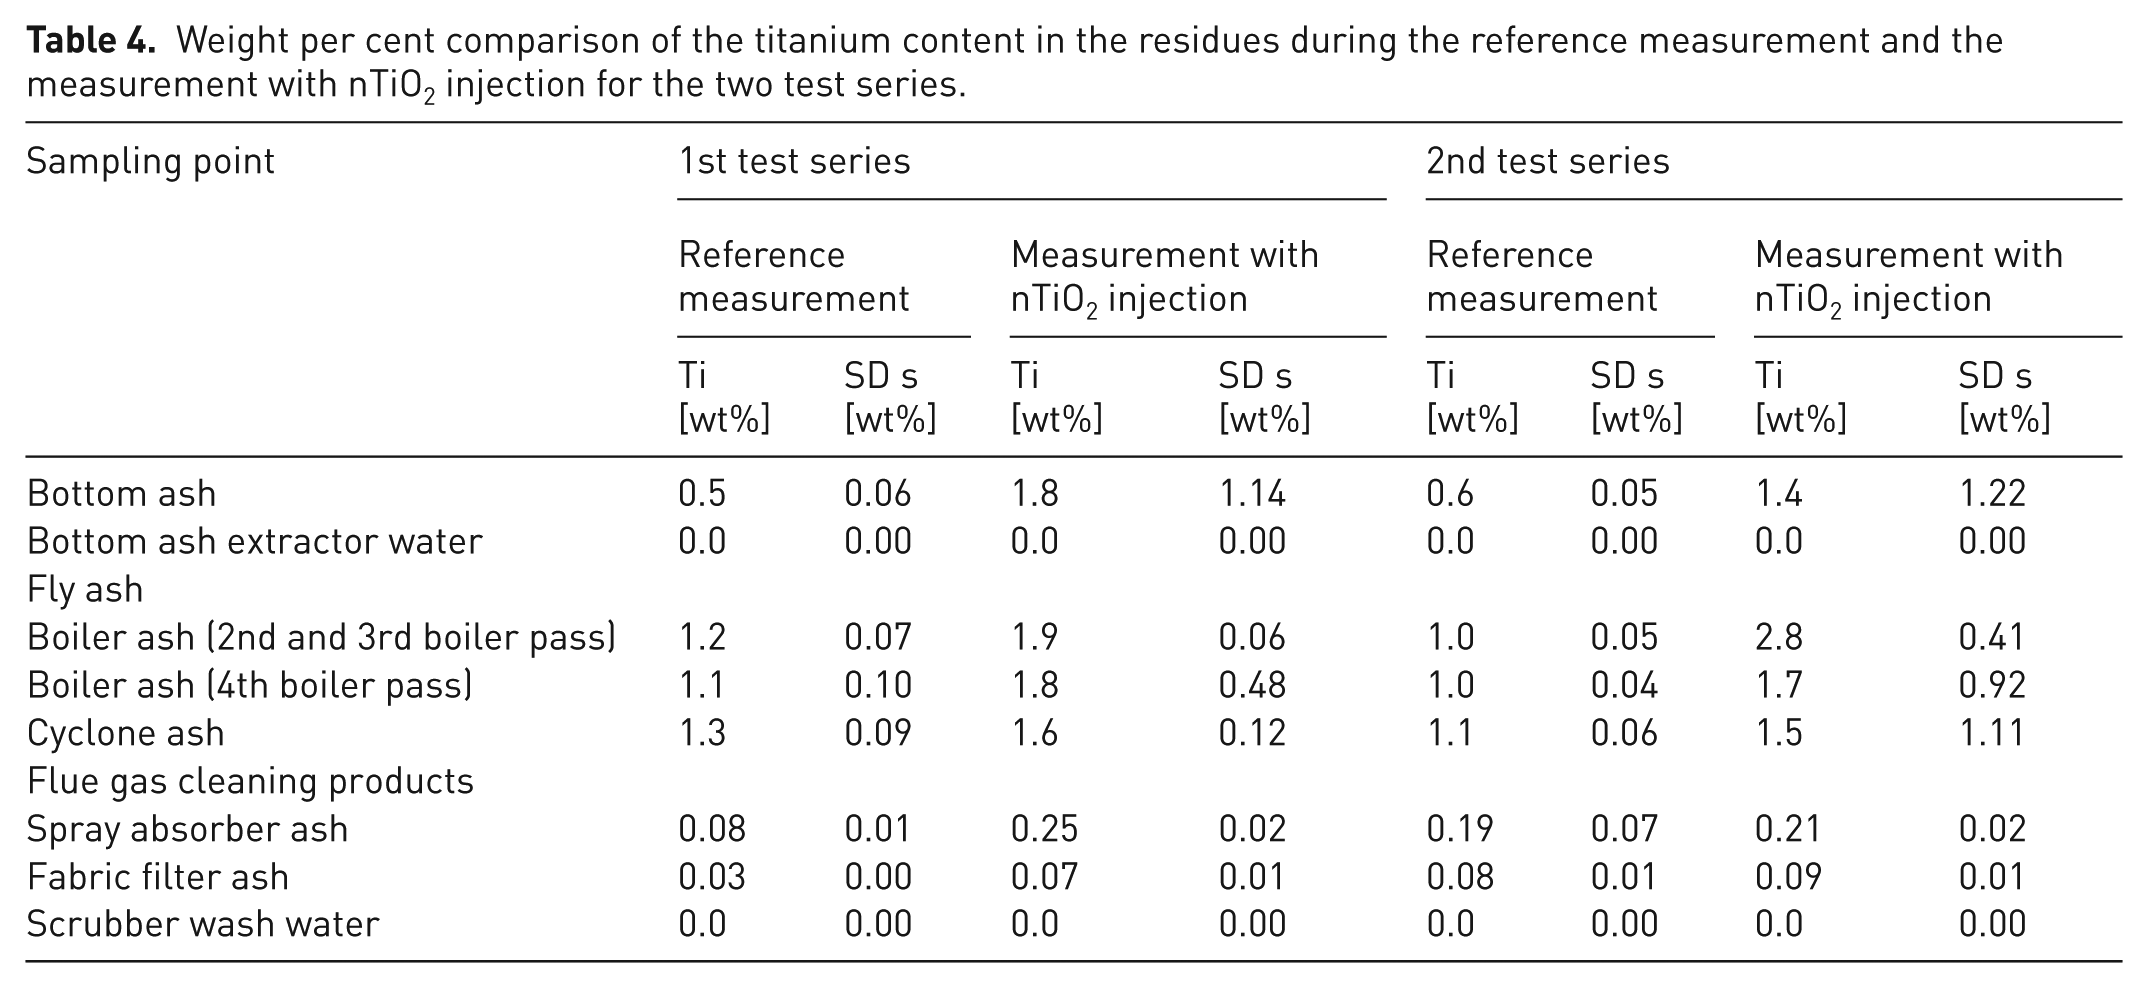
Table 4 contains a comparison of the titanium content in the residues during the reference measurement and the measurement with nTiO2 injection for the two TS as well as values for the standard deviation (SD) s estimated for samples. For both TS an augmentation of titanium is observed for all residues of the measurements with nTiO2 injection except for the bottom ash extractor water and the scrubber wash water. The concentrations in these liquid samples was negligible. During the reference measurements, we calculated a titanium content of 0.139 wt% for the first TS and of 0.172 wt% for the second TS in the waste, resulting in an averaged value of 0.156 wt%.
Weight per cent comparison of the titanium content in the residues during the reference measurement and the measurement with nTiO2 injection for the two test series.
Based on the sampled residues and the mass flows in the incineration plant GKS, the mass balances were calculated for the first and the second TS (Figure 4). As the contents of titanium in the bottom ash extractor water and the scrubber wash water were negligible, they are unquoted in the mass balance. The titanium contents of the reference measurements were subtracted. In the first TS at a recovery rate of 124.5% most of the injected titanium was recovered in the bottom ash (120.7%). Minor amounts of titanium were detected in the fly ash (3.5%) and in the flue gas cleaning products (0.47%). The percentage of titanium in the purified flue gas was 2 ppm. In the second TS similar distribution paths were observed for titanium. The majority of titanium was found in the bottom ash (65.3%). Likewise, in the first TS minor amounts of titanium were measured in the fly ash (6.2%) and the flue gas cleaning products (0.1%). In the purified flue gas, no titanium was detected. The recovery rate was 71.6%.
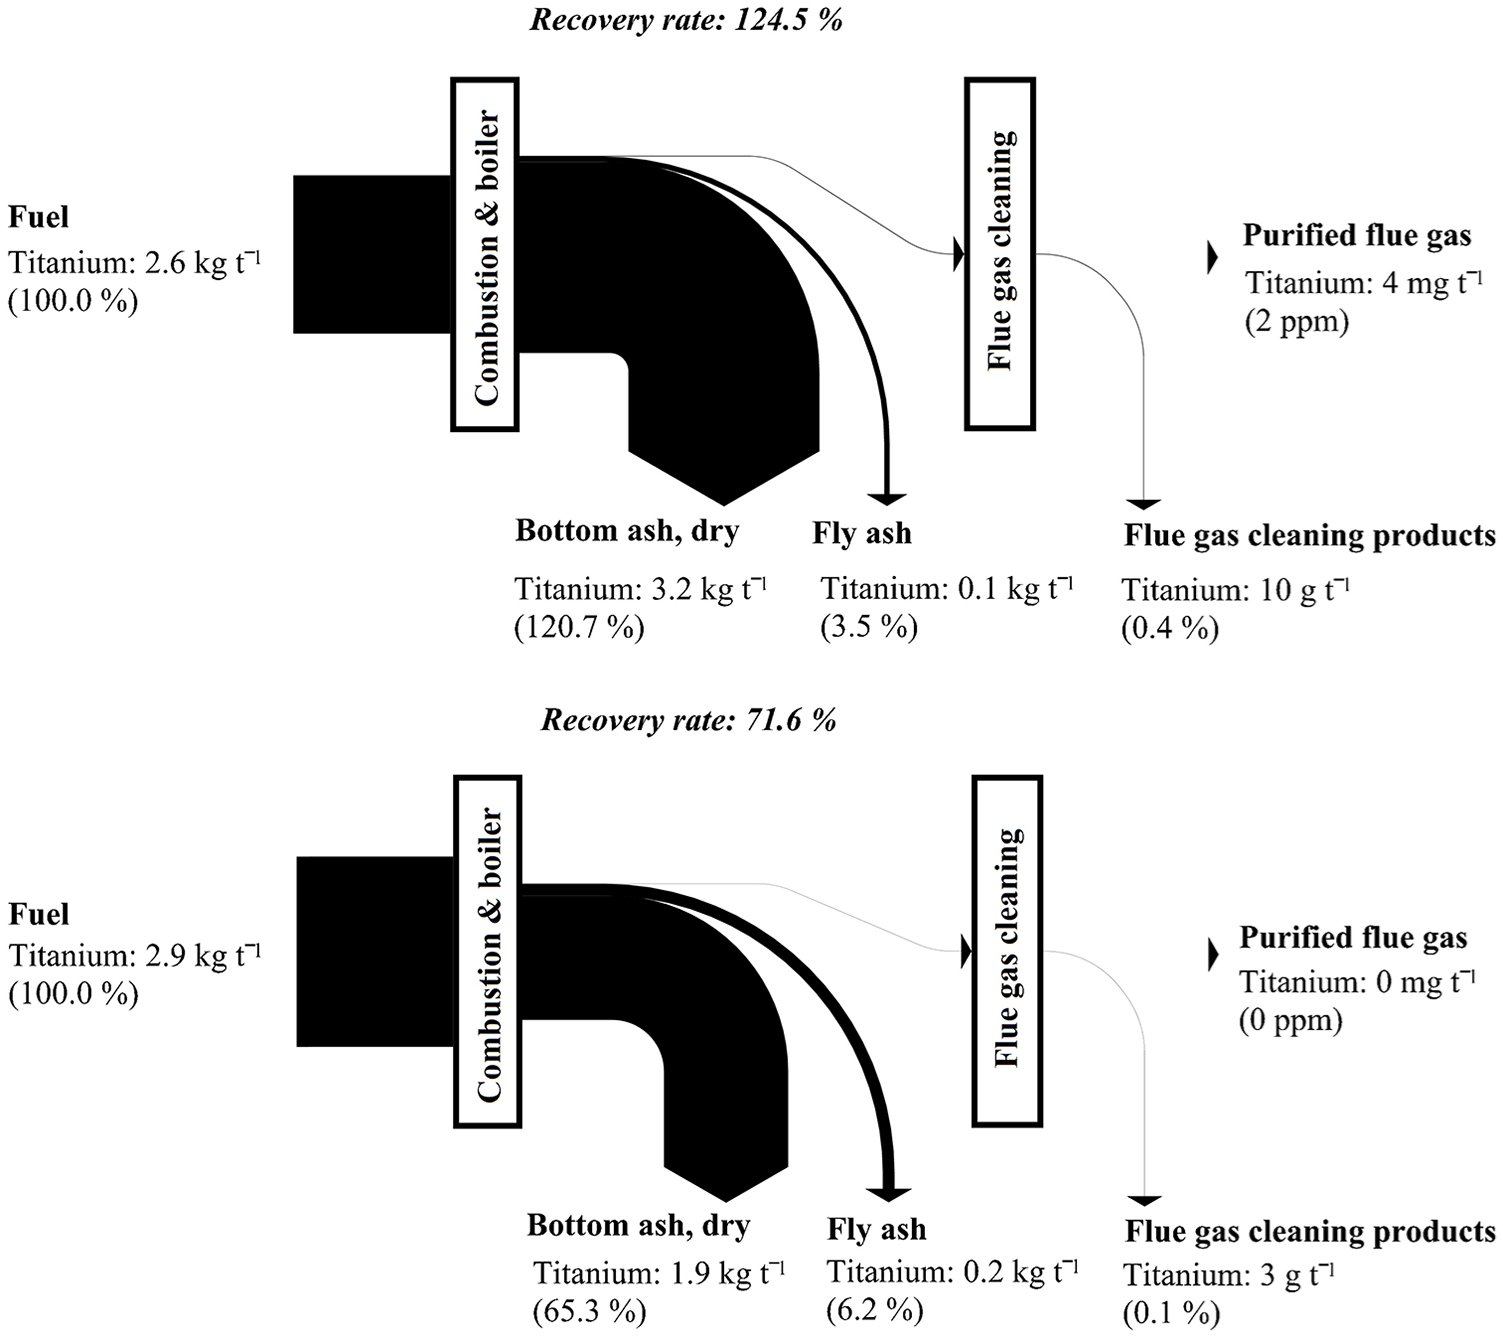
Titanium balance for the first (above) and the second (below) TS. The titanium contents of the reference measurements were subtracted.
Discussion and conclusion
Comparison of the executed experiments to lab-scale experiments
For the first and second TS, similar results were obtained, resulting in high concentrations of titanium in the solid combustion residues e.g. bottom ash. Minor amounts of titanium were measured in the flue gas cleaning products. In the purified clean gas, no significantly elevated concentrations of titanium compared with the reference measurements were detected. Combustion experiments with nTiO2 in lab-scale experiments showed a similar tendency for the fate of nTiO2 (Börner et al., 2016; Massari et al., 2014; Vejerano et al., 2014) as our experiments in the large-scale plant. Based on these findings, the factors influencing the fate of nTiO2 during waste incineration in the large-scale plant GKS are examined in detail below. Some of the data presented in the following was not measured during the experiments but in other projects from GKS; the significance is therefore limited. Nevertheless, the data was collected during regular operation, as was also the case in our experiments.
Dust measurements and particle mass size distribution
Our dust measurements were derived from impactor measurements. In general, impactor measurements result in lower dust concentrations compared with total dust measurements according to VDI 2066-1 (Mair et al., 2000). This circumstance has to be taken into consideration when analysing the experiments in the following. For the first and second TS as well as for the reference measurement and the measurement with nTiO2 injection, the dust concentrations of the impactor measurement for each measurement point lie in a similar range. Our measurements after boiler lie in a lower range (factor 2–4) than those of Schumacher et al. (2016), which were performed in the fourth boiler pass during another project at GKS. Due to the differing measurement point the comparability of the results is limited. Nevertheless, our maxima lay in a similar range to those determined by Schumacher et al. (2016). As the authors detected a bimodal mass size distribution, the second maxima lay in a range > 10 µm, which was beyond our measuring range. At the measurement point after cyclone, the dust concentrations increased with regard to the ones after boiler. Whitelock and Buser (2007) reported a shift of the particle size towards smaller sizes by a single cyclone. According to their findings, we suppose that in our experiments due to the centrifugal force, coarse particles are ripped to smaller particles in the multi cyclone. Therefore, we believe that particles are captured after cyclone that were not sampled after boiler by the impactor as they were too large. Hence, increased dust concentrations were measured. The first maximum of 0.06 µm in the particle mass size distribution for the first reference measurement in the clean gas before stack is not typical for particle size distributions in the clean gas and differs from the other measurements before stack. As the first maximum is derived from one single impactor stage, it is considered a measuring error.
Recovery rates of nTiO2
The recovery rates for the two TS differ mainly due to the analysed concentrations in the bottom ash. The SD s for the first TS is 1.1 at a value of 1.8, and for the second TS is 1.2 at a value of 1.4. Although the sampling was carried out carefully, a representative sampling in a large-scale plant is quite challenging. Likewise, varying background concentrations of titanium in the sampled residues probably influenced the results and the determined values might not have been representative for the waste streams. According to the data of Table 4, the titanium concentration of the reference measurements (background) lie in a similar range for both measurement days with comparable SD, indicating a relatively stable background. As depicted, the mass balance of titanium was calculated with data from a previous project. This might also result in uncertainties. Quantifying waste streams in the GKS during regular operation would be quite challenging to realize. From our point of view, we see a higher accuracy in calculating the mass balance by using existing data from a longer period. All these effects and boundary conditions resulted in a recovery rate above 100% for the first TS. In the other large-scale experiments little data is presented regarding sampling and analytics. From our point of view, from this emerges the need for further research and the development of standard reference methods for ENM in thermal treatment plants with the aim of a better comparability.
Fate of nTiO2 in the bottom ash
Most of the recovered titanium was found in the bottom ash (120.7% for the first TS and 65.3% for the second TS). Likewise, augmented concentrations of titanium were detected in the bottom ash for the measurements with nTiO2 injection (cf. Table 4). Declaration approaches for this observation are given in the following. The deployed nTiO2 suspension entered the grate firing either in a liquid or dried form. The polyacrylates (approx. 6.2%) present in the product Hombikat UV 100 WP acted as dispersing agent or as binder, respectively. Typical temperatures, measured on two spots in the middle of the grate at GKS, are between 200°C and 300°C. The temperature gradient between the grate bars and the combustion chamber (750–1100°C) is considerable, indicating that higher temperatures in the combustion bed itself are reached. Due to the superficial application of the suspension to the waste, there could be a similarity to the production process of DSSC in terms of the temperatures used (400–500°C) (Jung and Kim, 2010). Massari et al. (2014) reported, but could not quantify, a chemical transformation of nTiO2 to calcium titanate in the presence of calcium oxide, which is a typical compound in bottom ash (Meinfelder and Richers, 2008). As no X-ray diffraction analytics of the bottom ash were carried out, we cannot draw any statements regarding chemical transformations. Whether physical and chemical processes like sintering and the formation of calcium titanate are important key factors that can influence the behaviour of superficially applied nTiO2 during waste incineration is not clear and needs further research.
Transfer of nTiO2 to the flue gas and fate of nTiO2 along the flue gas path
As noticeable amounts of titanium were found in the fly ash and flue gas cleaning products, nTiO2 had to be transported with the flue gas. The data from Table 3 does not really prove this since the percentage of titanium for the measurement points after boiler and after cyclone are slightly augmented for the measurements with nTiO2 injection. The dust concentrations in Table 3 were derived from impactor measurements, which is why the concentrations of dust are underestimated as depicted before. For some stages the collected amount of dust was very little. Therefore, the detection of titanium is hindered, resulting in higher uncertainties for the sum parameter. Additionally, the dust samples after boiler and cyclone represent more or less a snapshot due to the relatively short sampling time (a few minutes to 1 hour) compared with the whole measurement day. Also, the MSWI plant GKS is operated load-dependent, resulting in varying flue gas volumes. In addition, the use of the diluters for the measurement points after boiler and after cyclone might have affected the collection of titanium.
Nevertheless, titanium was detected along the fly ash and the flue gas cleaning products (cf. Table 4). Hence, we conclude that titanium was transported with the dust of the flue gas. In the combustion bed, the combustion air at GKS has an average velocity of < 1 m s-1 with peaks of up to 10 m s-1 (Warnecke, 2010). Due to their force, we assume that small particles covered with nTiO2 suspension were pulled out from the combustion bed and became part of the dust. Evaporation and recondensation of the used nTiO2 during our measurements with nTiO2 injection seems unlikely due to the high boiling point of titanium dioxide (Mueller et al., 2013). Thermophoresis effects and scavenging could explain why high contents of titanium were found in the fly ash. At GKS, thermophoresis effects could occur, for example, in the boiler due to the high temperature gradient between the hot flue gases and the colder heat exchanger plates. Therefore, nTiO2 particles would have been deposited on the walls together with the soot. Periodically the soot is removed by soot blowing. The removed particles are to be found predominantly in the fly ash. Also scavenging of the nTiO2 particles to the fly ash seems likely.
As augmented concentrations of titanium were found in the spray absorber ash in the measurements with nTiO2 injection, we reason that titanium was further removed from the flue gas. At GKS, activated coke is added to the flue gas before the spray dryer and a suspension (washwater from the elutriation of the two-stage scrubber) is injected in the spray dryer. If there are still nTiO2 particles in the flue gas, we suppose that scavenging is favourable for the removal of nTiO2.
Fate of nTiO2 in the clean gas
In the clean gas, the concentrations of titanium were very little. Augmented concentrations of titanium in the fabric filter ash were found during the measurement with nTiO2 injection, indicating a further removal of titanium by the fabric filter. An explanation for this finding could be that at a pressure drop of about 1200–1500 Pa the cleaning of the bag filters by reverse jet pulse at GKS are stopped, working in a range considerably higher than the 500 Pa proposed by Förster et al. (2016). Hence indicating that the penetration of nTiO2 through the fabric filter was very little.
In the scrubber wash water, the concentrations of titanium were negligible for the reference measurement and the measurements with nTiO2 injection. We conclude that a further removal of nTiO2, present in the flue gas, within the scrubber did not take place in a noticeable amount. This would be in accordance to the fractional separation efficiency for scrubbers, which decreases significantly below 5 µm (Kaltschmitt et al., 2016).
Comparison of the executed experiments to large-scale experiments and perspective
As depicted earlier, the majority of titanium was found in the solid combustion residues, especially the bottom ash. Our results are in good accordance with Walser et al. (2012), Lang et al. (2015) and Baran and Quicker (2016). For three different ENM (nTiO2, nCeO2 and nBaSO4) a similar tendency for the fate during waste incineration is observed. Whether this is valid for other ENM is unclear and needs further research (Part et al., 2018). An example to which attention should be drawn from our point of view is nano titanium nitride (nTiN), being employed in the production process of polyethylene terephthalate (PET) bottles as reheat additive, which facilitates the stretching of the PET preforms (Bott et al., 2014). According to the commission regulation (EU) No 10/2011 on plastic materials and articles intended to come into contact with food, nTiN can be used only in PET bottles up to 20 mg kg-1 (EC, 2011b). Struwe and Schindler (2012) depicted the relevance of nTiN during the recycling process of ENM-containing waste. Consequently, we see a relevance to the ENM-containing waste stream in MSWI plants and waste incineration.
Summary
A lack of information existed in the fate and behaviour of ENM during waste incineration. In our project “Assessment of the emission behaviour of nanomaterial-containing waste in thermal treatment plants” funded by the German Federal Environment Agency we examined the emission pathways of nTiO2 as an example for an ENM in the waste incineration plant GKS. It was indicated that most of the used ENM was located in the solid residues (i.e. bottom ash) while a smaller part was detected in the products of the flue gas cleaning. In the purified flue gas before the stack, the concentration was negligible. Therefore, a significant emission to the environment is not expected. The flue gas cleaning system at GKS complies with the requirements of the best available techniques and findings cannot be transferred to plants with lower standards.
Footnotes
Acknowledgements
The authors acknowledge the plant operator at GKS for his support during the TS.
Declaration of conflicting interests
The authors declared no potential conflicts of interest with respect to the research, authorship, and/or publication of this article.
Funding
The authors disclosed receipt of the following financial support for the research, authorship, and/or publication of this article: The work is part of the project “Assessment of the emission behaviour of nanomaterial-containing waste in thermal treatment plants” and was financed by the German Federal Environment Agency (UBA).