
Abstract
This paper aims to benchmark performance of combined solid waste management (SWM) and recycling systems in major cities of East Africa. The Wasteaware indicators are used to present a detailed systems analysis for Kigali in Rwanda, including a mass flow diagram; comparative data are taken from the Wasteaware database for Dar es Salaam, Tanzania, Kampala, Uganda, Nairobi, Kenya, and also for neighboring Maputo, Mozambique. The stand-out result is the relatively high collection coverage achieved, in Maputo with extensive international technical assistance, and in Kigali using its own local resources. In both cases, governance factors are key. Kigali uses a public–private partnership, with exclusive franchises in 35 sectors being tendered every three years; households pay an affordable fee depending on their ability to pay (the service is free to the poorest category); and 95% fee collection rates are achieved, partly through co-collection with charges for local security patrols, which is a service people value highly given the recent history of the country. Another key priority to improve SWM across East Africa is to eliminate open dumping – only Kampala currently has an engineered disposal site. Recycling rates also need to be increased – only Nairobi currently has a good baseline to build on (30%). Common weaknesses include a lack of segregation at source, of institutional capacity, and of available and reliable waste data.
Keywords
Introduction
Solid waste management (SWM) is one of the essential utility services underpinning society. Historically, levels of service provision in developing countries have been poor – collection coverage has often been less than 40% in low-income countries, while uncontrolled dumping with open burning has been the norm (Hoornweg and Bhada-Tata, 2012; United Nations Environment Programme and International Solid Waste Association, 2015).
However, significant progress has been achieved in the last 20 years, particularly in middle income countries with an income level above about $2,500 per capita per year (United Nations Environment Programme and International Solid Waste Association, 2015; Wilson et al., 2012, 2013). Despite this, the United Nations Environment Programme’s inaugural Global Waste Management Outlook (GWMO) estimated that more than 2 billion people worldwide do not have any waste collection service, while the waste from more than 3 billion people is simply dumped without any controls, often with open burning (United Nations Environment Programme and International Solid Waste Association, 2015) – a situation which has been described as a global waste crisis or emergency (Wilson and Webster, 2018).
We know that progress is being made thanks to recent efforts to measure systematically the performance of SWM systems. Prominent among these is a set of benchmark indicators, originally developed using the framework of Integrated Sustainable Waste Management (Anschütz, et al., 2004; Schübeler et al., 1996; Van de Klundert and Anschütz, 2001; Wilson et al., 2013), for the UN-Habitat’s seminal publication Solid Waste Management in the World’s Cities (Scheinberg et al., 2010) and first applied to a sample of 20 cities across all income levels and continents (Wilson et al., 2012). The system was developed further prior to testing in five cities as part of a project funded by the German agency GIZ (Deutsche Gesellschaft für Internationale Zusammenarbeit GmbH) (Soós et al., 2013, 2017; Wilson et al., 2017), with the updated version being tested in a further 12 cities prior to publication as the ‘Wasteaware’ benchmark indicators (Wilson et al., 2015a).
The Wasteaware indicators provide a standard procedure to benchmark the SWM and recycling performance of a city. The aim is to reveal clearly those aspects which are performing well and not so well, in order to point the way to next steps on the road to improvement, and to allow benchmarking against other cities. A substantial database of cities is being accumulated (which was used for example in the GWMO and to prepare the 2016 World Population Data Sheet’s definitive map of municipal SWM in cities around the World (Population Resources Bureau, 2016)), and they are increasingly being used in the literature to profile particular cities, both in collaboration with the original development team (e.g. in Bahrain – Al-Sabbagh et al., 2012; Bishkek, Kyrgyz Republic – Sim et al., 2013; Lahore, Pakistan – Masood et al., 2014), and independently (e.g. in Ulaan Baatar, Mongolia – Byamba and Ishikawa, 2017; Accra, Ghana – Oduro-Appiah et al., 2017; Karbala, Iraq – Abdulredha et al., 2018; La Paz, Bolivia – Ferronato et al., 2018; four cities of Himachal Pradesh, India – Sharma et al., 2018).
Improving SWM is a critical issue in the rapidly growing cities of Africa. A seminal World Bank report (Hoornweg and Bhada-Tata, 2012) showed that half of the total municipal solid waste (MSW) generation in 2010 came from the developed world but suggested that this would soon change. Populations are still growing in developing countries (United Nations Department of Economic and Social Affairs, 2018a), the migration from rural to urban areas is set to continue, particularly in Africa (United Nations Department of Economic and Social Affairs, 2018b), and waste per capita shows a strong positive correlation with income levels (United Nations Environment Programme and International Solid Waste Association, 2015), so will increase as a country develops economically. Subsequent work by Hoornweg and colleagues has attempted to extend these trends to the middle and end of the 21st century, suggesting that East Asia and the Pacific would catch up with the developed world in terms of MSW generation before 2030, and that Africa would overtake both around 2075 (Hoornweg et al., 2013, 2015). As a follow-up to the GWMO, an African Waste Management Outlook has now been published (United Nations Environment Programme, 2018).
The work reported here originated when a local academic in the city of Kigali, the capital of Rwanda, contacted the lead author of the Wasteaware indicators. The main aim and purpose of this paper is to benchmark and compare performance of SWM and recycling systems across East Africa. This has been achieved through two specific aims: first to apply the Wasteaware indicators to the city of Kigali; and secondly to use previously unpublished information from the Wasteaware database to compare the performance of Kigali with the three largest cities in East Africa – Nairobi, Kenya; Dar es Salaam, Tanzania; and Kampala, Uganda – plus Maputo in the neighboring country of Mozambique.
East Africa, Rwanda and Kigali
The East African Community comprises six countries as shown in Figure 1. The three largest countries (Tanzania, South Sudan, and Kenya) account for 88% of the surface area, while a different three (Tanzania, Kenya, and Uganda) account for 81% of the population. Rwanda and Burundi, the two smallest countries, each represent about 1% of the surface area but 6–7% of the population, so they are the most densely populated. Despite a regional population of 185 million, there are just three major cities with populations in the range 3–6 million (Dar es Salaam, Kampala, and Nairobi), plus another three over 1 million (all in the range 1.0–1.3 million: Kigali, Rwanda; Mombasa, Kenya; and Mwanza, Tanzania). All the East Africa Community countries are classified as low-income by the World Bank.
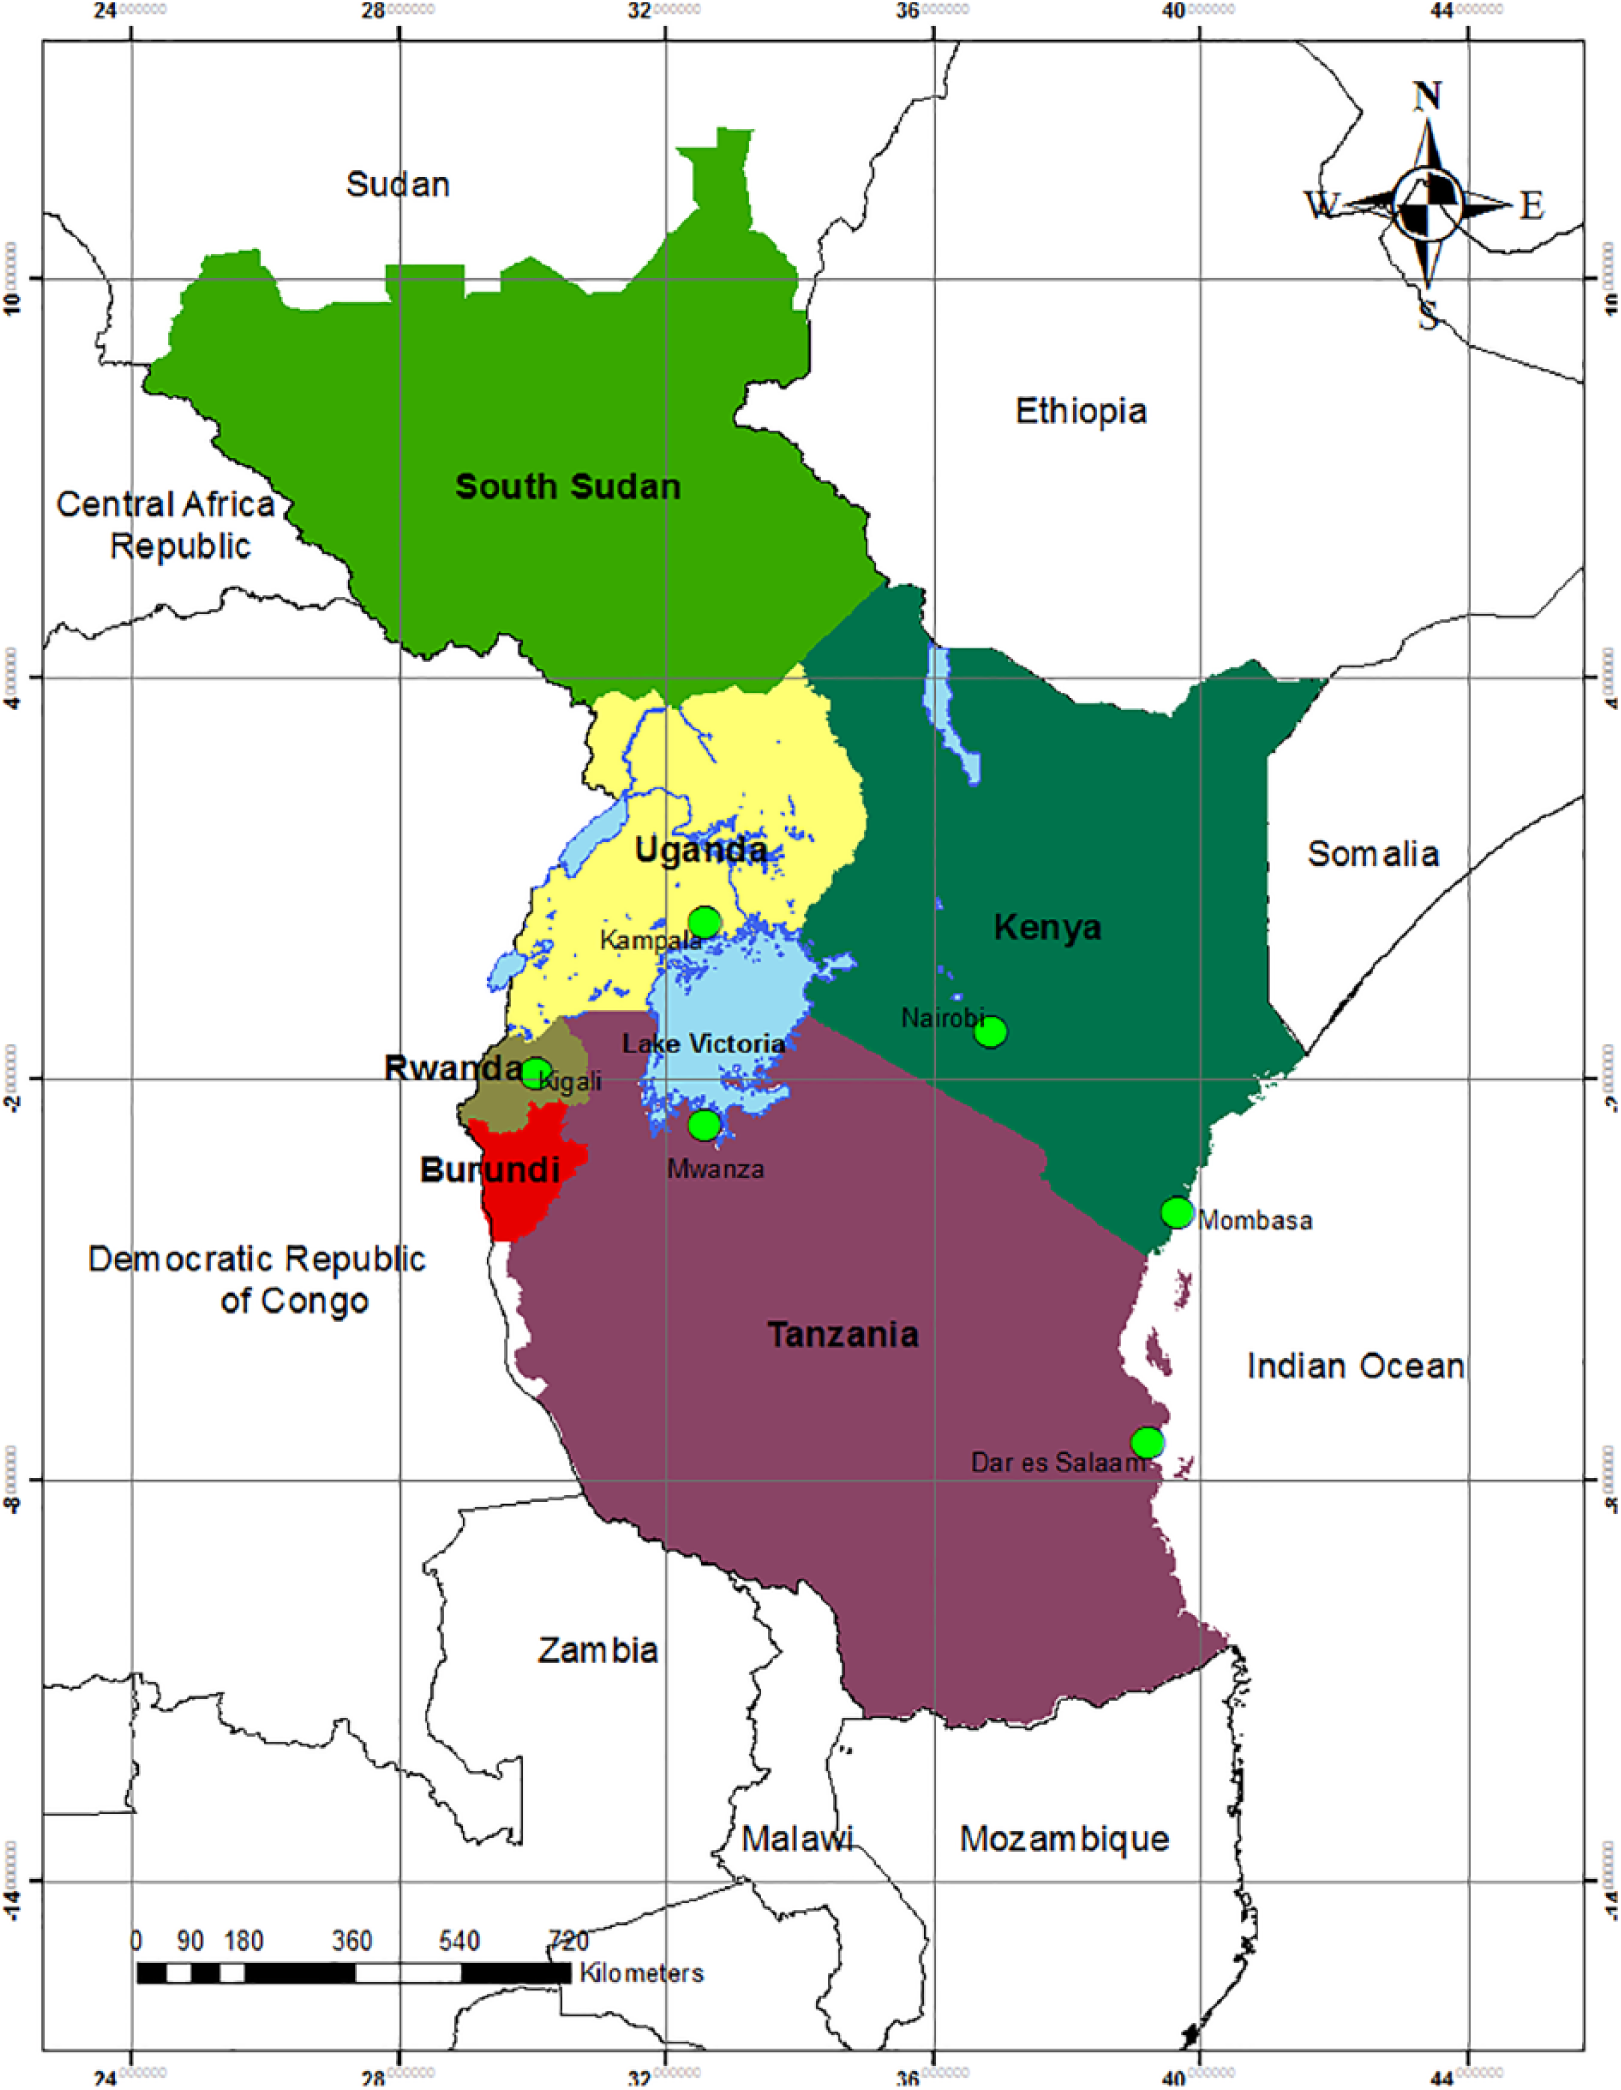
Map showing the six countries of the East African Community and its cities with a population over one million.
Rwanda is a land-locked country at an average altitude of 1,250 m (Seburanga, 2015). According to the most recent Census, the population of Kigali in 2012 was 1,132,686 (National Institute of Statistics of Rwanda, 2012). The growth rate since 2002 had been 2.6% per annum (National Institute of Statistics of Rwanda, 2012); using this to extrapolate forward to 2017, the population used here is 1,280,000. Even though Rwanda’s population density is the highest in the region at 460 people/km², Kigali’s population represents only a tenth of the country’s population; it serves as the economic hub of the whole country.
SWM and recycling in East Africa
A set of three comparative studies on SWM in East Africa, carried out at the University of Wageningen, concentrated on urban areas and particularly the three major cities in the three most populous countries, namely Kenya, Tanzania, and Uganda. These focused on: institutional arrangements (Majale-Liyala, 2011; Majale et al., 2014); the role of civil society organizations (Tukahirwa, 2011; Tukahirwa et al., 2013); and the role of households (Solomon, 2011; Solomon and Spaargaren, 2013).
There is also some peer-reviewed literature on SWM specific to each of these three countries. A particular focus has been on efforts to introduce what is sometimes called ‘pro-poor’ public–private partnerships (PPPs) in waste collection involving community-based organizations or enterprises either across Tanzania (Kironde and Yhdego, 1997) or specifically in Dar es Salaam (Kaseva and Mbuligwe, 2005; Kassim, 2009; Kassim and Ali, 2006; Mbuya, 2009); there is also an excellent chapter on Dar es Salaam in Majale-Liyala (2011). In Kenya, Rotich el al. (2006) provide an overview of SWM, Haregu et al. (2017) examine the evolution of SWM policies and their implementation in Nairobi and Mombasa, and Majale et al. (2016) apply value chain analysis to map informal recycling businesses in low income areas of Nairobi. In Uganda, Komakeck (2014) studied organic waste treatment systems in Kampala and published a paper on the characterization of Kampala’s waste (Komakeck et al., 2014), Okot-Okumu and Nyenje (2011) examine municipal SWM under the decentralization policy, and Christensen et al. (2014) present a case study of North–South partnership building for municipal SWM in Kasese district.
For the other three East Africa countries, we have found just one peer reviewed paper, which focused on SWM in Juba, South Sudan (Loboka et al., 2014), with limited ‘grey’ literature (some of that for Rwanda is cited below) and a few student projects (e.g. in Rwanda: Bazimenyera et al., 2012; Isugi and Niu, 2016; Nshimiyimana, 2015).
We have selected Maputo in Mozambique as an additional comparative city, both because its progress with international technical assistance has been well documented and because several generations of the Wasteaware indicators are available. GIZ have published case studies focusing on both the economic aspects (Stretz, 2012) and the operator models in use (Stretz, 2013). The latter used an earlier version of the Wasteaware indicators, while an updated assessment is also in the Wasteaware database (Stretz, 2016). The World Bank (2017) has published a later project appraisal report, while dos Muchangos and colleagues have published a series of peer-reviewed papers on municipal SWM in Maputo (dos Muchangos et al., 2014, 2015, 2017a, 2017b).
Methodology
Use is made here of the Wasteaware benchmark indicators for which the concepts and methodology have been presented (Wilson et al., 2015a), alongside a User Manual containing detailed guidance (Wilson et al., 2015b). For reasons of both length and originality, it is neither possible nor appropriate to repeat the full methodology here. In this section, an overview is presented, while in subsequent sections the intention is to present enough information to allow this paper to standalone; for more detail, the reader is referred to the original publications.
The analytical framework for the Wasteaware indicators is the simplified ‘two triangles’ formulation of Integrated Sustainable Waste Management (Figure 2). For each of three physical components, a key quantitative indicator is defined: collection coverage; a new measure for ‘controlled treatment or disposal’; and the recycling rate. These are complemented by qualitative assessments of the quality of collection, treatment and disposal and the ‘3Rs’ (reduction, reuse, and recycling). Similar qualitative indicators, each based on an assessment against five or six criteria, are used to assess performance on the three governance aspects. Additional indicators relate to data on waste arising (waste generation per capita and three aspects of waste composition).
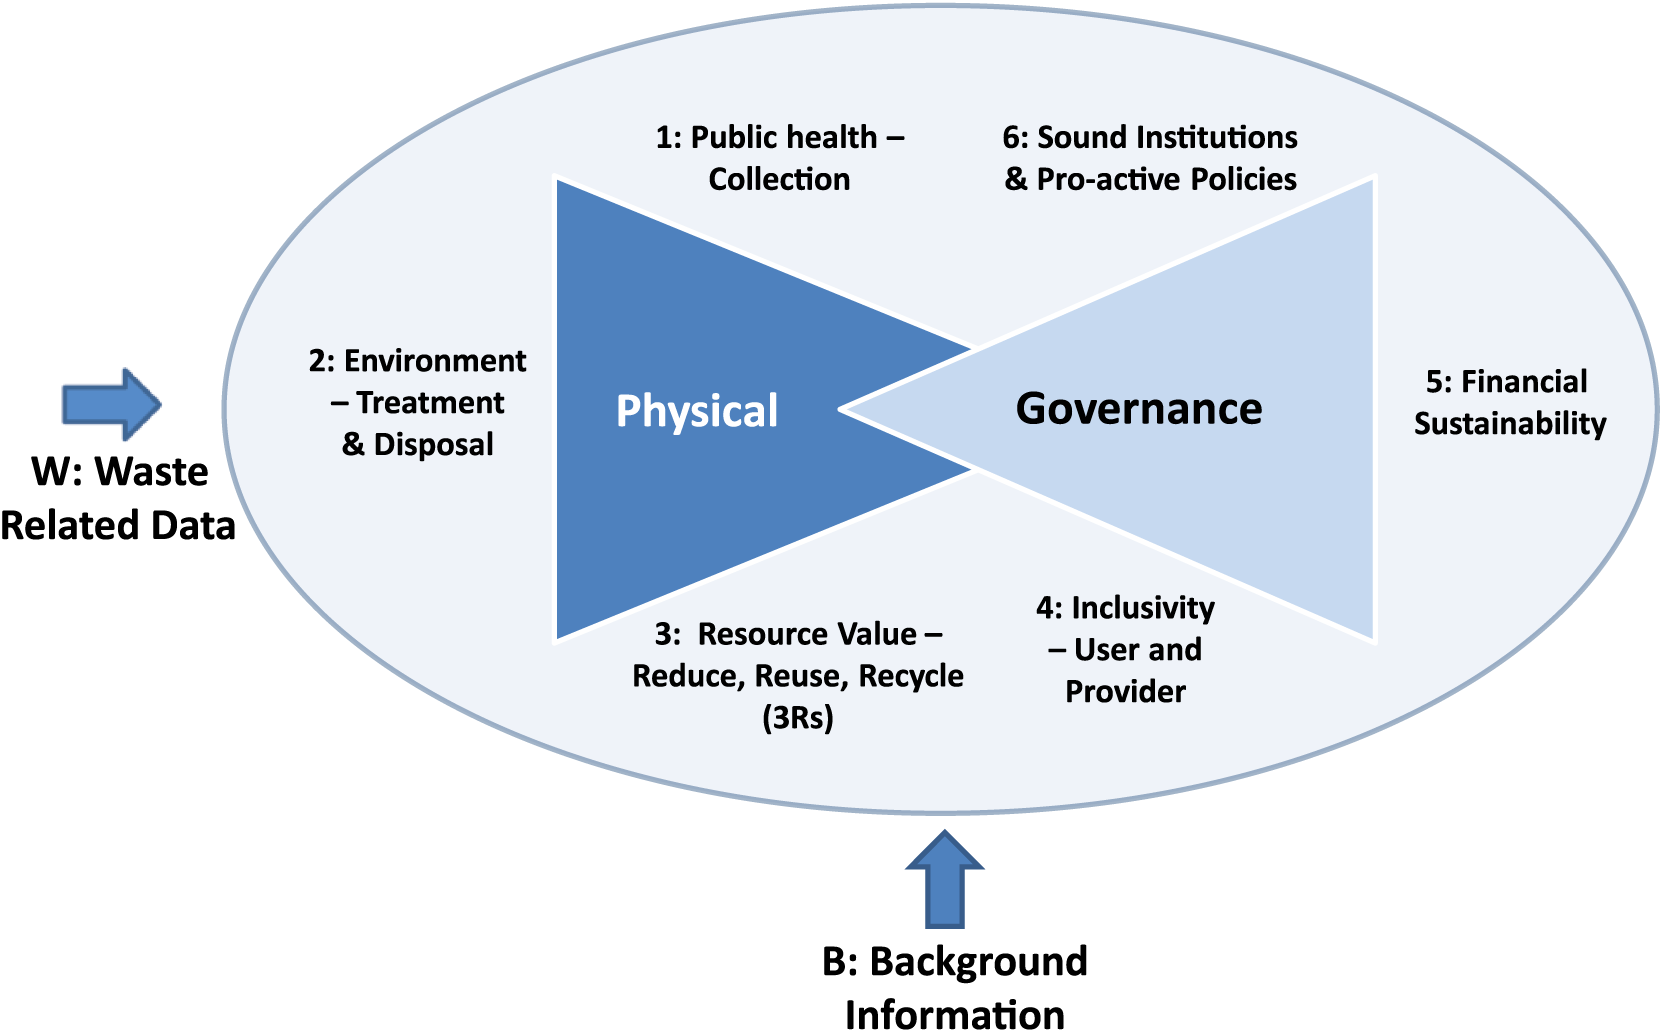
The Integrated Sustainable Waste Management framework used by the Wasteaware indicators (Wilson et al., 2015a). This simplified ‘two triangles’ analytical framework was first devised for the UN-Habitat methodology (Scheinberg, et al., 2010). This version of Figure 2 was drawn by Darragh Masterson. Figure © David Wilson, Ljiljana Rodic, and Costas Velis.
All the quantitative indicators, including waste generation, rely on a good understanding of waste flows through the system. The Wasteaware methodology thus includes the detailed documentation and analysis of a city’s combined SWM and recycling system, including both the formal city-provided system and any informal components, using a Sankey-style material flow diagram (MFD). In this study, the MFD was constructed using STAN2.5 software (Cencic and Rechberger, 2008).
The role of the ‘user’ – the person or persons applying the indicators in a particular city – is very important. The eight qualitative indicators clearly require the user to apply their professional judgment in accord with the guidance in the User Manual; but in a normal situation, where there are issues with both the availability and reliability of data on waste flows, the user also requires both persistence and the confidence to make best estimates in order to complete the MFD and derive the quantitative indicators. To facilitate consistency between users, they are encouraged to provide detailed justifications in an automated excel Indicator Form, including, for example, the sources, assumptions, local definitions, information used, and the rationale behind the scores; this is essential to ensure traceability. Each draft Indicator Form is reviewed by a ‘moderator,’ to ensure consistency between users, before the completed indicator set is added to the central Wasteaware database.
A new Wasteaware indicator set for the case of Kigali was prepared for this study; the user was local academic Telesphore Kabera. Data were mainly collected over a three-month period from May 2017, but verification continued over a further nine months. Data were obtained from interviews with key personnel and operators; official reports and legal documents related to SWM in Rwanda; and from official and unofficial field visits to observe SWM and recycling in practice in the city.
This new indicator set for Kigali is then compared with information already in the Wasteaware database for Dar es Salaam, Kampala, Nairobi, and Maputo. The indicator sets for all five cities, including Kigali, have been moderated by the Wasteaware lead author, David C Wilson.
Material flow analysis for the combined MSW management and recycling system in Kigali
Figure 3 shows the MFD constructed to visualize the combined solid waste and recycling system in Kigali. The sources and methods used for each estimation in the MFD are summarized in Table 1.
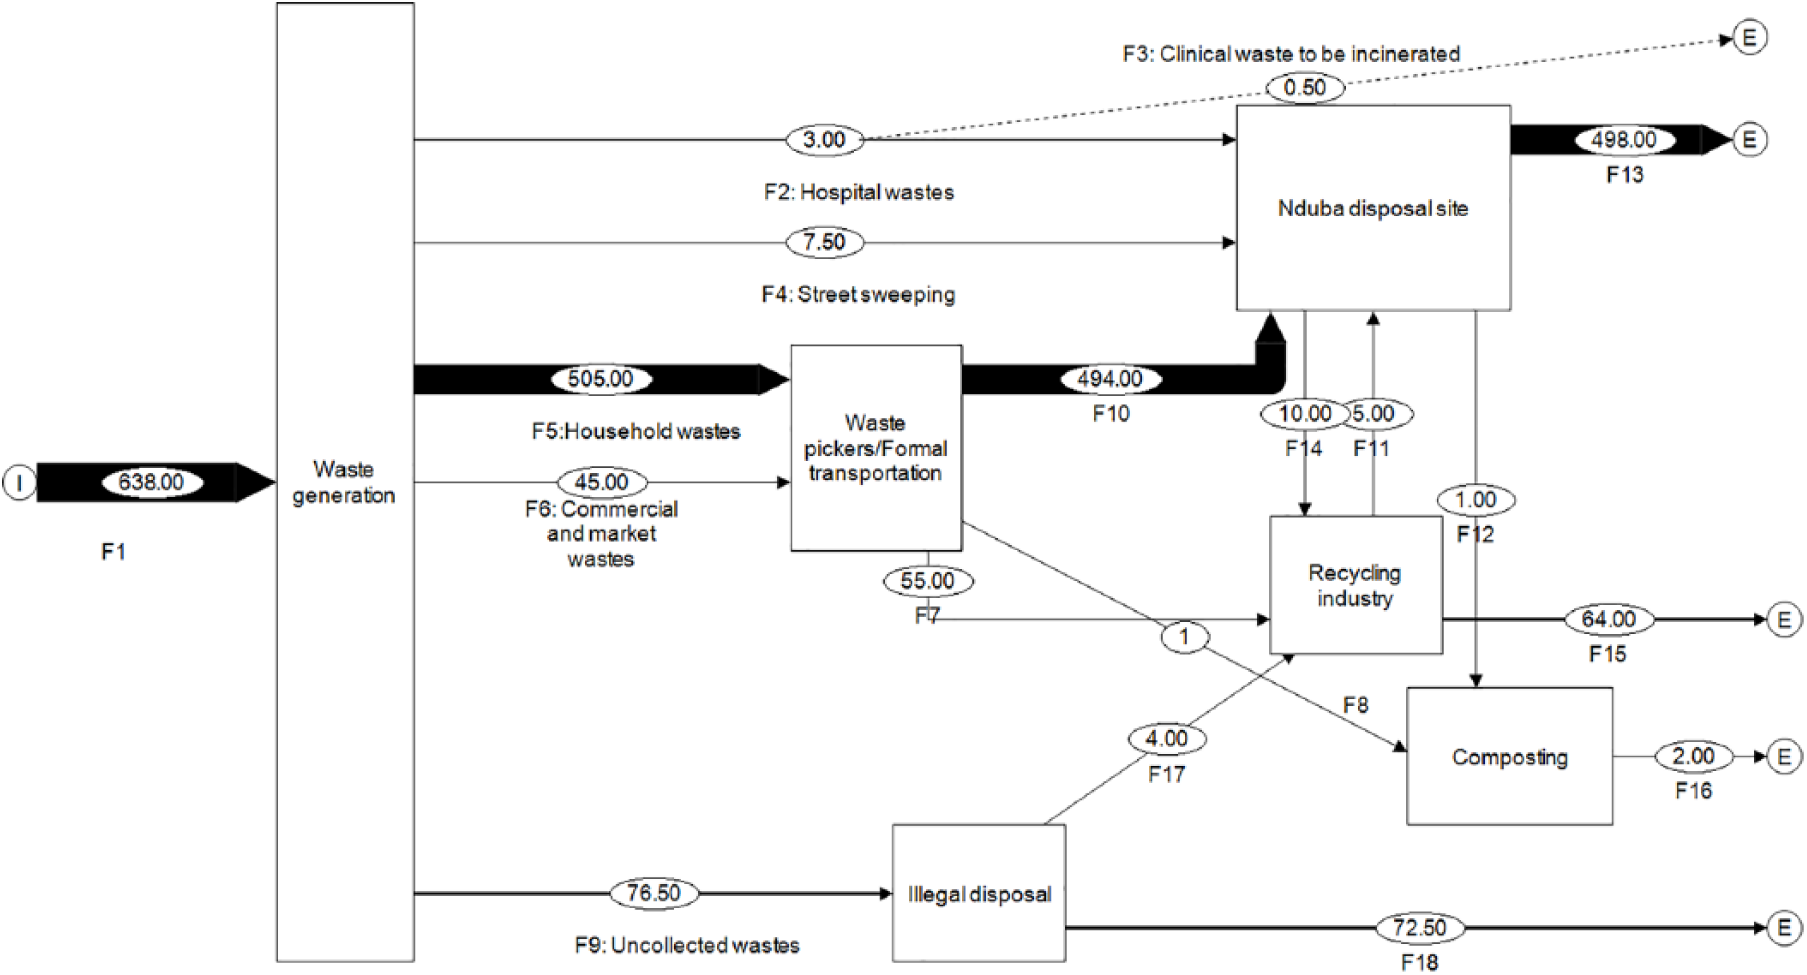
Sankey-type material flow diagram (MFD) for municipal solid waste in Kigali. The thickness of the flow corresponds to the weight of the waste (tonnes per day). The sources and methods used to estimate each flow in the MFD are summarized in Table 1.
Basis for calculating the waste flows for Kigali in the material flow diagram (MFD) (Figure 3).
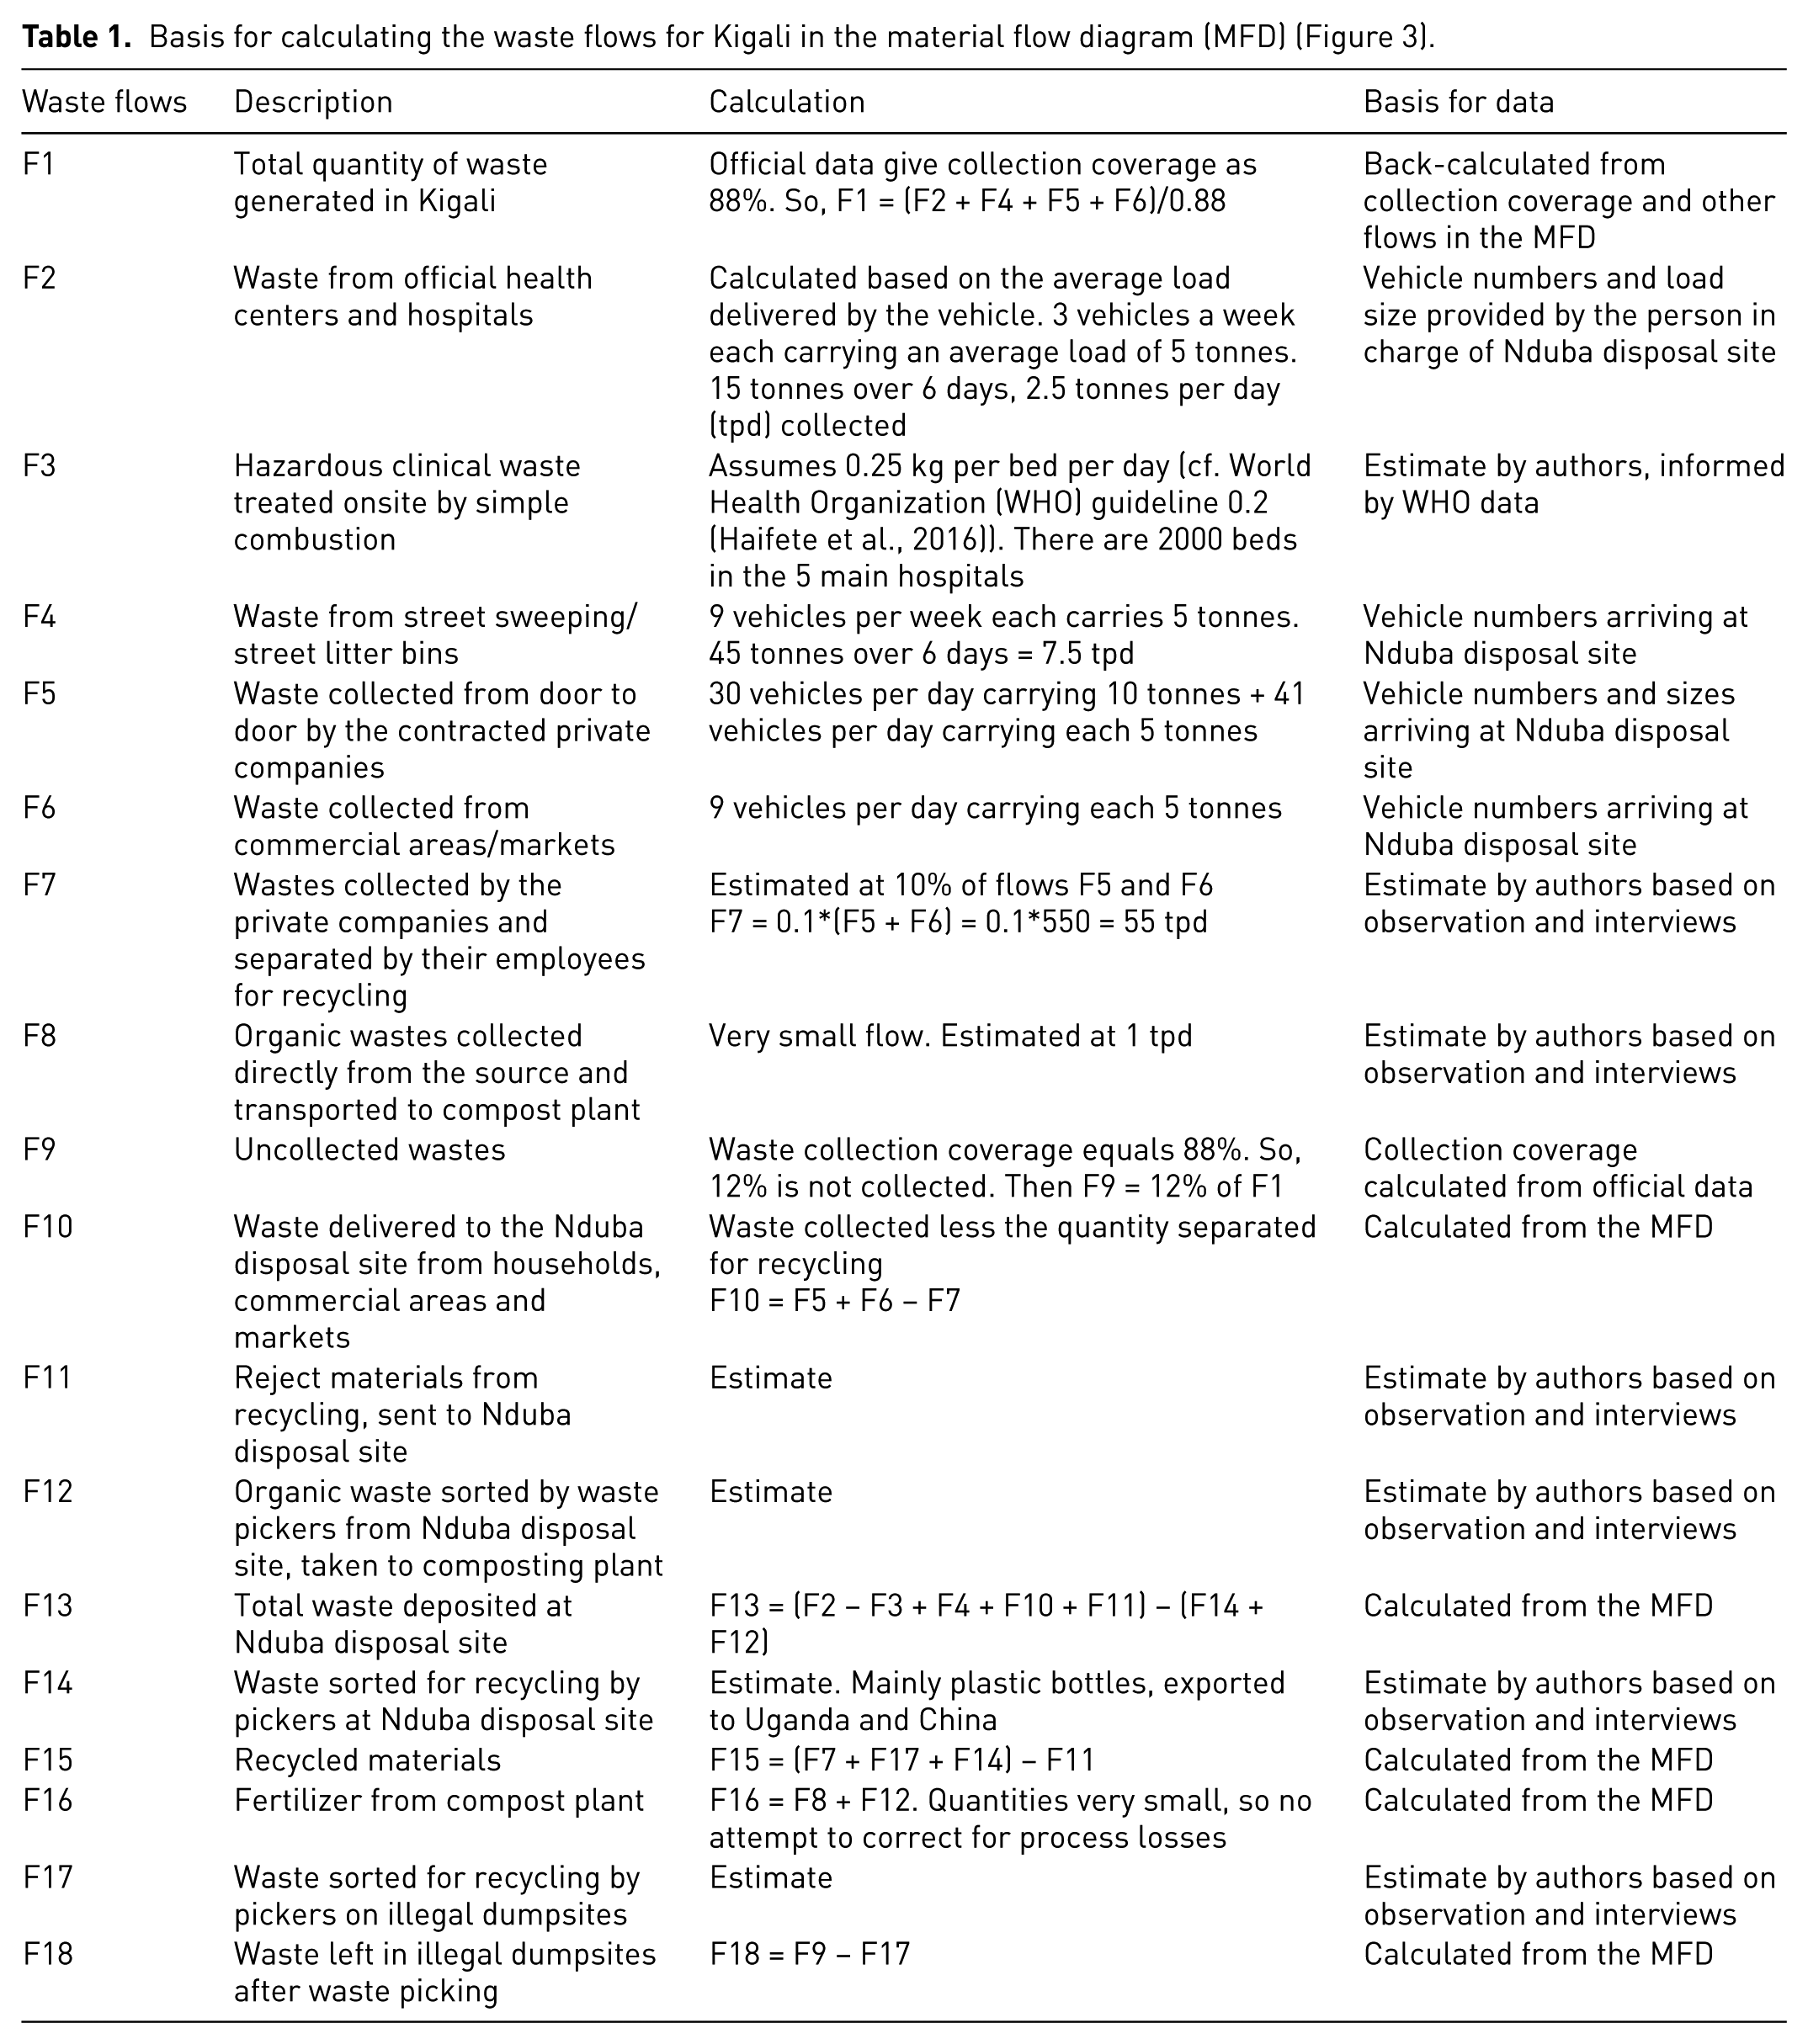
There is an acute lack of data on waste management and recycling in Kigali. There are no weighbridges in daily use, so use had to be made of data on the number of vehicles arriving at the disposal site from each source and on average loads. In 2014, vehicles were weighed at Nduba disposal site and only two types of vehicles were distinguished: one type carries 10 tonnes on average and the other 5 tonnes. This information was obtained from the interview with the supervisor of the Nduba disposal site and confirmed by the person in charge of SWM in the city of Kigali. Many other flows were estimated based on observations and interviews with a wide range of stakeholders, while others were calculated from the MFD.
Total waste generation is seldom measured. Here it is back-calculated from estimates of the quantities of waste collected and of collection coverage. Householders and businesses are forced to make their own arrangements for uncollected wastes – generally by illegal dumping.
Systems analysis of the MSW management and recycling system in Kigali
This section uses the results of applying the Wasteaware indicators to present a systems analysis of the combined municipal SWM and recycling system in Kigali. After estimating waste generation and composition, the physical components and governance factors shown in Figure 1 are considered in turn. The discussion is informed by the Wasteaware results; tables taken from the Indicator Form are presented summarizing our assessment of performance against the defined criteria. Two tables are included in the text as examples, while the others can be found in the Supplementary Information, which also contains a summary of the scoring systems used for deriving the qualitative indicators and the ‘traffic lights’ system used to visualize the results.
The summary results from applying the Wasteaware indicators to Kigali are presented alongside those for the other East African cities as Table 4 in Section 5 of the paper.
Waste generation and composition
The MFD (Figure 3) estimated waste generation at 638 tonnes per day (tpd), or 233,000 tonnes per year. This corresponds to a per capita MSW generation of 0.57 kg/day, or 205 kg/year.
The city of Kigali is aware of only one reliable waste composition analysis for Kigali, which was conducted as part of a detailed design study for a new sanitary landfill site and recycling center (WAT, 2012). The MSW planning study published the same year did not measure waste composition directly but instead used figures ‘typical for a low-income country’ (BURGEAP, 2012). The data used here are based largely on the local data: organics 70% by weight; paper and cardboard 5%; and plastics 5%. The main disagreement between the two studies is for metals − 1% measured locally versus a 3% ‘typical’ figure. As the aim here is to estimate waste composition ‘as generated’ rather than ‘after recycling,’ the higher 3% figure is used. No data are available for waste density, moisture content, or calorific value.
Waste collection
Kigali is one of the cleanest cities in Africa (Swaliafrica, 2016). Table 2 summarizes the Wasteaware assessment of waste collection and street cleaning performance as an example of how the methodology is applied.
Assessment of waste collection in the city of Kigali using the Wasteaware indicators.
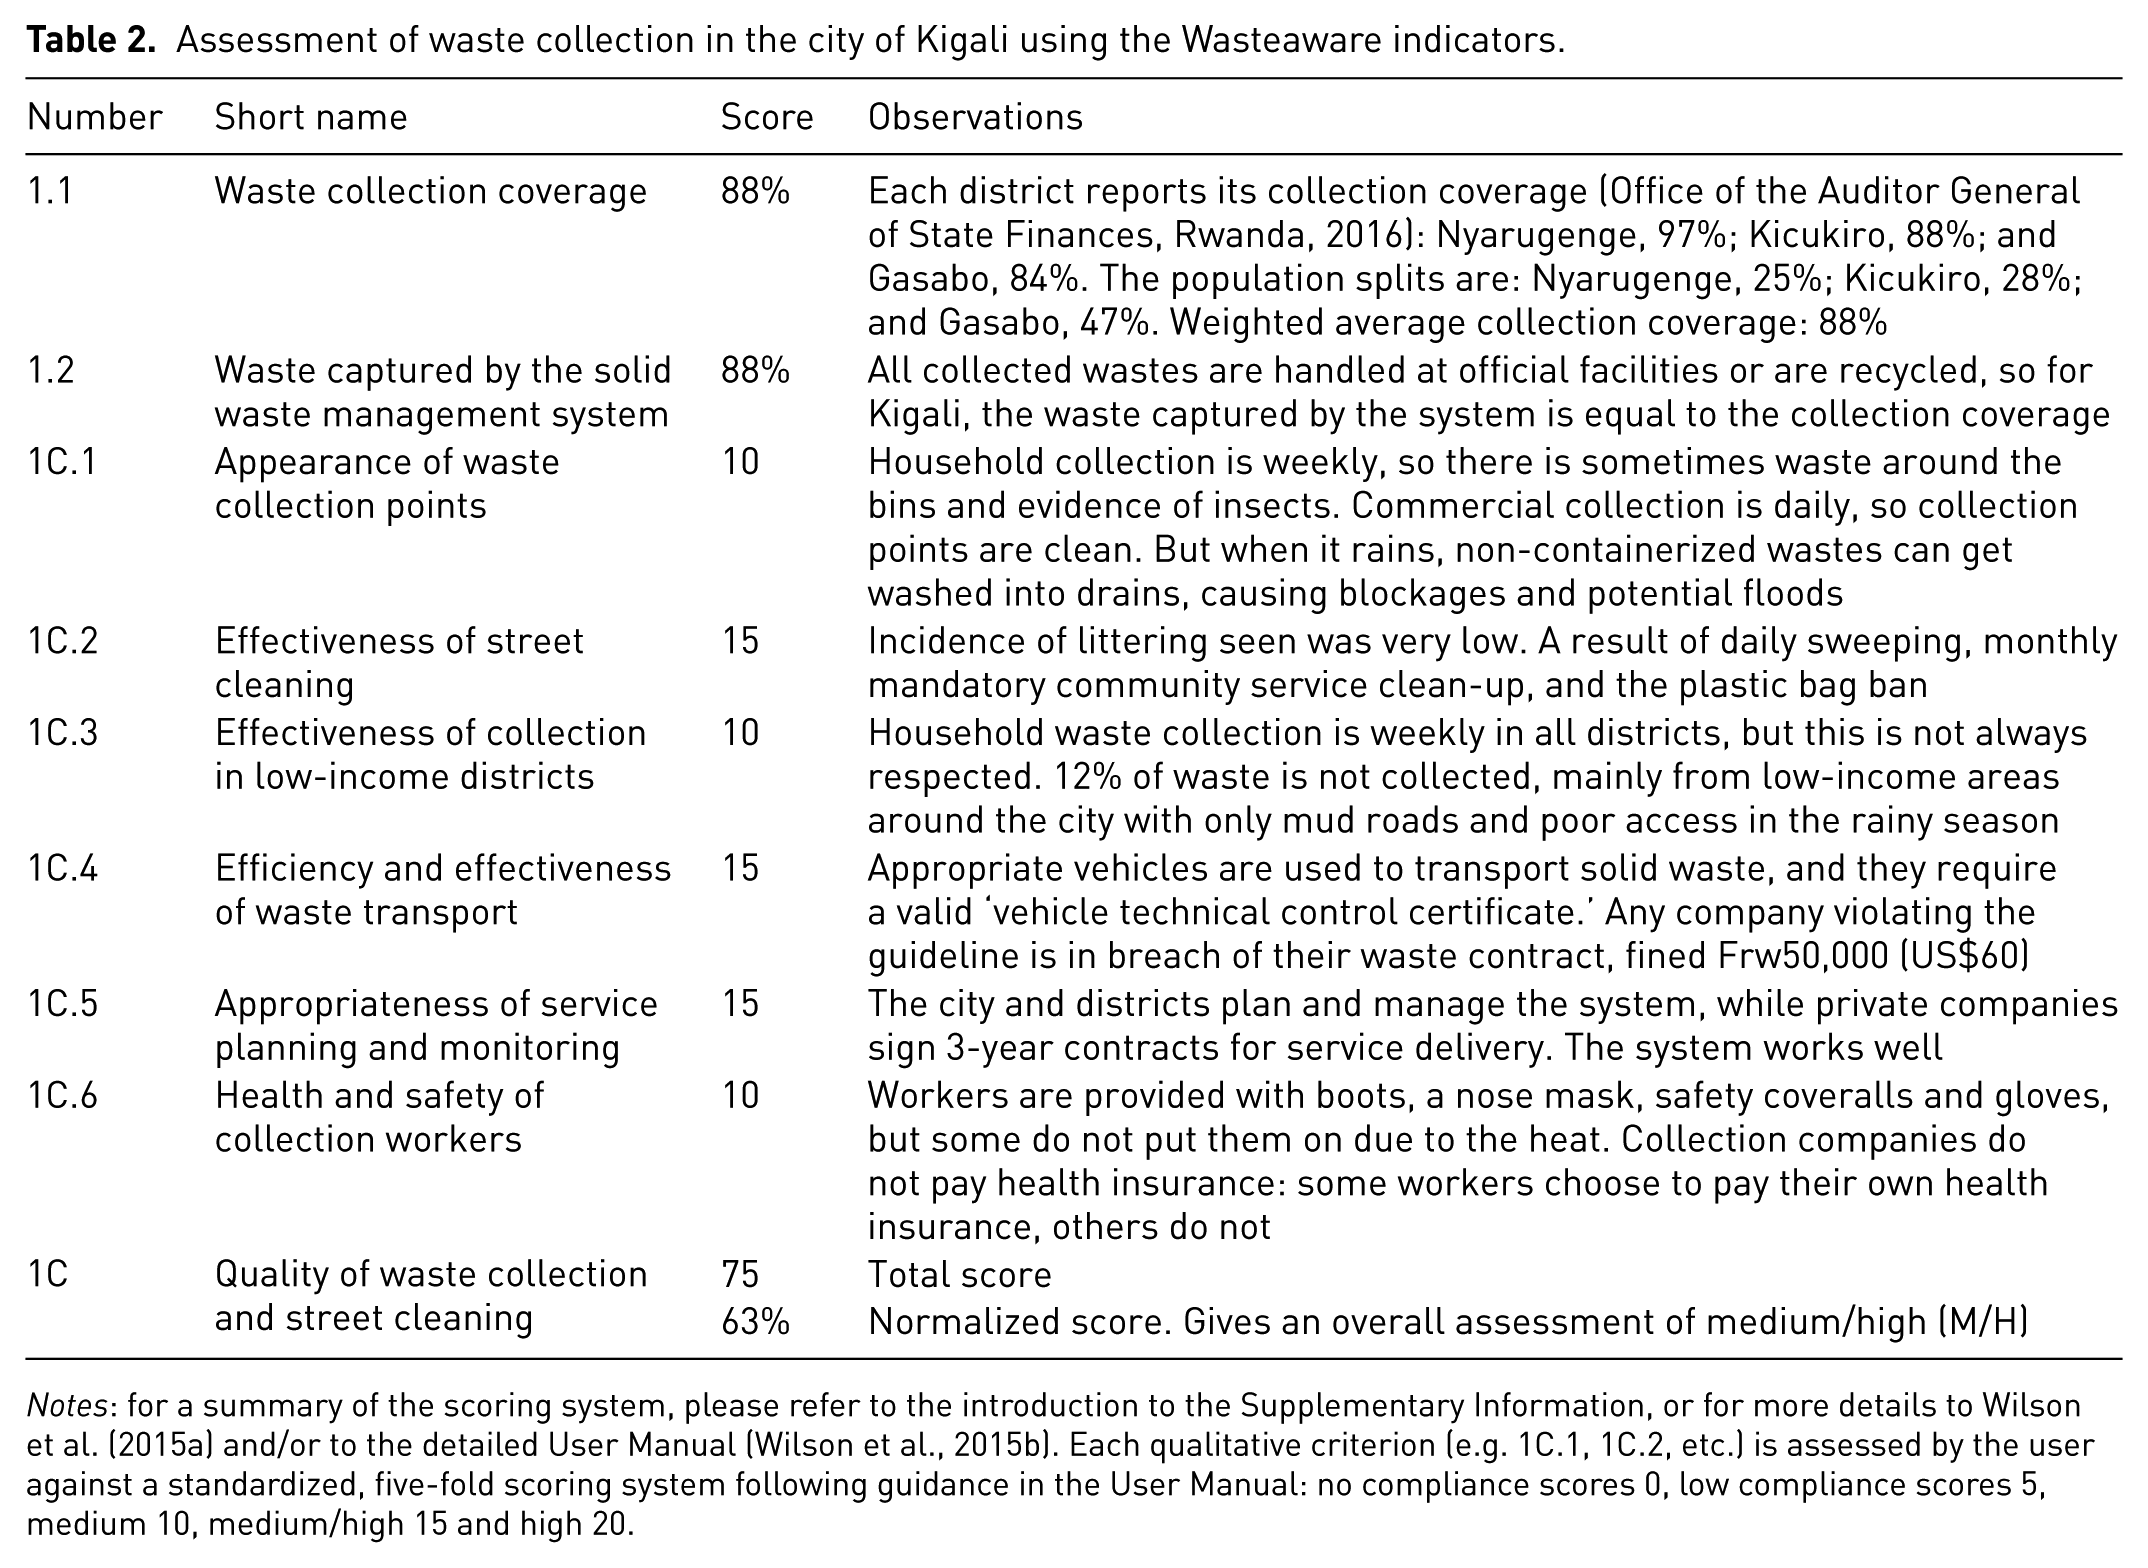
Notes: for a summary of the scoring system, please refer to the introduction to the Supplementary Information, or for more details to Wilson et al. (2015a) and/or to the detailed User Manual (Wilson et al., 2015b). Each qualitative criterion (e.g. 1C.1, 1C.2, etc.) is assessed by the user against a standardized, five-fold scoring system following guidance in the User Manual: no compliance scores 0, low compliance scores 5, medium 10, medium/high 15 and high 20.
The framework is set by the city of Kigali and administered by the three districts. Services are provided by twelve private solid waste collection companies, alongside seven private liquid waste collection companies, each of which competes every three years for a franchise to serve one of the 35 sectors. Each district reports its collection coverage (Office of the Auditor General of State Finances, Rwanda, 2016), defined as the percentage of households who both receive and pay for the solid waste collection service; the overall collection coverage, calculated as the weighted average based on relative populations of the three districts, is 88%.
The basic system is that householders store their waste in individual containers, which are collected door-to-door once a week; while commercial areas and markets use communal containers (sizes of containers are 60, 120, 240, 660, and 1,100 liters) or walled collection bays (measuring 7 m × 4 m × 2.5 m), from which waste is collected daily.
As shown by the Wasteaware assessment in Table 2, the system works reasonably well, with three medium/high compliance scores of 15/20 and three of 10/20, giving an overall medium/high assessment for the quality of waste collection and street cleaning. Strengths include generally clean streets, due to a combination of main roads being swept daily; the mandatory monthly clean-up campaign ‘Umuganda’; and a ban on all manufacturing, use and sales of polythene bags since 2008 (Kagire, 2013). Weaknesses include poor access to some peri-urban areas which are only served by mud roads, which are often impassable in the rainy season. In addition, not all wastes are containerized while awaiting collection, so in heavy rainfall wastes can get washed into open channel drains and waterways. Blockages caused in this way are blamed for regular floods in the Nyabugogo area, which disrupt two very busy roads connecting Kigali to the Northern and Southern provinces (Nizeyimama, 2016; Ministry of Environment, 2013). These floods killed three people in 2013 (IGIHE, 2013) and cost local businesses Frw178m (approximately US$ 200,000) annually (The New Times, 2016).
Waste treatment and disposal
There is only one disposal site in Kigali, called Nduba after its location in Gasabo district. The site started operations in 2012 and is run by the city. The quantitative Wasteaware indicator is Controlled treatment or disposal, which is defined as the percentage of the total MSW destined for treatment or disposal which goes to at least a ‘controlled’ treatment/disposal site. The threshold for classification as a controlled site is that it should score at least 10 out of 20 on all three ‘degree of control’ criteria, covering: waste reception and general site management; waste treatment and disposal; and monitoring and verification of environmental controls. When scored according to guidance in the User Manual (Wilson et al., 2015b), Nduba scores the required ‘10’ on the first two criteria, but ‘0’ on the third (see Table S.1): this categorizes it as semi-controlled, below the threshold set for controlled disposal.
A detailed design report was published shortly after the opening of Nduba for a modern sanitary landfill and recycling center (WAT, 2012), but this has not yet been moved forward. Rwanda Compost Ltd secured a 25-year concession from the city of Kigali to build and operate a composting facility at Nduba in 2014, but the city terminated the contract in 2015 for non-compliance. Apart from Nduba, there are two small private compost facilities in Kigali, and facilities at the three major hospitals for the simple combustion of hazardous clinical waste without any emission controls.
As the only controlled treatment or disposal in Kigali is arguably the two small composting plants, which handle just 0.4% of the waste, the Wasteaware ‘controlled disposal’ indicator is rounded down to 0%. Table S.1 shows poor to medium performance for the city of Kigali on all the quality criteria, so that indicator 2E, the degree of environmental protection in treatment and disposal, is rated low/medium.
Resource value
A new system for separate collection of recyclable wastes segregated by the households at source was introduced in 2008 and worked fairly well for a period. However, the new recycling facility proposed for Nduba in 2012 was not built, and householders became disillusioned with inconsistent collection and also expected to be paid for the segregated materials. Currently all recycling is from mixed wastes, either by collection workers employed by the private companies, or by pickers working at Nduba or at illegal dumpsites.
The official recycling rate for Kigali is just 2% (Office of the Auditor General of State Finances, Rwanda, 2016). However, the MFD in Figure 3 provides our best estimate that 74 tpd is recycled, equivalent to a recycling rate around 12%. Table S.2 also calculates the quality of recycling (indicator 3R); some scores are low as recycling is from dirty mixed wastes, while others are medium as most recycling is by employees of the official waste collection companies. The overall assessment is low/medium.
Governance
User inclusivity
Table 3 shows the benchmark indicator for user inclusivity, which assesses the degree of citizens’ and other waste generators’ inclusion in the waste management system. The overall assessment is medium/high. Access of users to services is generally good. Numerous systems are in place for citizens to make their voices heard, including environmental committees at four levels of local government from the ‘cell’ upwards, which then pass on their concerns either at formal monthly meetings with sector officials, or through the monthly ‘Umuganda’ community service day.
Wasteaware assessment for degree of user inclusivity in Kigali.
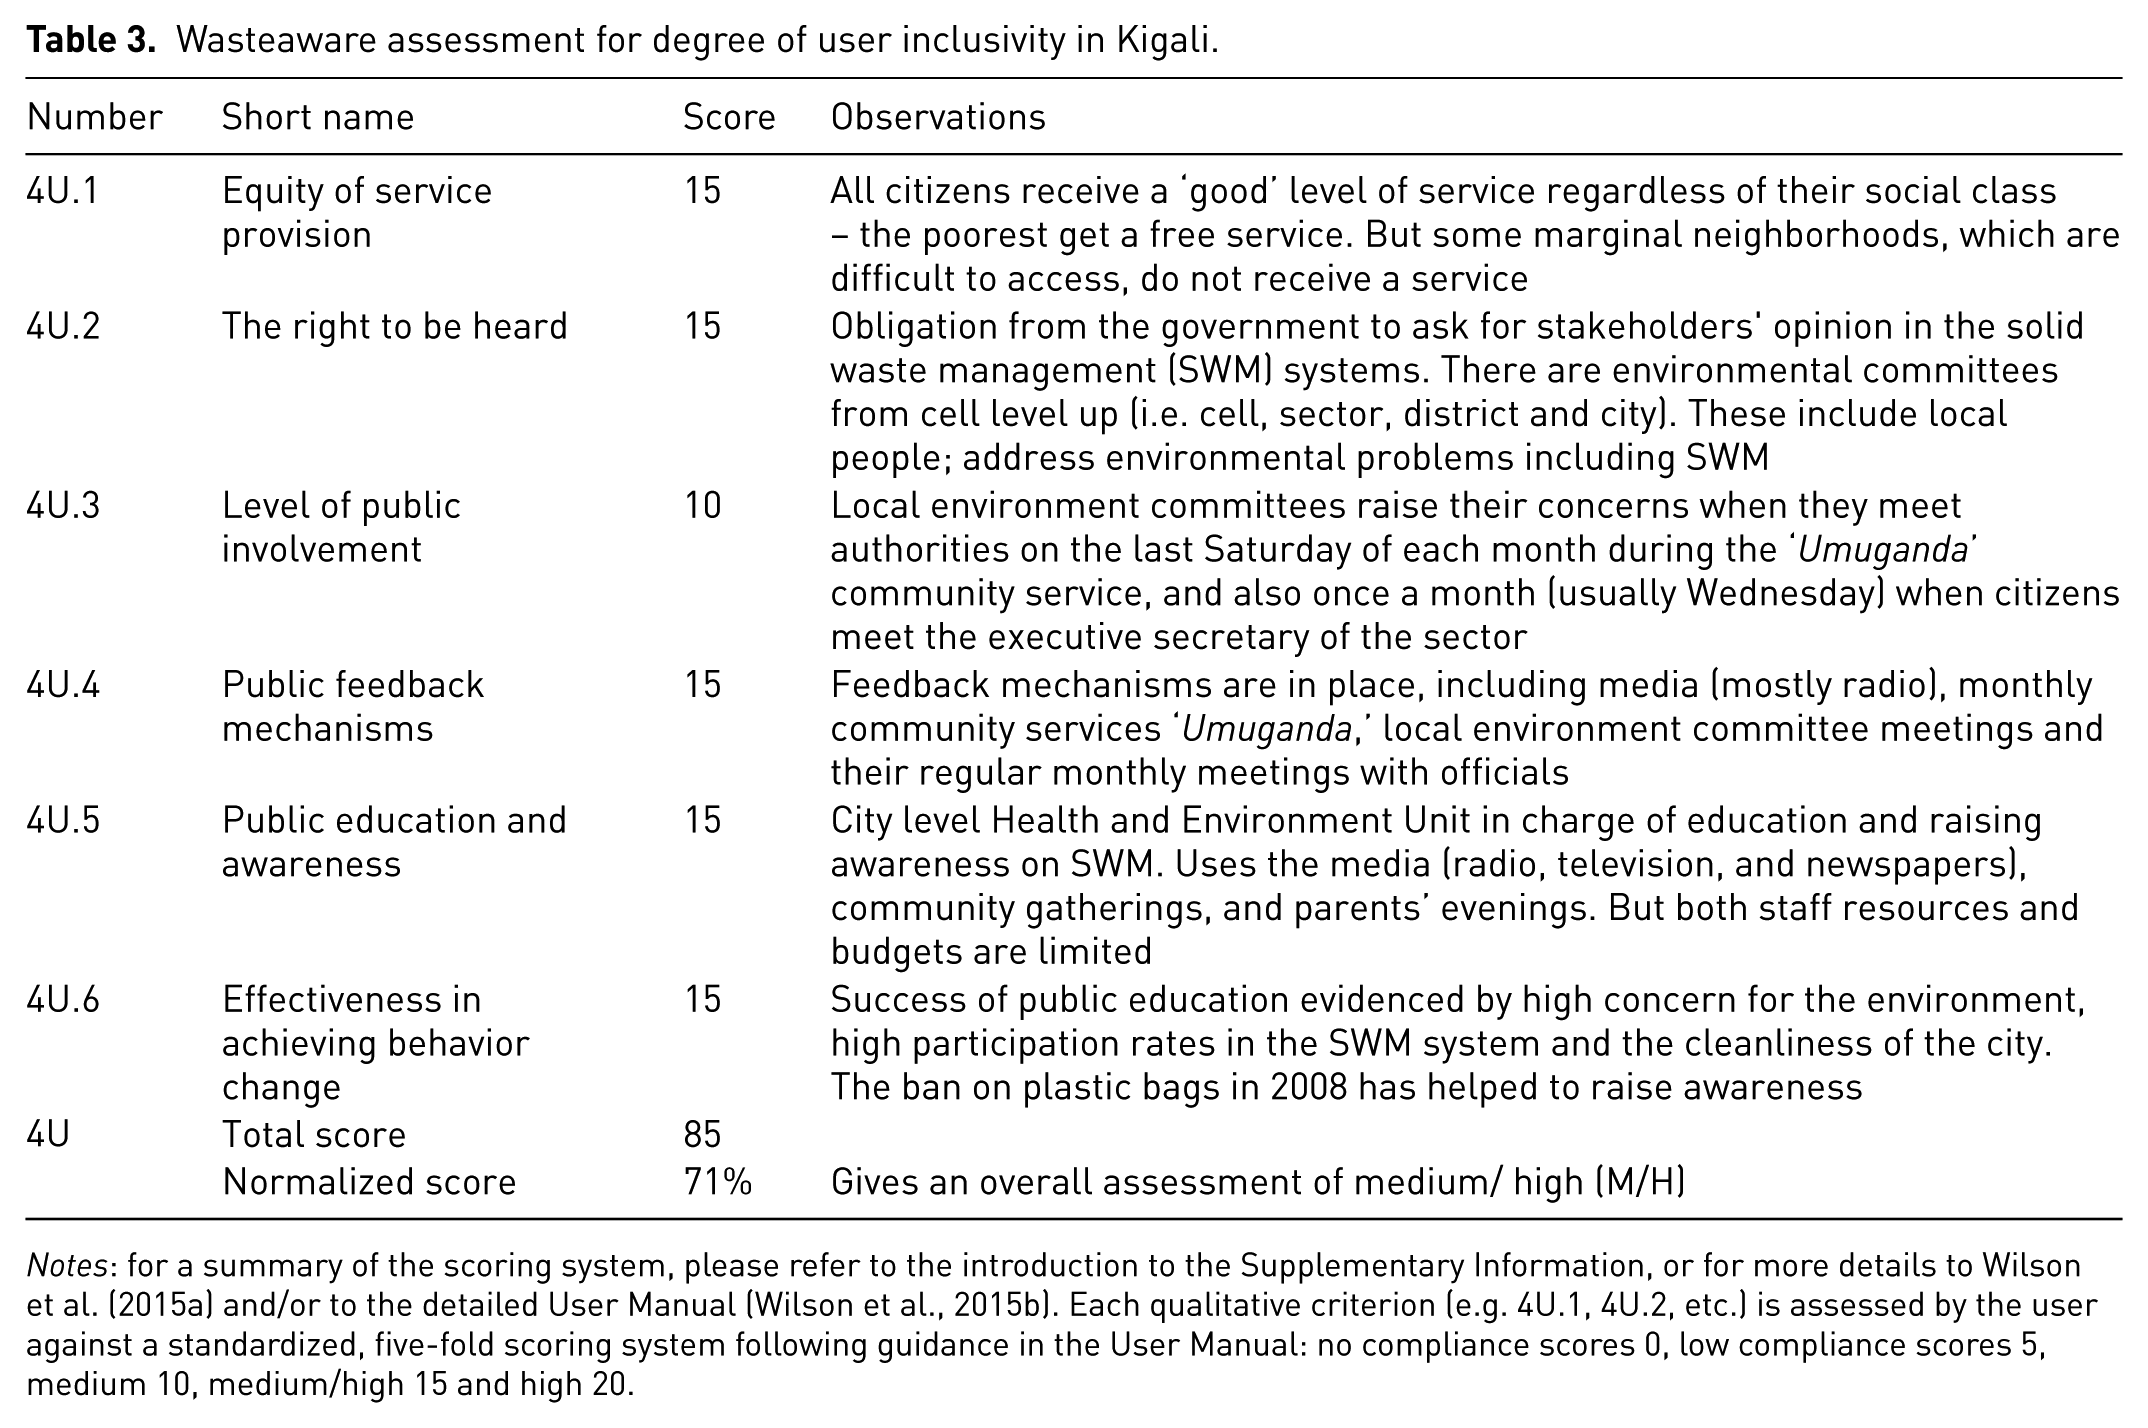
Notes: for a summary of the scoring system, please refer to the introduction to the Supplementary Information, or for more details to Wilson et al. (2015a) and/or to the detailed User Manual (Wilson et al., 2015b). Each qualitative criterion (e.g. 4U.1, 4U.2, etc.) is assessed by the user against a standardized, five-fold scoring system following guidance in the User Manual: no compliance scores 0, low compliance scores 5, medium 10, medium/high 15 and high 20.
The city carries out proactive public awareness and education but is constrained by lack of resources. The evidence for people actually ‘doing the right thing’ is also strong, although the earlier campaign to institute source segregation and separate collection did fail.
Provider inclusivity
The operator model used for service delivery in Kigali is distinctive. There are now 12 private solid waste collecting companies and seven liquid waste collection companies, which compete for 3-year franchises to collect exclusively in the 35 sectors which make up the three districts within Kigali. Generally, these private companies provide a high-quality solid waste collection service. The city of Kigali directly runs the Nduba disposal site.
Table S.3 shows the benchmark indicator for provider inclusivity, which assesses the degree to which the various public and private service providers are included in planning and implementation of solid waste and recycling services. Strengths include the legal framework, the overall balance between the interests of the public and private sectors and the bid processes. One weakness is lack of recognition of the role of the informal sector. The overall assessment is medium/high.
Financial sustainability
There are two separate budgets for SWM in Kigali. The city’s budget is used to pay for operations at the Nduba disposal site. Households pay a fee for waste collection, which is collected at the cell level and paid on to the collection company.
All households pay a fair and affordable price for collection – fees are set according to their Ubudehe classification, with the poorest (Category 1) receiving a free service. The fee for Category 2 is Frw 1,000 (US$ 1.2) per month and for Category 4 (the richest) Frw 5,000 (US$ 6) per month. Householders, who either refuse to sign a contract with their local waste collection company, or to pay the bill, are fined Frw 10,000 (US$12) which is considerably more than the fees payable.
For these reasons, one would expect revenue collection rates to be moderate to high. However, an exceptionally high fee collection rate of 95% is achieved, largely because waste collection fees in most sectors are paid alongside those for regular neighborhood security patrols, which given the recent history of the country people are happy to pay for. In these sectors, the fee collectors are employed both by the cell (the municipal level below that of the sector) who receive the security fee, and by the waste collection company.
Table S.4 shows the derivation of the benchmark indicator for the degree of financial sustainability for Kigali. Most scores are medium, while those for local cost recovery and for affordability are medium/high. The overall assessment is at the high end of the range for medium performance.
Sound institutions and proactive policies: national SWM framework
Table S.5 shows the benchmark indicator which assesses the adequacy of the national framework for SWM. Most scores are medium or medium/high, giving an overall assessment of medium/high. In Rwanda, legislation, regulations, policies, and strategies on SWM are generally in place, which protect both public health and the environment in effective ways, but their implementation and enforcement is sometimes weak.
Sound institutions and proactive policies: local institutional coherence
Local government organization in Rwanda is an intricate web, extending in Kigali from the city level, through three districts, down to 35 sectors, 161 cells, and 1183 Imidugudu or villages. Table S.6 shows the benchmark indicator which assesses the institutional strength and coherence of the city’s SWM functions. Strengths include the inter-municipal co-operation between the different organizational levels, and the city-wide Master Plan. Organizational structure is rated medium, as it is clear who is responsible, but just one middle ranking officer is responsible for all SWM in the city, so one weakness is institutional capacity. Although a vehicle has been bought by the local community in each sector to monitor waste activities, during the 12 months of this study we did not observe any staff supervising service delivery. Management control and supervision is thus another weakness, as is poor data availability and quality.
Solid waste management and recycling in East Africa
In this section we use the Wasteaware database to compare performance of the MSW management and recycling system in five major cities across East Africa and the neighboring country of Mozambique. All five are classified by the World Bank as low-income countries: they are arranged in Table 4 in order of increasing gross national income per capita, that is, Mozambique, Uganda, Tanzania, Rwanda, and Kenya. Table 4 uses the ‘traffic light’ system to visualize the indicators, with red indicating priority areas for improvement and green good performance (see Supplementary Information for more details).
Wasteaware benchmark indicator comparison for four major cities in East Africa, plus the neighboring country of Mozambique.
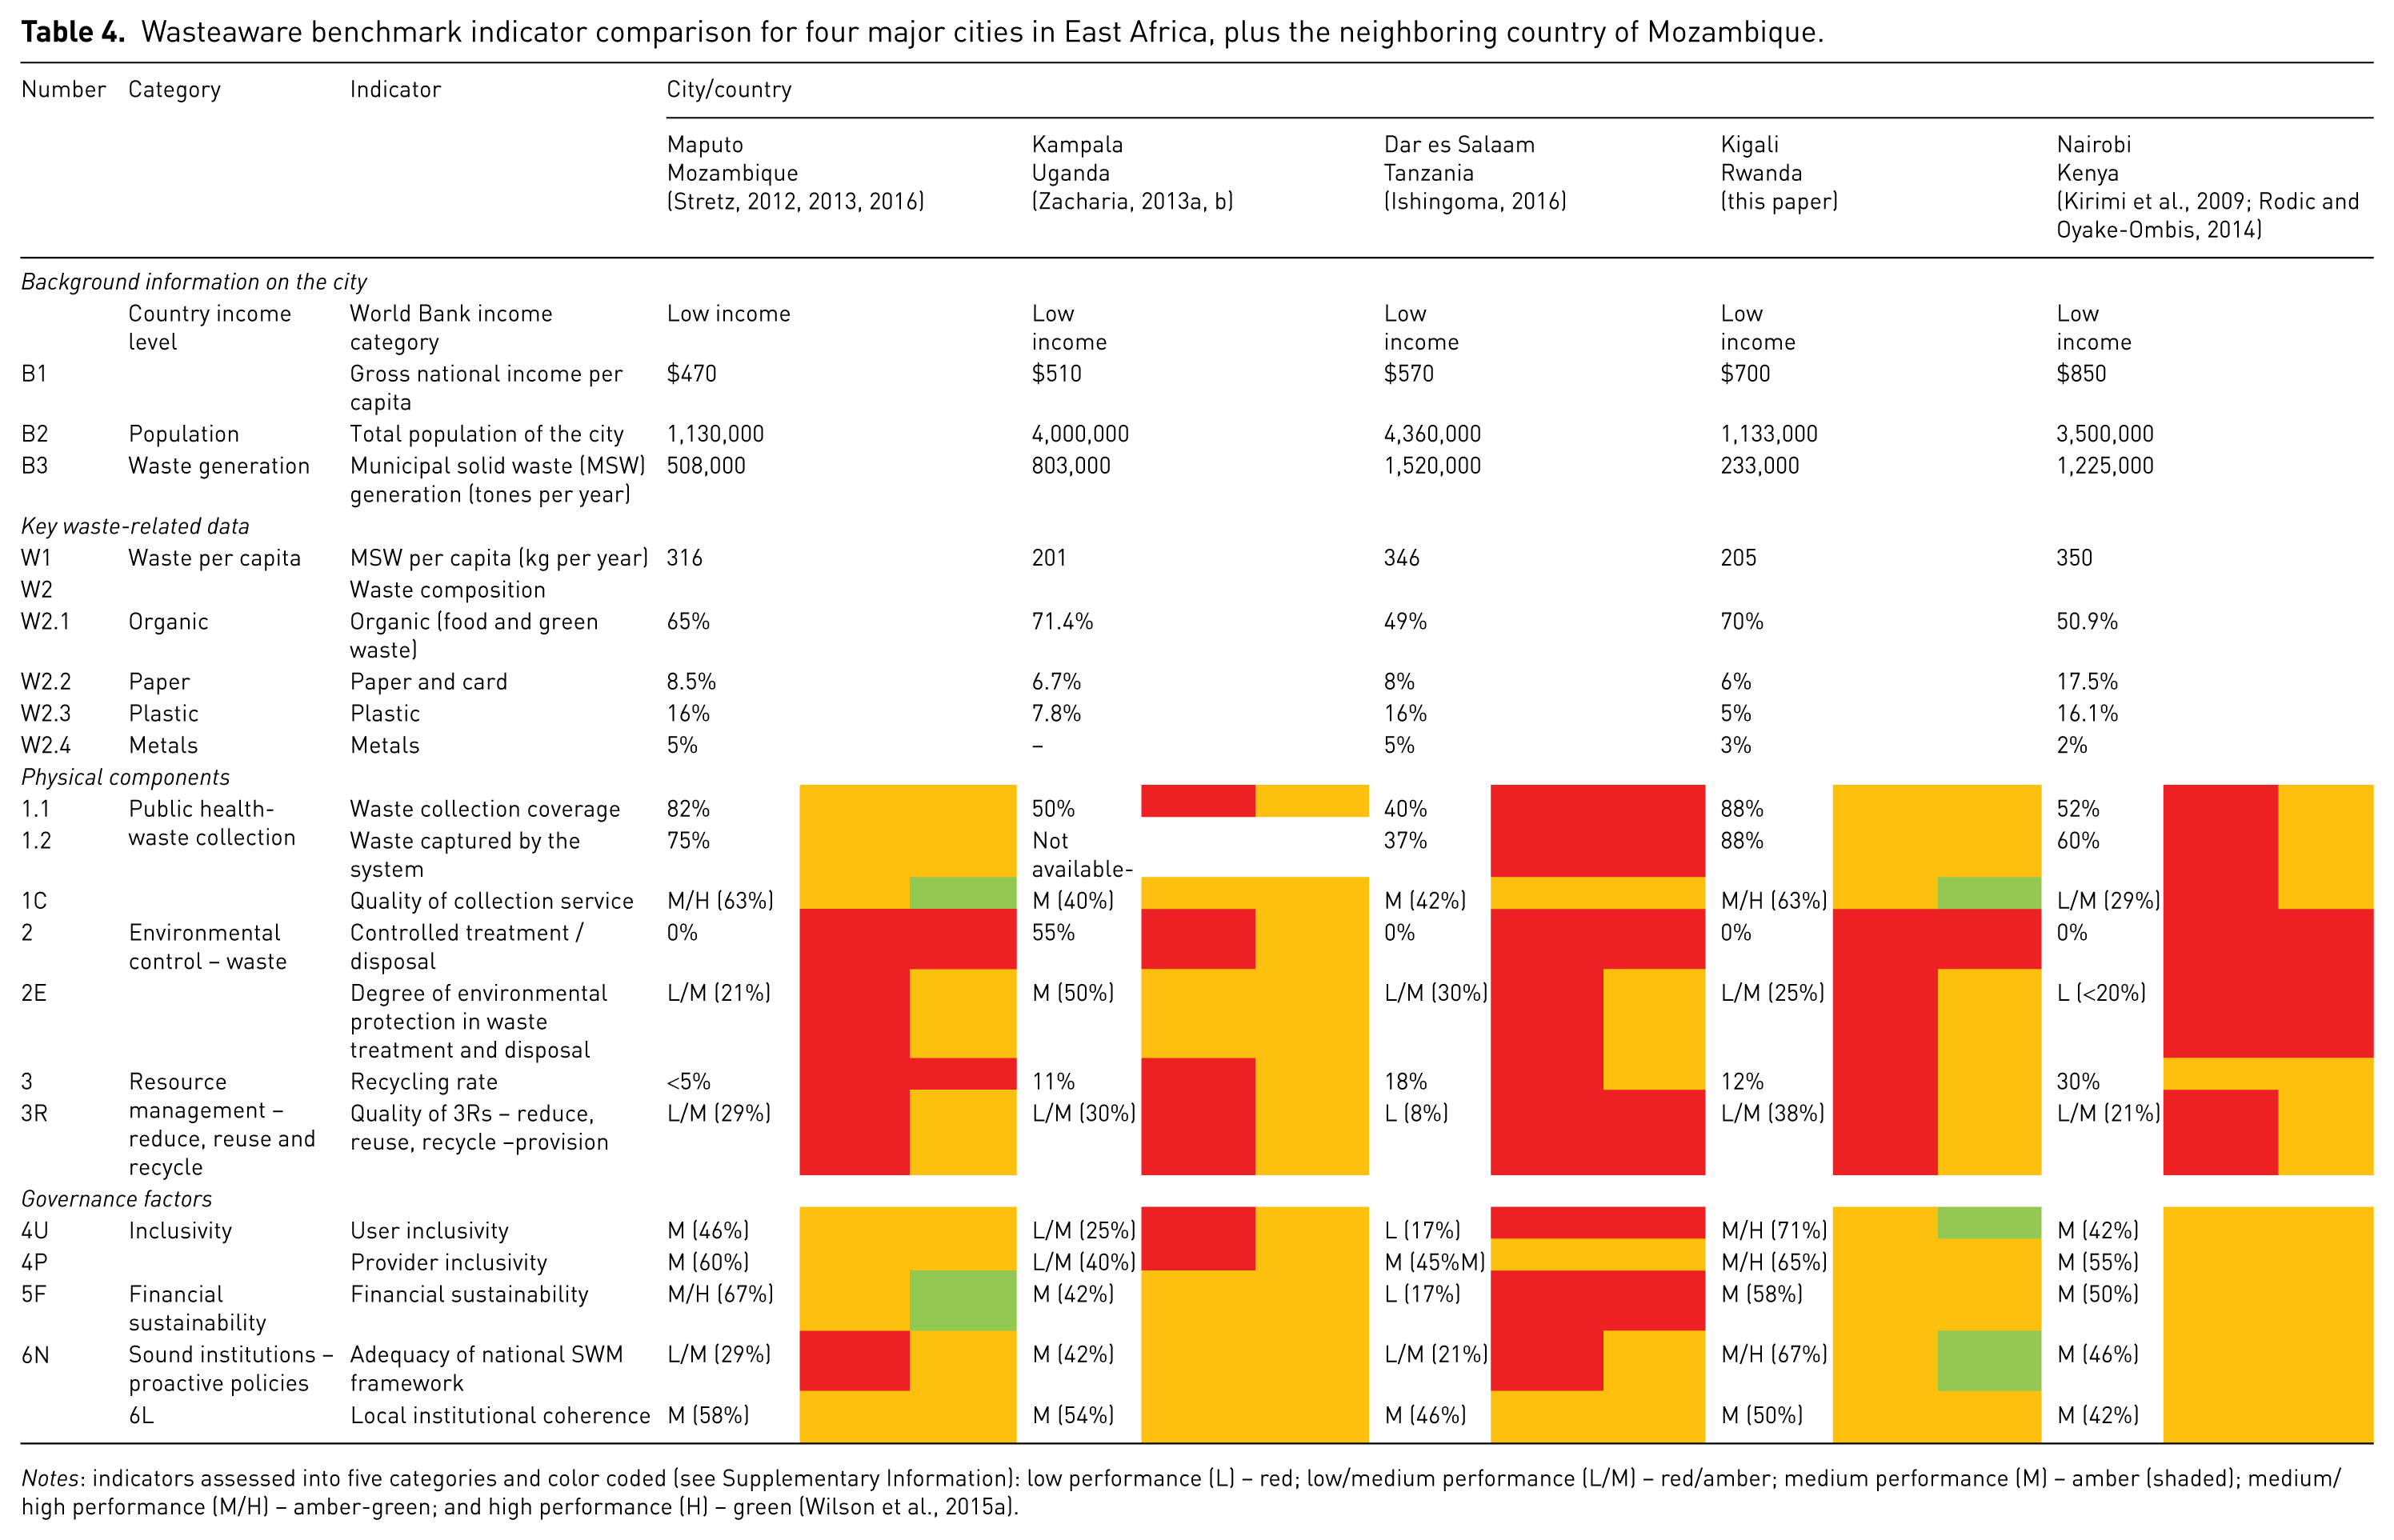
Notes: indicators assessed into five categories and color coded (see Supplementary Information): low performance (L) – red; low/medium performance (L/M) – red/amber; medium performance (M) – amber (shaded); medium/high performance (M/H) – amber-green; and high performance (H) – green (Wilson et al., 2015a).
Basic data on population and waste generation
The five cities can be separated by population into two groups, with two smaller cities around 1.1 million population (Kigali and Maputo) and three larger cities Nairobi, Kampala and Dar-es-Salaam, with populations in the range of 3 to 6 million, depending on where the city boundaries are set.
In terms of waste generation per capita, there are again two groups, with two low waste generating cities (Kigali and Kampala at around 200 kg per capita per year) and three medium waste generating cities (Maputo, Dar es Salaam, and Nairobi in the range 316 to 350 kg per capita per year). There is a clear trend of higher waste generation per capita as income levels rise; but the data for 82 countries compiled for the GWMO (United Nations Environment Programme and International Solid Waste Association, 2015) suggests that all five cities sit above the ‘trend line,’ with Maputo, Dar es Salaam, and Nairobi all appearing more as ‘outliers,’ generating much higher waste per capita than their income levels would suggest. One could conclude that Maputo and Kigali are the ‘better performing’ of the five cities, in that they have managed to ‘contain’ waste generation per capita, while waste generation levels in the other three cities are more typical of a middle-income rather than a low-income city. The only caveat here is that, in common with many similar cities, Kigali does not routinely weigh its wastes, so the data in this paper are based on estimates. However, we are confident that our MFD has been systematic, and that the overall estimate of waste generation is in the right ball-park.
It is also possible to use Table 4 to compare waste composition across the region. As one would expect for low-income countries, the organic content is high, ranging from 49% to 71%. However, beyond that, it is difficult to interpret the figures, owing to doubts about the quality and comparability of the data for the five cities. We suspect that waste composition has not been measured at the same point in the system: in most cases, measurement is likely to be of waste after recycling and/or as delivered to the disposal site, while the data for Nairobi come rather from a study of waste composition as generated by households, prior to recycling (Kasozi and van Blottnitz, 2010), with paper at 17.5% (compared to 6–8% in the other cities) and plastics at 16%. Several East African countries have been world leaders in implementing bans on plastic bags, in particular Danielsson (2017), Tanzania (originally 2006, Clapp and Swanston, 2009; extended in 2016 – Waweru, 2018) and Kenya (2017 – Reuters, 2017), but unfortunately the data here are not good enough (or in some cases, recent enough) to investigate any links between such bans and the plastic content in MSW.
Physical components
Two of the cities stand out in terms of collection coverage – Maputo at 82% and Kigali at 88% – with the others in the range 40–52%. The same two cities also score higher on quality of collection with a medium/high assessment. Maputo achieved this in 2011, despite being in the lowest income of the five countries, through a technical assistance program in collaboration with the German agency GIZ and investment from the World Bank (Stretz, 2012, 2013). Five distinct operator models were used for collection, designed to be appropriate to local circumstances, some operated by the private sector under variations of PPPs (two contracts with international companies, many more with micro-enterprises for primary collection in peri-urban areas), and some by the municipality (Wilson et al., 2017).
Kigali’s ‘high-performing’ waste collection system is interesting in several respects. One key feature highlighted here is the operator model used, with 3-year franchises being regularly tendered in each of the city’s 35 sectors. Superficially, a similar small-scale PPP approach has been used in both Nairobi and Dar es Salaam, as analyzed and reported by Wilson et al. (2017). One reason for the much higher collection coverage in Kigali may be cultural; local people in Rwanda have traditionally had a focus on cleanliness, so respond well to a well judged mixture of ‘carrots’ (a good collection service is provided), education (e.g. city hygiene campaigns, City of Kigali, 2017), and ‘sticks’ (fines for non-participation, both in the regular waste collection service and in the monthly community clean-up campaign ‘Umuganda’). A similar reason has been put forward for the generally good SWM performance of the city of Moshi in Tanzania, where the local Chaga and Pare tribes both hold cleanliness in high esteem in their culture (Scheinberg et al., 2010; Wilson et al., 2013).
Why is collection coverage lower in the other three East African cities? They are much larger cities, attracting their peri-urban populations from a much wider rural hinterland. So, one might speculate that the strong local cultural influences in smaller, more coherent cities such as Kigali or Moshi are much less apparent in the larger urban ‘melting pots.’
In terms of environmental control over waste treatment and disposal, four of the five cities score 0% controlled disposal, with a corresponding quality indicator of low or low/medium. The exception is Kampala, which uses one engineered landfill site. In the case of Kigali, the Nduba disposal site was opened relatively recently, in 2012, but falls below the threshold for controlled disposal on one of the three required quality criteria, that of the degree of monitoring and verification of environmental controls. Plans have since been made for both a modern sanitary landfill and a composting plant, but neither has yet progressed. The contrast between the progress made on extending collection coverage, and the lack of progress on eliminating uncontrolled disposal, was thrown into stark relief in Maputo when the Hulene dumpsite collapsed in heavy rain in February 2018, killing 16 waste pickers and family members who lived on the site (Swingler, 2018).
In terms of recycling rates, one of the five cities have a very low rate (Maputo, <5%), three have low/medium rates in the range 10–18%, while Nairobi stands out with an estimated rate of 30%. The quality of recycling and 3Rs provision is uniformly poor (low or low/medium), with Nairobi this time performing relatively poorly compared to the other cities. Nairobi appears to act as the regional center for the recycling industry in East Africa, drawing in recyclable materials not only from the city itself but from across the region. Two reasons are a relatively reliable power supply and an active informal waste processing sector (called juakali) (Faninger, 2009; Rodic and Oyake-Ombis, 2014). In this respect, recycling in Nairobi is like the well-known example of the Zabaleen in Cairo; by coincidence, researchers have applied the tool of value chain analysis to each (Cairo – Jaligot et al., 2016; Nairobi – Majale et al., 2016).
The recycling rate estimated here for Kigali of 12% is significantly higher than the city’s official estimate of just 2%: this mirrors experience of using the Wasteaware indicators in other cities (e.g. Bishkek in the Kyrgyz Republic, Sim et al., 2013). Kigali is also interesting for a recent initiative to institute city-wide segregation of waste at source; this was a first in East Africa, even if the initial attempt ended in failure.
Governance factors
The Wasteaware indicators assess the five governance factors qualitatively using a scoring system based on five or six criteria for each. Of all the five cities, the overall performance in Kigali is the best, with three medium/high assessments, for user inclusivity, provider inclusivity and the national framework for MSW, and two medium assessments. Across the other four cities, the predominant assessment against each criterion is medium, with just one other medium/high (in Maputo), four low/medium, and two low assessments (in Dar es Salaam).
The positive assessments for Kigali are related in part to the high-performing collection system. For example, this leads to higher scores for equity of service provision (user inclusivity), for various aspects of provider inclusivity, and for local cost recovery from households and affordability of user charges (financial sustainability). Also of note is the organization of local government, with four levels below the city – the three districts are sub-divided into sectors, cells and villages – and well-established mechanisms for citizens to engage on their environmental concerns with the authorities at each level. A particular feature is the mandatory monthly community service campaign (here called ‘Umuganda’) on the last Saturday of each month which is important in terms of public involvement. This is of long standing, and again reflects the local cultural focus on cleanliness of the living environment. In East Africa, this exercise was unique to Rwanda, but the idea is now being copied by others such as Tanzania, as part of a drive against cholera (Mesomapya, 2015). Elsewhere in Africa, a similar system is in place in Nigeria (Agwu, 2012), where it was first introduced under military rule.
Conclusions and recommendations
Kigali has achieved relatively high performance on municipal SWM, especially when compared to the better known neighboring major cities in East Africa. Both its waste generation rate and that of Maputo are much lower than the other cities, and more in line with the ‘trend line’ from international comparisons, so can be considered as ‘better performers.’ The waste collection coverage in these two cities is also much higher than the other cities. Maputo has achieved this with technical assistance from GIZ and investment funding from the World Bank. Kigali has received some technical assistance, for example, from the Belgian Government to develop a SWM plan (BURGEAP, 2012) and from the United Nations Development Programme to develop the Nduba disposal site (WAT, 2012), but has developed an effective waste collection system locally, with no external intervention or assistance.
The collection system in Kigali is both interesting and relatively unusual, so in that respect this paper represents an important new contribution to the literature. The innovations and success factors are largely governance-related rather than technical – a finding that reinforces earlier work on operator models (Soós et al., 2013, 2017; Wilson et al., 2017). The system is a variation of PPP with small service providers, with 12 companies operating exclusive franchises in 35 sectors of the city, under 3-year agreements with the city. The legal framework is strong, with a robust bidding process and supervision by the Rwanda Utilities Regulatory Authority achieving a fair balance between the interests of the companies (profit) and of consumers (service quality). Households pay an affordable fee, graduated by ability to pay as determined by the Ubudehe (social class) classification, with the poorest (Category 1) receiving a free service and a graduated charge up to Frw 5,000 (US$ 6) per month for Category 4 (the richest). Fee collection rates are exceptionally high at 95%, both because the service is good and the penalties for not entering a contract with the collection company, or paying the fee, are considerably more than the monthly fee. In addition, in most sectors of the city, the fee is collected alongside that for security patrols provided by the local cell, which is a service people value highly given the recent history of the country. There are also multiple communication channels between the city authorities, the collection companies and the householders. One of those is provided by the mandatory community clean-up campaign Umuganda on the last Saturday of each month, which also helps to institutionalize the traditional local cultural focus on cleanliness.
Despite this long list of ‘strengths,’ it is also important to point out some points where the current collection system in Kigali could be further improved. Collection coverage is currently limited by poor road access to some peri-urban areas, which are inaccessible in the rainy season. Collection workers are generally only paid around the legal minimum wage, and the companies do not provide health insurance.
The net result is that the ‘home-grown’ collection system in Kigali is achieving collection coverage of 88%, better even than the 82% achieved in Maputo following a six-year technical assistance intervention led by GIZ and the World Bank, and much better than the 40–52% achieved in the larger East African cities. City population may be a factor – Kigali and Maputo are much smaller cities, and Kigali at least draws its rural migrants from a much smaller catchment area, so that local cultural drivers (of which cleanliness is one) are much stronger.
The main purpose of the Wasteaware indicators is to benchmark SWM and recycling performance in cities on a common basis, thus allowing consistent comparison between them and highlighting key areas for improvement moving forward. Extending collection coverage to unserved areas is a particular priority in Dar es Salaam, Kampala, and Nairobi. Eliminating uncontrolled dumping and open burning, and instituting controlled disposal as an interim step, is a priority across East Africa, although less so in Kampala which already has one controlled site. Similarly, it is important to increase recycling rates across East Africa – only Nairobi has a strong base to build on. The informal sector recycling industries in Nairobi are interesting, being comparable to but much less well known than those of the Zabaleen in Cairo.
On governance, the general performance across the region is moderate, and good in Kigali. It is arguable that, if one removed the higher scores in Kigali and in Maputo that are associated with their strongly performing waste collection system, general performance across all five cities would be similar. However, one should note that low fee collection rates from households are a significant issue across the larger East Africa cities, one which both Kigali and Maputo have addressed successfully.
One common feature, and arguably a strength of the national regulatory framework, across several East Africa countries is their focus on reducing plastic bags, at least partly to address the issue of littering, blocked drains, and flooding. The ban in Rwanda has been in place since 2008 and is viewed as both well enforced and effective. Restrictions in Tanzania have been in place since 2006 but were significantly extended in 2016. That in Kenya is both the most recent and arguably the most draconian.
Two additional governance weaknesses appear across all four of the East Africa capital cities but have been at least partly addressed in Maputo through their technical assistance projects. One of these is on waste data – which are both lacking and unreliable – which in turn makes management and planning very difficult. To take Kigali as an example, wastes are not routinely weighed, so that waste generation must be estimated using data on numbers of vehicles and one sample weighing exercise – our use of a MFD helps, but it is inevitable that uncertainties remain. Similarly, waste composition is not routinely measured, and there are no data on waste density or moisture content.
The other common weakness is institutional capacity, and its knock-on effect on weak supervision and monitoring of service provision. Again, to take Kigali as an example, there is only one trained SWM officer across the five administrative levels of the city of Kigali, and although each sector has its own vehicle for service monitoring, we did not see evidence for such monitoring during this research.
In conclusion, much still needs to be done to improve SWM performance in East Africa. Much can be learned by its neighbors from the relatively high performance of waste collection in Kigali. All the cities need to prioritize controlled waste treatment and disposal, in particular the elimination of uncontrolled dumping and open burning. And both the quantity and the quality of recycling should be increased; one priority would be to increase segregation at source and separate collection, learning from a previous unsuccessful attempt in Kigali.
Supplemental Material
Corrected_WMR-18-0577_-_Kabera_-_Supplemental_material – Supplemental material for Benchmarking performance of solid waste management and recycling systems in East Africa: Comparing Kigali Rwanda with other major cities
Supplemental material, Corrected_WMR-18-0577_-_Kabera_-_Supplemental_material for Benchmarking performance of solid waste management and recycling systems in East Africa: Comparing Kigali Rwanda with other major cities by Telesphore Kabera, David C Wilson and Honorine Nishimwe in Waste Management & Research
Footnotes
Acknowledgements
We would like to thank Mr John Mugabo from the city of Kigali, Mr Fred Nuwagaba, Supervisor at Nduba Dumpsite and Mr Paulin Buregeya, Chief Executive Officer of COPED who spent many hours in open and frank discussions during data collection. We also acknowledge the authors of the Wasteaware indicators for the comparative cities, including Joachim Stretz (Maputo), Solomon Zacharia (Kampala), Alodia Inshegoma (Dar es Salaam) and Leah Oyake-Ombis, Misheck Kirimi and Ljiljana Rodic (Nairobi); and Ljiljana Rodic also for her assistance and moral support in moderating the benchmark indicators in the Wasteaware database.
Declaration of conflicting interests
The authors declared no potential conflicts of interest with respect to the research, authorship, and/or publication of this article.
Funding
The authors received no financial support for the research, authorship, and/or publication of this article.
Supplemental material
Supplemental material for this article is available online.
References
Supplementary Material
Please find the following supplemental material available below.
For Open Access articles published under a Creative Commons License, all supplemental material carries the same license as the article it is associated with.
For non-Open Access articles published, all supplemental material carries a non-exclusive license, and permission requests for re-use of supplemental material or any part of supplemental material shall be sent directly to the copyright owner as specified in the copyright notice associated with the article.