
Abstract
Solid waste management has witnessed much progress in recent years with considerable efforts targeting the reduction of associated impacts and carbon emissions. Such efforts remain relatively limited in developing economies due to inefficient management practices. In this study, a life cycle assessment (LCA) approach is adopted to identify integrated systems with minimal impacts and reduced emissions in a developing context coupled with an economic valuation and sensitivity analysis to assess the effect of varying influencing parameters individually. The results showed that the highest impact arises from landfilling with minimal material recovery for recycling and composting, while incineration coupled with energy recovery contributed to the least equivalent emissions (–111% with respect to baseline scenario) at a varying cost of −70% to +93% depending on the selected technology and the value of carbon credit. Optimizing material recycling, composting and landfilling with energy recovery contributed to 98% savings in emissions (with respect to baseline scenario) and remained economically attractive irrespective of the carbon credit exchange rate of 0.5–50 US$/MTCO2E. The sensitivity analysis showed that an improvement in landfill gas collection efficiency (up to 60%) can contribute to major savings in emissions (58%). The application of the LCA-based approach supports the development of integrated viable plans while quantifying advantages and disadvantages towards decision-making and policy-planning.
Keywords
Introduction
Population growth, development, and limited land resources around urban areas are curtailing waste management efforts in cities with inadequate planning policies (Arena et al., 2003). As such, solid waste is increasingly raising serious challenges and environmental concerns due to inefficient systems particularly in developing countries where landfilling remains the preferred route due primarily to economic factors or lack of technical expertise in other alternatives (e.g., biological and/or thermal treatment). The impacts of conventional landfilling have been long documented (El-Fadel et al., 1997). Its contribution to greenhouse gas emissions reaches ~3% worldwide and up to 15% in developing economies (Blanco et al., 2014). Thus, the proper selection of waste processing technologies through an integrated waste management system with minimal impacts and reduced emissions is imperative. In this context, the life cycle assessment (LCA) approach has been recognized as a valuable tool widely adopted as an internationally standardized method (International Organization for Standardization, 2006a, 2006b) that is effective in quantifying environmental impacts of management alternatives, thus contributing towards the decision-making process through the comparison of various systems. Accordingly, several LCA-based accounting tools have been developed for estimating emissions from such systems (Gentil et al., 2010; Laurent et al., 2014a, 2014b). Recent efforts targeted LCA applications in the environmental assessment of waste management. Many of these efforts focused on developed economies (Di Maria and Sisani, 2017; Di Maria et al., 2016; Herva et al., 2014; Ripa et al., 2017; Thomsen et al., 2017; Tunesi et al., 2016) with limited applications on economies in transition or developing economies (Liu et al., 2017a, 2017b; Noya et al., 2018; Othman et al., 2013) where waste composition is different and management practices still concentrate on landfilling or open dumping (Laurent et al., 2014a, 2014b). In addition, most studies emphasized individual processes instead of integrated systems (Laurent et al., 2014a, 2014b; Tabata et al., 2010). Accordingly, this study aims to fill a gap in a developing context particularly with respect to the effect of waste composition and integrated systems. For this purpose, an LCA approach is adopted at the system level to identify alternatives with minimal environmental impacts and reduced emissions. An economic valuation, a sensitivity analysis, and comparative assessment defined economically attractive scenarios taking into consideration related carbon credit.
Materials and methods
LCA analysis
The LCA was conducted in accordance with the ISO 14040 standards (International Organization for Standardization, 2006a, 2006b) and International Reference Life Cycle Data System (ILCD) Handbook (European Commission, 2010). Accordingly, four main steps were considered in the LCA study: goal and scope definition; inventory analysis; impact assessment; and interpretation.
Goal and scope
The LCA methodology was used to compare waste management alternatives and assess corresponding environmental impacts. The test area (Beirut, Lebanon) encompasses 297 municipalities (Figure 1) with > 2M inhabitants generating 2,800–3,000 tonnes of municipal solid waste (MSW) daily with an average waste composition presented in Table 1. Waste is collected daily by a fleet of 332 collection vehicles that consume an average volume of diesel equivalent to 6.3 L/tonne of waste generated. The latter was calculated based on an overall diesel fuel consumption per year from various types of collection vehicles used in the test area. The data were used to estimate the average fuel consumed per tonne of waste collected. A comparison between international fuel consumption data and results from the test area shows that on average the resultant fuel consumption is comparable to the average reported value of 6 L/tonne of waste (Chen and Lin, 2008; Tanskanen and Kaila, 2001). When compared with other data reported in the literature from developed economies (Larsen et al., 2009), the consumption fell at the lower end of reported ranges of 6.3 and 10.1 L/tonne of waste from rural areas. However, adequate details on corresponding tested areas were not provided to allow a more accurate quantitative comparison, particularly that some studies suggest a lower range of 2.8–3.6 L/tonne of waste for high density urban areas (Nguyen and Wilson, 2010). In the local context, several factors may influence the higher fuel consumption, mainly traffic congestion that affects the number of traffic-related stops, location of transfer stations, as well as inefficient routes, and age of vehicles (Sonesson, 2000).
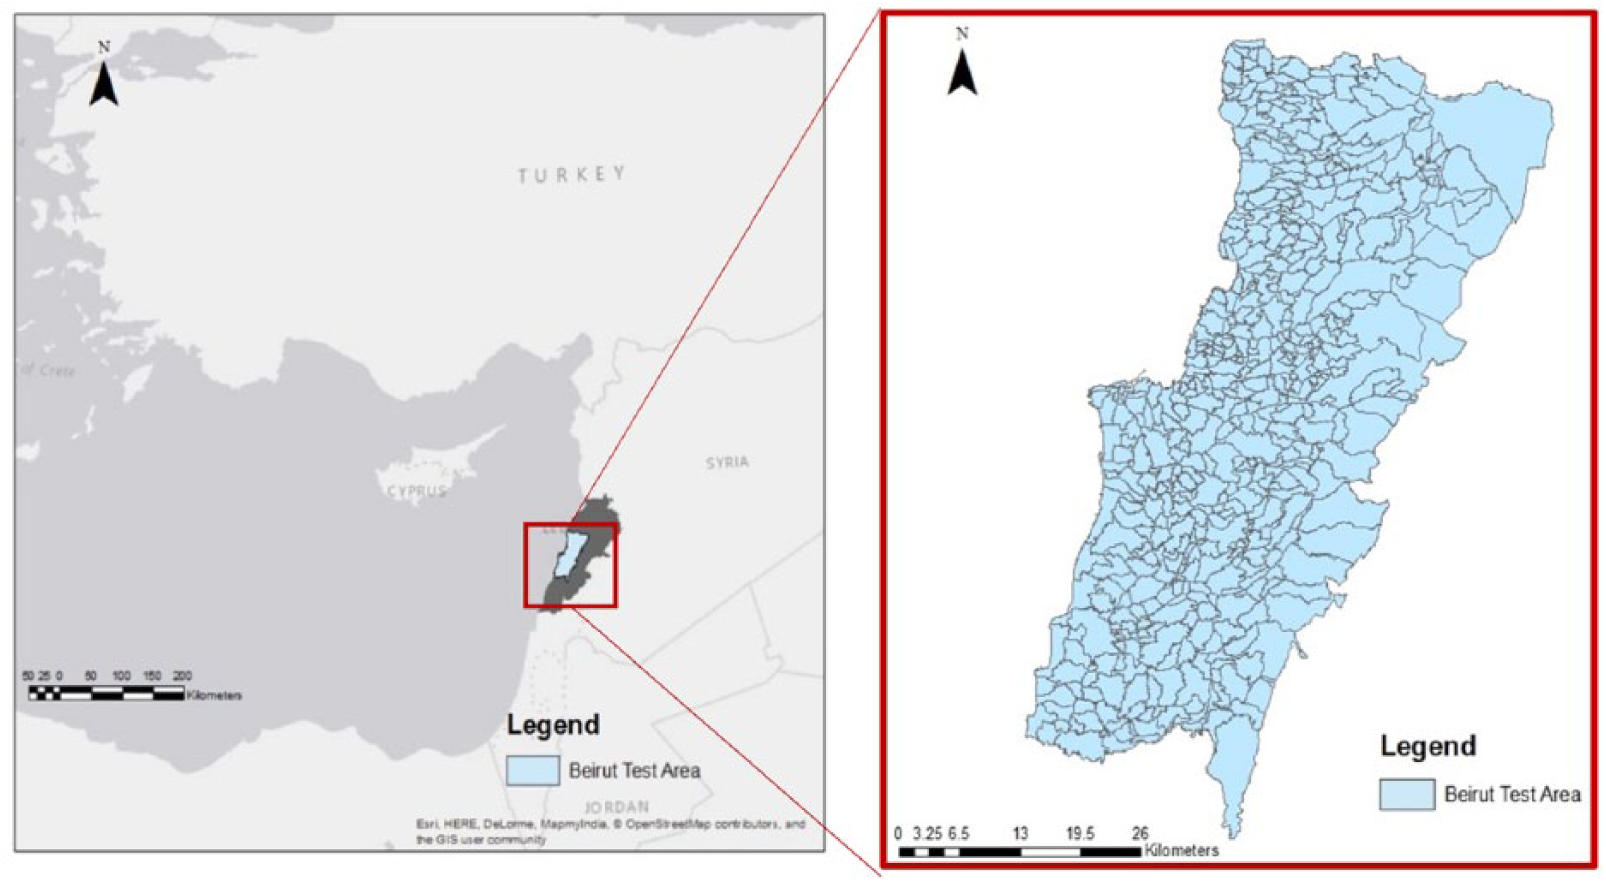
General location of test area.
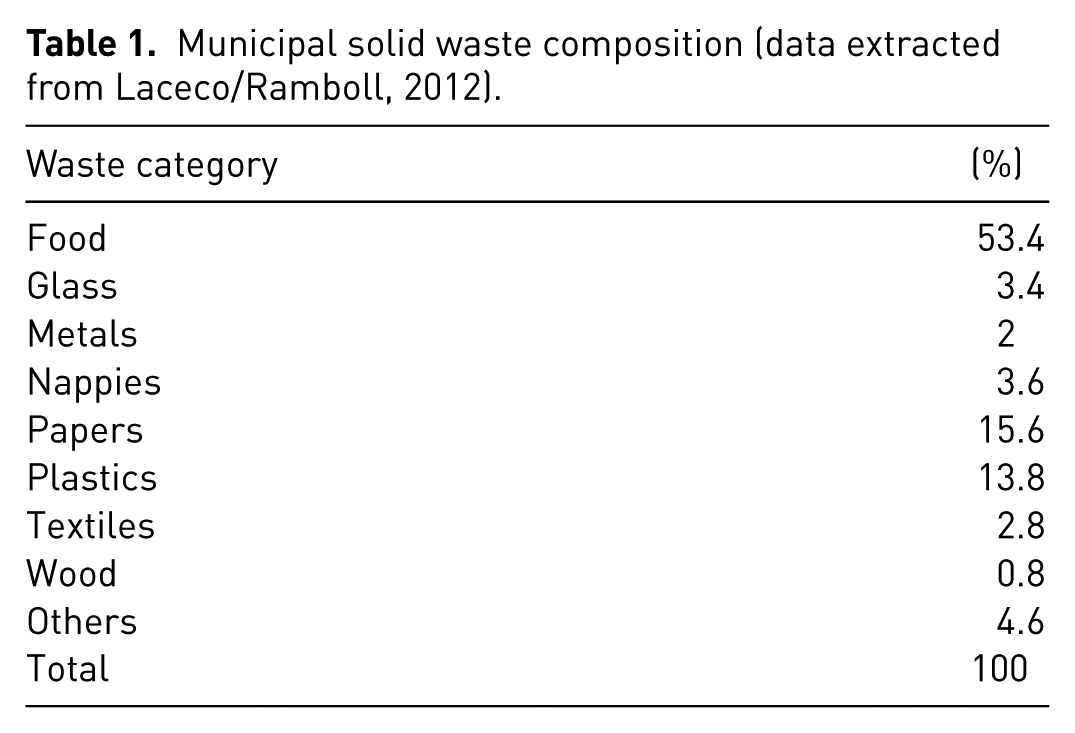
Municipal solid waste composition (data extracted from Laceco/Ramboll, 2012).
Functional unit (FU) and system boundaries
The FU was the management of 1 tonne of waste generated in the test area. The FU was also assumed as the reference flow on which the analysis was performed. Several scenarios were simulated to compare alternative management systems while considering the emissions to the environment, economic implications, and carbon credit. Figure 2 depicts the waste treatment processes and systems’ boundaries (defined inside the frame boundaries) of the tested scenarios. The systems’ boundaries include emissions from waste management including indirect upstream emissions arising from inputs of materials and energy (electricity and fuel), direct operational emissions from systems’ operation such as onsite operating equipment and waste degradation, and indirect downstream emissions related to energy generation, materials substitution, management of residues, and carbon storage.
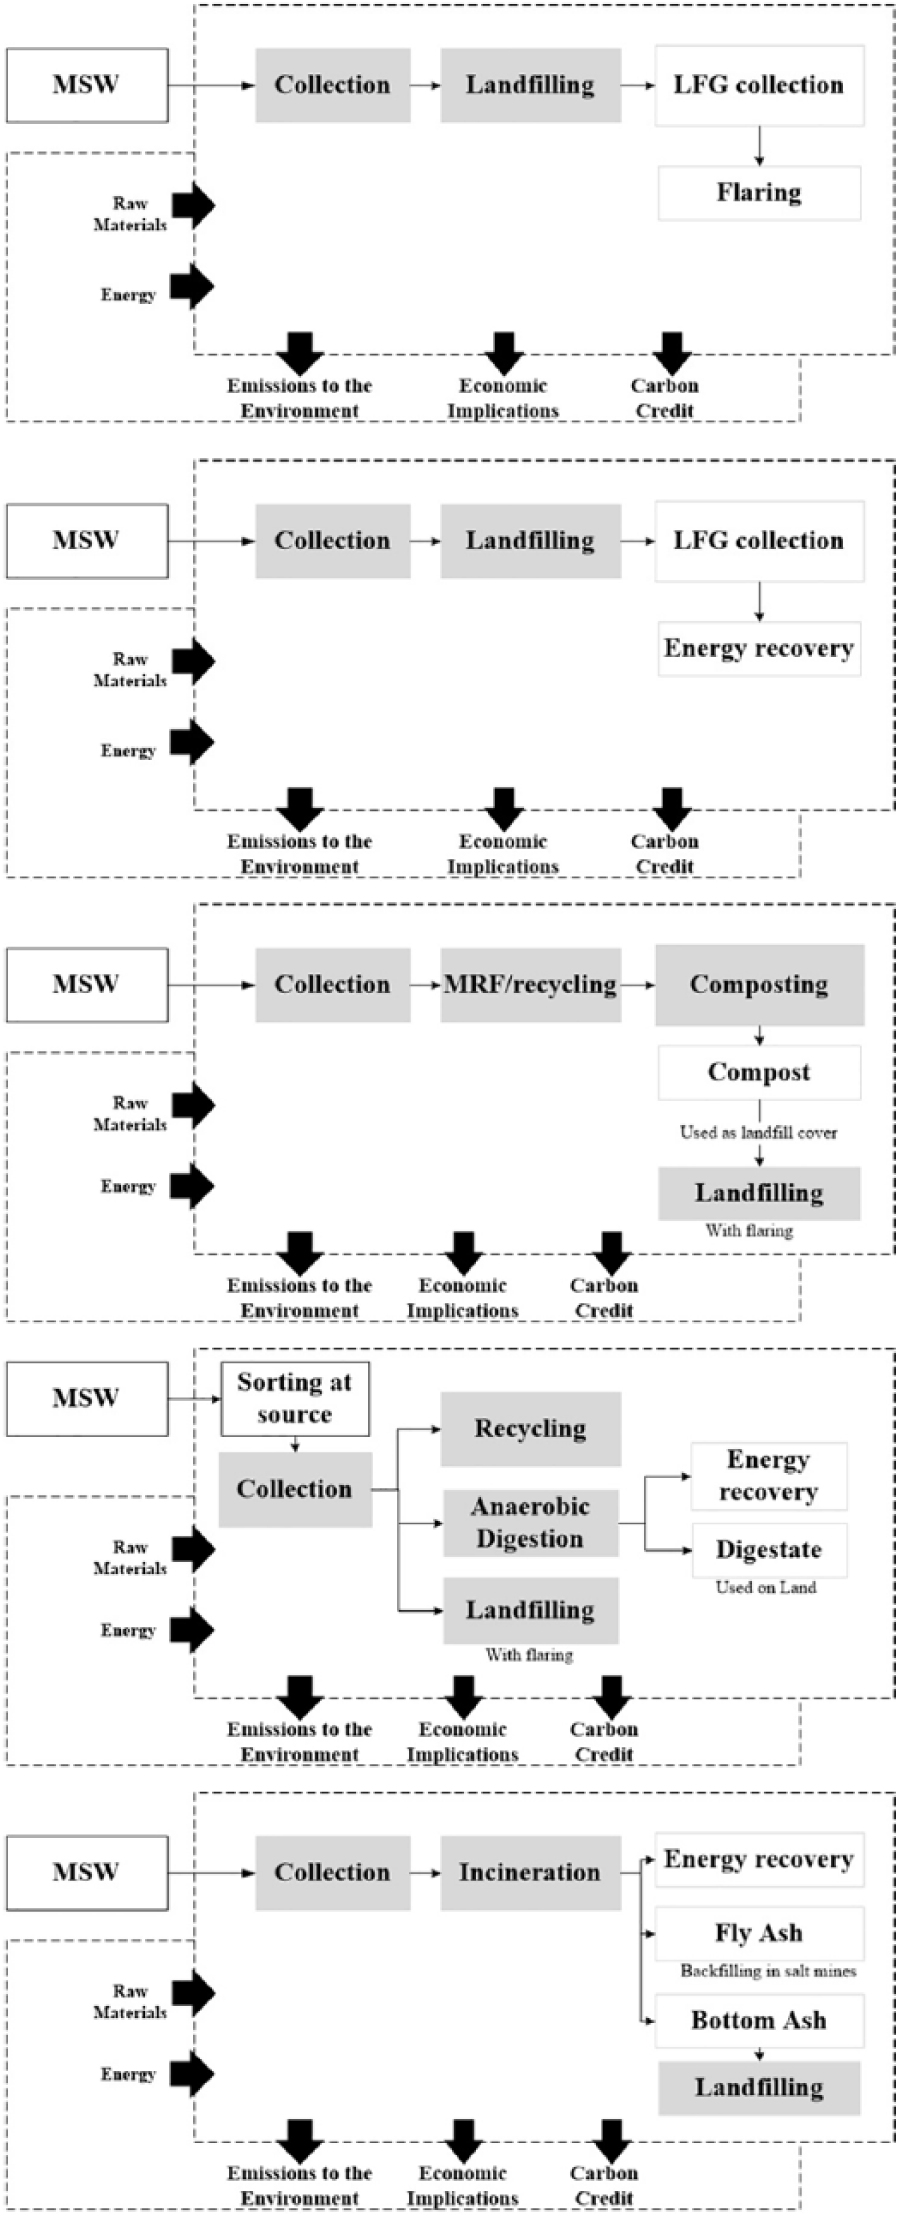
Systems’ boundaries for tested scenarios: S1, baseline scenario: landfilling all waste with flaring; S2, upgrade landfill gas capture system in S1 + energy recovery; S3, material recovery facility + maximum recycling and composting + landfilling; S4, maximum recycling and anaerobic digestion + landfilling; and S5, incinerate all waste + energy recovery.
The baseline scenario (S1) reflects a policy towards landfilling of all the waste with landfill gas (LFG) flaring because economic considerations render landfills as most attractive. Scenario S2 replaces flaring in S1 with energy recovery. However, land availability is continuously constraining landfilling particularly in urban areas. Hence, three other scenarios targeted the minimization of landfilling and optimization of recycling and biological treatment: composting (S3); anaerobic digestion (AD) –(S4); or incineration with energy recovery (S5).
Life cycle inventory (LCI)
In a review of 220 waste-LCA studies, Laurent et al. (2014b) reported that around half of them favored the use of dedicated waste-LCA models instead of general LCA models. As such, in this study, the dedicated waste-LCA EASETECH software (Clavreul et al., 2014; Laurent et al., 2014b; Liu et al., 2017a, 2017b) was tailored to reflect the test area characteristics (waste composition, electricity mix, waste management, etc.) and applied to assess the environmental impacts of various waste management processes and estimate corresponding emissions. The data were collected from annual reports of facility operations, published sources, face-to-face interviews, site visits and field observations, and supplemented with reported literature. Table 2 synthesizes the input data of tested scenarios for assessing waste management processes.
Input data of tested scenarios for assessing waste management processes.
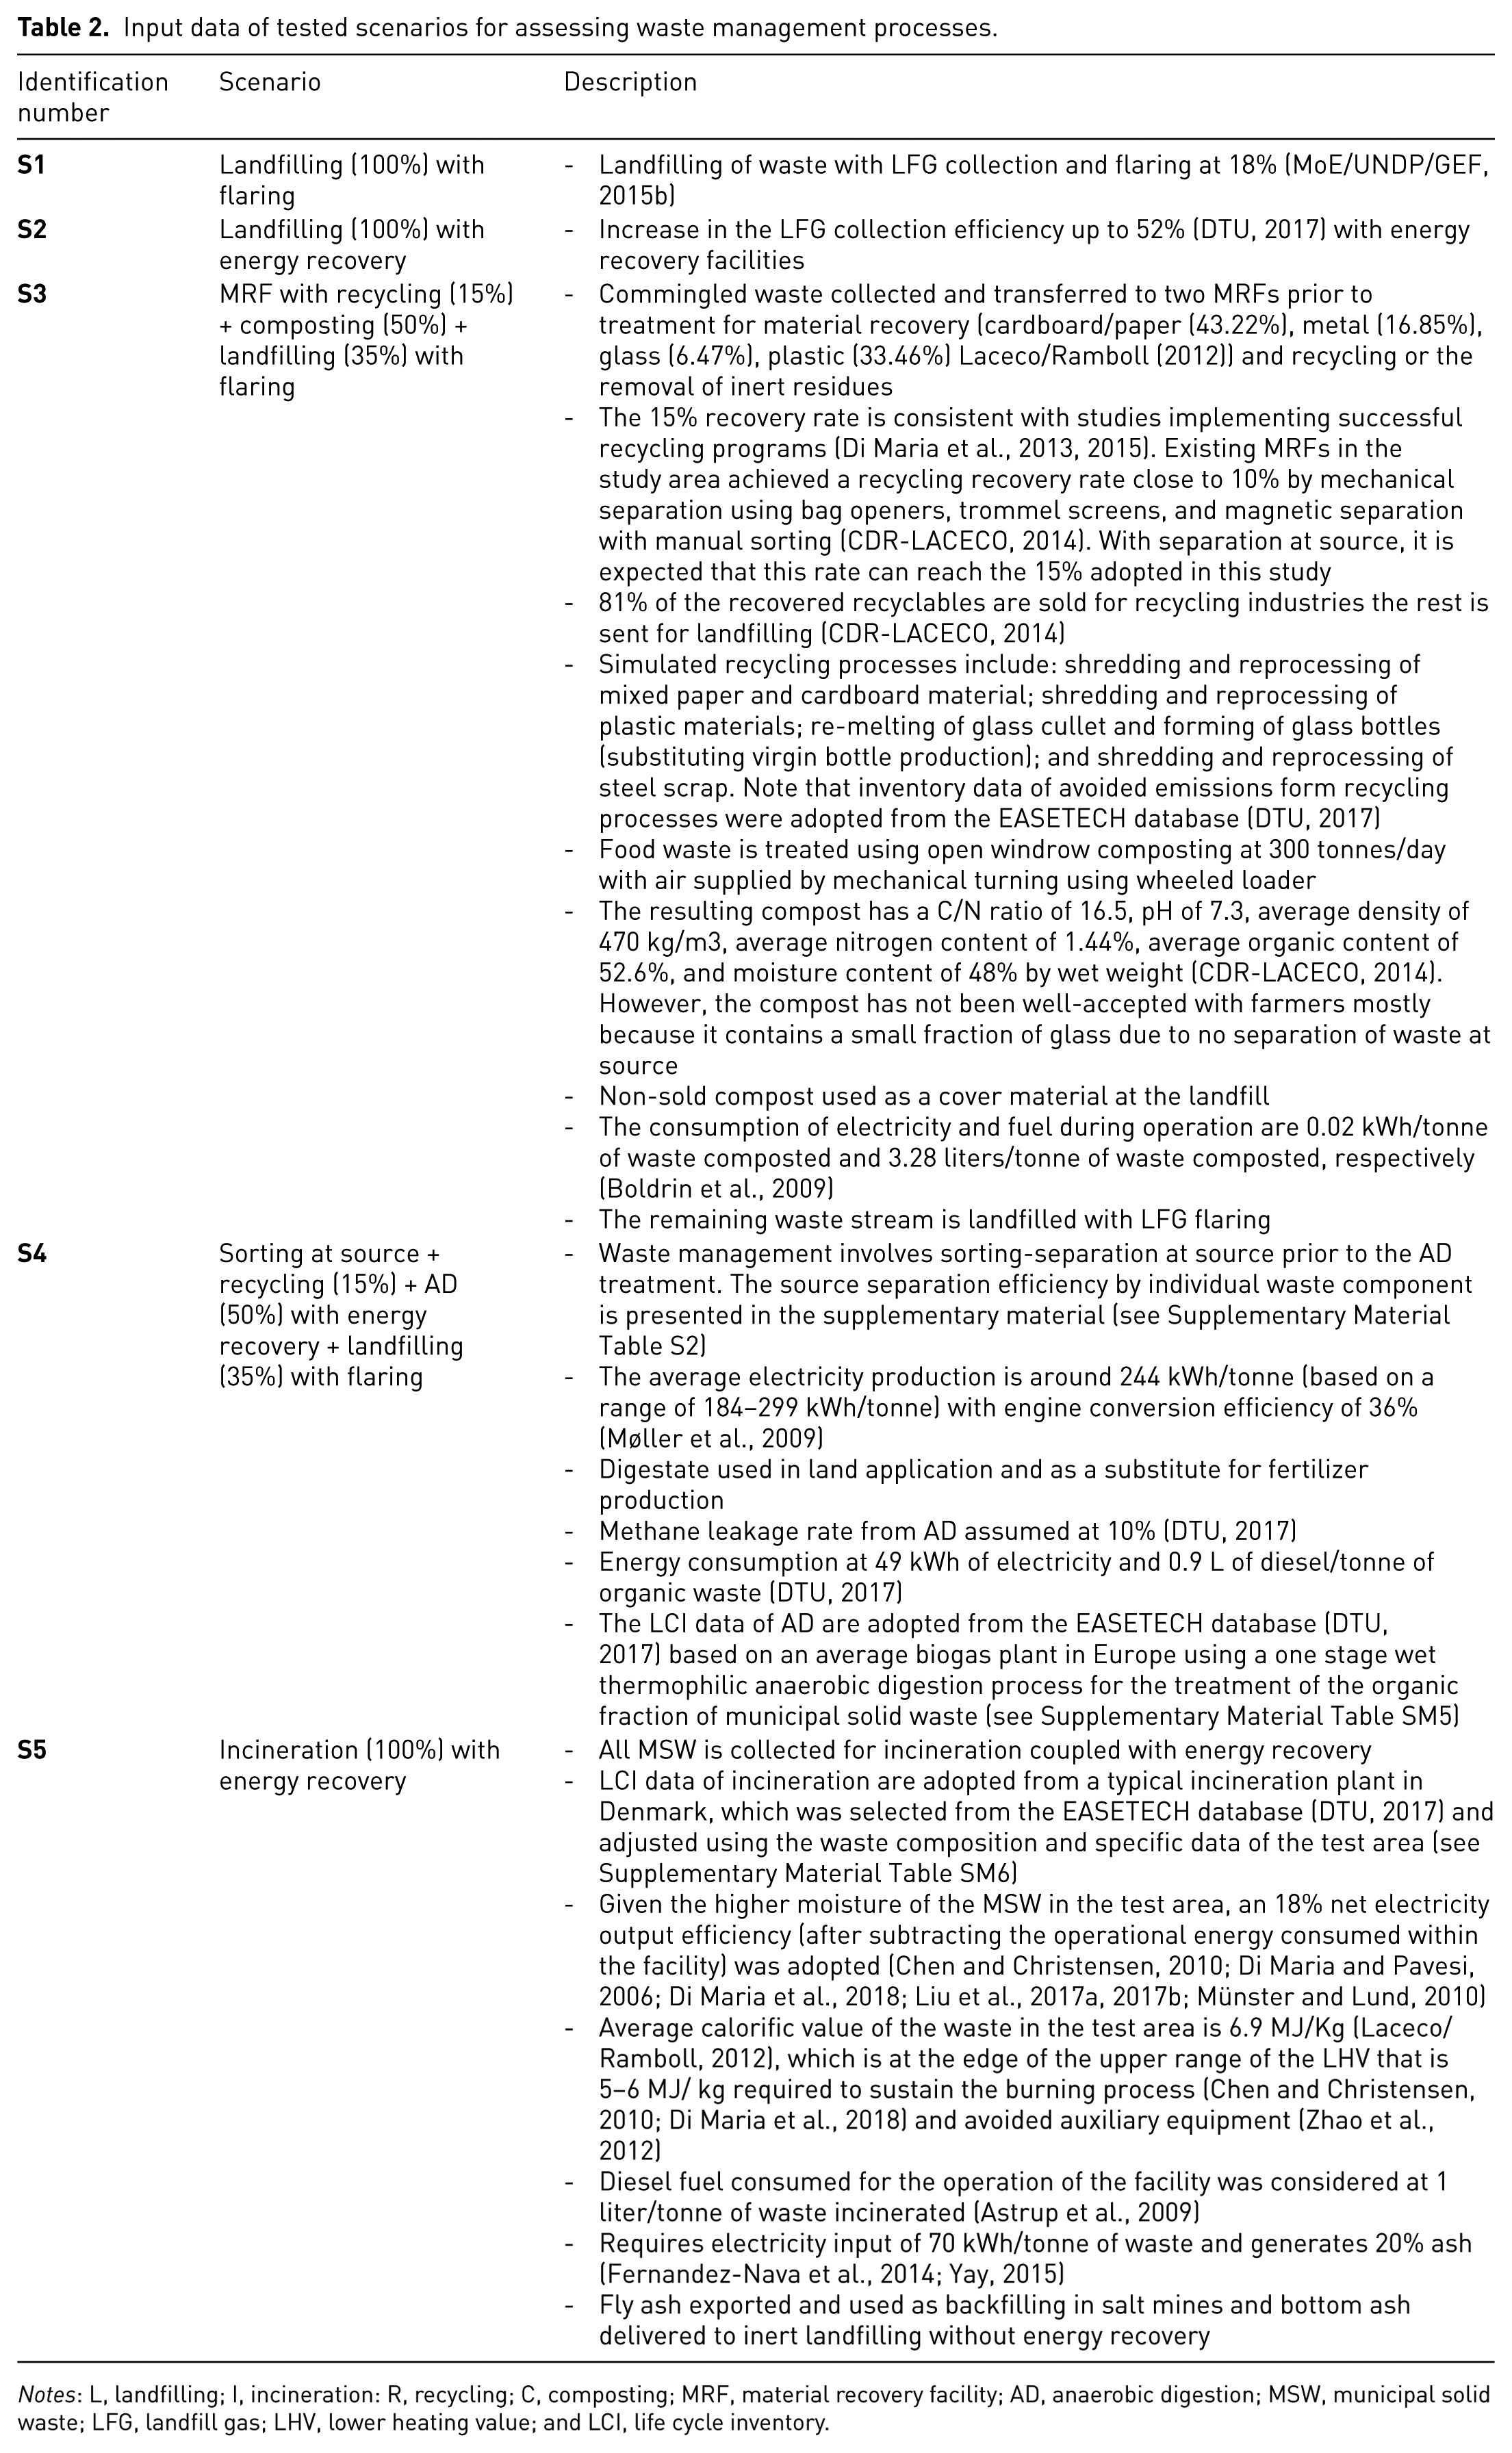
Notes: L, landfilling; I, incineration: R, recycling; C, composting; MRF, material recovery facility; AD, anaerobic digestion; MSW, municipal solid waste; LFG, landfill gas; LHV, lower heating value; and LCI, life cycle inventory.
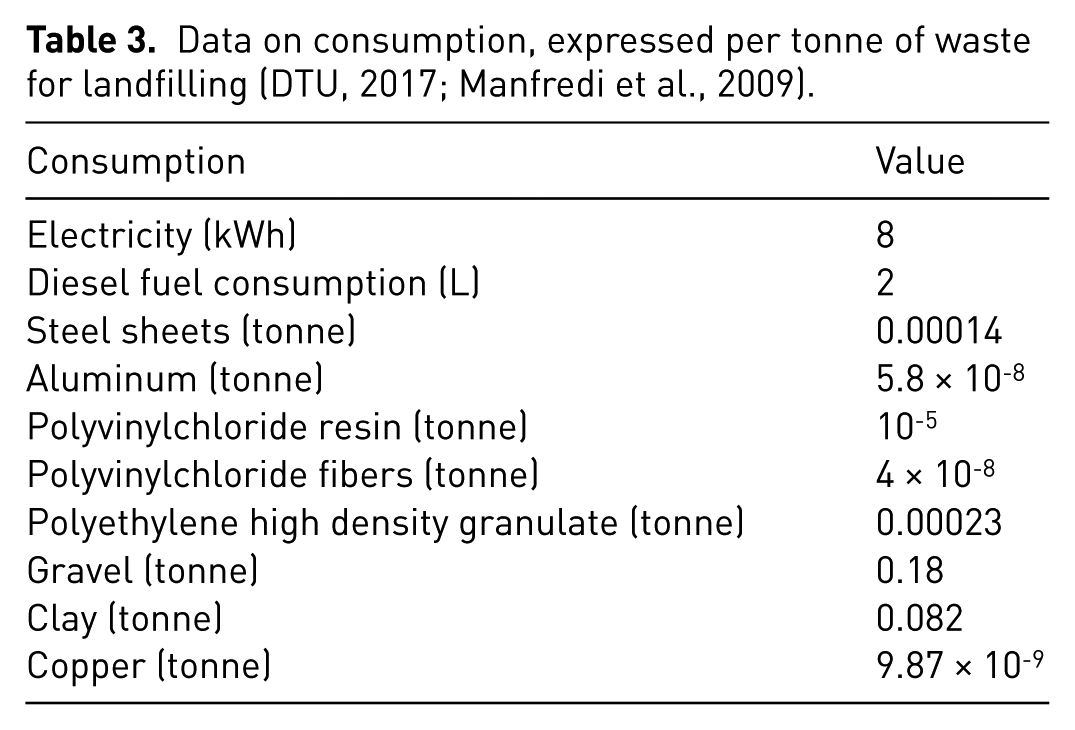
The tested systems include the collection of mostly commingled waste that is transported to a material recovery facility with a recycling program, biological treatment (composting–AD), incineration, and landfilling (Table 2) with energy recovery when applicable. Input data for landfilling are summarized in Table 3 with several modules combined to represent this process: (1) construction and operation of the landfill; (2) gas generation using first order decay for a 100 years-time horizon and natural oxidation (in daily, intermediate, and final covers); (3) leachate generation (without treatment); and (4) stored substances in the landfill contribute to eco-toxicity and sequestrated carbon. The LCI data for individual waste treatment processes, extracted from the EASETECH database, are detailed in the Supplementary Material (Tables SM3–SM7). Waste collection was simulated for all scenarios based on an overall fuel consumption per year. Electricity requirements were derived using the Ecoinvent database (Ecoinvent, 2017) based on the country’s national electricity mix, that rely primarily on oil-fired power plants (95.5%) and a small contribution from hydropower plants (4.5%) (MoE/UNDP/GEF, 2015a).
Data on consumption, expressed per tonne of waste for landfilling (DTU, 2017; Manfredi et al., 2009).
Impact assessment
The ILCD (European Commission-JRC, 2011) impact assessment method was used in this study and is further described in Hauschild et al. (2013). The impact assessment was conducted for all scenarios using several indicators including climate change (global warming potential of 100 years-time horizon), photochemical oxidant formation, stratospheric ozone depletion, acidification, depletion of abiotic resources, and freshwater and marine eutrophication. The model results are presented in the form of characterized and normalized potential impacts. The latter is expressed as person equivalent, which is the contribution to an indicator of an average person in a given reference year as outlined in Table 4.
Normalization references for the selected environmental impact categories (DTU, 2017; Laurent et al., 2013).
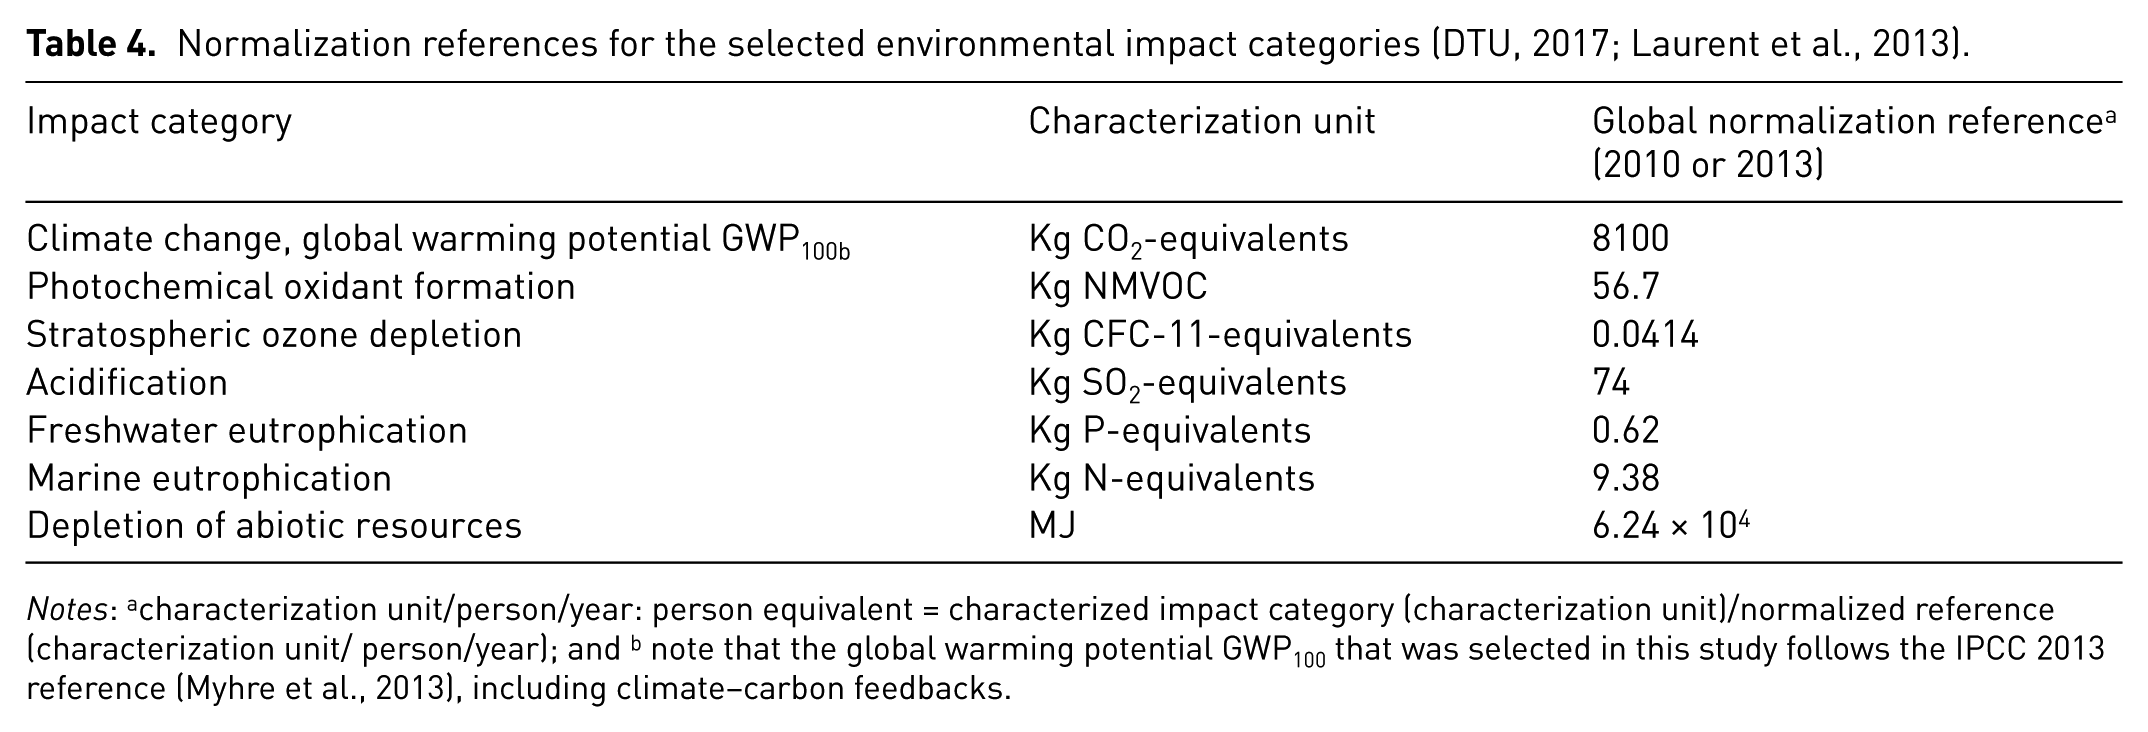
Notes: acharacterization unit/person/year: person equivalent = characterized impact category (characterization unit)/normalized reference (characterization unit/ person/year); and b note that the global warming potential GWP100 that was selected in this study follows the IPCC 2013 reference (Myhre et al., 2013), including climate–carbon feedbacks.
Economic analysis
The cost of management alternatives was estimated using an average cost for the total amount of waste managed under each scenario (Table 5). The wider range in Table 5 is considered in the sensitivity analysis to define breakeven points that could assist in defining zones of enhanced economic viability. Inflation was not included, and values were considered at a constant year zero. The offset of emissions was quantified based on the carbon market. The latter ranged from 0.5–50 US$ per metric tonne of carbon dioxide equivalent (MTCO2E) in 2016, with an average price of 3 US$/MTCO2E, which is the lowest reported market value from voluntary actors since 2006 (Ecosystem Marketplace, 2017). The average value was used to assess associated benefits and allows for the estimation of minimal savings when the carbon footprint is reduced through regulated and voluntary global markets for trading or offsetting of carbon credits. A wider range is considered in the sensitivity analysis to define breakeven points that could assist in decision-making and policy-planning.
Average cost of municipal solid waste management (US$/tonne of waste).
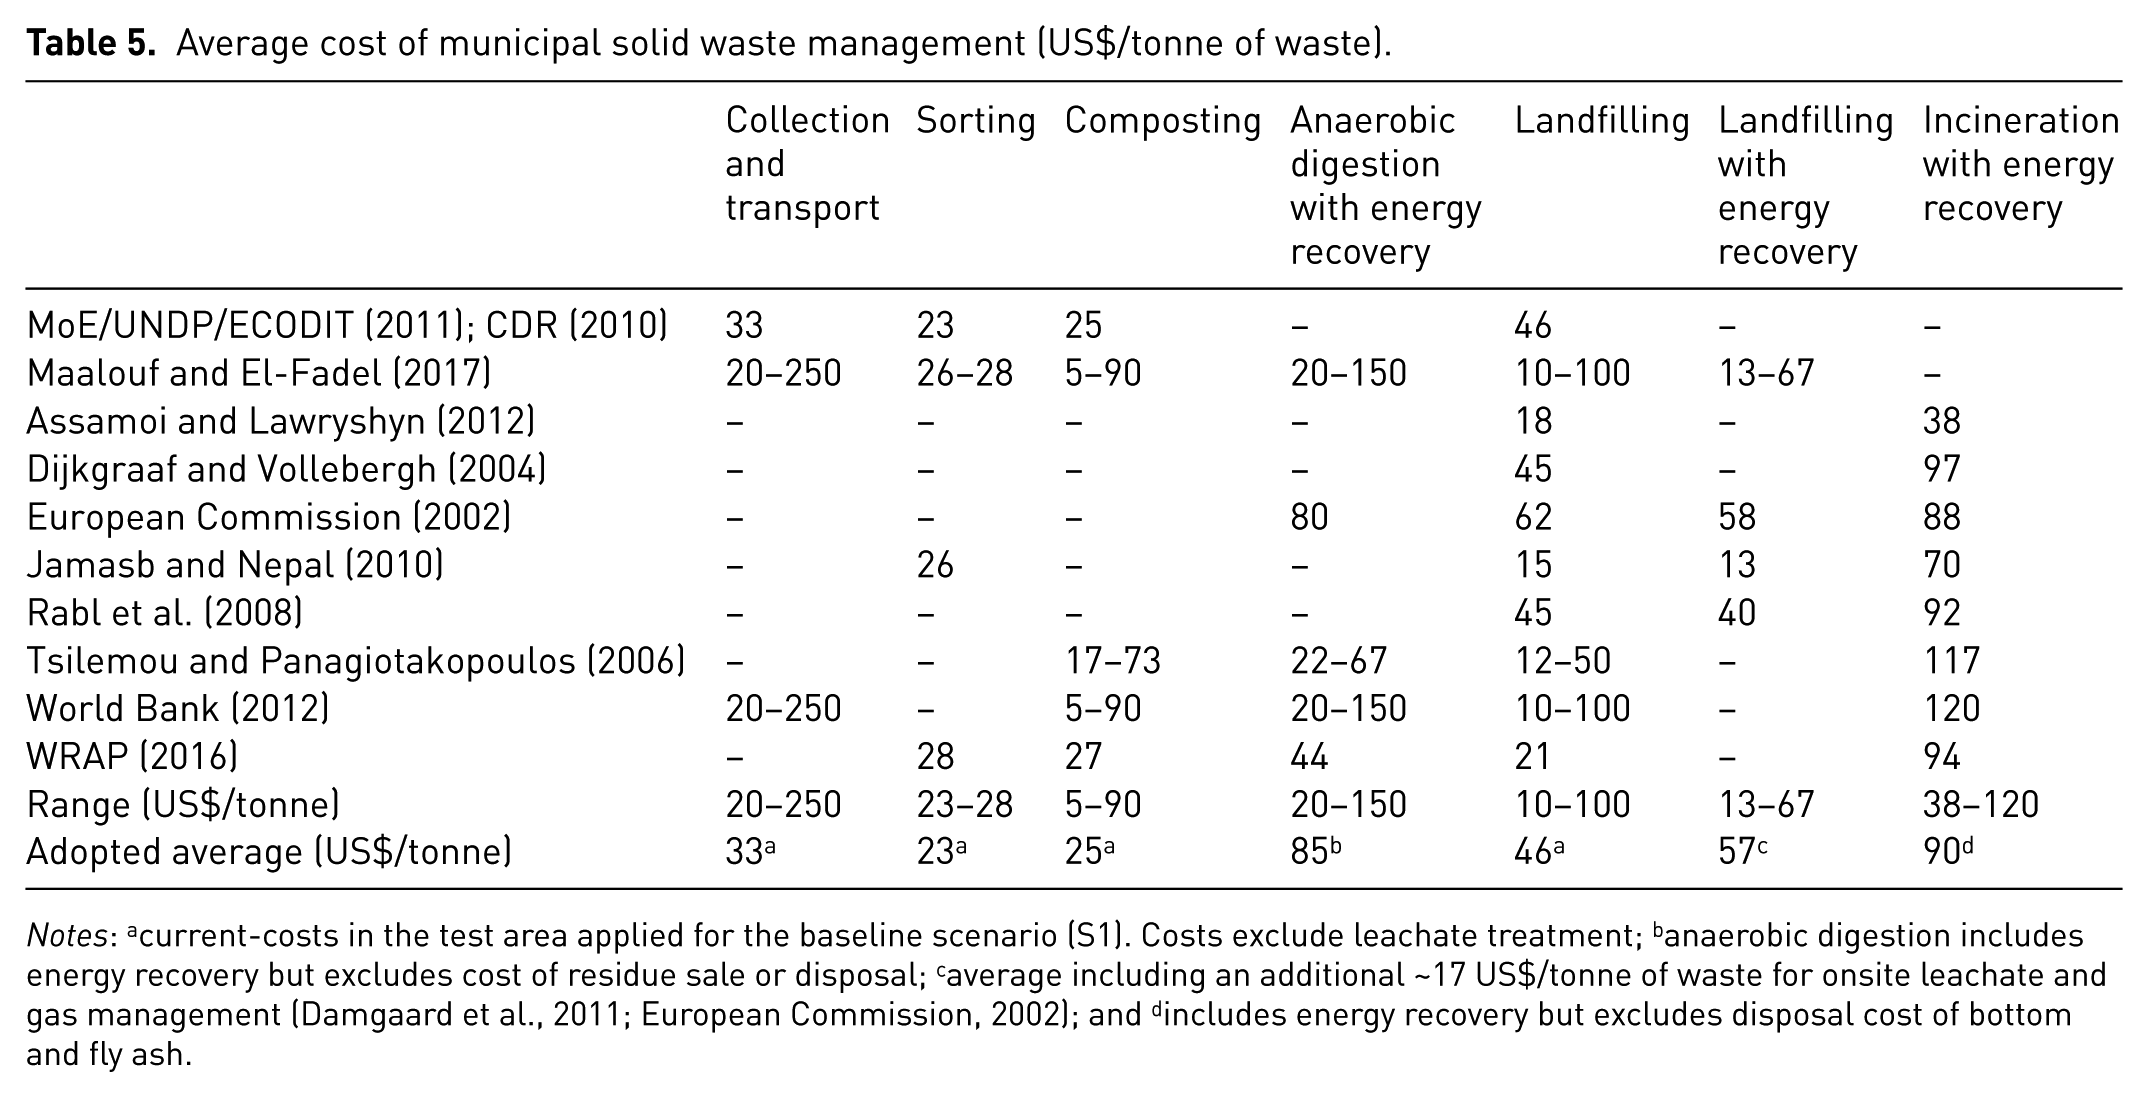
Notes: acurrent-costs in the test area applied for the baseline scenario (S1). Costs exclude leachate treatment; banaerobic digestion includes energy recovery but excludes cost of residue sale or disposal; caverage including an additional ~17 US$/tonne of waste for onsite leachate and gas management (Damgaard et al., 2011; European Commission, 2002); and dincludes energy recovery but excludes disposal cost of bottom and fly ash.
Sensitivity analysis
A one-factor-at-a-time sensitivity analysis was conducted to assess key parameters by varying the main assumptions whereby each parameter was varied one at a time to assess its impact on emissions. These parameters included the fraction of the LFG collected, food waste fraction, land application of compost, and net energy recovery efficiency of waste incineration. The cost range of carbon credit and several waste management processes (AD, incineration and landfilling with energy recovery) were also considered one at a time to assess their impacts on net cost variations and define breakeven points for decision-making and policy-planning. Note that only processes related to alternative technologies were tested for cost variation, because for the baseline scenario (landfilling, sorting/recycling, and composting) the costs are already fixed.
Results and discussion
LCA analysis
The results of the LCA characterization analysis per functional unit (1 tonne of MSW managed) for each indicator of the tested scenarios are depicted in Figure 3 taking the baseline scenario (S1) as the normative reference, whereby all other scenarios are indexed to the impact of S1 per 1 tonne of MSW (S1 is 100%). Figure 4 depicts the contribution of each scenario disaggregated by waste management processes to the impact categories. The results show that landfilling scenarios contribute the most to all impact categories (Figure 3). For instance, the baseline scenario S1 that consists of landfilling all waste with flaring of LFG collected (18%) is associated with the highest climate change impact (global warming potential GWP100) in comparison to other scenarios due to uncaptured methane emissions from landfilling (Figure 4a). Note that developing economies are generally characterized by poorly operated landfills with inefficient LFG collection systems at efficiencies ranging between 28% and 40% (Banar et al., 2009) compared with 60% to–98% reported in developed economies (EPA/ICF, 2016). In this case, the low collection efficiency can be attributed to the high fraction of the food waste component associated with rapid decomposition leading to unstable LFG generation; the high moisture content of the waste resulting in the generation of large quantities of leachate that reduce the collection efficiency; and inefficient gas recovery systems (Liu et al., 2017 a, 2017b; Zhan et al., 2015). The sensitivity analysis showed that a 10% increase in the food waste fraction, led to an equivalent increase of 8.6% in the climate change impact indicator (Table 6). This can be attributed to emissions through the landfill surface during the early stage of waste disposal (1–2 years). Similarly, an increase in the LFG collection efficiency up to 60%, contributed to a 58% decrease in the climate change impact indicator (Table 6). Major savings in the climate change impact were achieved under scenario S4 considering incineration with energy recovery (Figure 4a). In this context, results from sensitivity analysis showed that a 10% increase in the electricity efficiency from incineration could save 53% of the climate change impact indicators (Table 6).
Life cycle characterization per 1 tonne of municipal solid waste (MSW) in the test area. S1 is the normative reference, whereby all other scenarios are indexed to the impact of S1 per 1 tonne of MSW (S1 is 100%): S1, baseline scenario: landfilling all waste with flaring; S2, upgrade landfill gas capture system in S1 + energy recovery; S3, maximum recycling and composting + landfilling; S4, maximum recycling and anaerobic digestion + landfilling; and S5, incinerate all waste + energy recovery.
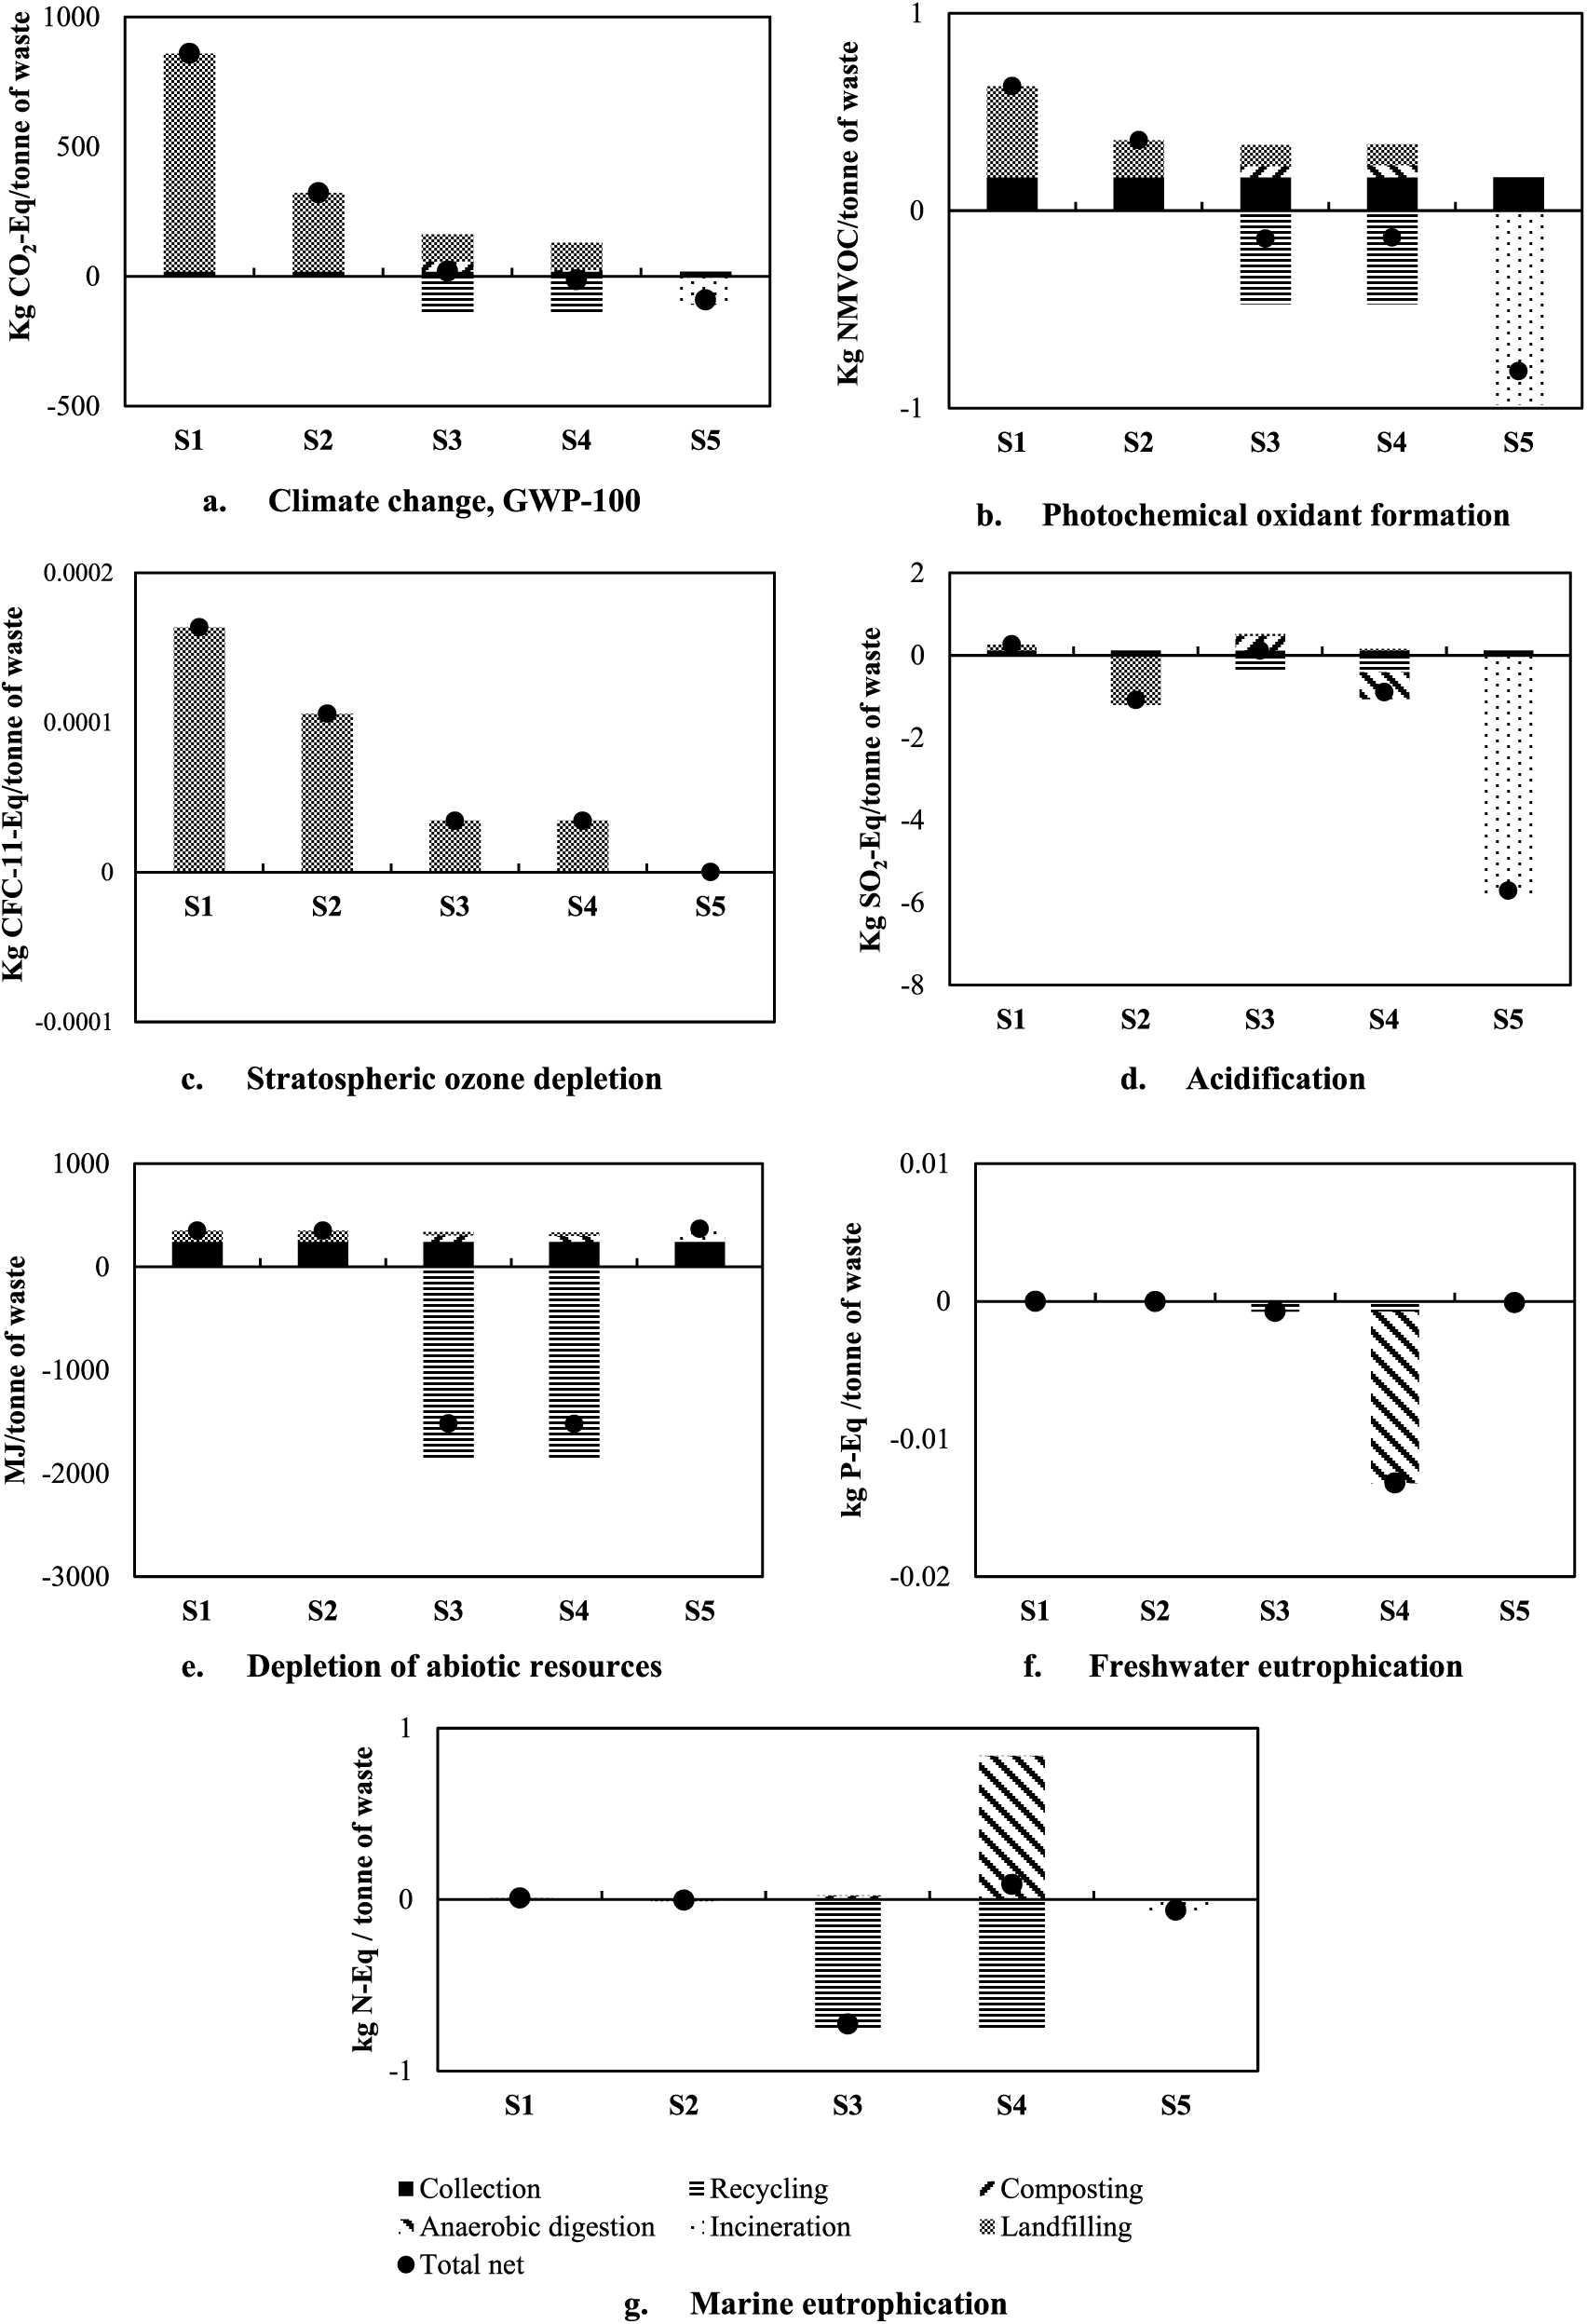
Contribution of each scenario to the impact categories: S1, baseline scenario: landfilling all waste with flaring; S2, upgrade landfill gas capture system in S1 + energy recovery; S3, maximum recycling and composting + landfilling; S4, maximum recycling and anaerobic digestion + landfilling; and S5, incinerate all waste + energy recovery.
Sensitivity to key input parameters.
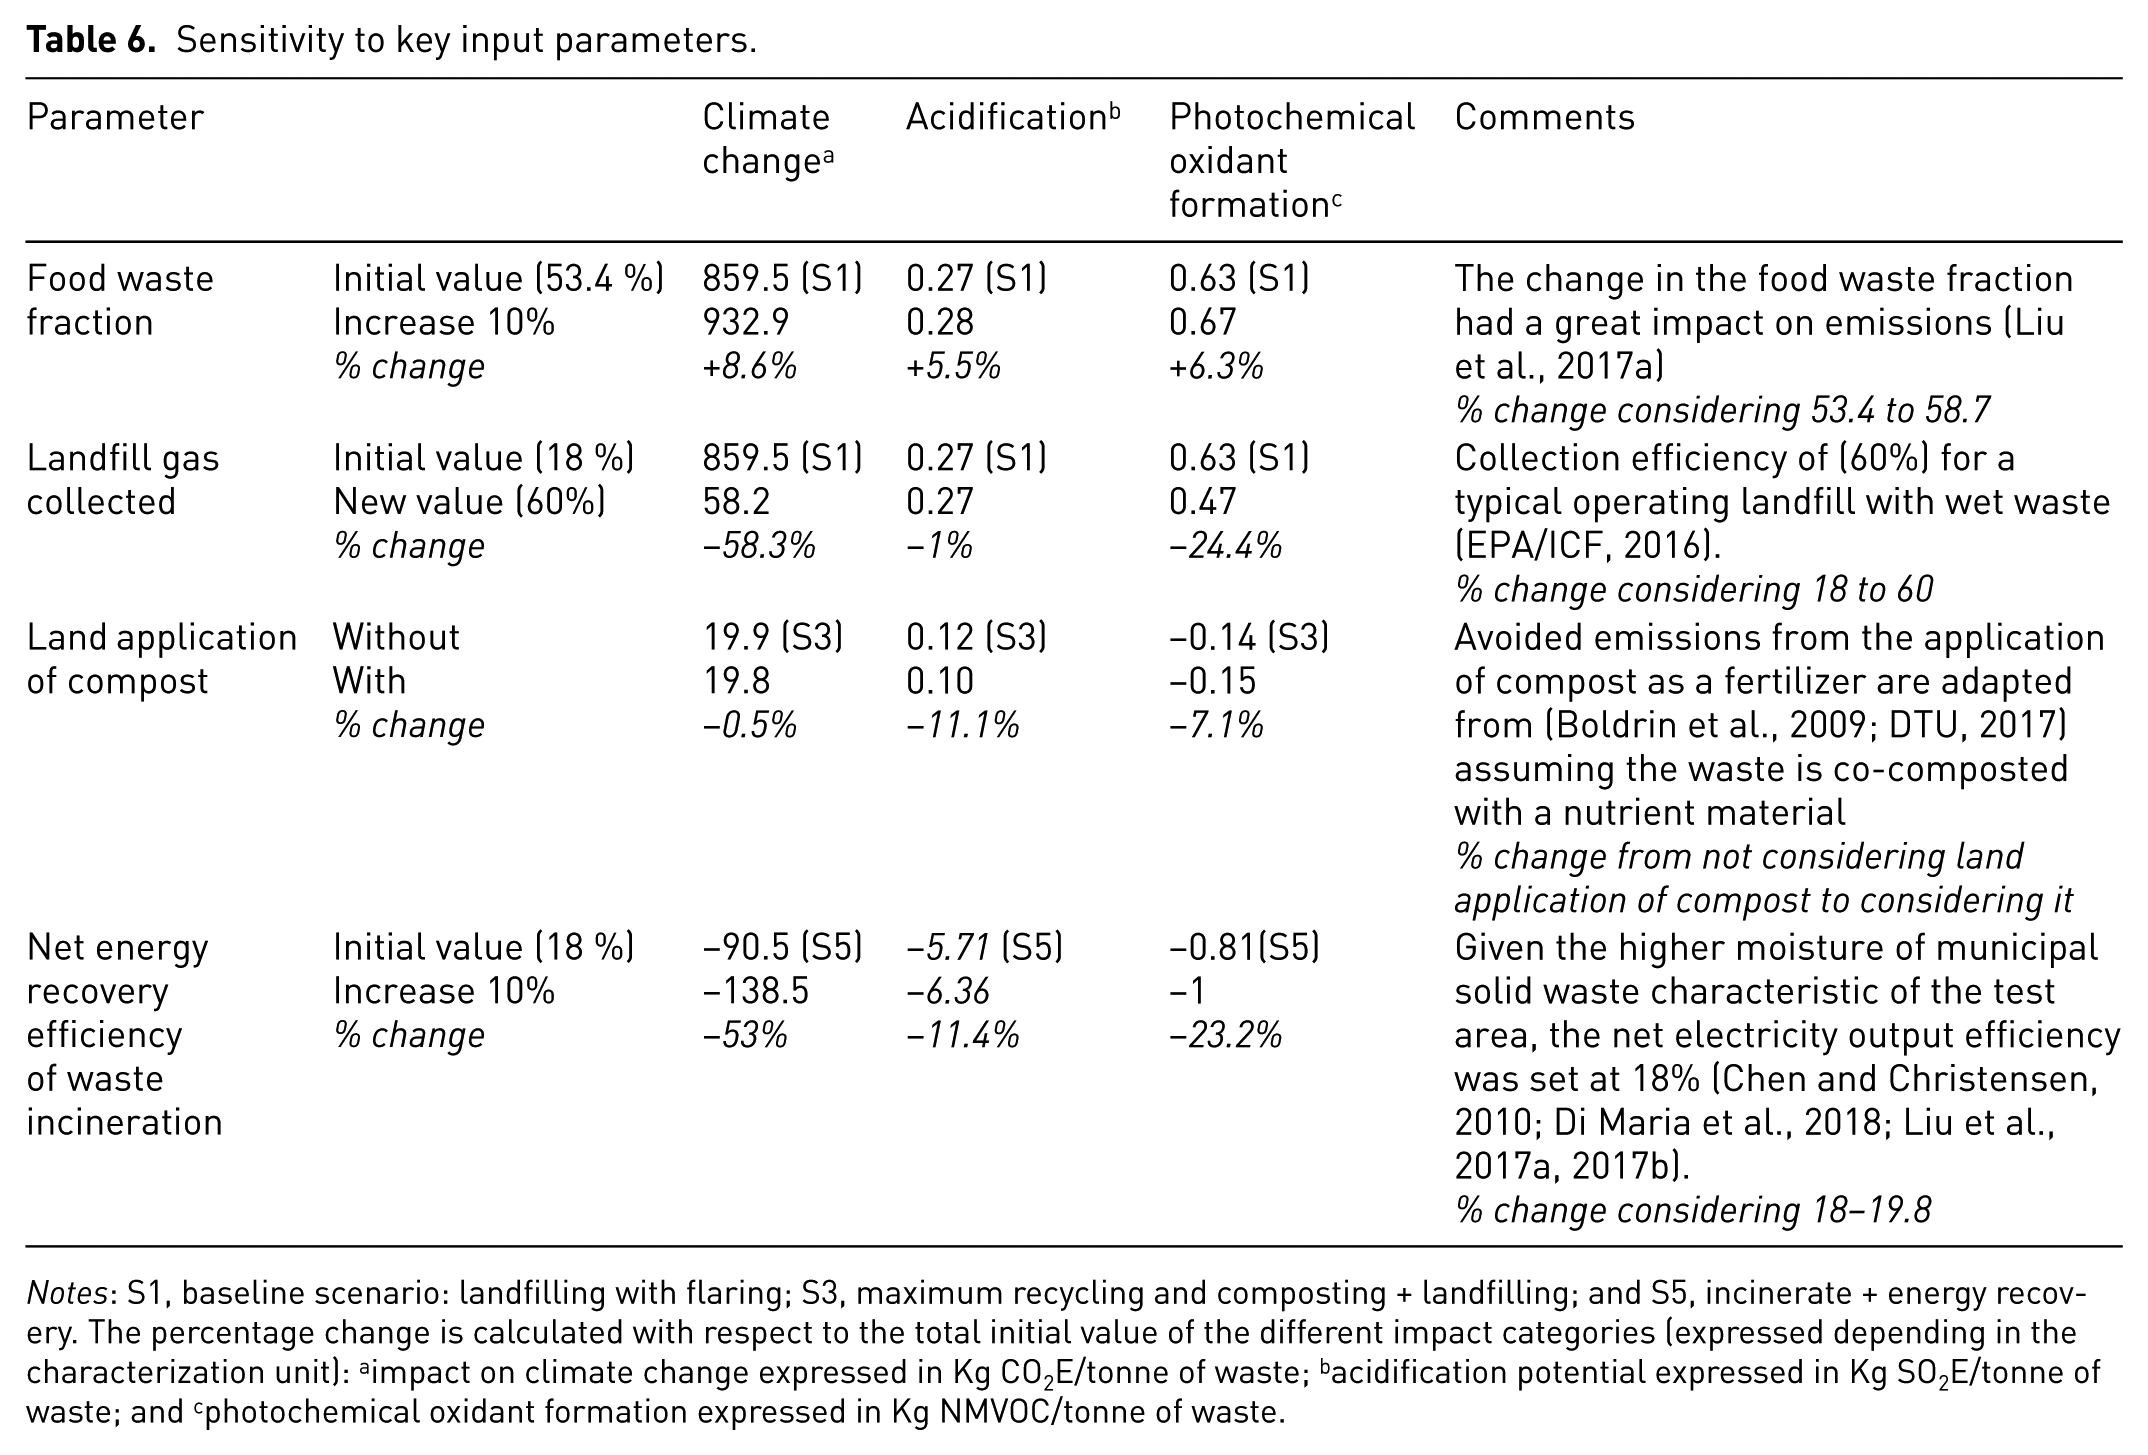
Notes: S1, baseline scenario: landfilling with flaring; S3, maximum recycling and composting + landfilling; and S5, incinerate + energy recovery. The percentage change is calculated with respect to the total initial value of the different impact categories (expressed depending in the characterization unit): aimpact on climate change expressed in Kg CO2E/tonne of waste; bacidification potential expressed in Kg SO2E/tonne of waste; and cphotochemical oxidant formation expressed in Kg NMVOC/tonne of waste.
All scenarios except S3 and S4 exhibited a similar trend for the depletion of abiotic resources due to avoided raw material usage through recycling. Moreover, waste collection has a significant impact in this category due to the use of fossil fuels (Figure 4e). The waste composition exhibited different impacts on emissions from various treatment processes. For instance, the high fraction of biodegradable food waste was advantageous to the AD process whereby more biogas generation for energy recovery would result in greater savings in emissions. However, environmental benefits from these scenarios are affected by several factors such as gas leakage under AD and land application of compost or digestive residues. In the case of the test area, food waste is not separated at the source contributing to a lower efficiency of separation which translates into less emissions savings. The low-quality compost in the test area is invariably not accepted by farmers and hence used as intermediate covers in landfilling, thereby contributing to greater emissions. Accordingly, the separation of waste at source will contribute to about 11% savings in acidification and 7% in photochemical oxidant formation (Table 6). This can be attributed to the production of better-quality compost that can be used on land, resulting in savings from the substitution of fertilizer production and carbon storage. Further savings can also be attributed to avoided energy consumption during pretreatment.
Stratospheric ozone depletion is caused by emitting “methane bromotrifluoro-Halon 1301,” which is a consequence of crude oil production, petroleum, and natural gas (Yay, 2015). The best alternative against ozone depletion is scenario S5 that considers incineration with energy recovery substituting electricity production from oil-fired power plants in the case of the test area (Figure 4c). However, the benefits of waste incineration can be compromised by the high organic fraction and moisture content that decrease the net energy recovery in comparison to developed economies at 30% to 31% (Gohlke and Martin, 2007; Murer et al., 2011).
Landfilling scenarios contribute mostly to the photochemical oxidant formation due to methane emissions, with savings achieved under scenarios S3 and S4 considering the minimization of landfilling in comparison to the baseline scenario S1 (Figure 3). Waste collection also contributes to the effect of photochemical oxidation due to sulfur dioxide (SO2) emissions (Figure 4b). The acidification potential is measured by its capacity to form H+ ions relative to SO2 (Banar et al., 2009; Yay, 2015). Energy recovery is the best alternative to reduce this impact due to savings in NOx emissions from equivalent electricity generation. Accordingly, incineration coupled with energy recovery (scenario S5) achieved the most savings from this category followed by upgrading the LFG collection system from flaring to energy recovery (scenario S2) (Figure 3). Alternative scenario S4 that considers AD also reduced the impact of acidification due to the use of biogas for energy recovery and digestate in farming as a substitute for fertilizer production (Figure 4d). Similarly, this scenario achieved significant savings in freshwater eutrophication due to avoided fertilizer production and energy recovery (Figure 4f). However, S4 might affect marine eutrophication due to nitrate run-off from the application of digestate on land (Hansen et al., 2006; Yay, 2015).
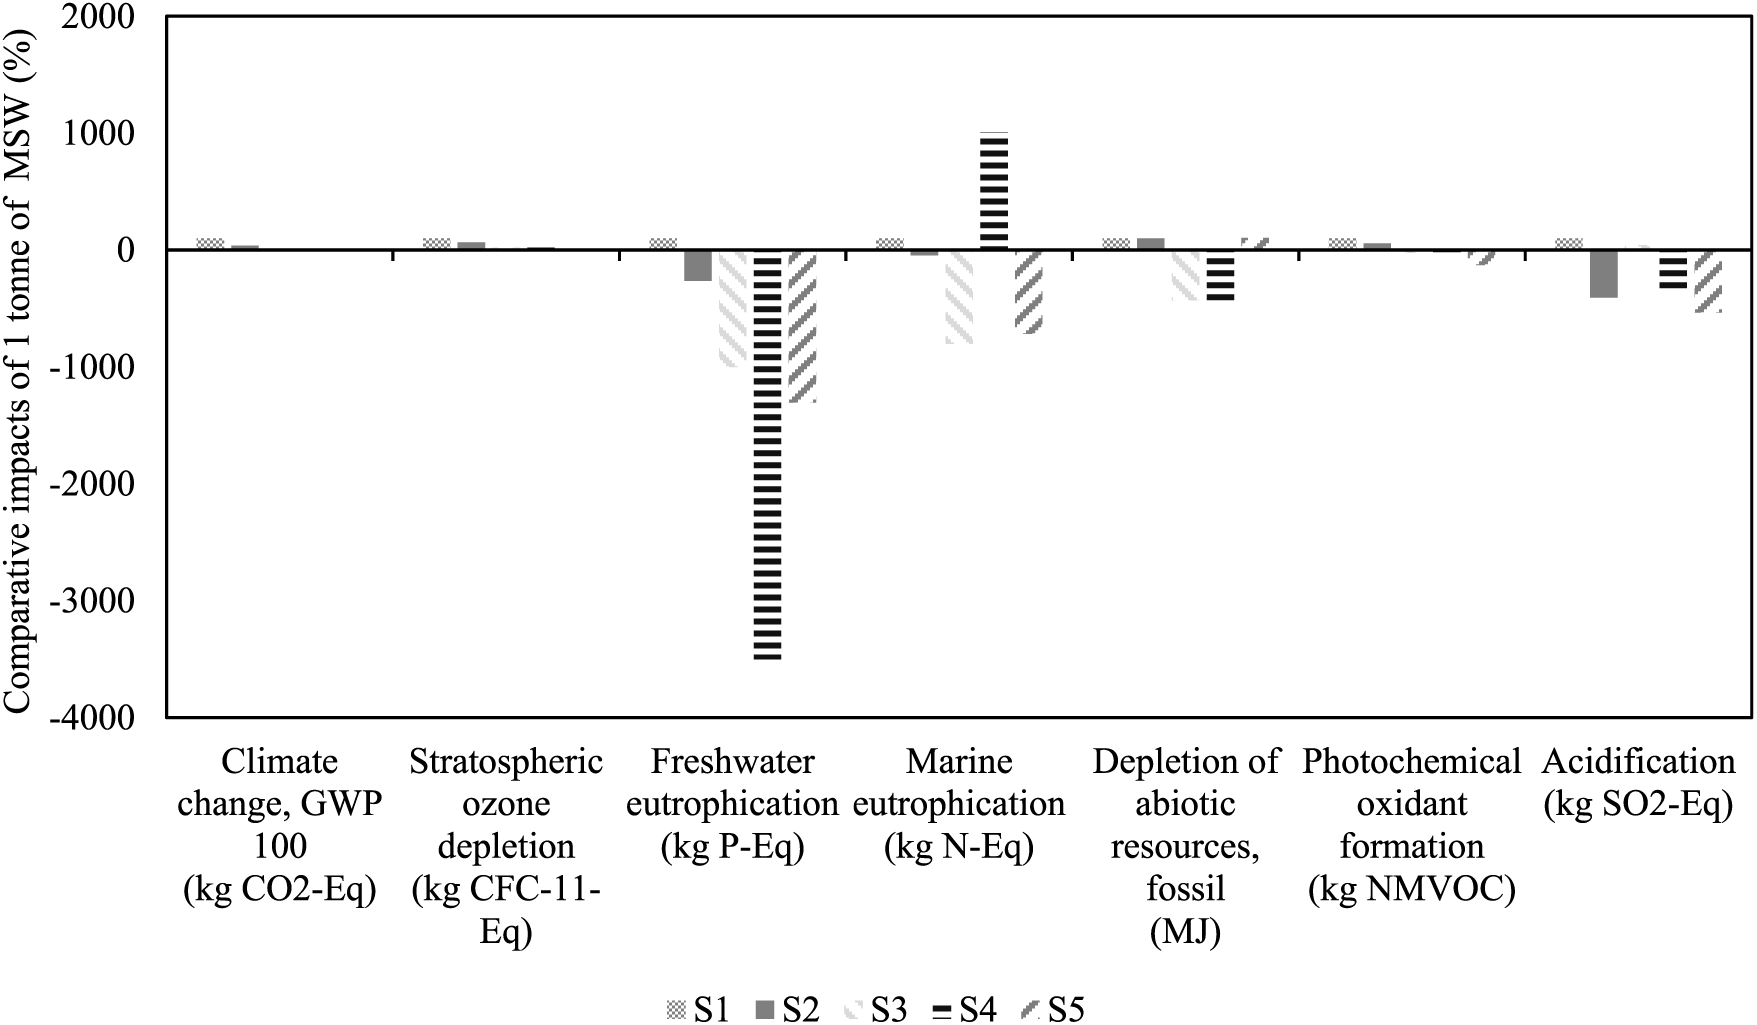
In summary, the comparison of scenarios (Figure 5) using the normalized potential impacts showed that the integrated MSW management system is contributing most to the climate change indicator. While, the highest impact arises from landfilling all waste (scenario S1), mainly due to uncaptured methane emissions, the greatest benefits can be derived from incinerating all the waste (scenario S5) due to energy recovery. Similarly, maximizing recycling and composting or AD in scenarios S3 and S4 contributed to significant savings in all impact categories.
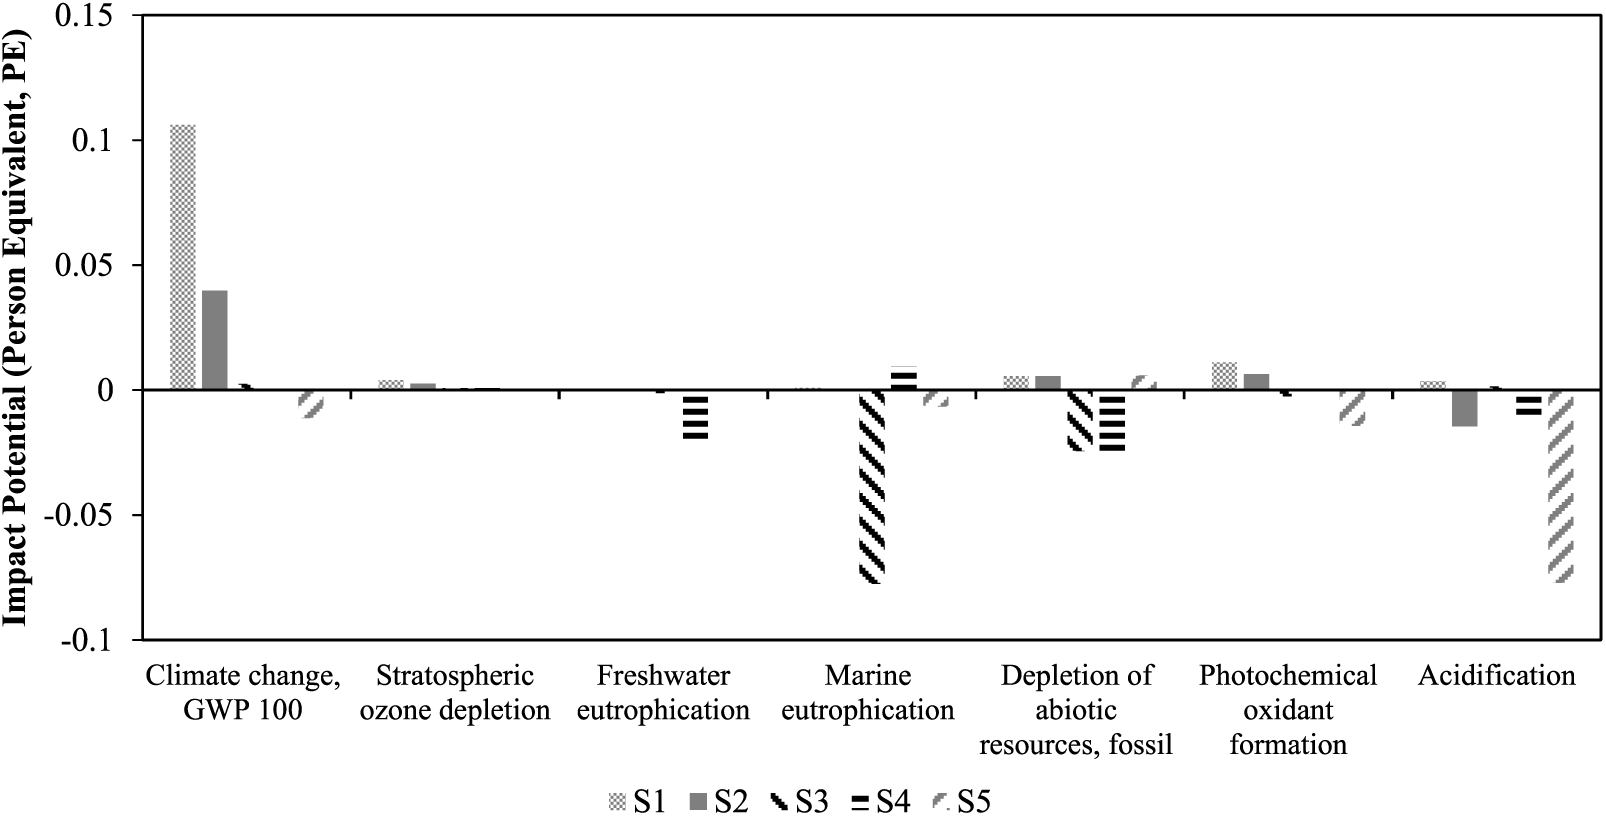
Normalized potential non-toxic impacts from the treatment of 1 tonne of municipal solid waste: S1, baseline scenario: landfilling all waste with flaring; S2, upgrade landfill gas capture system in S1 + energy recovery; S3, maximum, recycling and composting + landfilling; S4, maximum recycling and anaerobic digestion + landfilling; and S5, incinerate all waste + energy recovery.
Economic analysis
Reducing emissions from alternative scenarios can be subject to economic constraints depending on the technology adopted and whether reductions are considered in the economic valuation (Table 7). In the context of the existing waste management system, maximizing waste recycling and composting with minimal landfilling decreases the management cost most (–21% with carbon credit). Optimizing emissions reduction through incineration and energy recovery (S5) reduces emissions most at the expense of an overall increase in cost (+52% with carbon credit) (Table 7). The breakeven analysis defines when the carbon credit could enhance the economic viability of adopting a favorable policy towards a technology change. Holding the same value for all parameters, Figure 6 depicts the breakeven points for all scenarios taking into consideration only the reported cost range of carbon credit (0.5–50 US$/MTCO2E). While scenarios S2 and S4 become economically viable at a carbon credit cost of 21 US$/MTCO2E, scenario S3 stipulating maximum recycling and composting with landfilling remains profitable under the entire range of carbon credit. On the other hand, incineration with energy recovery under scenario S5 requires the highest capital investment and cannot achieve overall economic attractiveness except under the highest carbon credit cost of ~50 US$/MTCO2E, albeit showing the greatest potential for emissions reduction.
Economic implications of scenario analysis.
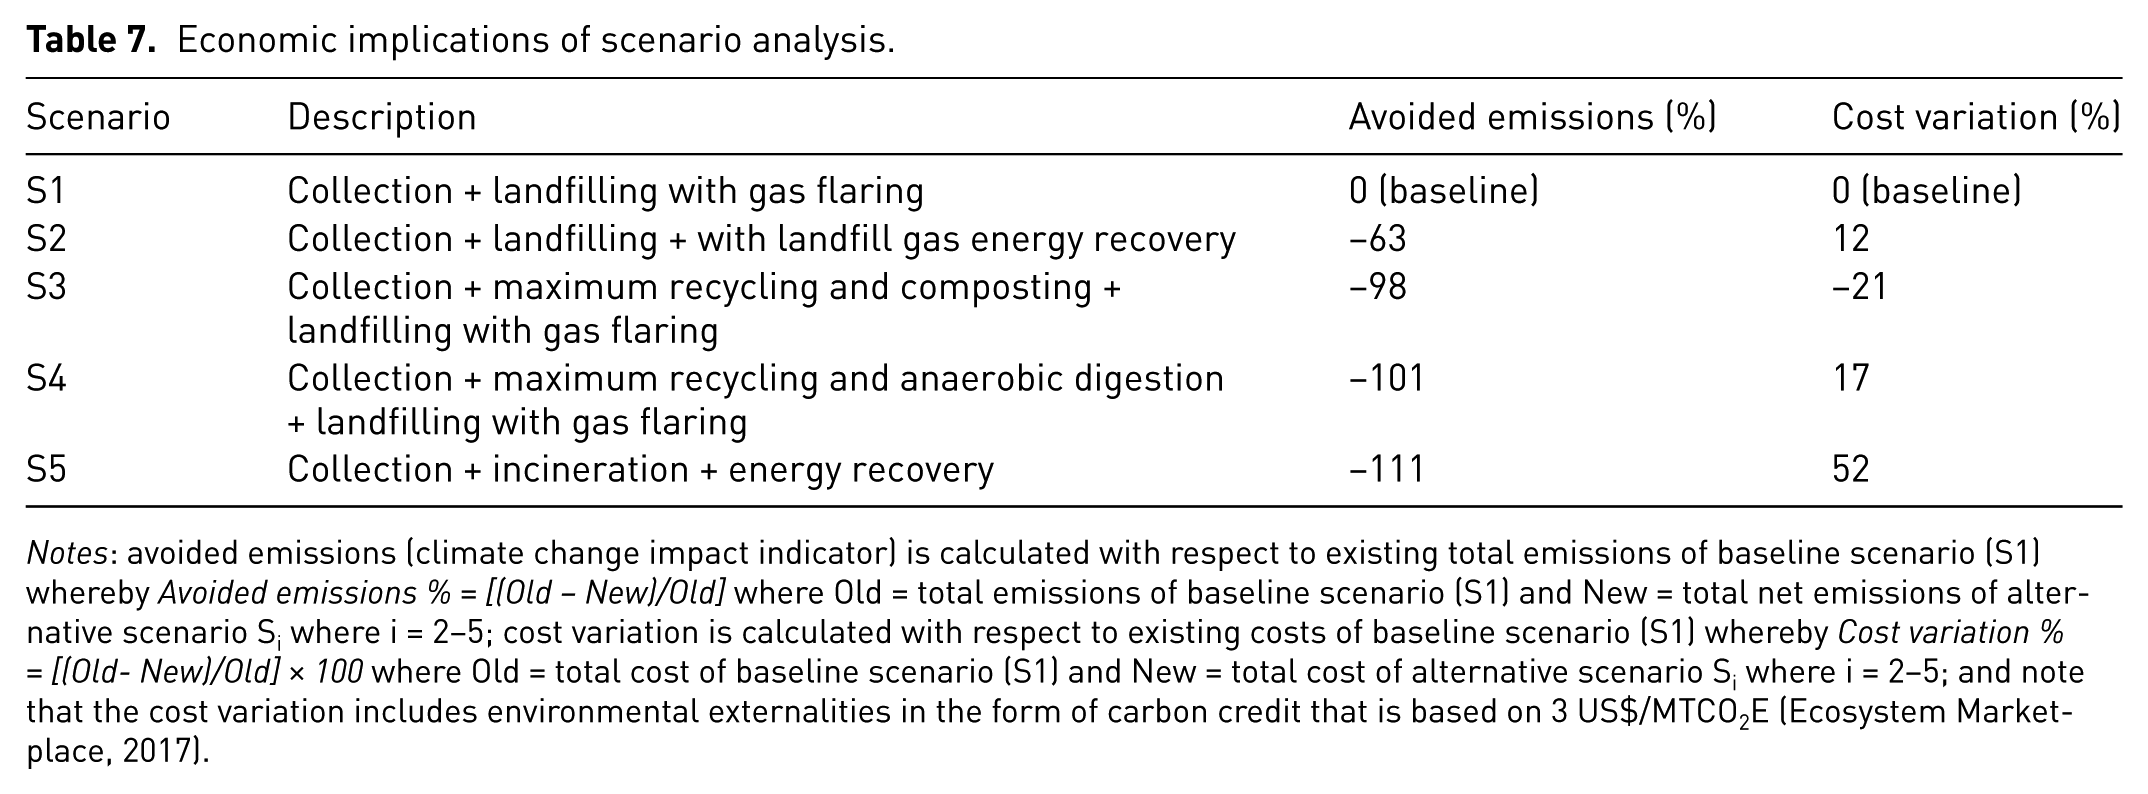
Notes: avoided emissions (climate change impact indicator) is calculated with respect to existing total emissions of baseline scenario (S1) whereby Avoided emissions % = [(Old – New)/Old] where Old = total emissions of baseline scenario (S1) and New = total net emissions of alternative scenario Si where i = 2–5; cost variation is calculated with respect to existing costs of baseline scenario (S1) whereby Cost variation % = [(Old- New)/Old] × 100 where Old = total cost of baseline scenario (S1) and New = total cost of alternative scenario Si where i = 2–5; and note that the cost variation includes environmental externalities in the form of carbon credit that is based on 3 US$/MTCO2E (Ecosystem Marketplace, 2017).
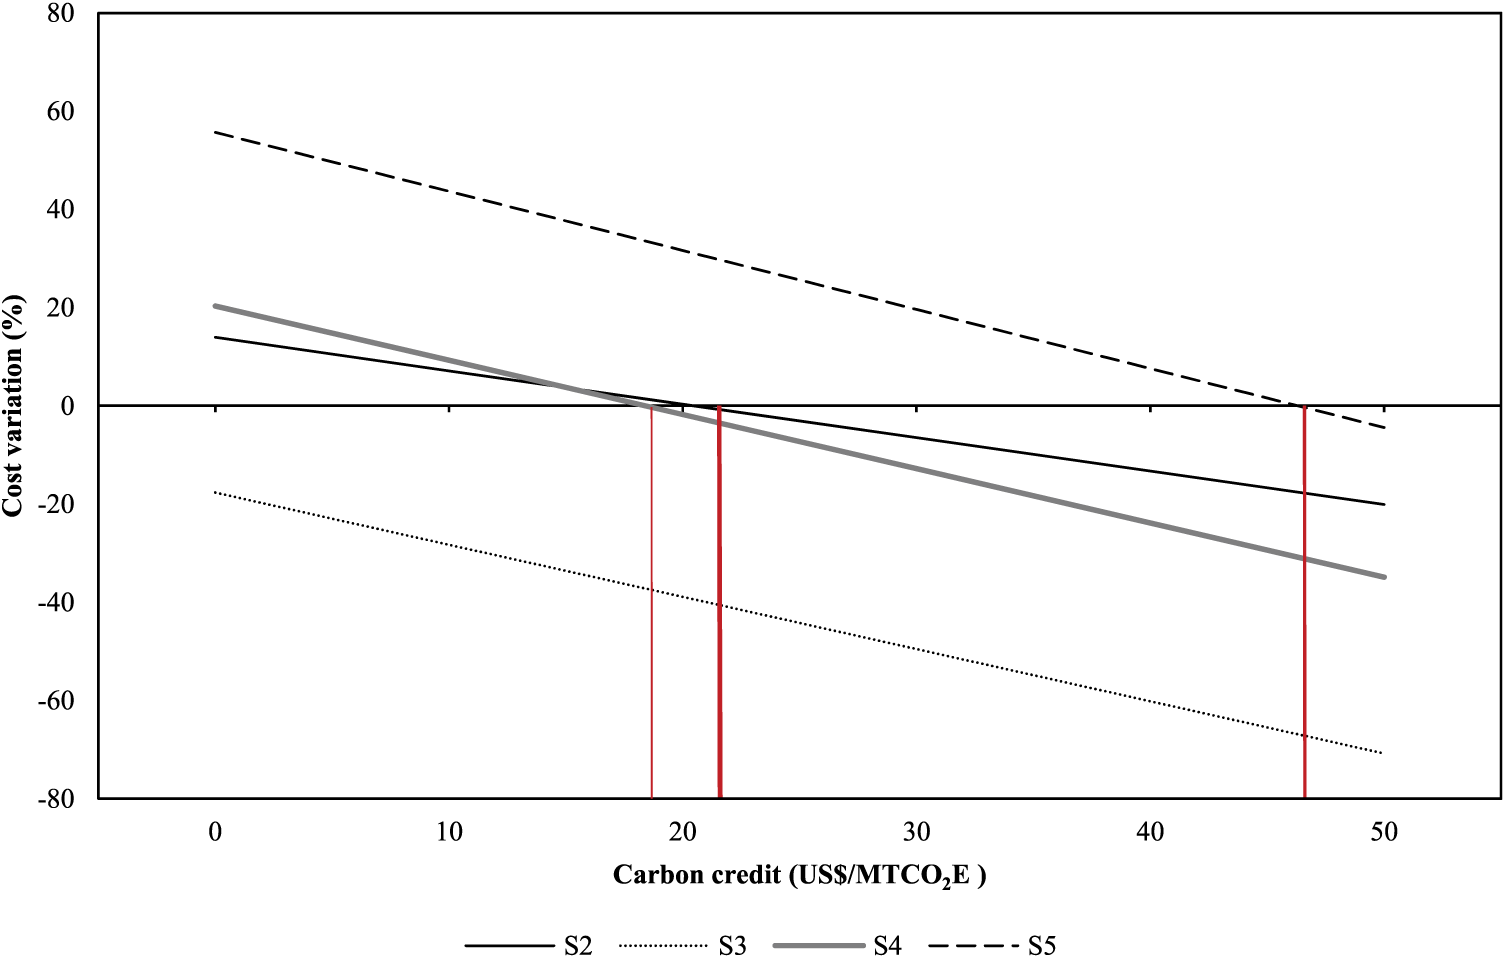
Breakeven point analysis for carbon credit with respect to baseline scenario S1: S1, baseline scenario: landfilling all waste with flaring; S2, upgrade landfill gas capture system in S1 + energy recovery; S3, maximum recycling and composting + landfilling; S4, maximum recycling and anaerobic digestion + landfilling; and S5, incinerate all waste + energy recovery.
The sensitivity analysis for all scenarios showed a significant change in the economic impact ranging from −76% to +93% at a cost range of carbon credit of 0.5 and 50 US$/MTCO2E (Figure 7). Incineration with energy recovery contributed most to the variation in cost that ranged between −70% and 93% with respect to the baseline scenario S1 (Figure 7). Energy recovery of LFG collected instead of flaring (S1) can contribute to significant savings in cost that reached 76% with respect to S1 at a higher carbon credit exchange rate (Figure 7). Similar to incineration, the cost of AD with energy recovery varies widely from −76% to 61% with respect to the baseline scenario S1 (Figure 7).
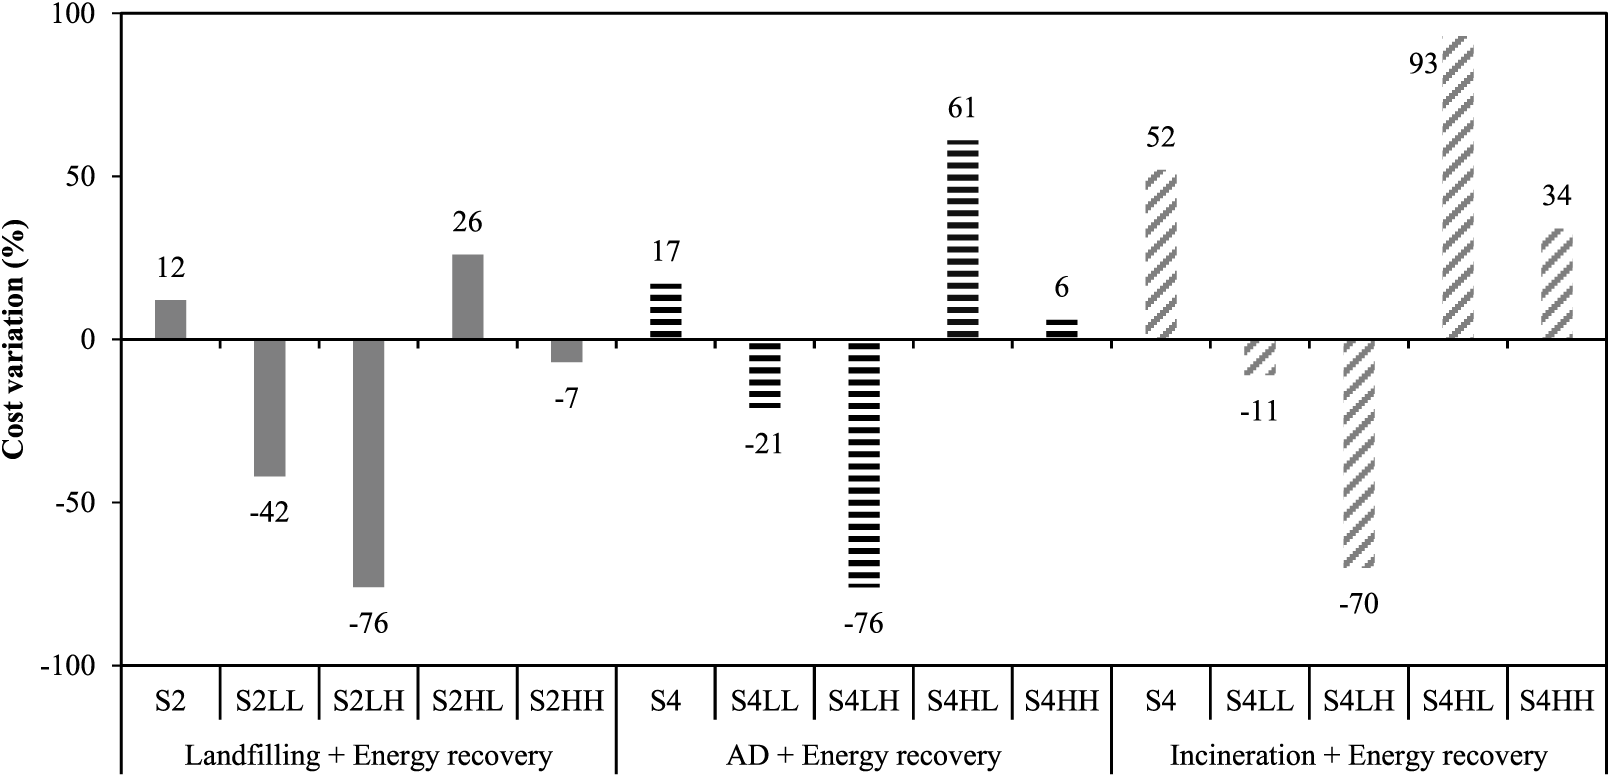
Sensitivity to the cost of waste management processes and carbon credit (comparison with baseline scenario S1): SLL, process and carbon credit costs set at their lowest values; SLH, process cost set at its lowest value and carbon credit at its highest; SHL, process cost set at its highest value and carbon credit at its lowest; SHH, process cost set and carbon credit set at their highest values; S1, baseline scenario: landfilling all waste with flaring; S2, upgrade landfill gas capture system in S1 + energy recovery; S4, maximum recycling and anaerobic digestion + landfilling; S5, incinerate all waste + energy recovery.
It is worth mentioning that other externalities (e.g., real estate depreciation, air and groundwater pollution with potential health impacts) may affect the economic valuation of various scenarios. Another limitation is related to time factor considerations that affect both costs and emissions (e.g., time required for the construction of different waste facilities). Moreover, current and future offsets of electricity were assumed similar.
Conclusion
The LCA was applied in evaluating waste management alternatives towards defining optimal integrated systems. The highest environmental impacts were associated with scenarios that include landfilling with minimal material and energy recovery. Environmental benefits can be achieved under scenarios that maximize recycling and composting whereby cost savings in emissions reached up to 98%. Incineration with energy recovery reduced equivalent emissions most at a varying cost of −70% to +93% depending on the selected technology and the value of carbon credit. Despite the decrease in emissions, increased operational and investment costs favor alternatives that consider maximizing recycling and composting with residual landfilling when land is available. The sensitivity analysis suggested that greater savings in emissions can be achieved with improved landfill gas collection efficiency, application of produced compost, and energy recovery during incineration. Finally, the breakeven analysis showed that maximizing material recovery and landfilling remains profitable under the entire range of carbon credit (0.5–50 US$/MTCO2E). While the results provide guidelines for policy-planning and decision-makers on the economic viability of investment in carbon credit, potential changes in costs due to the dynamics of economy of scale and other externalities should be considered in the economic analysis.
Supplemental Material
815951_supp_mat – Supplemental material for Life cycle assessment for solid waste management in Lebanon: Economic implications of carbon credit
Supplemental material, 815951_supp_mat for Life cycle assessment for solid waste management in Lebanon: Economic implications of carbon credit by Amani Maalouf and Mutasem El-Fadel in Waste Management & Research
Footnotes
Acknowledgements
Special thanks are extended to Dar Al-Handasah (Shair & Partners) for its support to the graduate programs in Engineering at the American University of Beirut.
Declaration of conflicting interests
The authors declared no potential conflicts of interest with respect to the research, authorship, and/or publication of this article.
Funding
The authors disclosed receipt of the following financial support for the research, authorship, and/or publication of this article: This study is supported by joint funding from the Lebanese National Council for Scientific Research (LNCSR) and the American University of Beirut (AUB). Access to the EASETECH software was provided by the Department of Environmental Engineering at the Technical University of Denmark.
Supplemental material
Supplemental material for this article is available online.
References
Supplementary Material
Please find the following supplemental material available below.
For Open Access articles published under a Creative Commons License, all supplemental material carries the same license as the article it is associated with.
For non-Open Access articles published, all supplemental material carries a non-exclusive license, and permission requests for re-use of supplemental material or any part of supplemental material shall be sent directly to the copyright owner as specified in the copyright notice associated with the article.