
Abstract
Many high-value sectors must control acoustic/shock waves through a material, component, or assembly. These waves often require transmission across dissimilar materials through a bonding ‘interlayer’ or ‘matching layer’. Epoxies are commonly used for this purpose, but they are ill-suited with low acoustic impedance. Particulate composites can improve many bulk material properties compared to pure epoxies, including their acoustic impedance, and can be functionally graded to alter properties through the composite thickness. In this study, tungsten–epoxy particulate composites with various tungsten volume fractions (≤35%) were fabricated under either atmospheric or autoclave conditions and subsequently characterised to assess their potential as interlayer materials for wave propagation control. A novel approach to functional grading through gravitational segregation was also explored, with success in lower tungsten volume fractions (≤10% and ≤20% for samples formed under atmospheric or autoclave conditions, respectively). Porosity, density, longitudinal sound speed, acoustic impedance, attenuation, and adhesive bond strength were measured, finding that autoclave samples offer reduced porosity and better functional grading control. Various desirable material property values/ranges were produced through controlling different processing parameters and composite compositions. This suggests particulate composites could be used to optimise desirable properties in bonding interlayers that require wave propagation control.
Keywords
Introduction
The control of acoustic waves (and shock waves, in extreme environments) through a material, component, or larger assembly is critical in multiple sectors. 1 Many of these high-end industries require the bonding of different materials with vastly different properties together, while still requiring the control of waves passing through the bonded materials/the bond itself. For example, armour frequently requires the bonding of a monolithic ceramic tile to a metallic backing material2,3,4 to reduce the mass of the system whilst delivering the same level of ballistic protection. Similarly, aerospace often combines lightweight, thermal-resistant, and inert ceramics with metallic or composite materials,5,6,7 which must still be able to resist typical loads, vibration, or even potential high-velocity impacts from bird strikes. 7 Within this field (and others such as the automotive sector), lightweight damping materials are often coupled or bonded to surfaces within noisy structures, such as aeroplanes, to reduce noise to the passengers. 8 Transducers require the coupling of a dissimilar piezoelectric ceramic material and the polymeric acoustic lens without significant disruption of the acoustic signal passing through the bonding material.9,10,11
Structural adhesive materials are often used as these bonding ‘interlayers’ (also called ‘matching layers’), defined as the comparatively thin bonding layer between two other materials. Epoxy is a commonly used adhesive typically chosen for its high strength-to-weight ratio, good adhesion and mechanical strength, low cost, compatibility with multiple materials, and ease of processing.12,13 However, polymer-based interlayers like epoxy are often sub-optimal for wave propagation due to their low acoustic impedance, often an order of magnitude lower than the adherend materials. 4 This results in considerably higher magnitude tensile waves being reflected into the original material when an incident wave reaches the structural adhesive interface, with minimal transmission of the incident wave through the interlayer into the rest of the system. 1 Dependent on the application, this can be highly undesirable. Other interlayer solutions must therefore be considered for these applications; a recent study highlights this, noting the “growing interest in multifunctional materials that combine structural strength with sound absorption capabilities”. 13
Such desired improvement of the adhesive layer can be achieved through ‘particulate epoxy composites’. Epoxies are often mixed with minimal quantities of small particles of other materials to alter their properties12,13,14,15 to form such composites. If applied before the epoxy cures, these composite mixtures can then be used as an adhesive, essentially altering the properties of the adhesive interlayer. This approach has the potential to lessen the sudden transition of material properties between the two vastly different adherends and bond layer. Such control can be achieved through altering either the filler or matrix material, their relative prevalences within the composite, and/or the manufacturing methodology.15,16,17
The effect of rigid particle ‘filler’ inclusions with various geometries within a ‘matrix’ material has been previously demonstrated in simulations to cause considerable disruption to the transmission of waves.18,19 Empirical characterisation of particulate epoxies containing alumina,16,17,20 tungsten,16,17 tungsten carbide, 21 and Lead Zirconate Titanate (PZT) 16 (with various particle sizes of between 1 and 100 μm) have demonstrated changes in acoustic impedance and attenuation or empirically successful control of shock waves and impact loading.20,21 Practical examples of particulate epoxy composites for controlling the passage of waves include munitions storage systems to reduce munition fratricide risks from shock wave propagation 22 and the fabrication of optimised transducer backing materials,15,16,23 or even as intermediate layers11,23 (although their use as adhesive intermediate layers in these sources was not considered).
Most previously fabricated particulate composites have been used as bulk components with homogenous dispersion of the particles within the epoxy matrix. There is comparatively less evidence of particulate composites used as adhesive interlayers. Recent research exploring the addition of alumina, aluminium, or copper particles to an epoxy found increases to bond strength, although the work focused on improving thermal properties in the bond. 12 Another study found increases to bond strength in mixed sand particles and epoxy, although this was for the application of corrosion-resistant coatings rather than interlayers. 24 The addition of bentonite or calcium carbonate particles to an epoxy specifically for acoustic absorption has also been explored, although the composite formed was not considered for use as an interlayer or bonding material. 13 Intermediate layers of tungsten–epoxy particulate composites have been used to bond other adherends within transducers for acoustic coupling, but this investigation did not consider bond strength. 9 Consequently, given the limited range of available information in the literature and the importance of this area, it is suggested that more comprehensive research is required. This should ideally focus on the full suite of material properties required for the use of these composites as adhesive interlayer materials, especially for wave propagation control in applications beyond transducers.
Functionally graded materials (FGMs) which see the gradual change of material properties across a typically macroscopic material/component have also been previously highlighted as beneficial for the control of waves (as well as other important properties) through materials.9,25,26,27,28,29 Some previously fabricated FGMs attempting to control acoustic properties use multiple distinct layers of materials with different acoustic properties (notably acoustic impedance) to achieve this gradual change,27,30 but the distinct interfaces between these layers would still generate wave reflections that could be undesirable. Furthermore, the multiple intermediate layers require joining, which would often utilise an acoustically non-optimal structural adhesive. Other successful approaches for FGMs with acoustic control have considered complex geometries that are not simple to fabricate28,31 and can be expensive, or foams32,33 that may not achieve the structural requirements for some applications.
However, particulate composites could create FGMs with a significantly more gradual gradient between two adherend materials that avoids creating distinct interfaces between multiple intermediate layers. This can be achieved through altering the prevalence of a filler material through the depth of the composite, either through complex control of the manufacturing conditions, or more simply through gravitational segregation of the particles during the curing process. FGMs have been fabricated using several layers of particulate composites as distinct intermediate layers with different acoustic properties to create FGMs with easily controlled acoustic impedance values.9,10 However, these did not attempt to functionally grade a singular intermediate layer; they all required multiple distinct homogenous layers to be stacked (with the settling of particles generally discouraged 9 ). There is scope for these designs to be further improved through the manipulation of particles to generate one singular functionally graded particulate composite interlayer.
This work aimed to further research and demonstrate the suitability of tungsten–epoxy particulate composites with increased acoustic impedance as interlayers/bonding layers, which appears an under-researched field. This required a more holistic assessment of both material acoustic properties and bond strength than seen in previous studies. The potential for functional grading within these materials through gravitational segregation was also a desired outcome, demonstrating the relative ease with which this could be achieved. As such, consideration was given to: (1) Functional grading through gravitational segregation. (2) Acoustic impedance (requiring measurement of both longitudinal sound speed and density). (3) Porosity. (4) Attenuation. (5) Adhesive bond strength. (6) Manufacturability.
Methodology
Sample creation
Samples were created by combining DP190 translucent
34
(henceforth DP190) in various volume fractions (% vol. W henceforth) with a 60 mesh (250 μm) crushed tungsten grit powder (Plansee SE, batch number 258/004, dated 31 Mar 2010). As less viscous adhesives have been previously identified to minimise trapped air bubbles
35
and for the successful fabrication of previous particulate composites,
9
DP190 was chosen for its low viscosity (3.5–11.5 Pa.s). It also had reasonable bond strength when paired with optimum surface preparation techniques (12.41 MPa) and a pot life of 60 min to allow mixing and application without the epoxy becoming unworkable. The tungsten powder employed is shown in Figure 1. x50 magnification SEM image of the tungsten powder used (taken using a Hitachi SU3500 with an accelerating voltage of 10 kV with the secondary electron setting).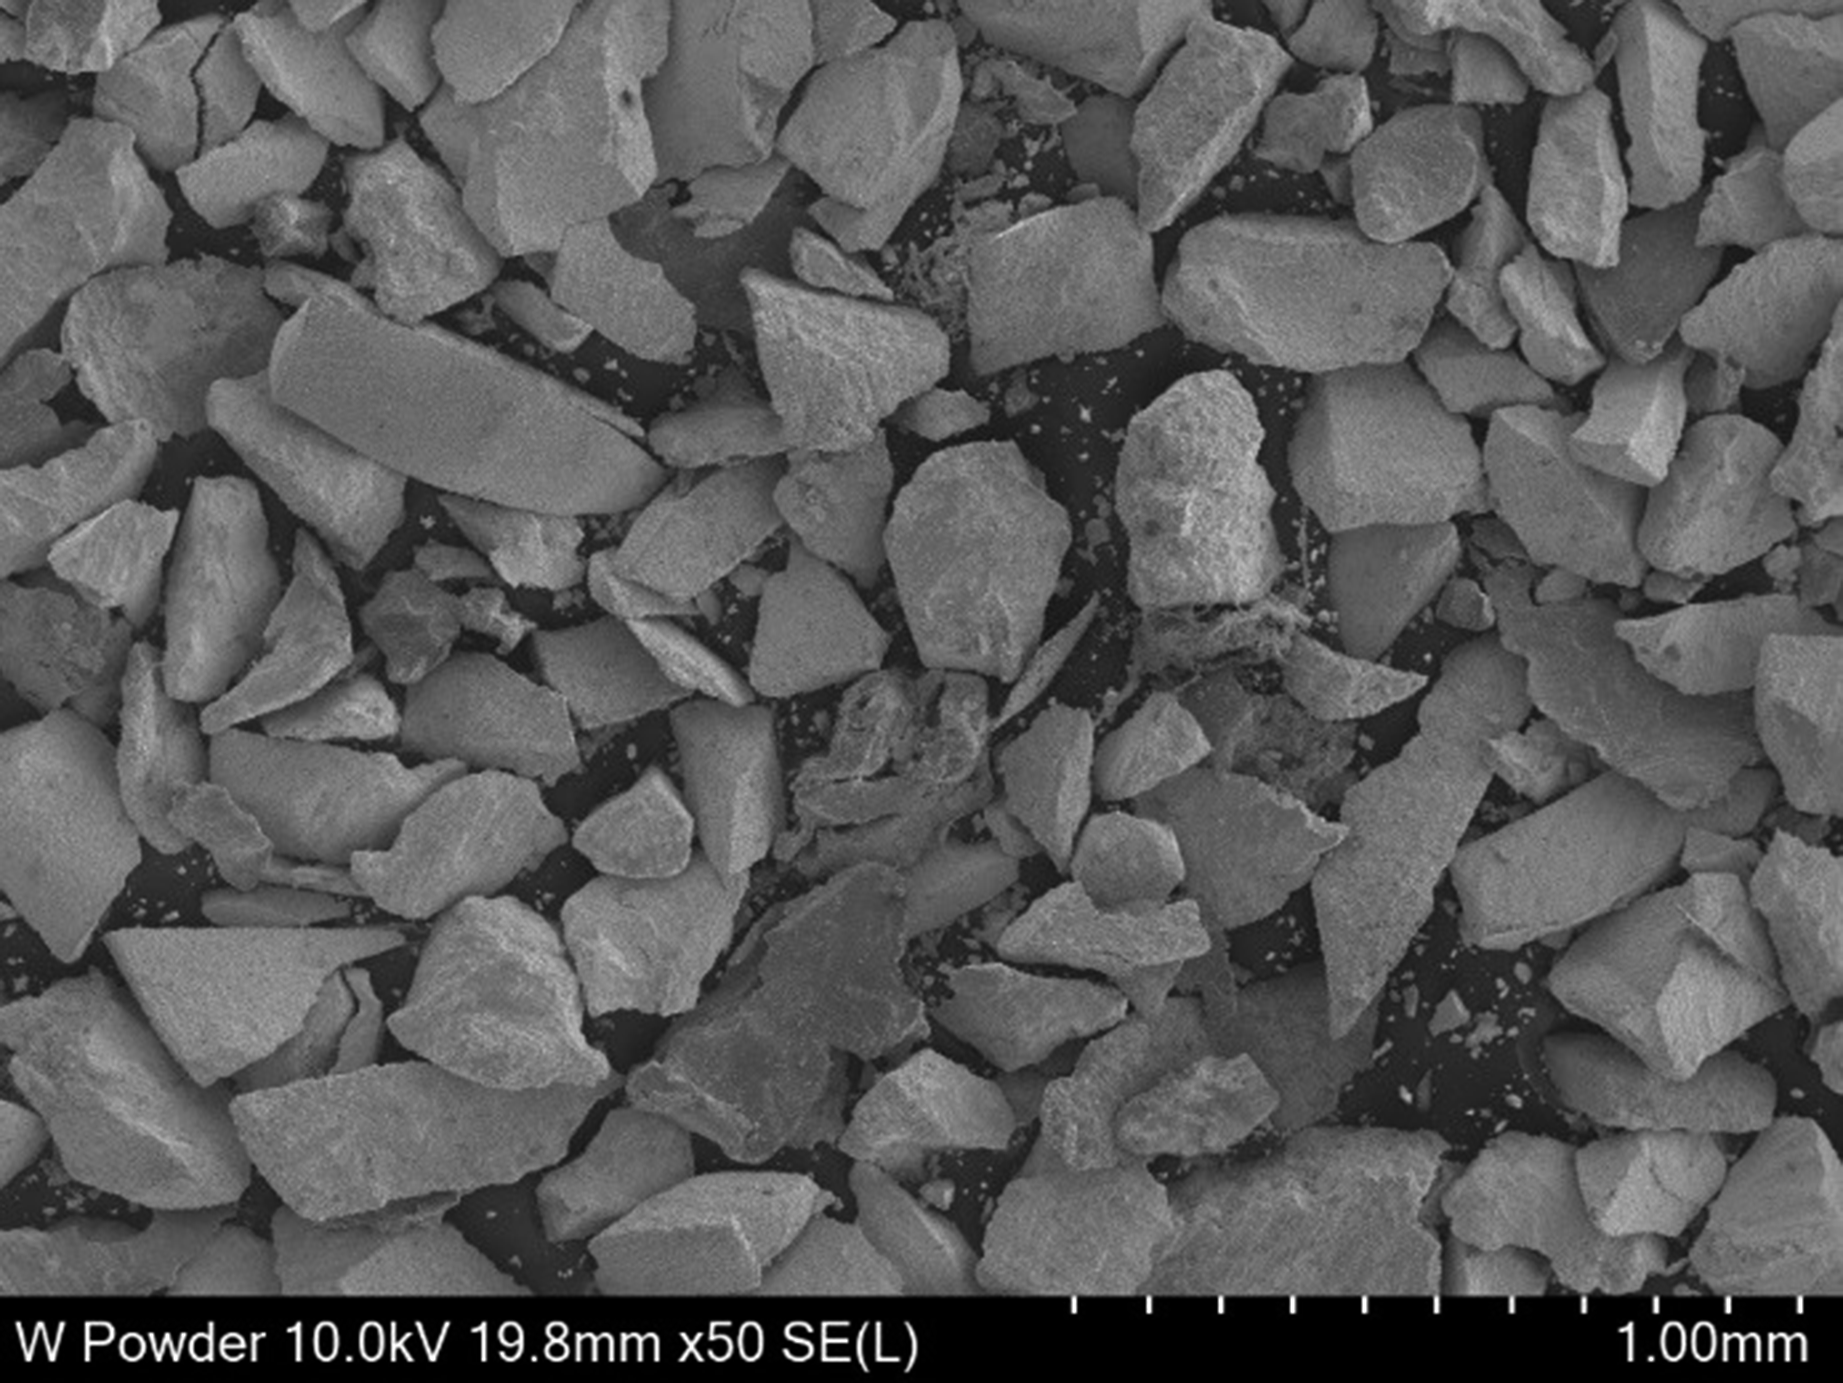
Three sample batches were prepared for experimental investigation. Batch A was used to create composite discs under atmospheric conditions (‘ATM discs’ henceforth). Batch B was used to create composite discs under autoclave conditions (‘AC discs’ henceforth) and included 1% vol. ⌀300 μm glass beads. Batch C was used to create shear overlap test samples under atmospheric conditions. Each batch formed slightly different % vol. W samples.
For the creation of each batch, a known volume of DP190 was prepared alongside multiple pre-weighed tungsten powder quantities (scales accurate to the nearest 0.01 g). These powder quantities would be added at various stages to form pre-determined % vol. W samples. The first pre-weighed tungsten quantity was added to the known volume of epoxy and stirred in, making the lowest % vol. W mixture for the batch. Some of this mixture was then extracted to create samples (i.e. discs or shear overlap test assemblies). The next pre-weighed tungsten quantity was then added to the remaining mixture, generating the next % vol. W for the batch. This process was repeated until all required samples were manufactured, as summarised in Figure 2. All samples were produced within the 60-min pot life of the DP190. Flowchart of the process to create the batches with varying % vol. W for the creation of samples.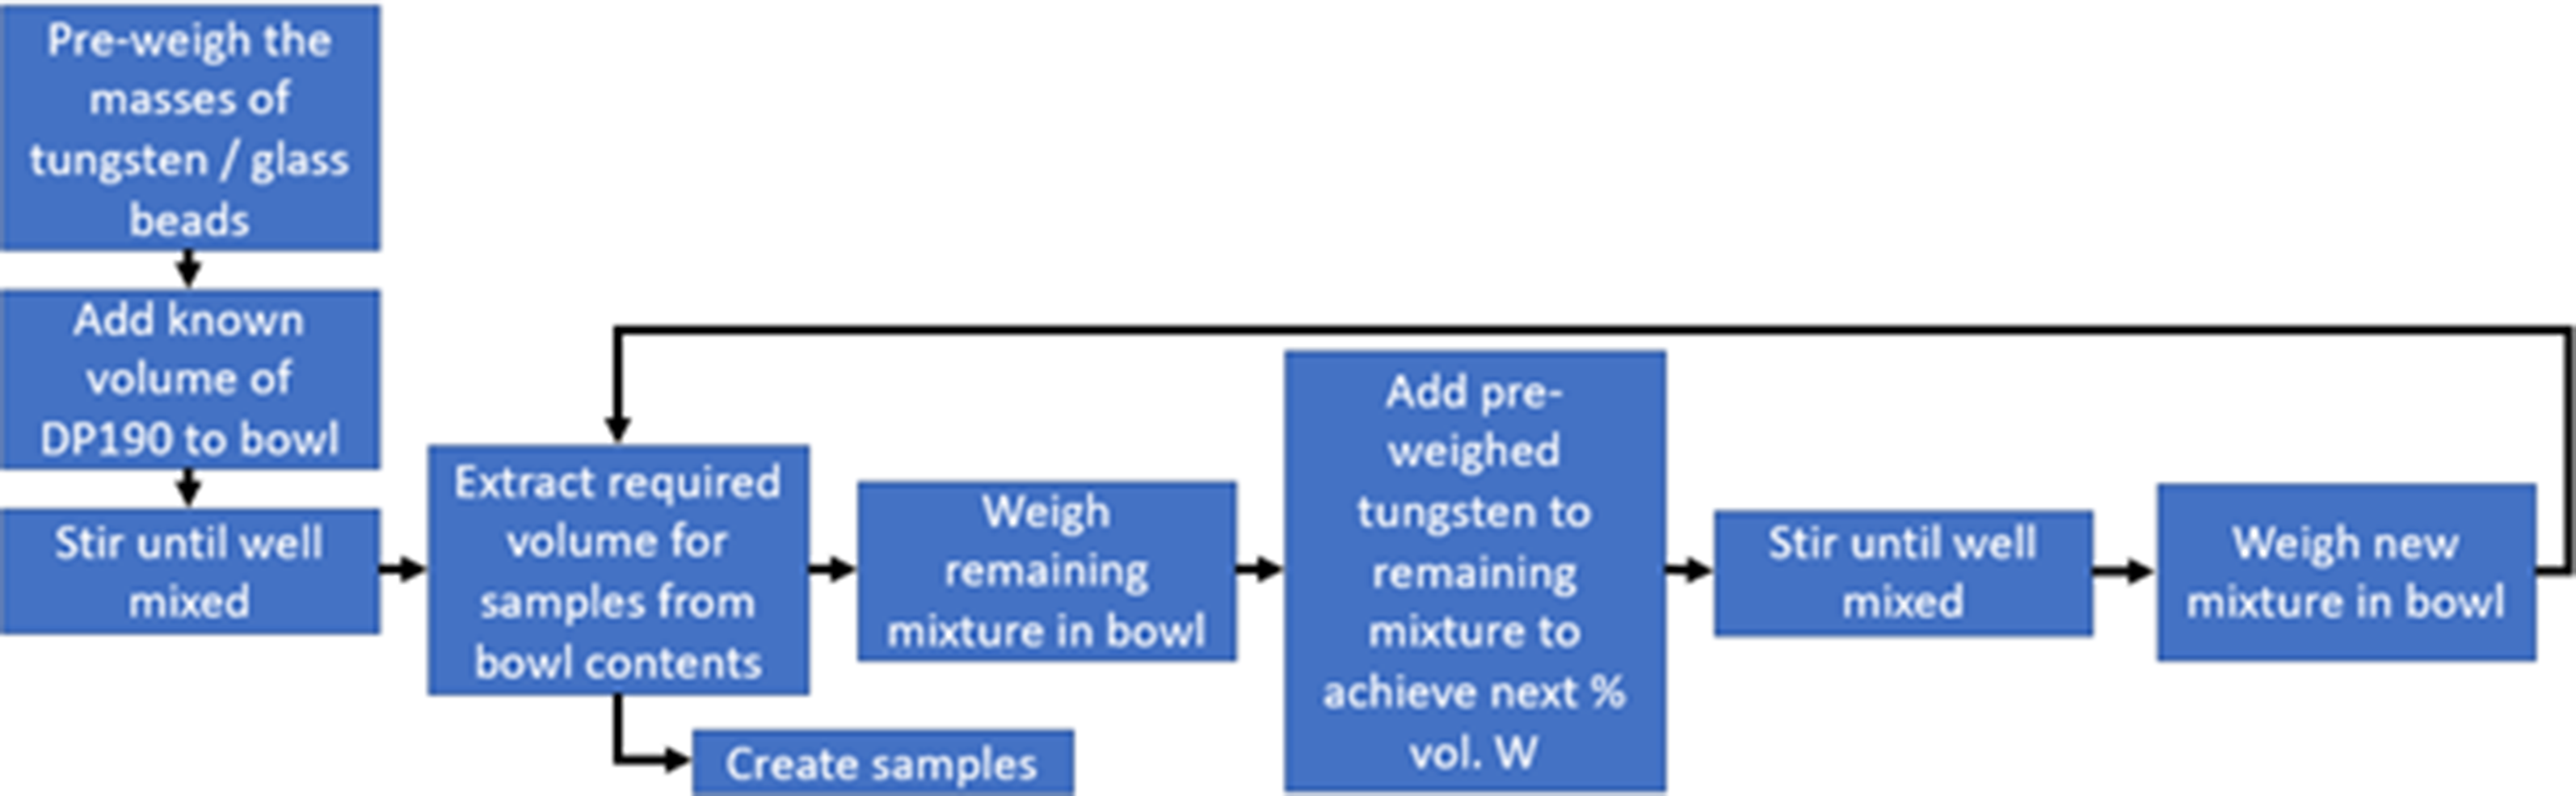
For the composite discs, approximately 3 ml of the mixture was extracted in a syringe before being decanted into an open-topped silicone mould, forming discs ≈⌀20 mm and ≈7 mm thick. The ATM discs were left to cure and degas naturally, whilst the AC discs were held at four bar and 29°C for four hours.
For the pull tests, three samples of each % vol. W were designed to conform to ASTM Standard D1002 where possible. 36 As a pure epoxy benchmark, three epoxy samples with 3M Positioning Fabric AF3306-2 and two epoxy-only samples were created. 12.7 × 14.0 mm adherend sites of two mild steel strips of 100 × 14 × 1.4 mm per sample were wiped with acetone only and allowed to air dry, without any additional surface preparation. The adhesive composite was applied generously to the adherend site of one strip, and the adherend site of the second strip was then pressed against the adherend site. The samples were placed in a vertical clamp, applying even pressure across samples and ensuring the thinnest bond line possible. Once fully cured, any excess epoxy mixture was removed from the region around the adherend site using a scalpel.
Composite visualisation
Prior to destructive testing, several ATM discs were analysed using computerised tomography (CT) for qualitative and quantitative characterisation. These scans were performed at 100 μm intervals using a Nikon XT H225 micro-CT scanner with a 1 mm Cu filter at 110 kV and 46 μA. The exposure time was 500 ms, utilising Inspect-X software. This resulted in a voxel size of 23.7 μm. X-ray radiographs were taken, employing the same parameters and same instrument using a 64-frame average to allow for 3D visualisation of the dispersal of the tungsten powder. Processing several images in the z-axis CT scan stack using ImageJ 37 allowed the percentage coverage of tungsten to be determined at various layers, indicating any functional grading through gravitational segregation of particles at various depths in each disc.
Later, an alternative destructive method was established to visualise the tungsten dispersion in the samples, especially for discs with greater % vol. W which were impenetrable by X-rays. Each disc was sectioned using a diamond saw on a Model 660 South Bay Technology Inc cutter with a diamond circular blade and polished using a Struers RotoPol-21 polishing wheel at 150 rpm with a 3 μm grit solution for 15 min. This allowed accurate stereo microscopy of the cross section with an Olympus BX53 M paired with the Olympus Stream Essentials software for image capture. Multiple images at 25x magnification were taken across the entire cross section and later stitched together. These images were then processed using ImageJ. 37 By applying bandpass filters above and below certain brightness thresholds, it was possible to isolate either pores or tungsten to measure their overall prevalence in each disc. Further image analysis of 100 μm tall layers (starting at the base of each disc) was also carried out on these images, allowing the prevalence of tungsten to be calculated in each layer and providing further indication of functional grading of each disc.
Density and porosity
The application of bandpass filters in ImageJ allowed the composite porosity to be determined, in turn indicating the composite density. An empirical reading was also achieved through measuring the mass of each sectioned sample in air and when submerged using a Mettler Toledo XS105 DualRange, calculating the density through the Archimedes principle. The probable porosity within each disc was then calculated using the difference between the measured and expected density of each sample.
Longitudinal sound speed, acoustic impedance, and attenuation
The longitudinal sound speed (required to determine the acoustic impedance) was measured prior to the destructive sectioning of discs. An oscilloscope was coupled with a Panametrics Square Wave Pulse Emitter: Model 5077PR on the ‘transmit/receive’ setting. The equipment was set up as suggested by the manufacturer. 38 Analysis employed a 5 MHz 1” diameter transducer, which was wider than the discs; ideally a transducer smaller than the diameter of the sample would be used to minimise the likelihood of surface reflections from the circumference of each disc being detected – however, this was not feasible for resource reasons.
The upper surface of each disc was polished by hand with 240 grit emery paper until the surface was nominally level to better couple the disc to the transducer, and subsequently washed and dried. The exception is in the 35% vol. W disc where the surface was especially rough due to the high viscosity mixture; this was therefore not further investigated. The average depth of each disc was measured using the optical microscopy images and known recorded values for scale setting on ImageJ, whilst the thickest and thinnest regions of each disc were measured using callipers. The average values were used in sound speed calculations, determining the distance an emitted wave had travelled before being detected by the apparatus, with the thickest and thinnest values being used to generate the error bars in each sample.
Variables used in ultrasound Experiments A and B.
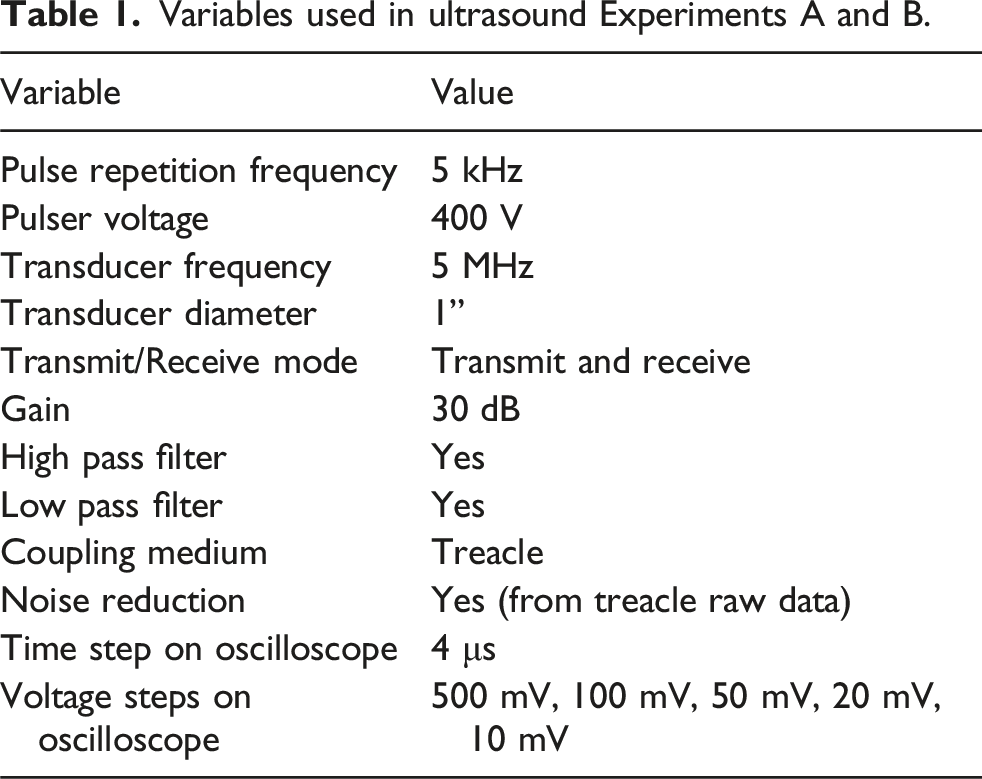
Various voltage step signals were initially recorded with just the transducer and a coupling layer, and then for each % vol. W disc. The signal collected from the treacle layer was subtracted from the raw data for each disc, eliminating any noise caused by the transducer/treacle to isolate the waveform of the composite. This left distinct waveforms where the wave was released and whenever the transmitted signal had been received by the transducer.
The time difference between the signal input and the start of the first detectable reflected peak determined the time between a wave leaving the transducer, travelling through the disc, reflecting off the rear surface and then reaching the transducer again. This value was then used in equation (1) to determine the longitudinal sound speed. The longitudinal sound speed between subsequent reflections was also calculated using the time difference between the start of each wave.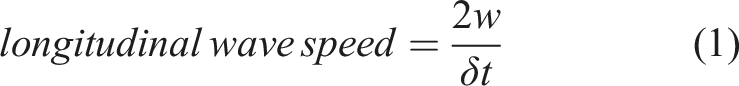
The acoustic impedance was then subsequently calculated using equation (2), with material densities determined via Archimedes principal calculations for each disc.
The attenuation was determined by comparing the amplitude of each wave to the 400 V input amplitude. The highest and lowest peak of each wave was recorded and the difference between them calculated, as summarised in equation (3).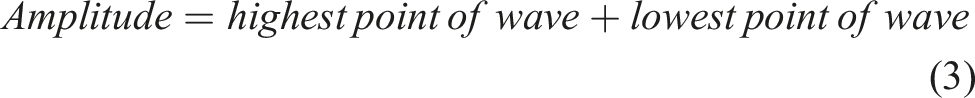
Decibels (dB) quantify the intensity of a wave and are the conventional unit for measuring attenuation. However, transducers do not directly measure the intensity of waves; they record their pressure. The intensity of a travelling wave can be calculated from the pressure using equation (4).
39
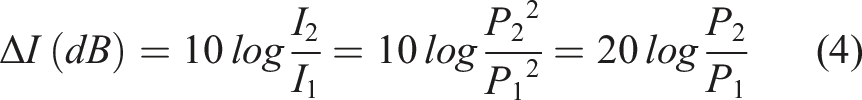
Since transducers produce and detect wave pressures that are proportional to the input and recorded voltages (V
1
and V
2
, respectively), equation (4) can be rewritten as equation (5) to achieve the same result. This allowed all attenuation data to be recorded in the SI units of dB. As attenuation in this work was standardised to be calculated over 1 cm, dB/cm is used herein.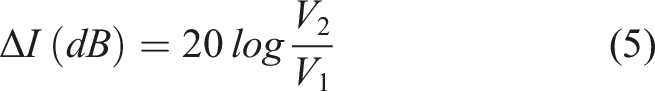
Shear overlap tests
Once cured, the length and width of the adhered overlap region of each shear overlap sample were measured using callipers to accurately determine the area over which the adhesive bond was acting. The bond line thickness was determined by measuring the thickness using a micrometer before and after the adhesive layer was introduced.
The single lap samples were loaded until failure using an Instron 5567 universal testing machine at an extension rate of 2 mm/min. The highest recorded load value before failure was measured. The shear strength was then calculated as per equation (6).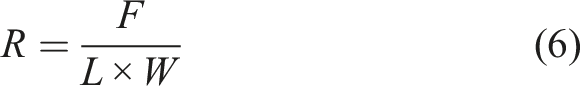
Results and discussion
Sample creation – batch % vol. W
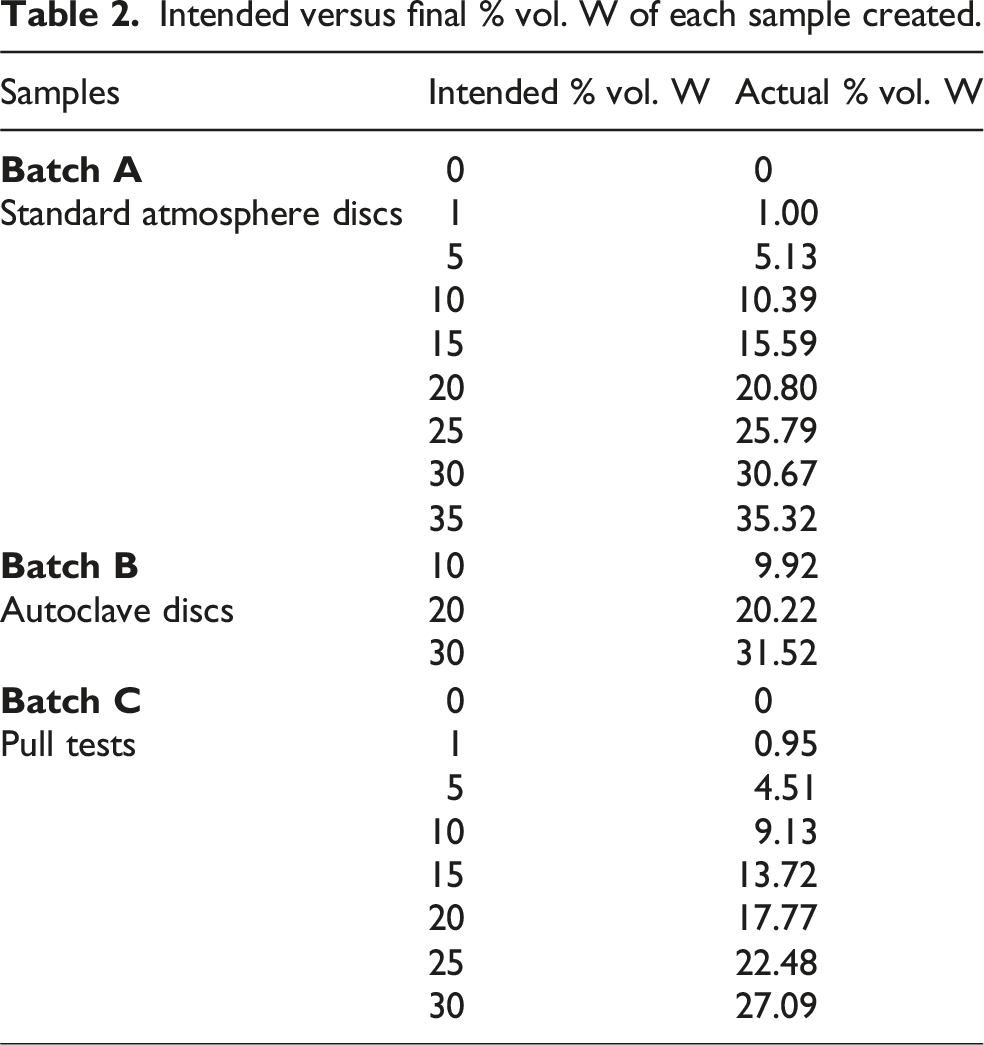
Intended versus final % vol. W of each sample created.
Composite visualisation
CT scanning
The 1% vol. W disc CT scan is shown in Figure 3. The darkest grey regions indicate pores within the disc, indicating some considerable porosity present, whilst the tungsten particles (white) within the epoxy matrix (light grey) indicate that the tungsten is distributed, albeit unevenly, across the entire cured disc. The large horizontal lighter-grey ellipse region at the bottom implies that X-rays failed to penetrate through the material, approximately 0.7 mm deep. As the epoxy was easily penetrated by the X-rays, this ‘blind region’ was likely caused by a deposit of settled tungsten; this is affirmed by the presence of concentrated white (i.e. tungsten) deposits seen towards the edges of the bottom of the disc. This region of settled tungsten is proposed to be due to gravitational segregation of the dense tungsten particles in the viscous epoxy, observed in similar works.16,17,21 x-axis slice through the centre of the CT scan of the 1% vol. W disc formed under atmospheric conditions.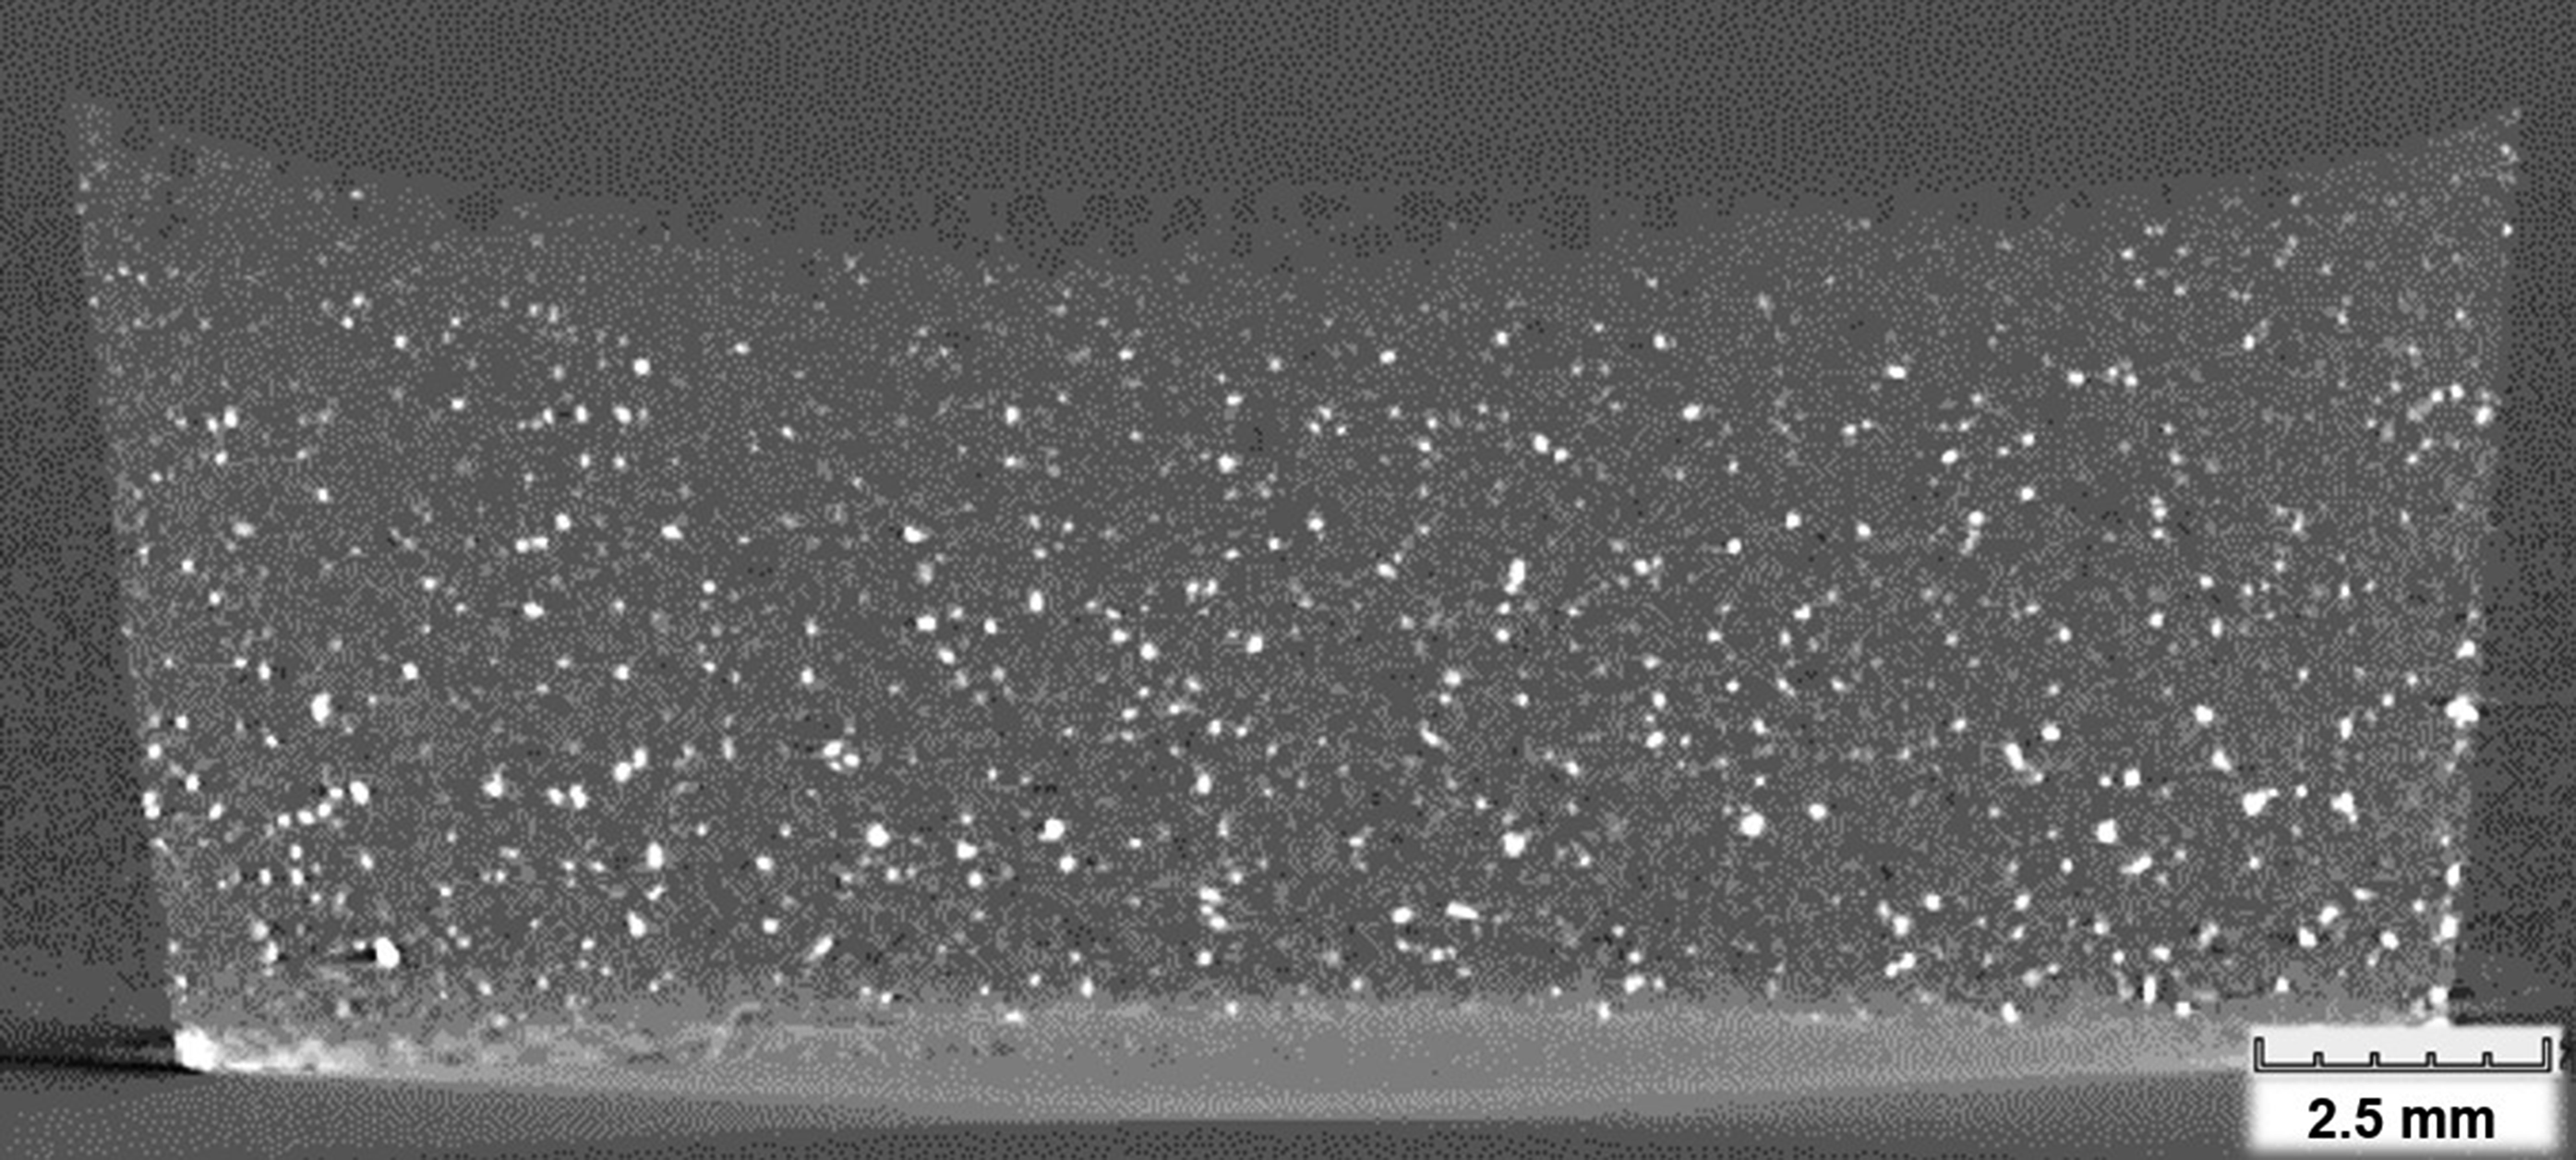
Figure 4 provides further insight into the gradient of the % vol. W through the depth of the disc. Excluding the unmeasurable blind region below 0.7 mm, there is a clear and predictable gradient in the % vol. W presents as the distance from the base of the disc decreased, suggesting that an FGM had been produced and that material properties could be predictable at any chosen depth in the material with corresponding % vol. W data. Through averaging the seven readings at regular 1 mm intervals, the % vol. W was estimated to be 1.95%, almost double the expected % vol. W. This excludes the unmeasurable base region where tungsten is expected to make up a high proportion of the volume; the measured % vol. W would therefore likely be even higher. This may indicate inaccuracies in the CT scanning around each tungsten particle, although this data is still useful to observe trends. x-axis slice through the centre of the CT scan of the 5% vol. W disc formed under atmospheric conditions.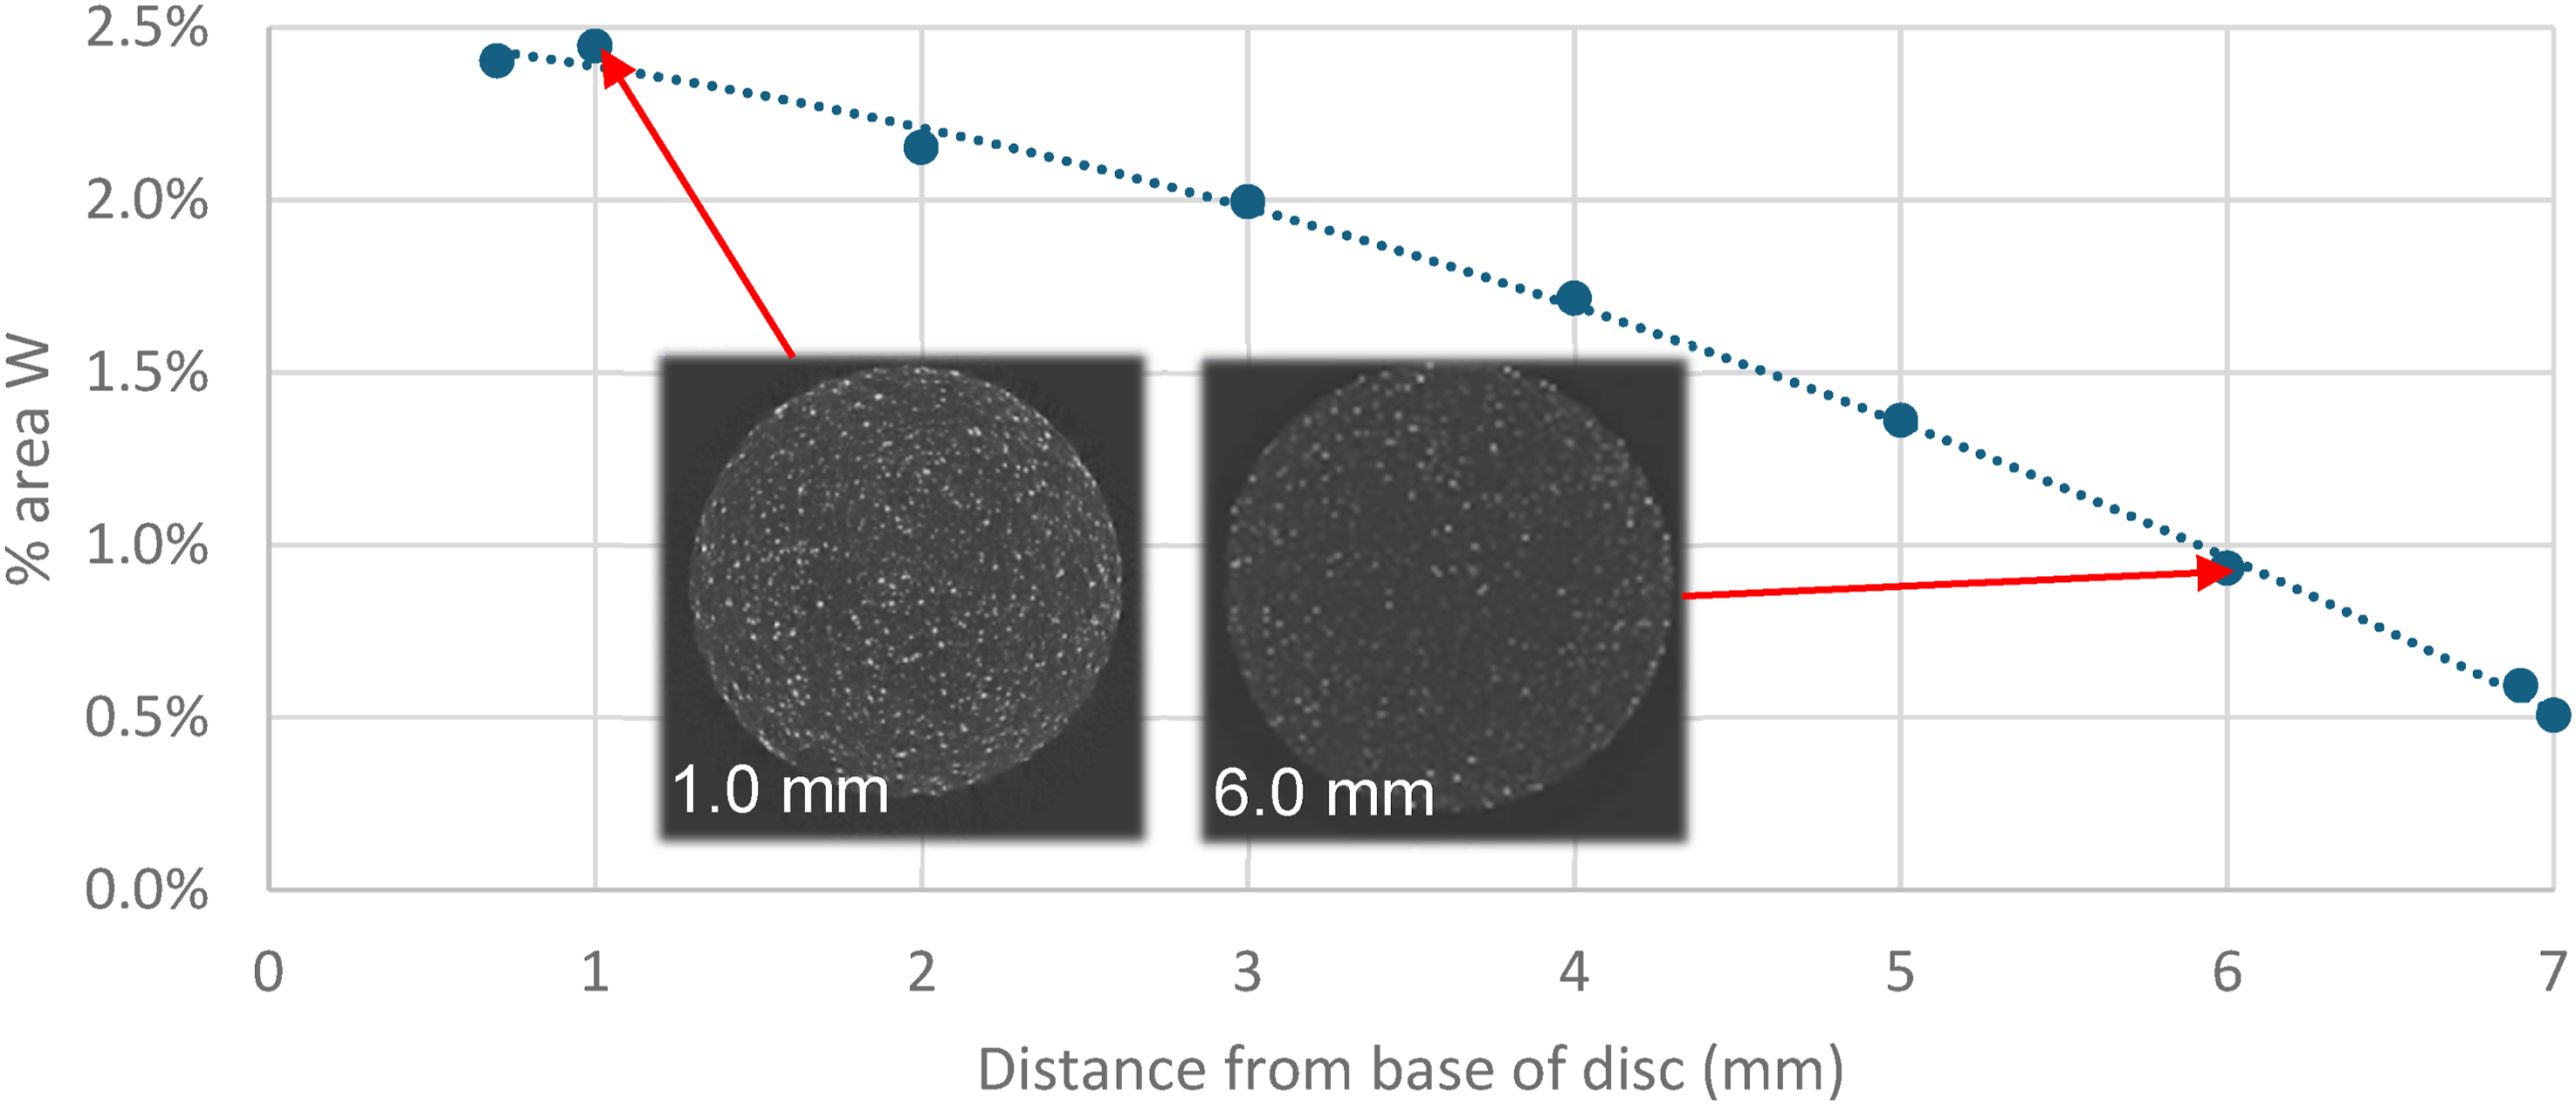
Compared to the 1% vol. W disc (Figure 4), the 5% vol. W disc shown in Figure 5 has considerably more tungsten (white) or epoxy matrix (light grey) regions. The tungsten appears well-dispersed across the sample, excluding the dark grey ellipse region at the bottom of the disc, where, once again, there is a concentrated white (i.e. tungsten) region towards the edges of the bottom of the disc. This ‘blind region’ is deeper and darker than in the 1% vol. W disc at approximately 1.6 mm deep. The change in % area W. with varying disc depth in the 5% vol. W disc formed under atmospheric conditions.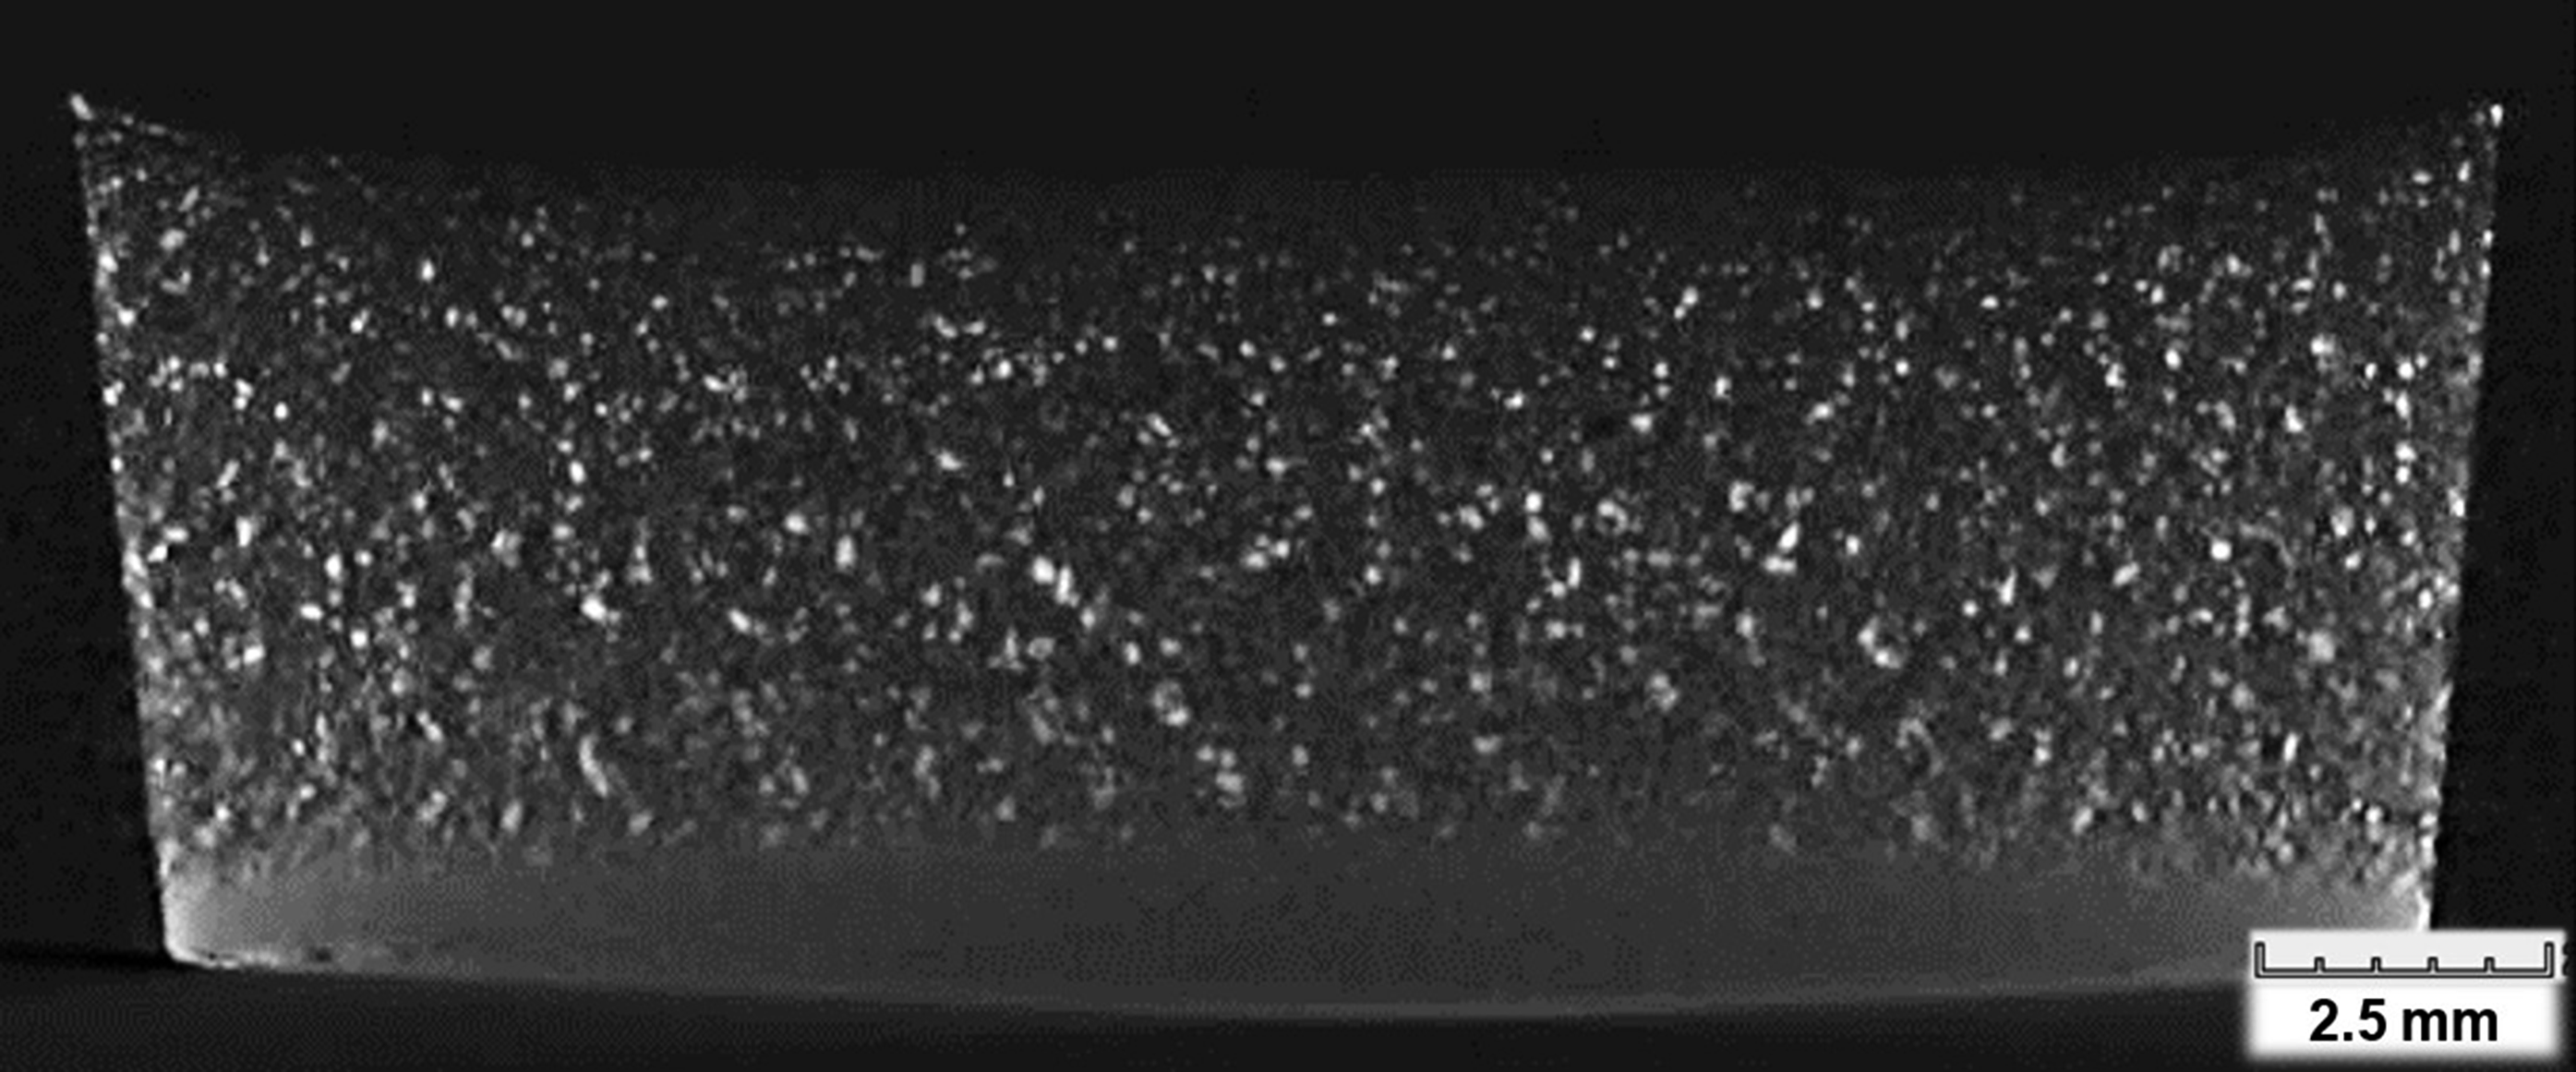
Figure 6 indicates the gravitational settling in the 5% vol. W disc. Similarly to the 1% vol. W disc, there is a predictable trend with increased distance from the base of the disc, although the inverse curve indicates the drop off in % vol. W with increased depth from the base is slower, likely due to the increased viscosity of the mixture prior to curing. Even where ≈10% vol. W is present, a clear image could still be produced for analysis, whereas Figure 4 suggests that a % vol. W of over 2.5% began to become impenetrable to the X-rays. This could suggest an excessive jump in % vol. W at the base of the 1% vol. W sample beneath 0.7 mm (later confirmed in Figure 7). The change in % area W. with varying disc depth in the 1% vol. W disc formed under atmospheric conditions. Optical microscopy cross-sections of the sectioned discs formed under atmospheric conditions (white = tungsten, black = pores, grey = epoxy).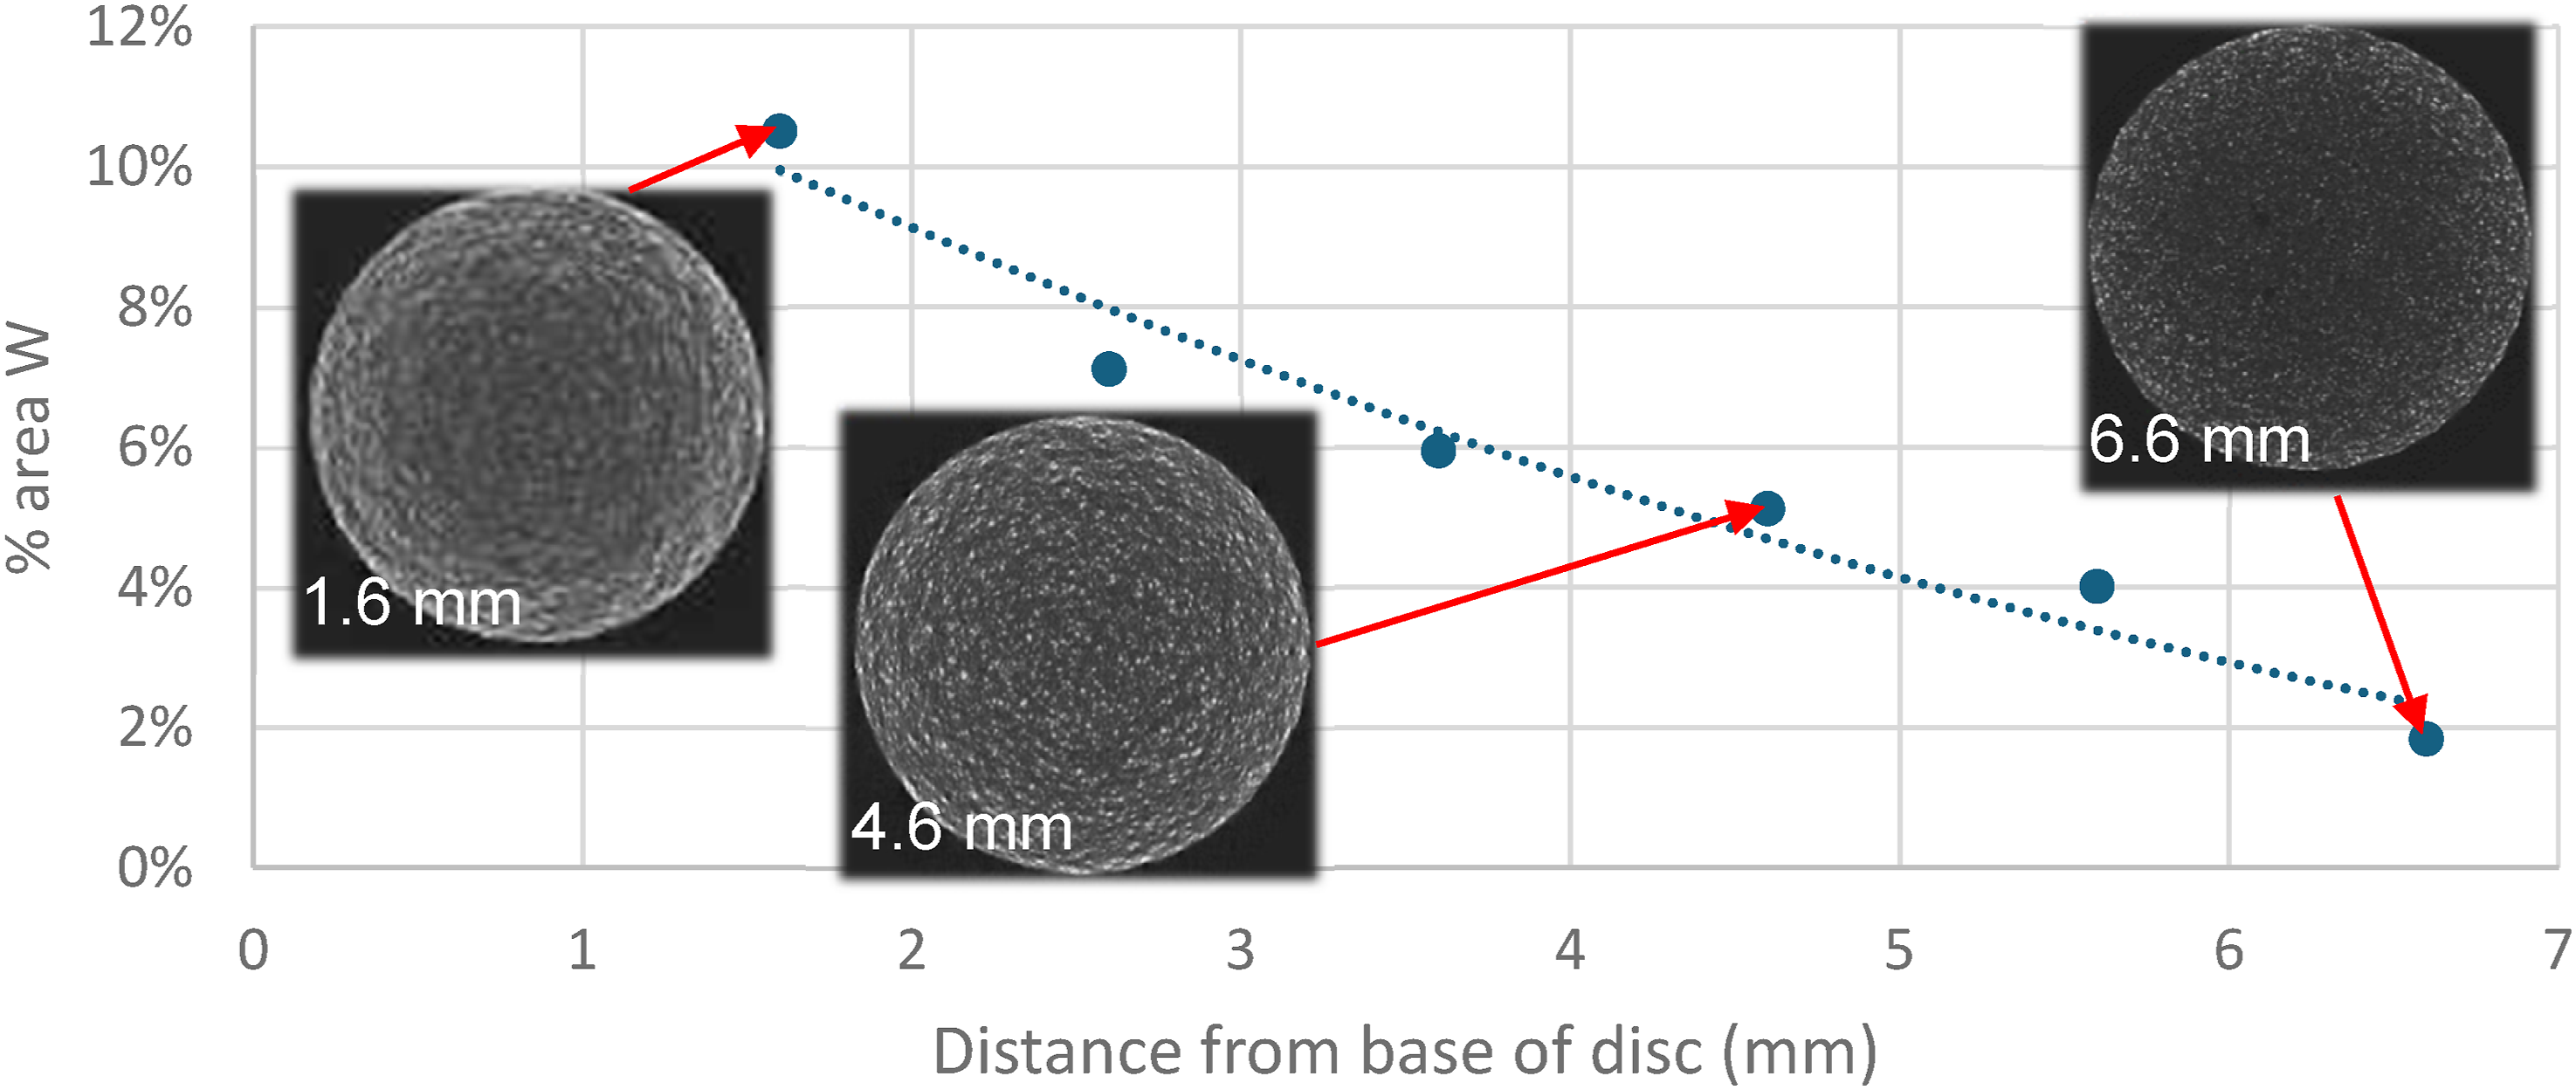
Through averaging the six readings at regular intervals, the % vol. W was estimated to be 5.76%, although this does not include the unmeasurable base region where tungsten is expected to make up a high proportion of the tungsten particles. CT scans of both the 1% vol. W and 5% vol. W samples seem to overestimate the percentage of tungsten present, potentially due to the tungsten preferentially absorbing X-rays around particles, causing the voxels around each particle to also show as tungsten. It is also possible that this is an artefact of the X-ray emitter/detector used in CT scanning and misalignment of the sample with the emitter. Despite these errors, the CT slices are still useful for observing trends.
Sectioned imagery
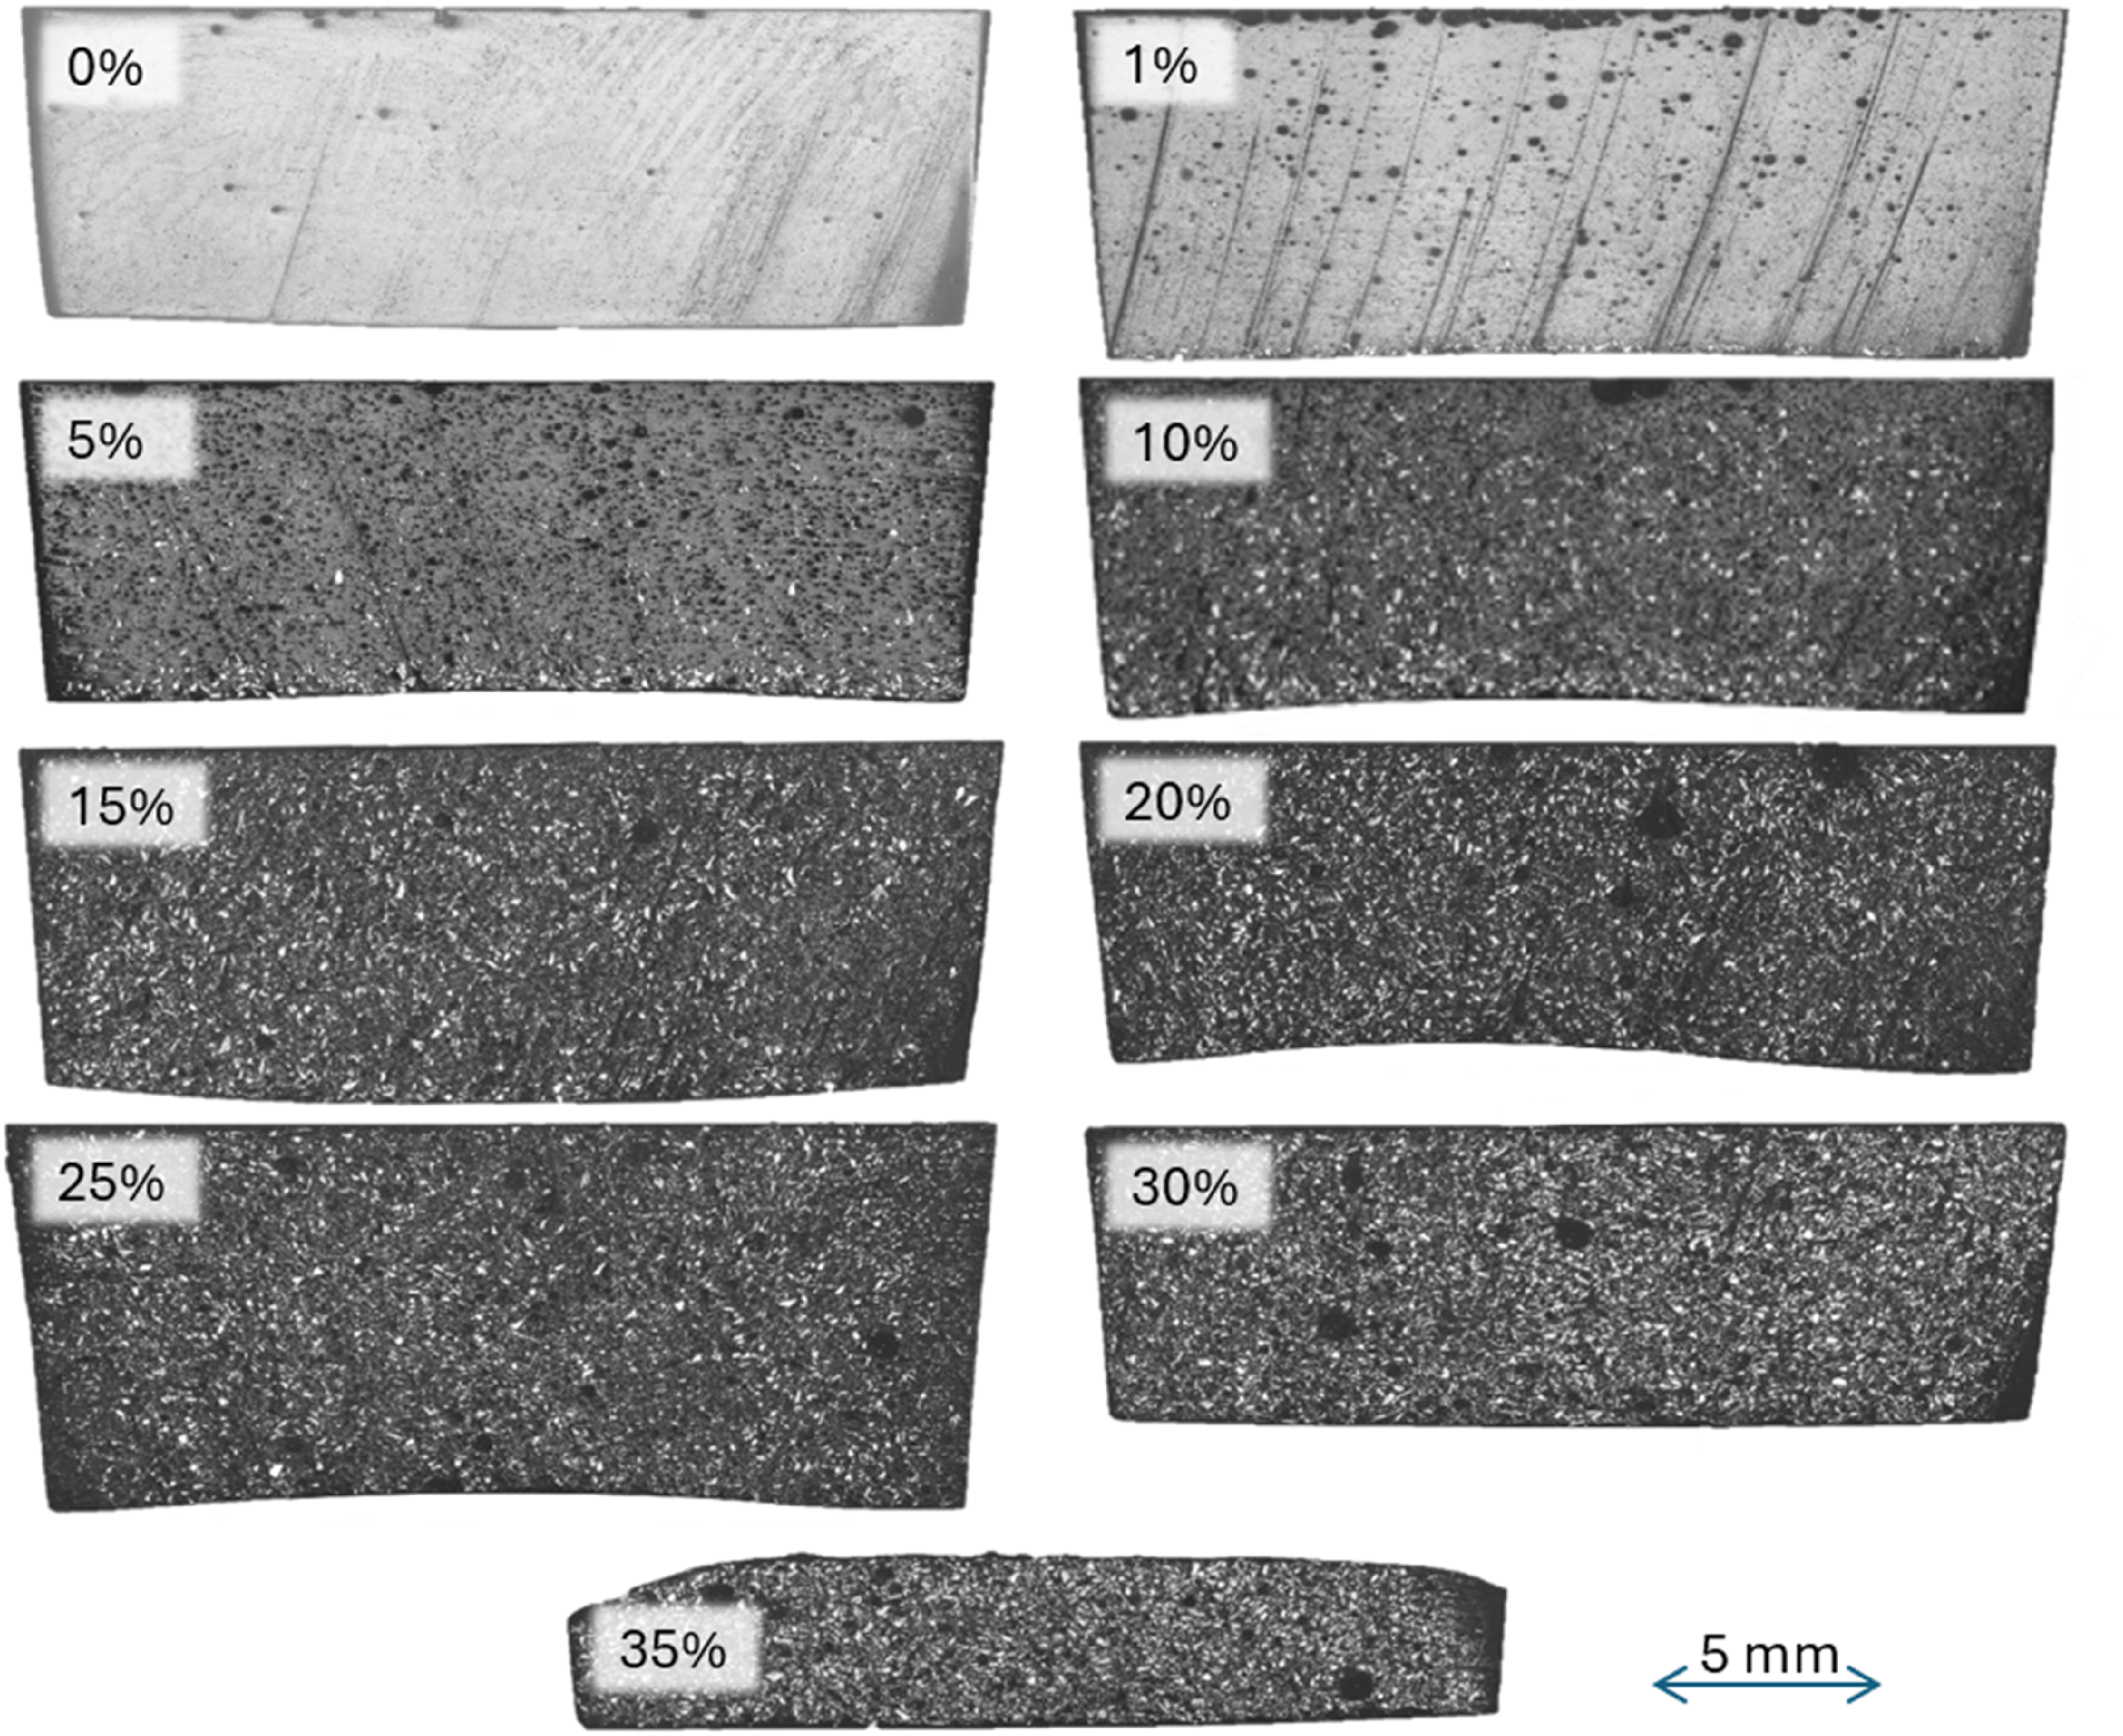
It was not possible to penetrate the tungsten particles in samples with more than 5% vol. W. Sectioning of the samples allowed visualisation of the distribution of both tungsten (white regions) and pores (black regions) in all discs, including those with ≥10% vol. W, as shown in Figure 7 for ATM discs and Figure 8 for AC discs. Optical microscopy cross-sections of the sectioned discs formed under autoclave conditions (white = tungsten, black = pores, grey = epoxy).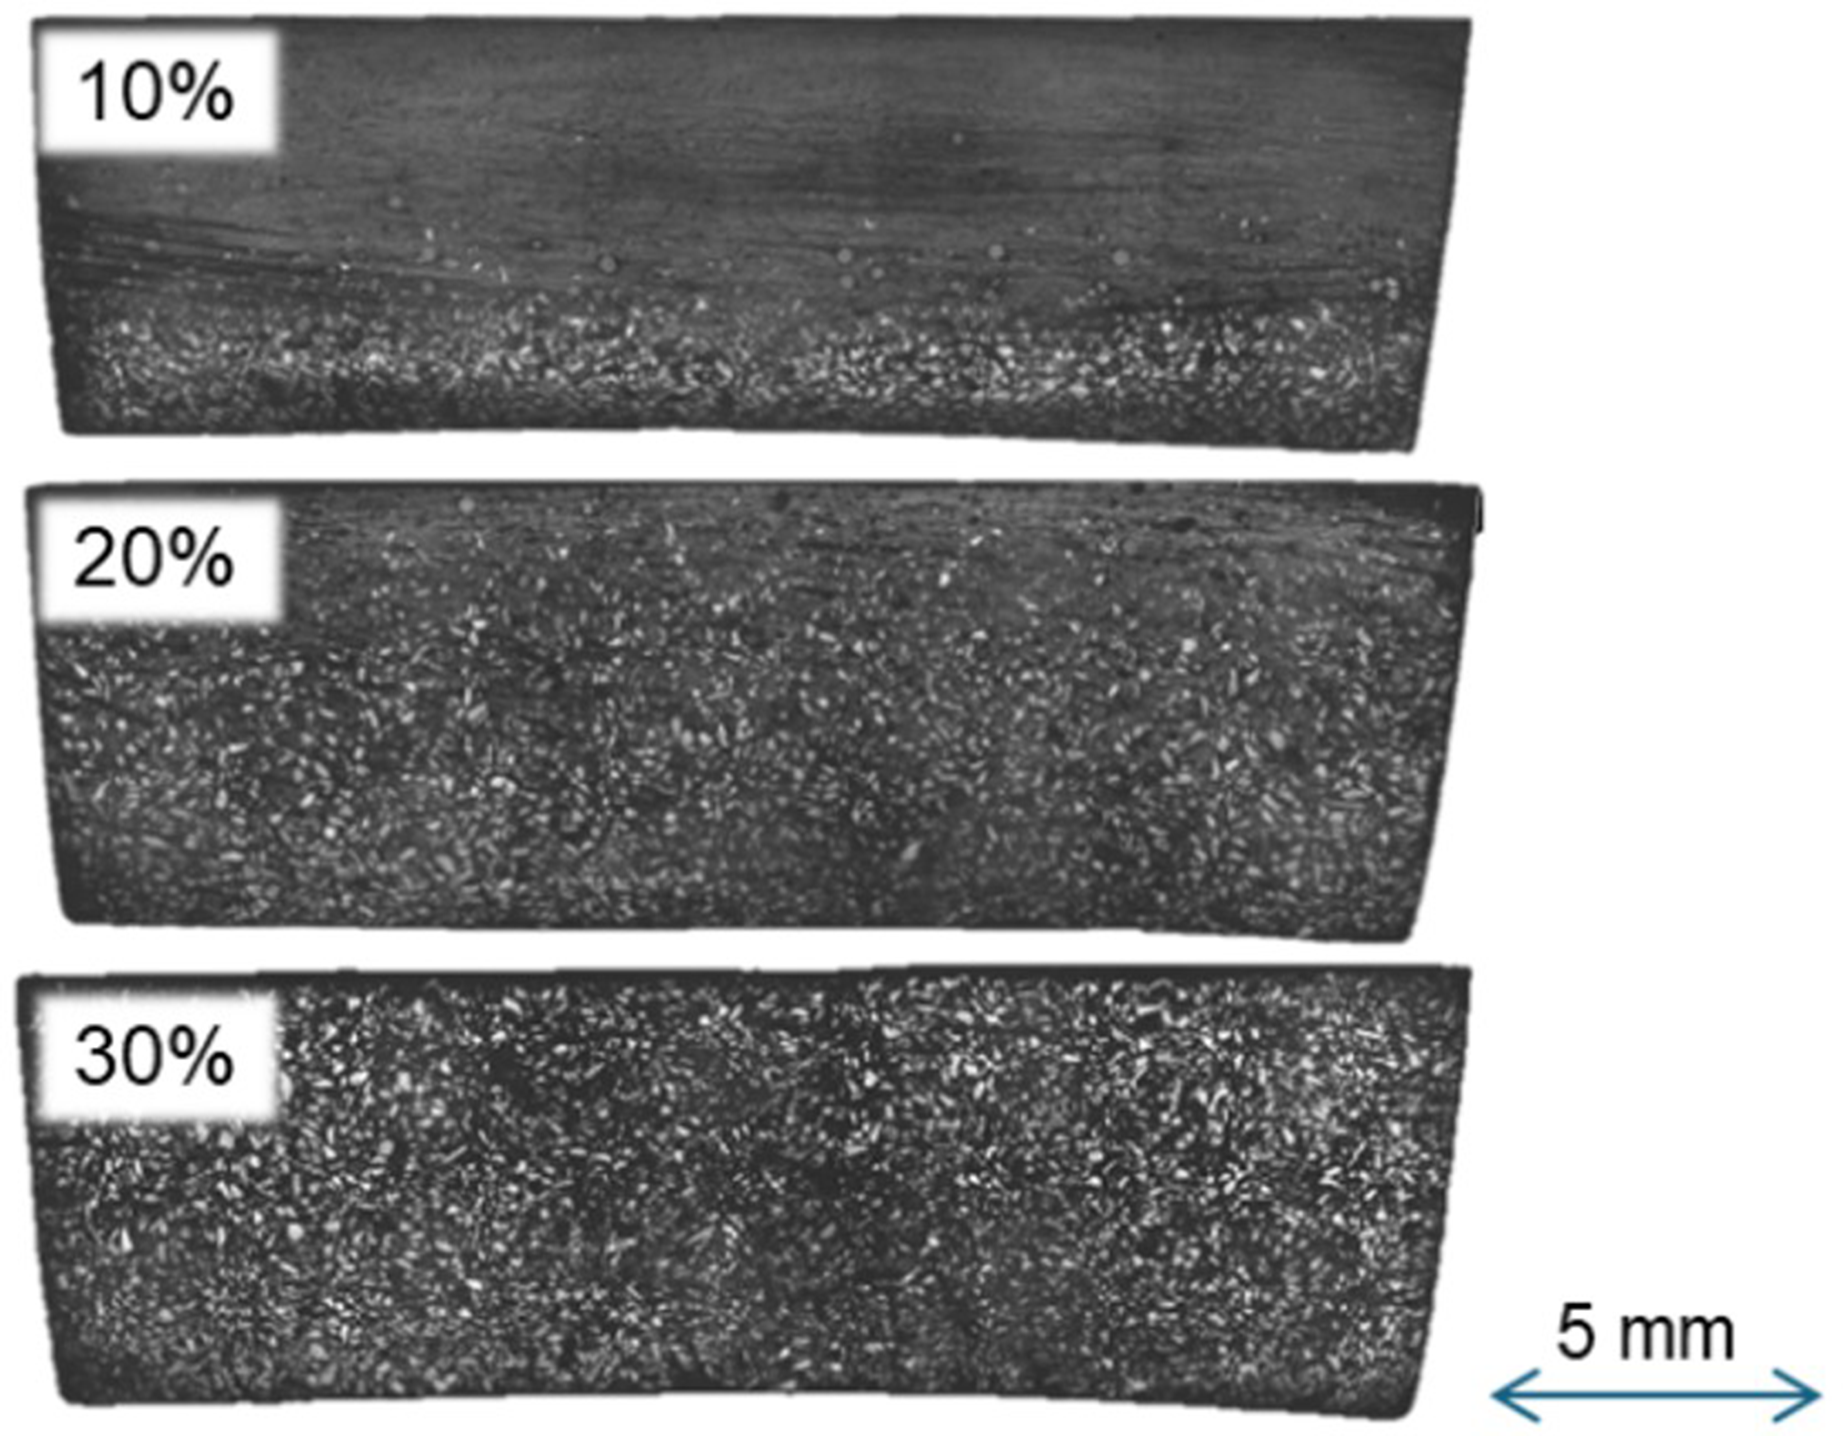
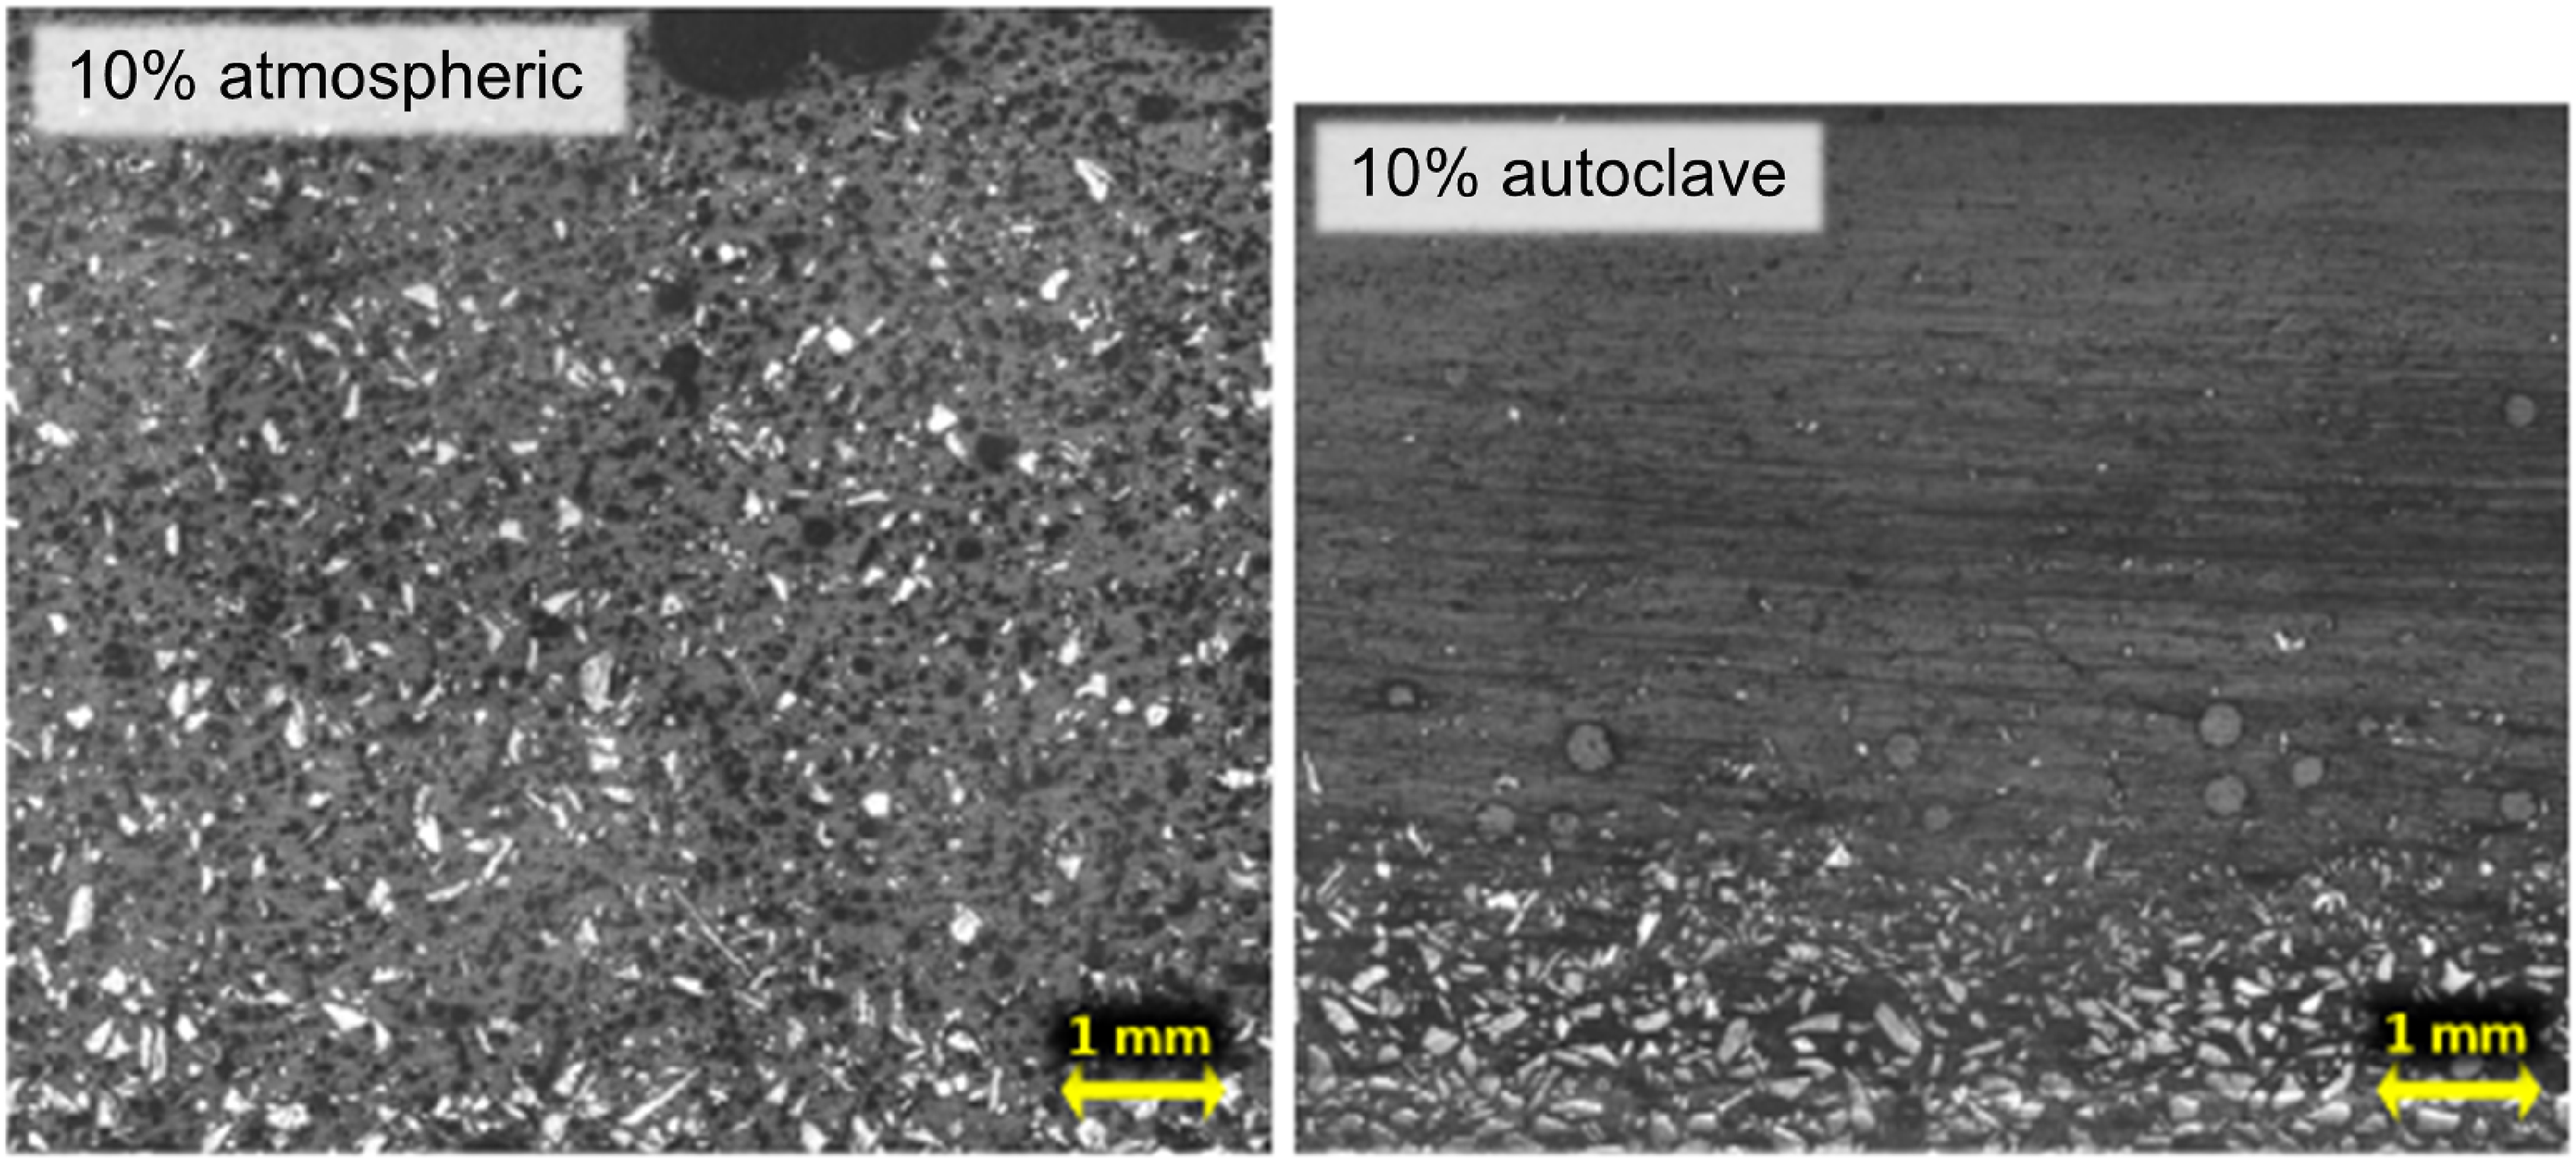
Porosity appears minimal in the ATM pure epoxy disc. However, larger pores exist in all composite ATM discs, seemingly increasing in prevalence with increased % vol. W. These pores tend to have risen closer to the surface in the lower % vol. W ATM discs but appear trapped in place in ATM discs with 15% vol. W or greater, likely a result of the increased viscosity as more tungsten is added. A greater number of accompanying smaller pores exist in the higher % vol. W ATM discs. Conversely, very few pores can be clearly distinguished in the 10% vol. W and 20% vol. W AC discs, as exemplified in the comparison in Figure 9 (and later in Figure 11). Some pores could be seen in the 30% vol. W AC disc, but these are not as evident as those in the ATM discs. An enlarged region of the optical microscopy of the 20% vol. W disc cross-section formed under atmospheric conditions (left) and in the autoclave (right) (white = tungsten, black = pores, grey = epoxy).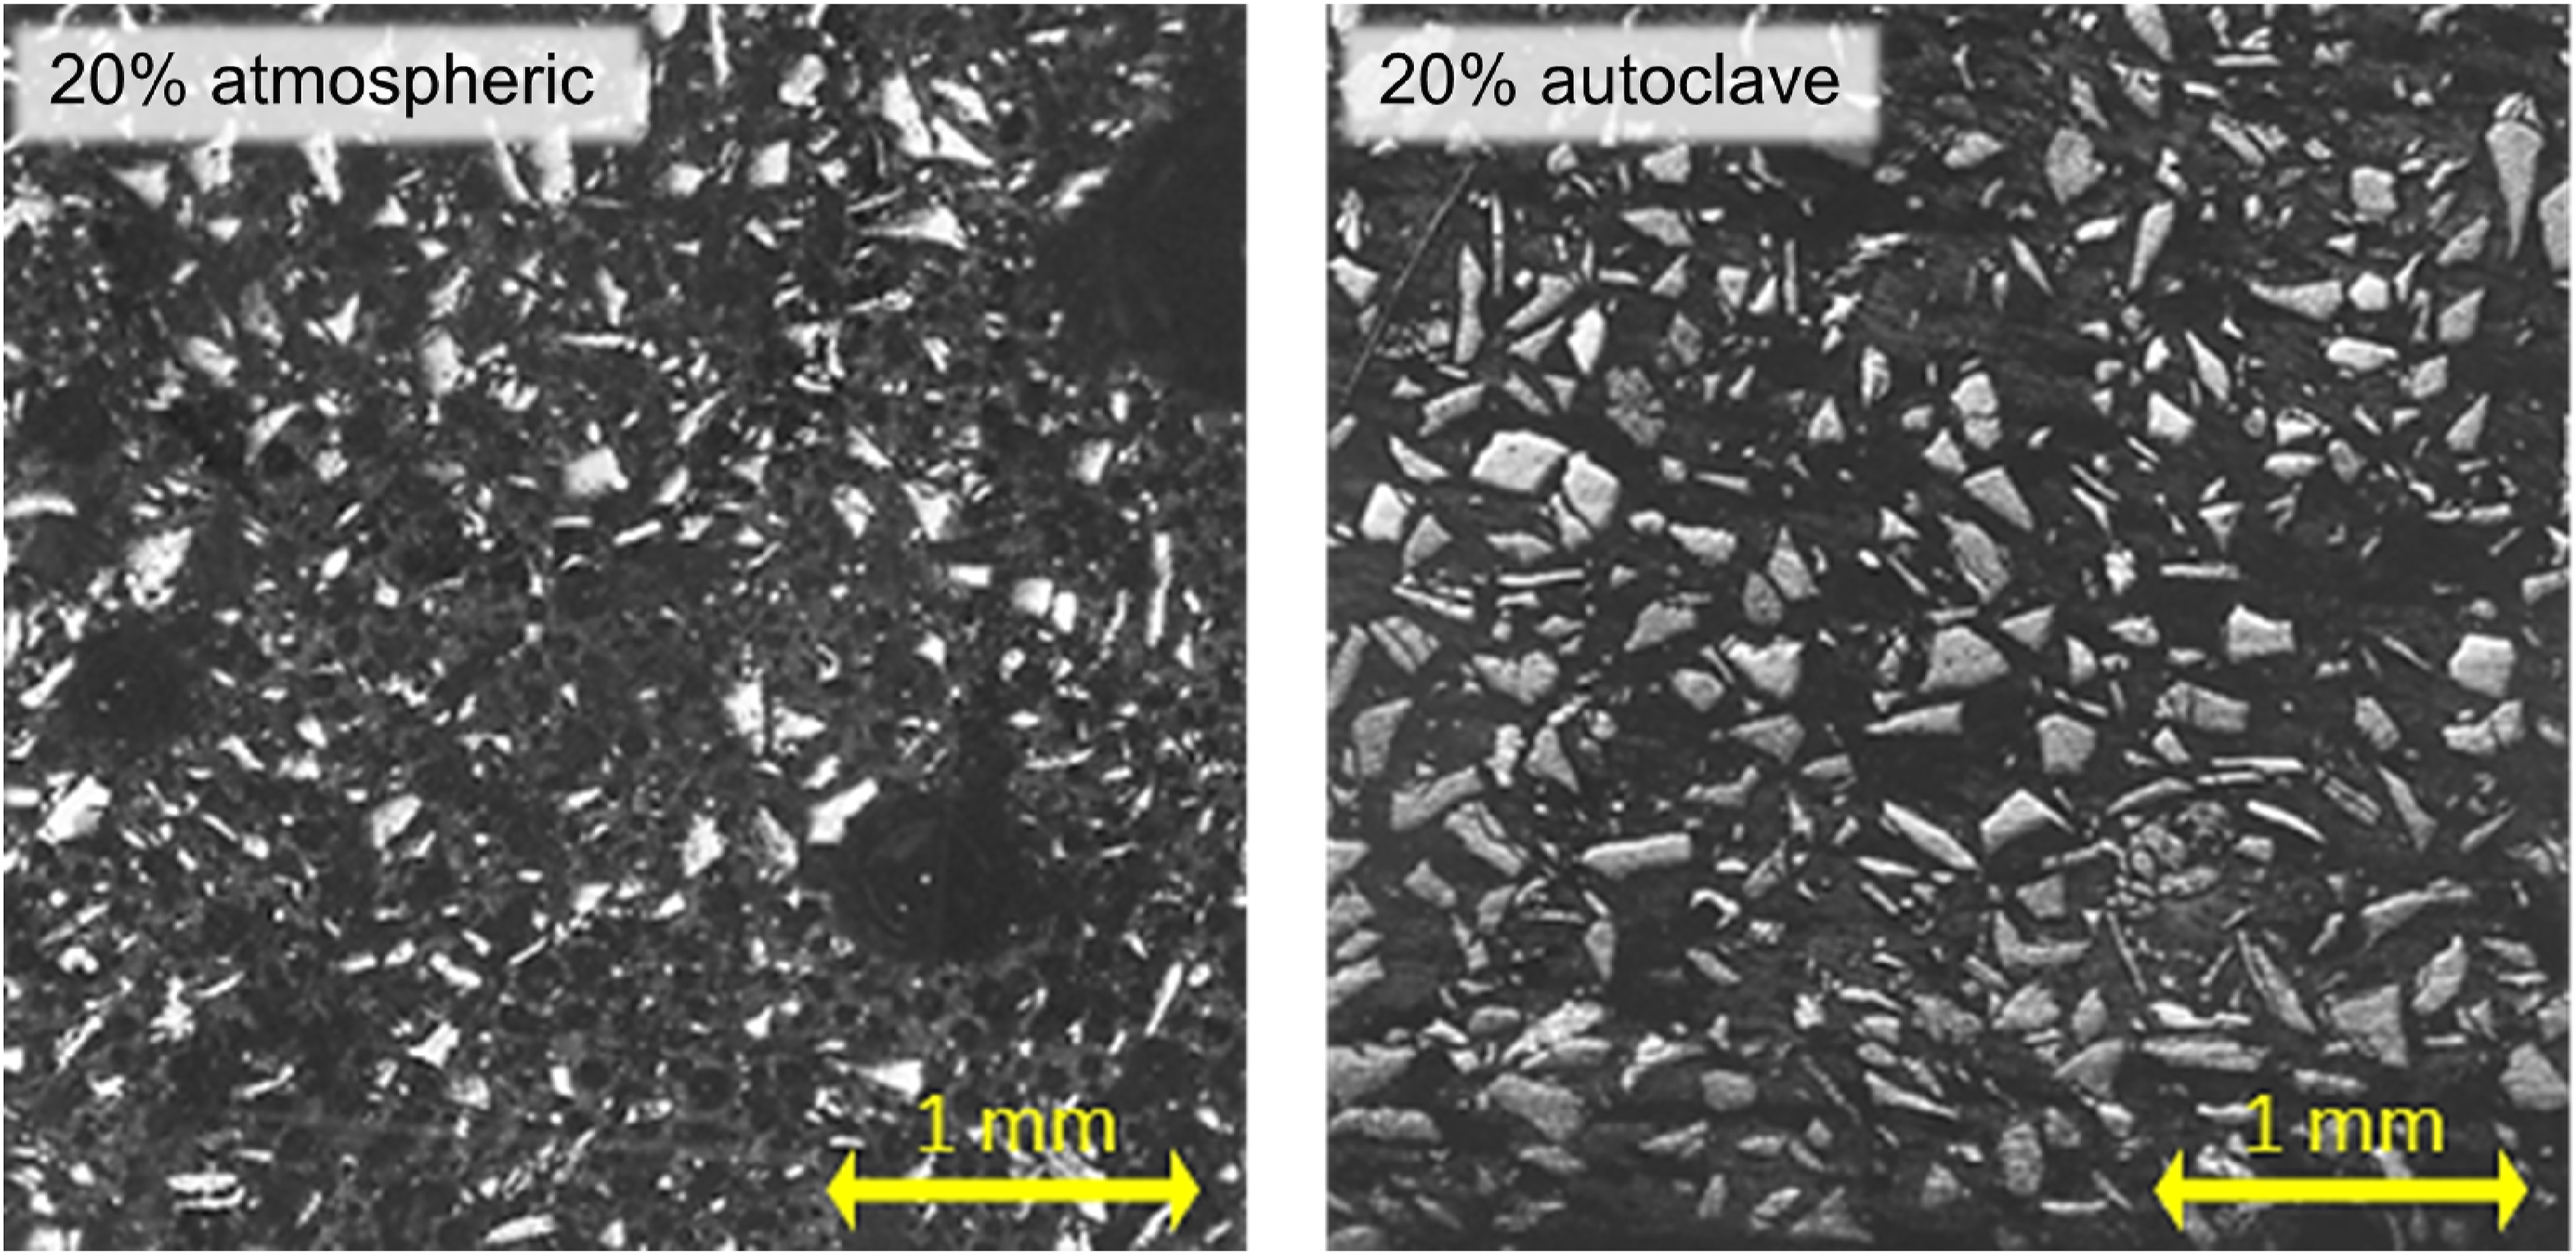
Figure 10 provides insight into whether FGMs formed in each disc, utilising empirical image analysis data. This confirms several observations from Figure 7/Figure 8. The tungsten particles that were seen to settle towards the bottom of the discs in the 1%, 5% and 10% vol. W ATM discs and 10% and 20% vol. W AC discs are observed to have led to the formation of FGMs with varied % vol. W across the depth of each disc. This is in keeping with the observations from CT scanning for some of these discs. The gradient of change (and overall change in % vol. W) within these discs varies considerably, demonstrating that control of the composite manufacturing process can create various FGMs with controllable properties across their thickness that would likely suit most applications across a range of layer thicknesses. This is confirmed by the considerable differences between the 10% vol. W and 20% vol. W discs formed with (AC) and without (ATM) the autoclave; there is an absence of material grading in the 20% vol. W ATM disc compared to the evident grading in the AC disc, and considerable difference in the gradual versus abrupt grading between the 10% vol. W AC disc and 10% vol. W ATM disc, respectively (seen more clearly in Figure 11). Above 20% vol. W, the ATM discs (and 30% vol. W AC disc) are broadly homogenous and well-dispersed in both Figure 7/Figure 8 and Figure 10 Functional grading of each % vol. disc over a 5-period moving average with increased distance from the base of the disc (based on ImageJ analysis of optical microscopy of sectioned discs). Optical microscopy showing the full through-depth cross-section of the 10% vol. W disc formed under atmospheric conditions (left) and in the autoclave (right).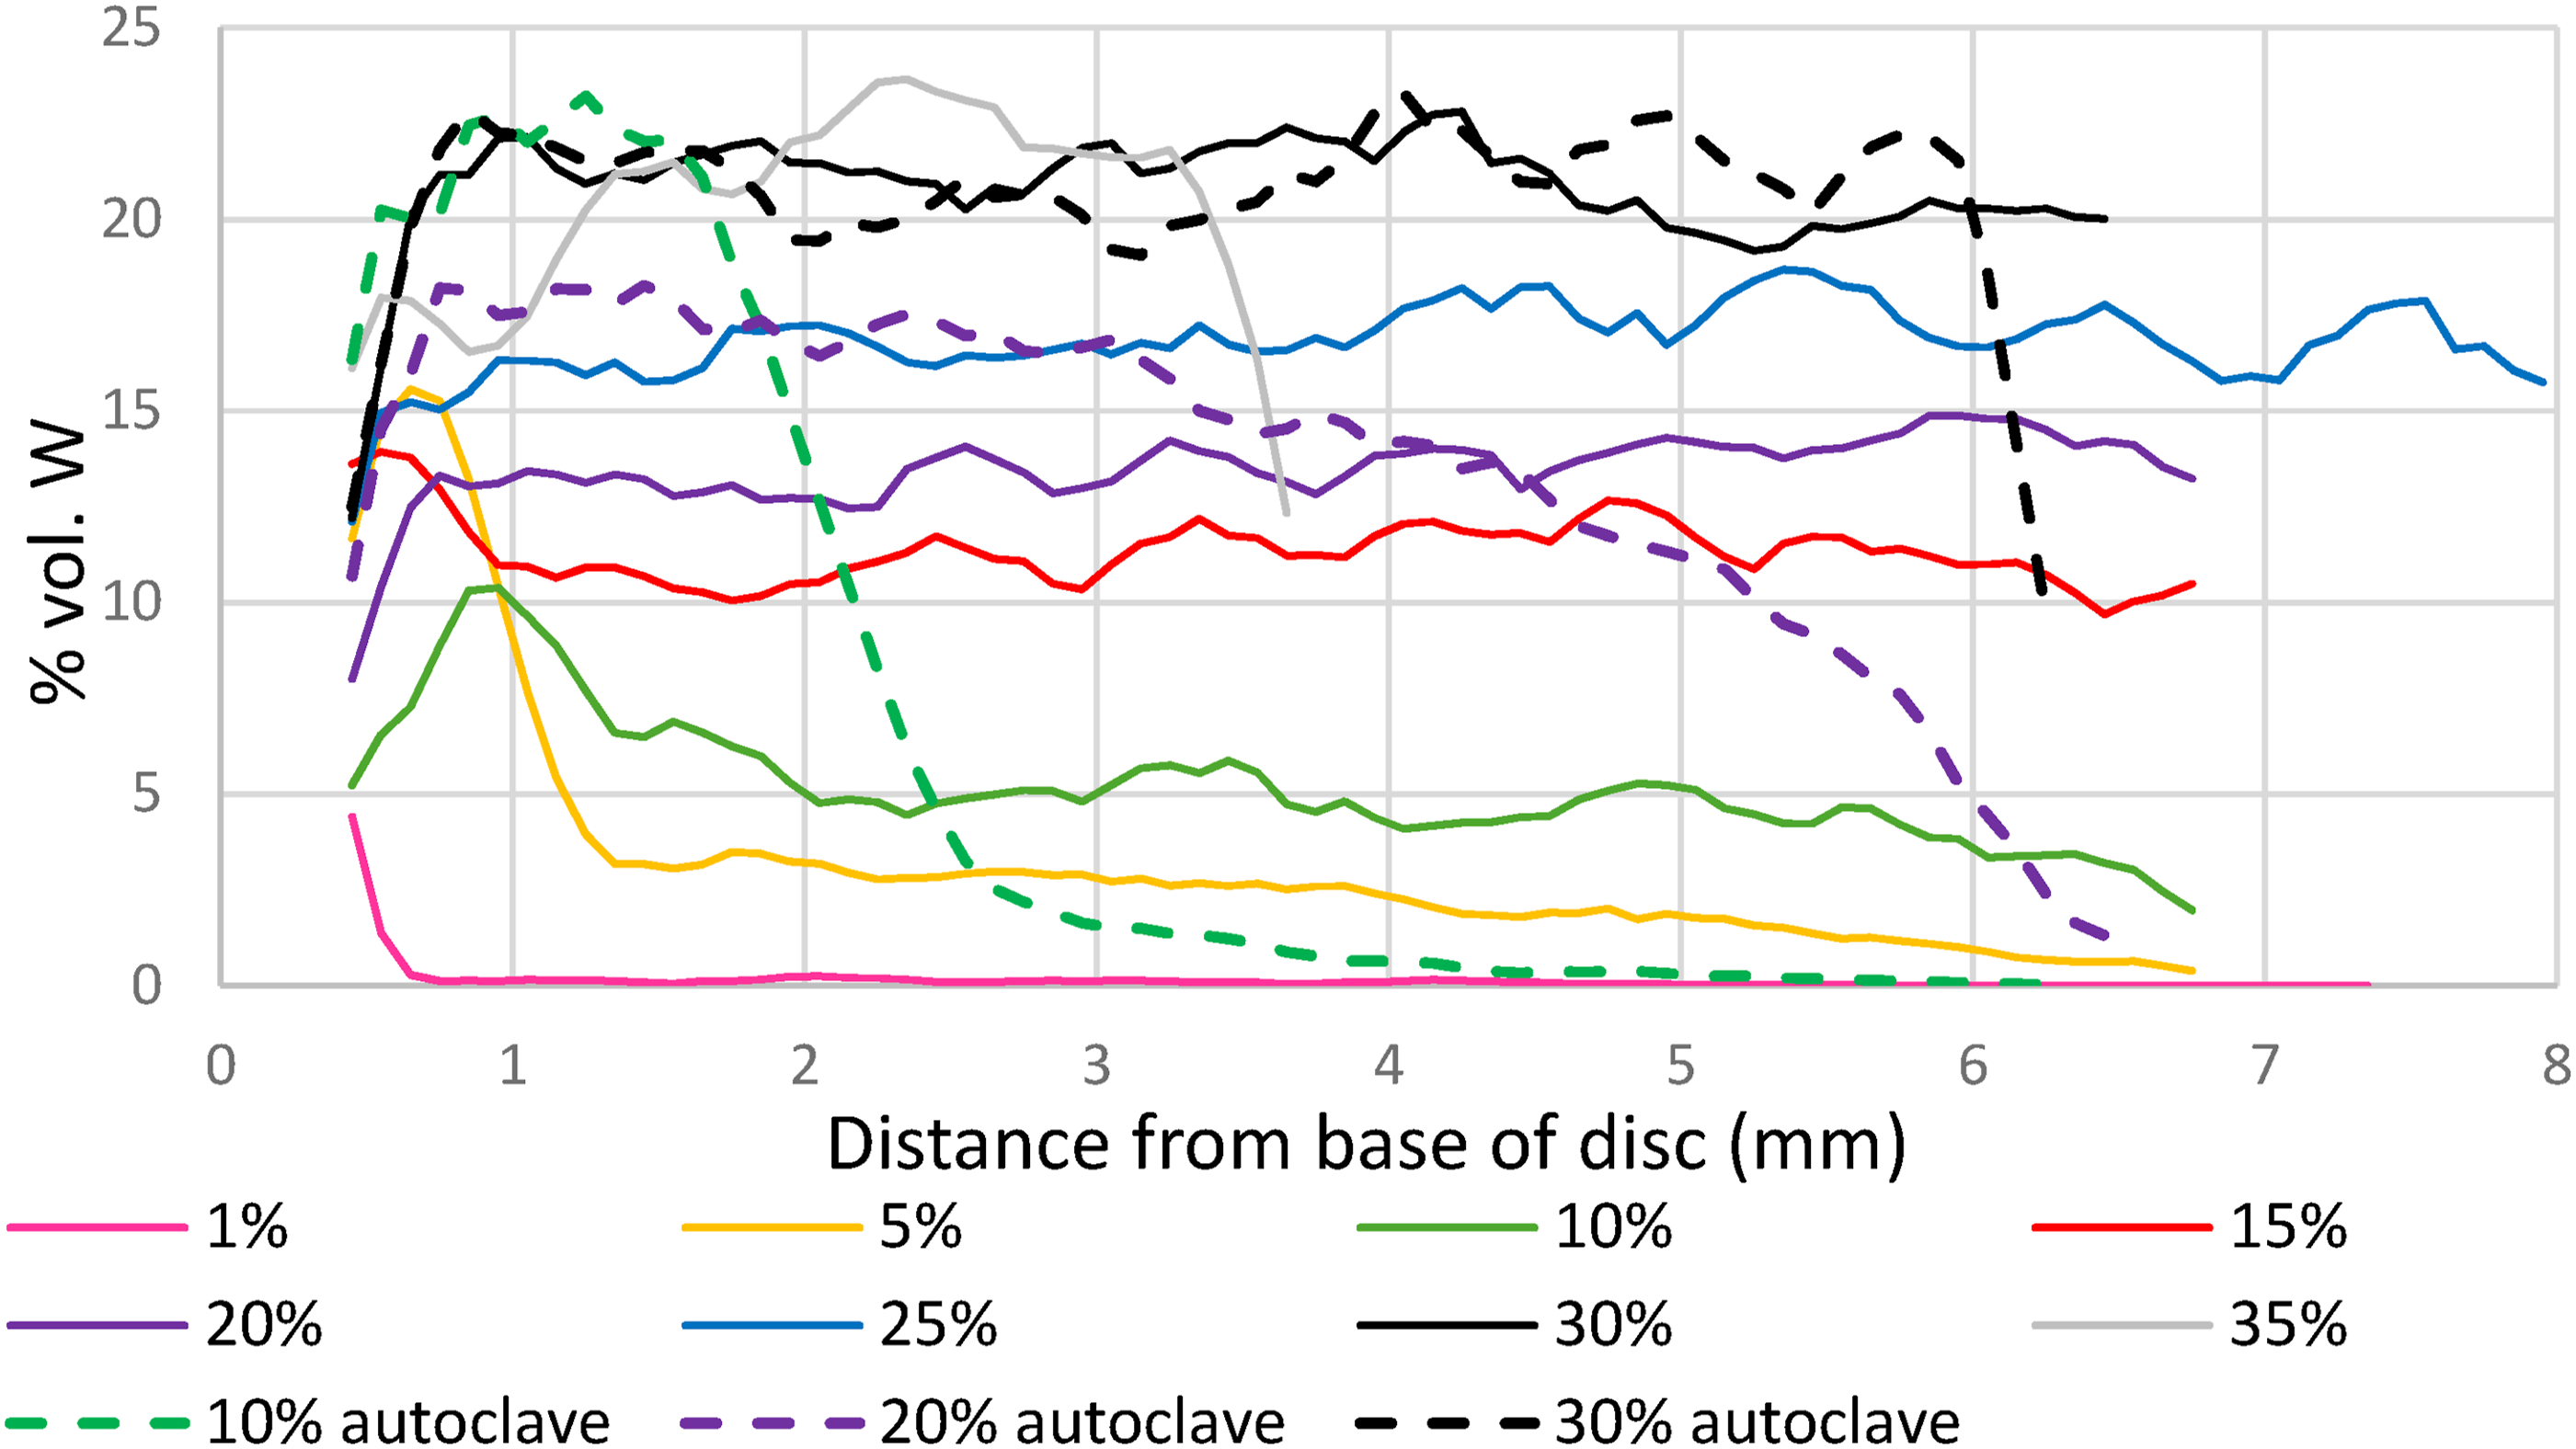
In Figure 10 the readings closest to the base of the discs report an initially lower % vol. W. This rises before plateauing as the distance from the base increases, except for the 1% vol. W ATM disc. This is broadly a result of the absence of tungsten directly in contact with the base of the disc due to the shape of the particles, reducing the prevalence of tungsten closest to the base. Where a disc is more curved, the number of measurements that include these regions increases, reducing the apparent tungsten prevalence for several readings. Furthermore, there are complications in the measurement of the microscopy images at the base appearing darker due to polishing faults, and a darkened edge at the base that results from the optical microscopy methodology employed. These darker regions increase the likelihood of tungsten particles being excluded by the threshold set in the image processing stage. Whilst there would be a lower % vol. W in the first or second reading closest to the base in a flat disc, these complications exaggerate this in this dataset. As such, the initial readings can be broadly ignored in the interpretation of Figure 10, except for in the 1% vol. W disc.
Density and porosity
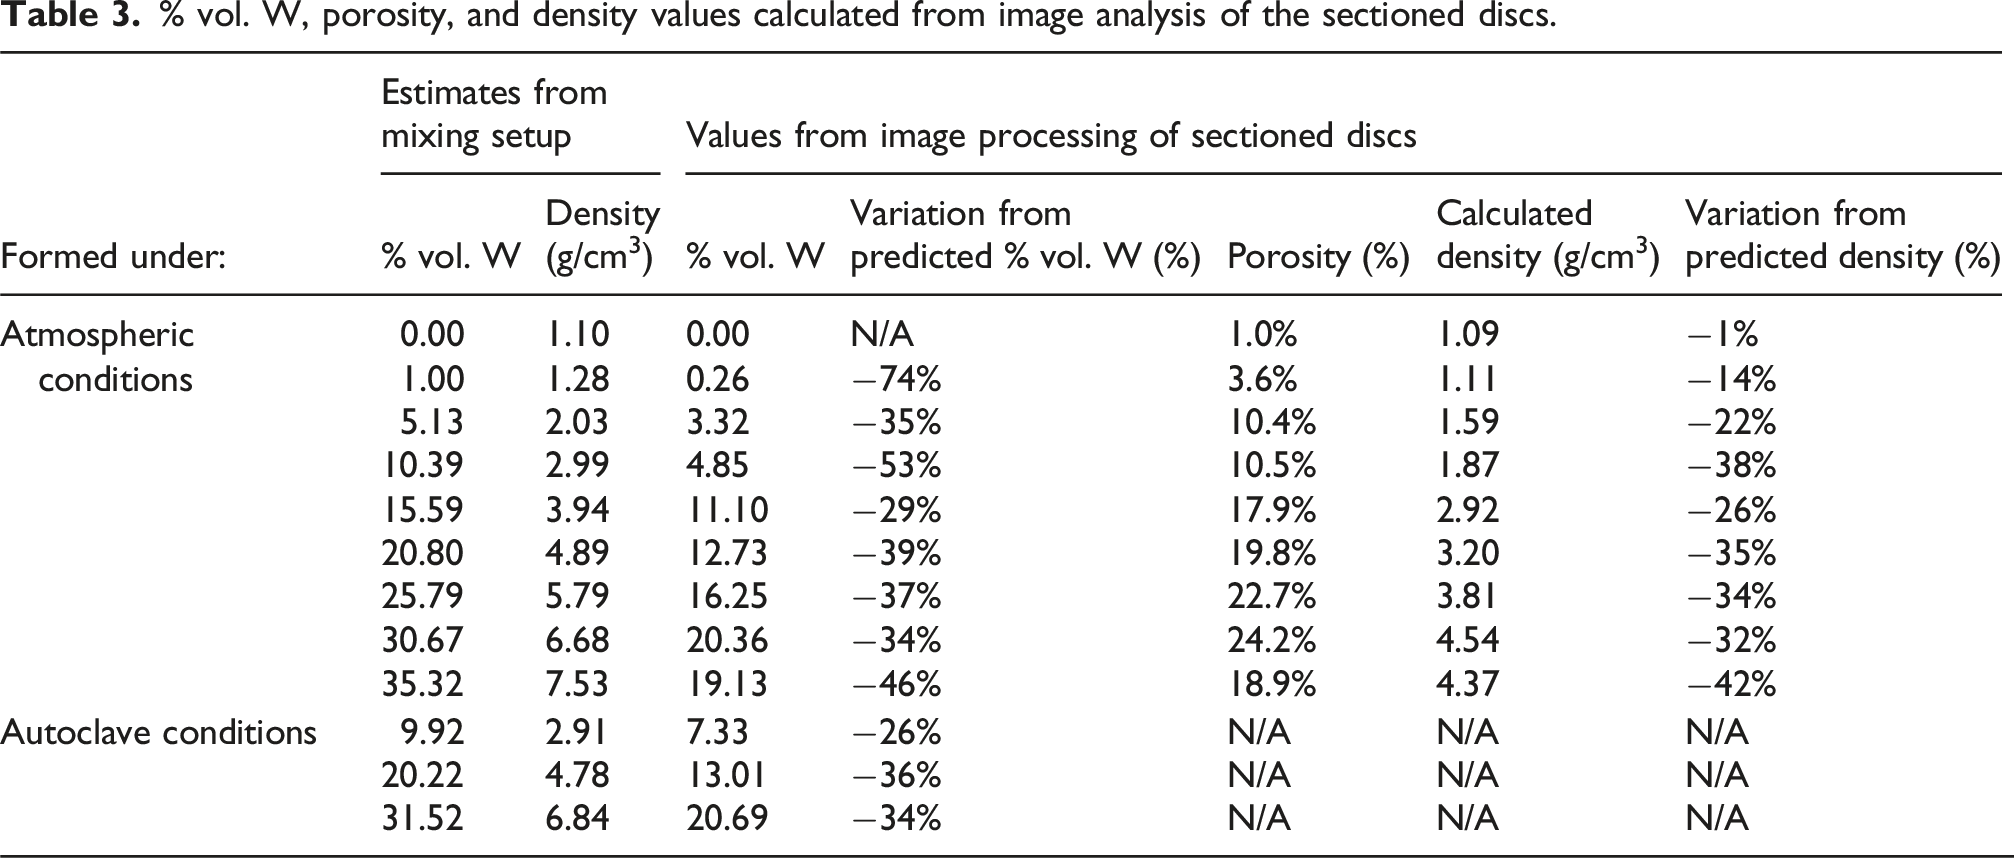
% vol. W, porosity, and density values calculated from image analysis of the sectioned discs.
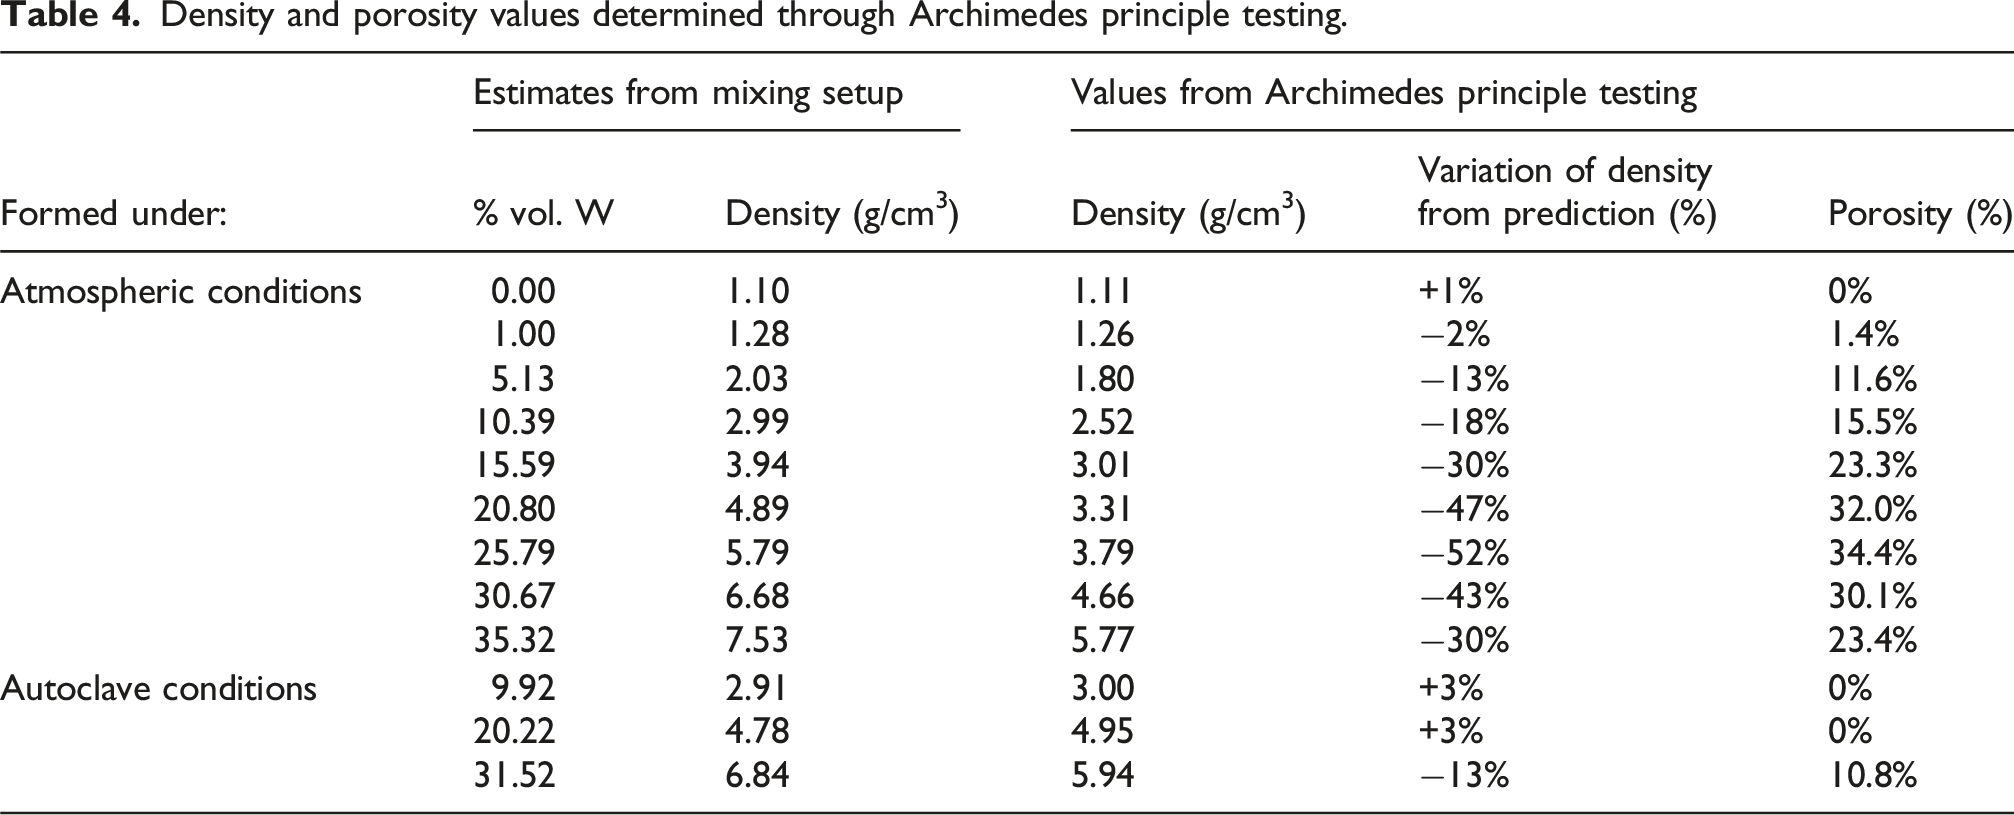
Density and porosity values determined through Archimedes principle testing.
The prevalence of tungsten is consistently lower when calculated from the image processing of the sectioned discs compared to the expected % vol. W. A significant cause of the disparity stems from porosity not being considered in the initial % vol. W calculations; a perfect mixture of epoxy and tungsten particles was assumed. However, there is still a considerable difference between the estimated % vol. W in Table 3 and the more accurate empirically calculated % vol. W in Table 4. This may result from error-inducing factors; multiple embedded tungsten flakes may have been stripped from the epoxy during the cutting or polishing of each disc, or the threshold set during the ImageJ tungsten particle exclusion process may have been set too high, removing some particles from analysis. This demonstrates that the image processing technique can be useful for identifying some general trends (especially in the identification of functional grading) but is unreliable at producing accurate porosity, density, or % vol. W measurements. This must therefore be used in tandem with Archimedes principle method.
When considering the more accurate values from Archimedes principle testing, the density is seen to steadily rise as the expected % vol. W increases with this fabrication technique. Porosity is directly correlated to any reductions in the measured density compared to the expected density in higher % vol. W discs. The overall trend shows greater porosity in higher % vol. W ATM discs. This trend begins when just 1% vol. W is introduced and continues to increase up to a maximum of 34.4% in the 25% vol. W ATM disc. This indicates increasing viscosity with the introduction of tungsten powder filler and subsequent additional mixing, with trapped air within the mixture finding it increasingly difficult to move through the mixture and degas under atmospheric conditions. Conversely, there was no calculated porosity in the 10% and 20% vol. W AC discs, and the porosity in the 30% vol. W disc was reduced by 64% compared to the ATM disc, further indicating the importance of manufacturing process control in the fabrication of these particulate composites to achieve optimum and desired properties. The effect of porosity in these samples on other material properties is now considered in detail.
Longitudinal sound speed and acoustic impedance
Figure 12 shows the longitudinal sound speed and acoustic impedance calculated for each disc in its entirety (i.e. being unable to discern differences resulting from any functional grading in the disc). A similar trend is observed in all samples of an initial decrease in longitudinal sound speed, levelling out between 20 and 30% vol. W. The longitudinal sound speed of the AC discs remains approximately 400–500 m/s greater than the ATM discs. The longitudinal sound speed degrades with each subsequent reflection of the wave through the material in the ATM discs, and the magnitude of this reduction increases as the % vol. W increases, seemingly correlated with the porosity present in each disc (see Table 4). For the AC discs, almost no difference is observed in the longitudinal sound speed of the 10% or 20% vol. W sample on the second reflection. There is a noticeable difference in the 30% vol. W AC disc, possibly due to the 10.8% porosity in this sample (see Table 4). The third reflected wave was not possible to measure in discs with 10% vol. W or greater as the signal amplitude was too degraded to be clearly seen or measured with confidence. Variation in longitudinal sound speed and acoustic impedance with % vol. W from a 5 MHz input.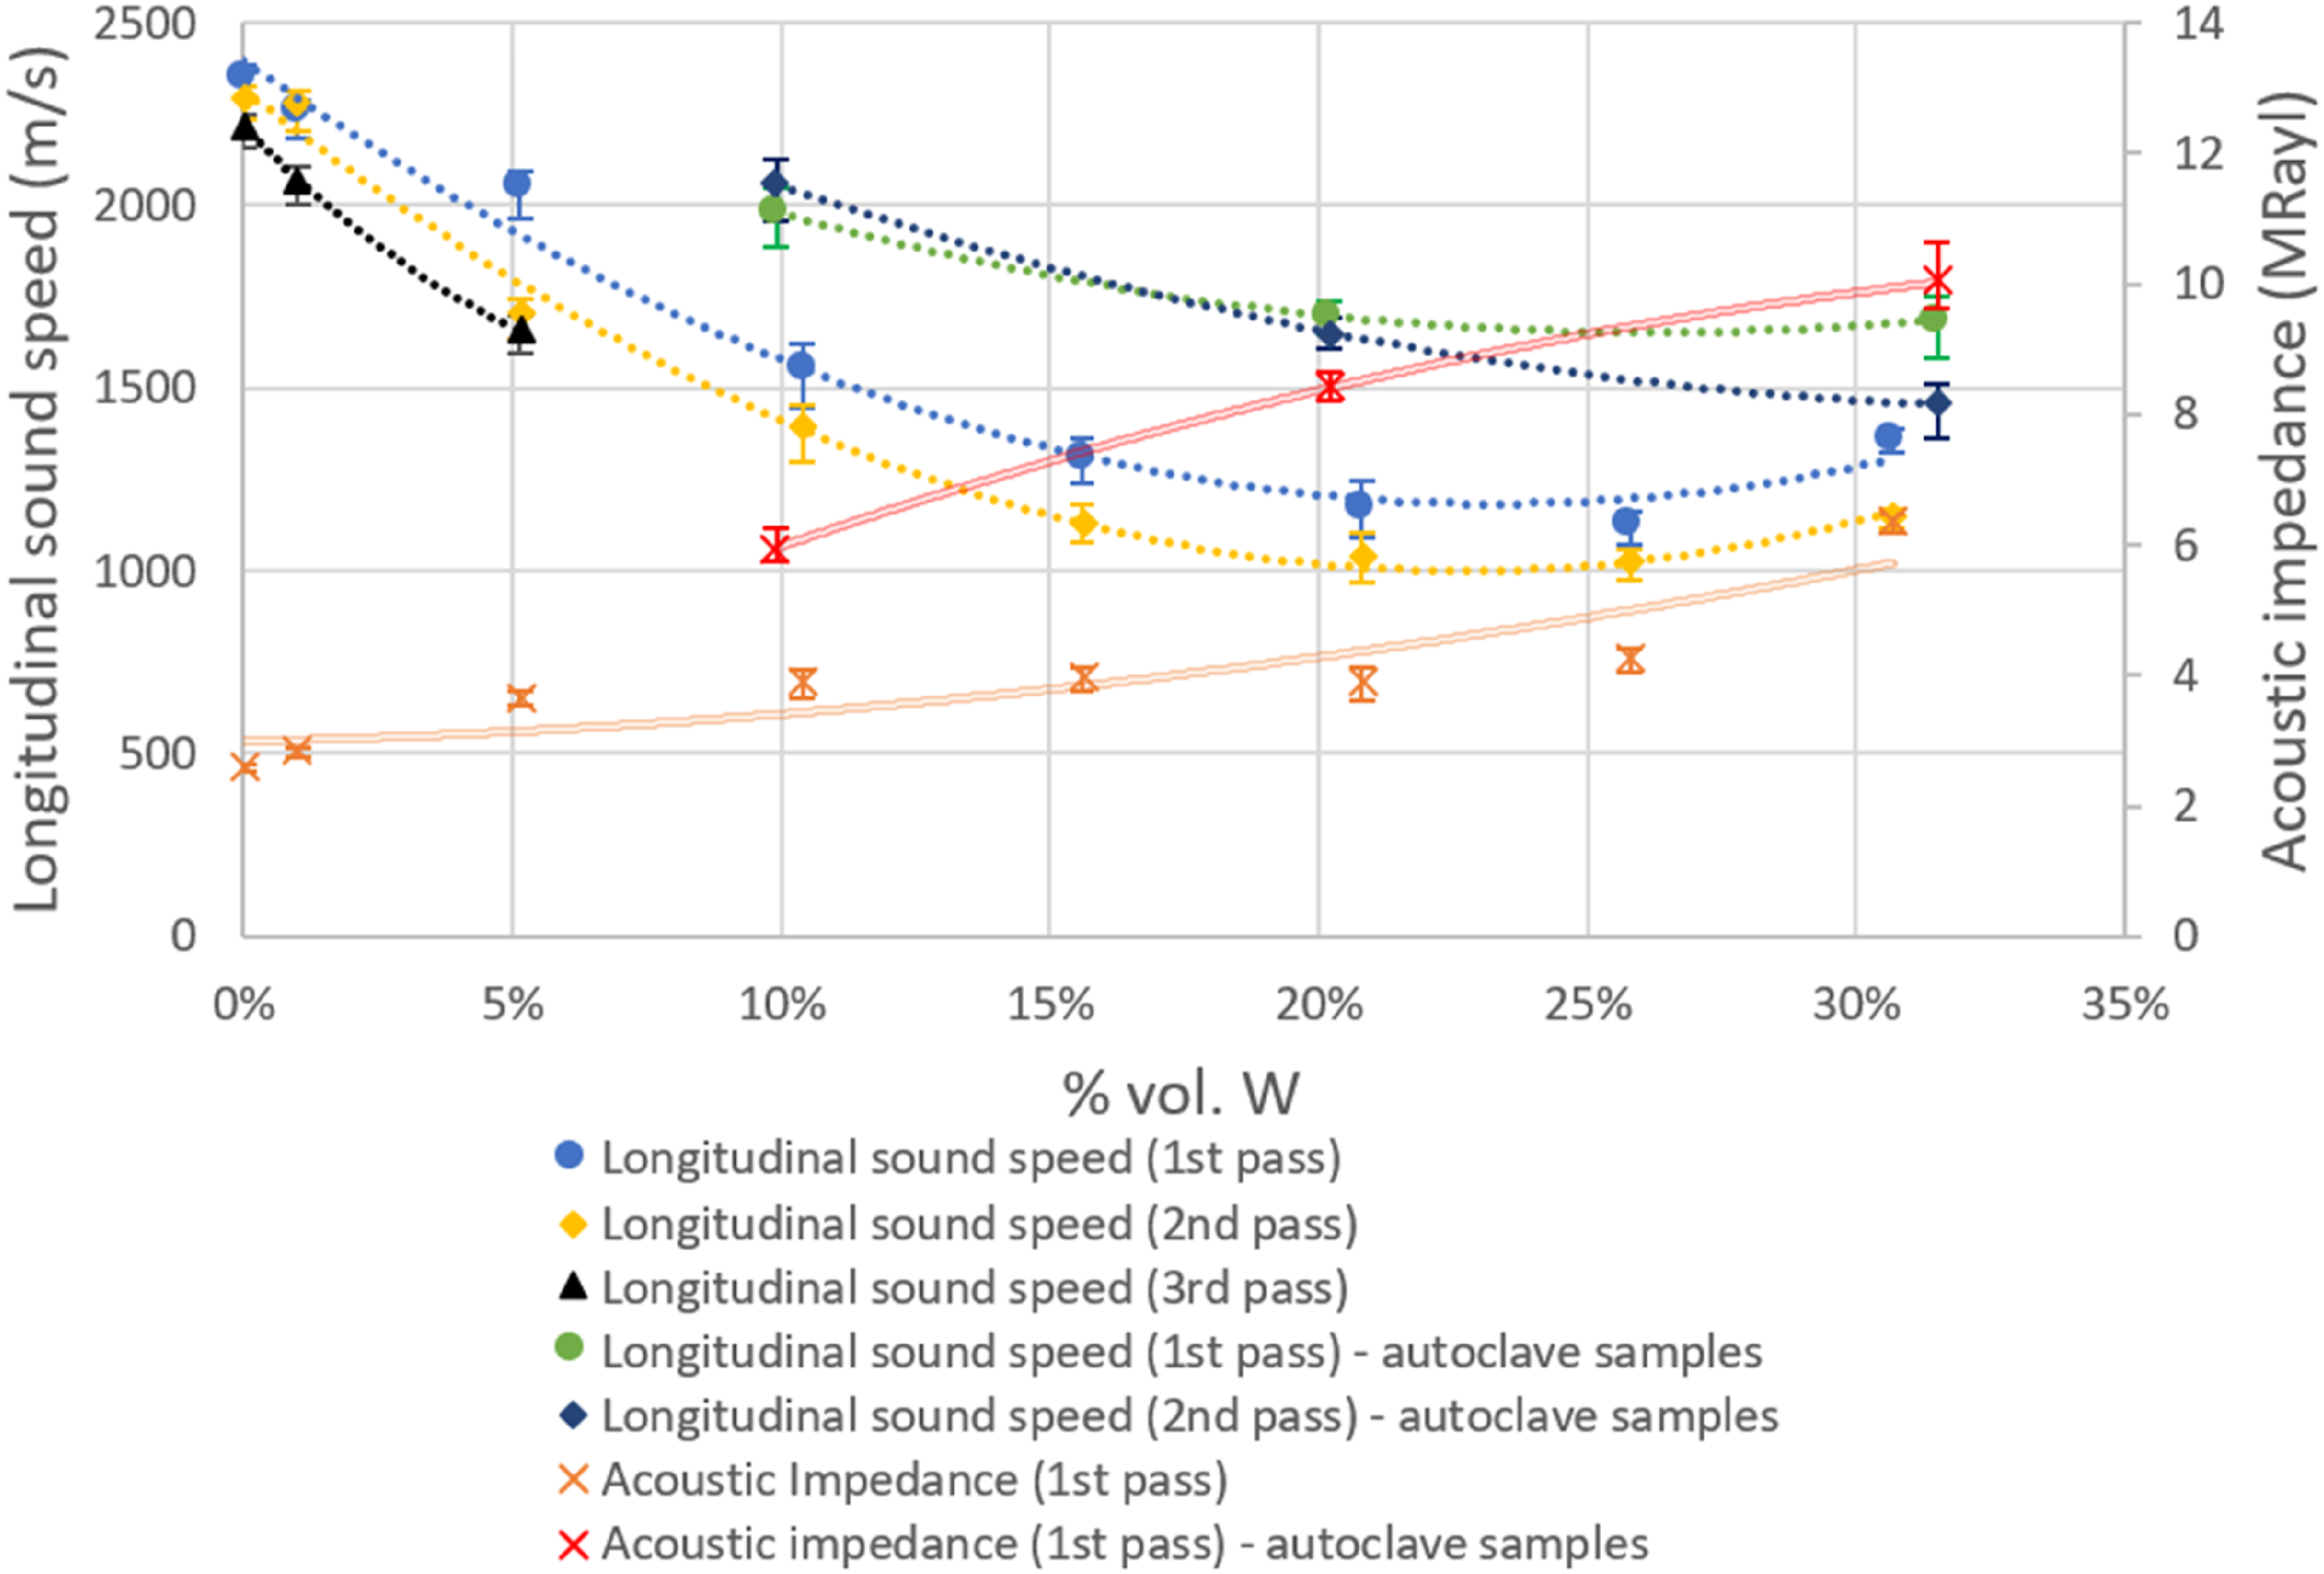
Predicted, adjusted, and empirically calculated acoustic impedance values of the composite discs.
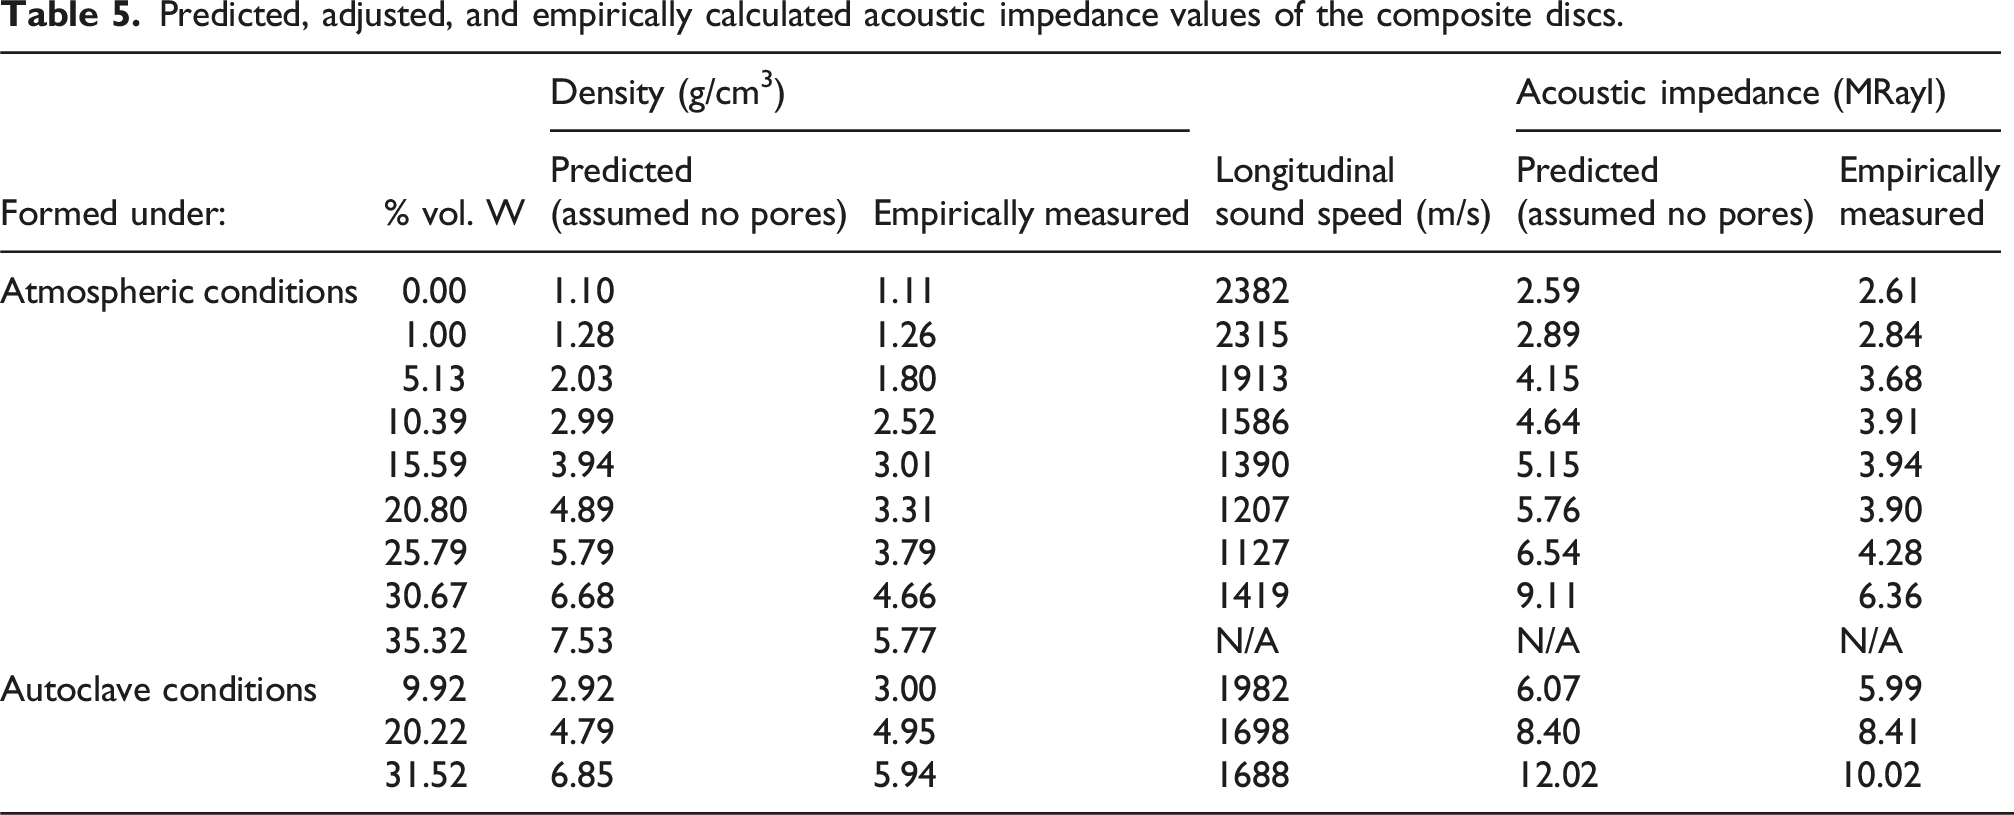
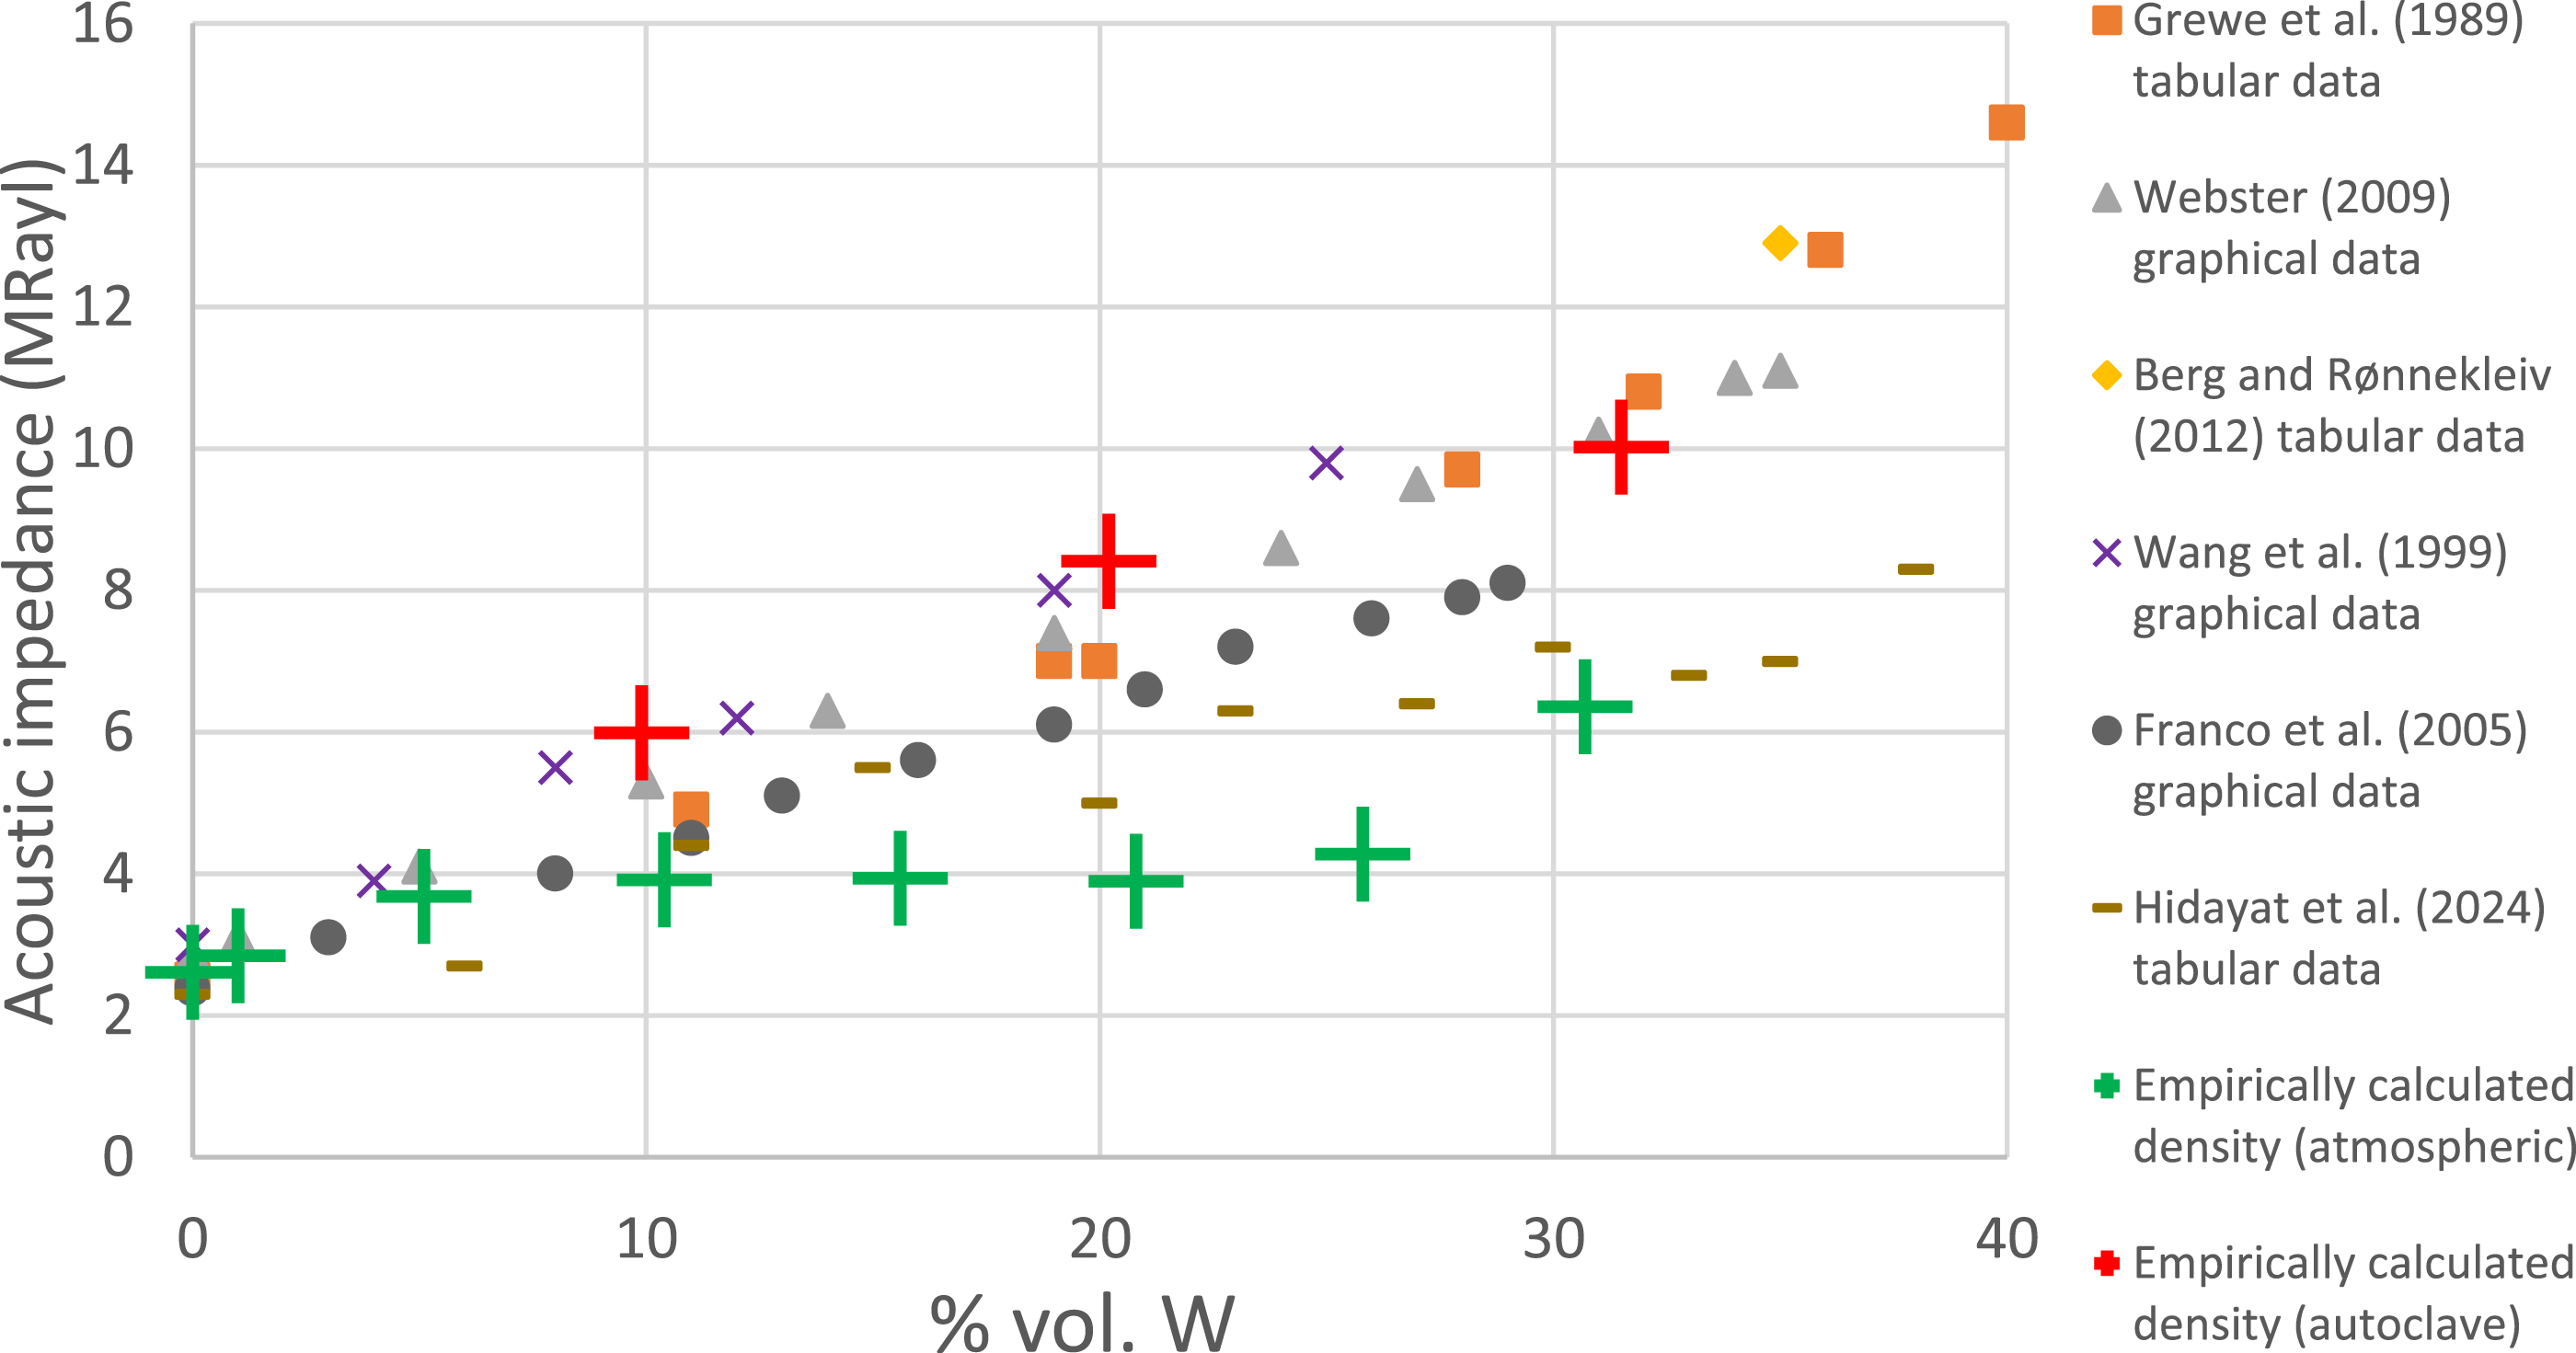
The AC discs have acoustic impedance values rivalling or surpassing the highest values seen in the literature, potentially resultant from the larger particles having a less disruptive effect on the longitudinal sound speed of the formed composite than the comparatively smaller particles used in the literature. Conversely, the high porosities in the ATM samples reduced both their densities and longitudinal sound speeds, compounding the effect on the acoustic impedance values and making them considerably lower than other literature data. Other causes for differences in these results compared to literature are the different epoxies used (varying the initial density, viscosity, and cure time) and the different powders used (having had a different particle size distribution and particle morphology), all influencing the composite properties and further demonstrating the potential to achieve the desired material properties through altering the particulate composite constituents. The methodology of sample creation also differed, potentially resulting in a different spread of the particles in these formed composites.
Whilst the overall increase in acoustic impedance through the introduction of tungsten powder compared to the pure epoxy does not appear considerable and therefore would seem to have a diminished effect on the control of wave propagation in these materials, these values reflect the average acoustic impedance across the material, ignoring any functional grading. The tungsten gradient in samples such as the 10% and 20% vol. W AC discs suggests that the acoustic impedance changes gradually in these discs over several hundreds of microns or several millimetres respectively, providing additional benefits to the control of waves that cannot be realised from the average values shown in Figure 12/Table 5.
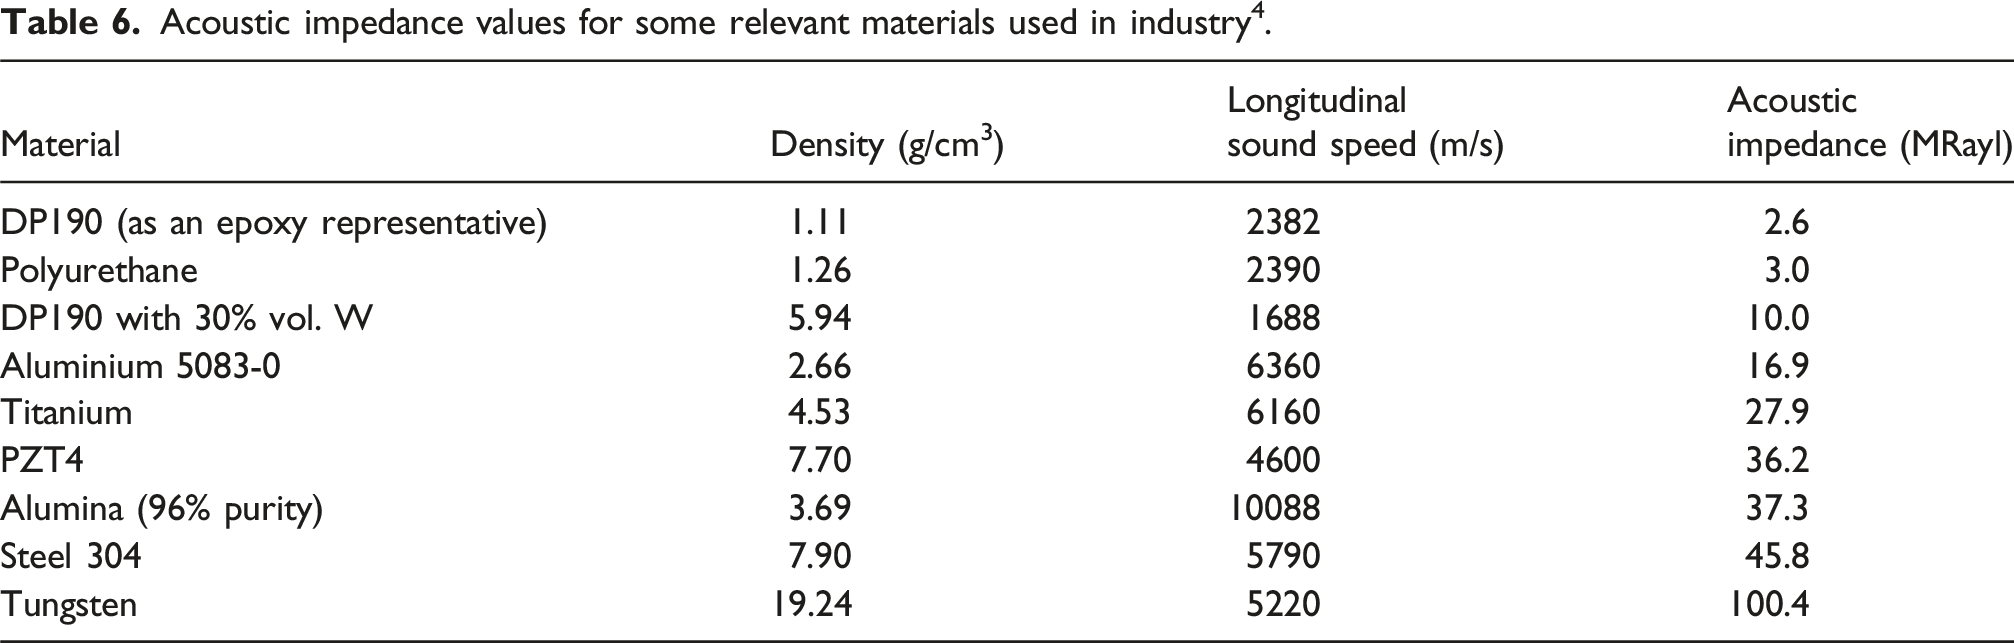
Acoustic impedance values for some relevant materials used in industry 4 .
Attenuation
Figure 14 demonstrates an increase in attenuation of composites with greater % vol. W present when compared to pure epoxy. This increase is substantial and non-linear in the ATM discs (notably in the reduction at 25% vol. W), but generally appears to increase with increased % vol. W. However, in the AC discs the attenuation is consistently considerably lower than in the ATM discs; as the decibel scale is logarithmic, this change represents a substantial reduction in attenuation in the AC discs. Calculated attenuation values in each disc from a 5 MHz input compared with empirically measured porosities.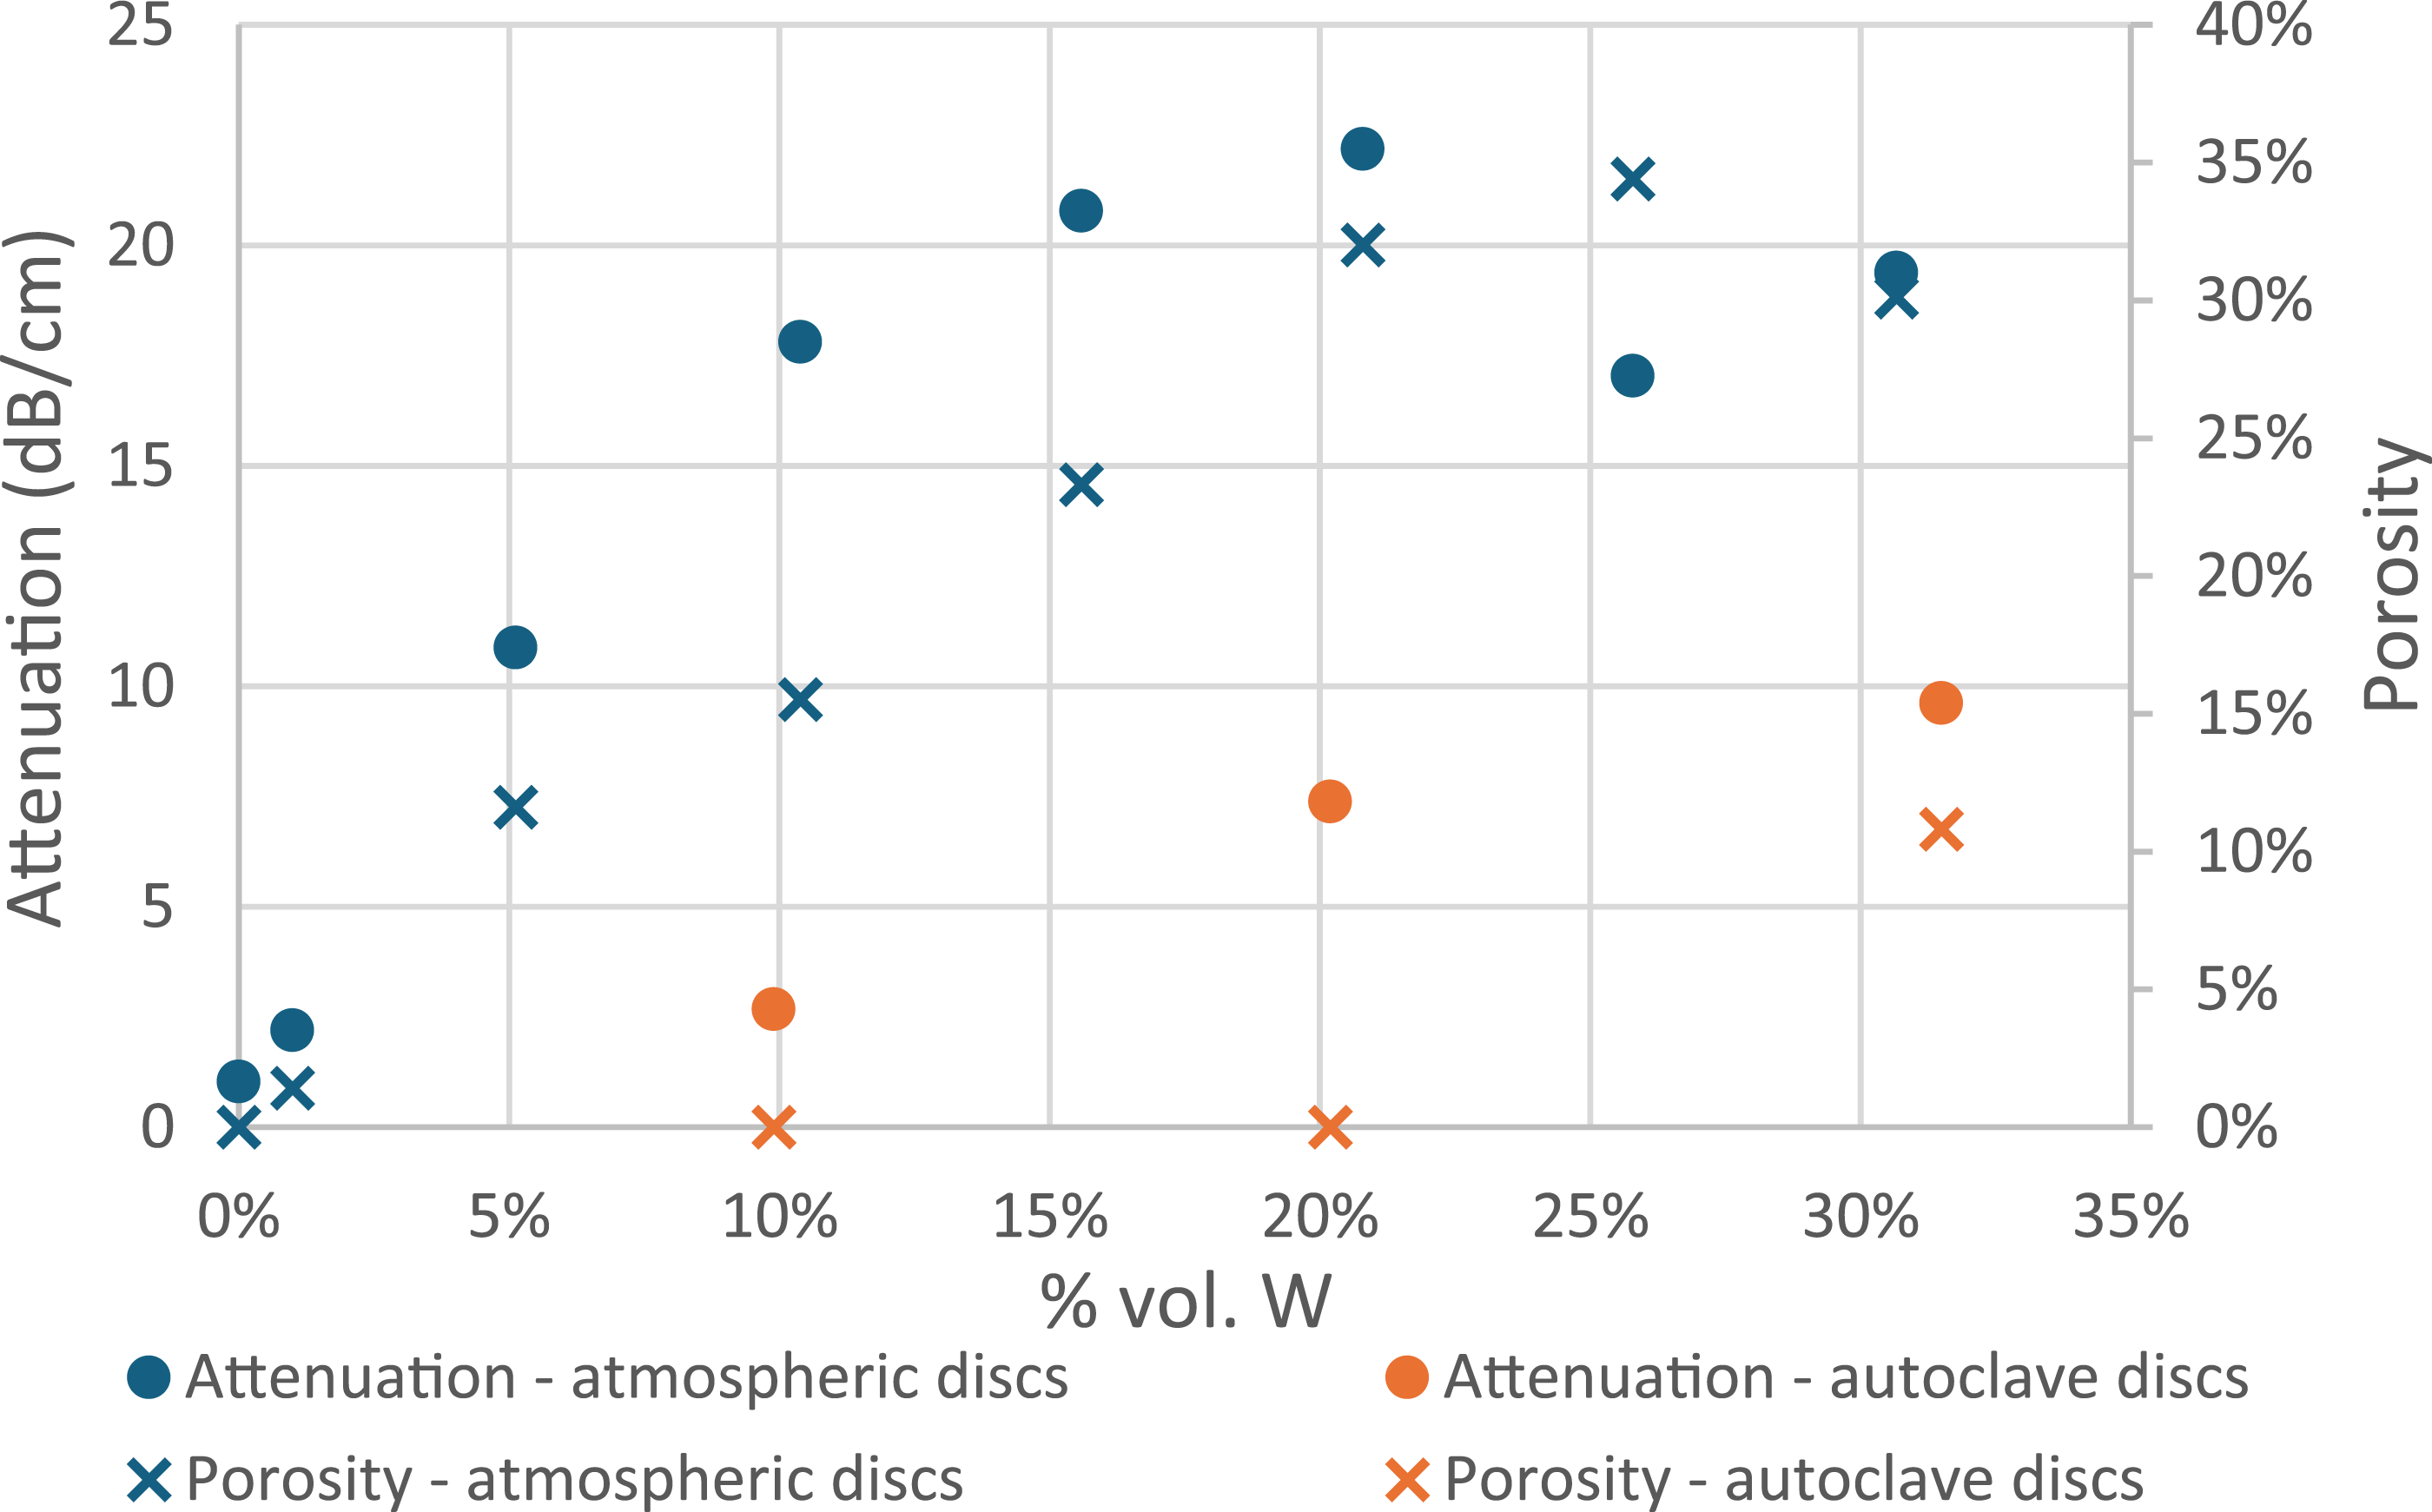
These results also highlight the effect of porosity on attenuation. When comparing the 10% and 20% vol. W AC discs and the 10% and 20% vol. W ATM discs, the absence of pores in the AC discs causes considerably lower attenuation values than in the highly porous ATM discs; porosity is the only variable that could have caused these changes. The increase in attenuation between the 10% and 20% vol. W AC discs despite both samples having no pores suggests that an increased prevalence of tungsten particles does increase attenuation in the samples, but this has a lesser effect than porosity. In the ATM discs there is generally a notable correlation between greater porosity in the discs and higher attenuation values, excluding the unexplained reduction at 25% vol. W.
A comparable study that also used a 5 MHz transducer 16 observed consistently higher attenuation values in their samples across a variety of particle sizes and % vol. W mixtures than seen in the present work. It is believed this is due to their particle sizes being considerably smaller (≤50 μm) than the Tungrit particles (≈250 μm). Contrary to this data, they found the attenuation typically reduced with an increase in % vol. W; there is no clear explanation for this difference.
In other studies, bond lines are controlled to be between 100 and 500 μm (often the optimal bond thickness falls within this range34,43,44); these are considerably thinner than in the discs assessed in this paper. The influence of attenuation would therefore be minimised in such thin bond lines; increasing the bond line thickness may be required if wave control is deemed more critical than bond strength. However, where high attenuation would be undesirable across the interlayer, thin bond lines could minimise the effects of this increased attenuation.
Shear overlap tests
Figure 15 shows the trend in shear strength is not linear and is also not easily predictable with increased % vol. W, owing to a large variability between seemingly identical repeats. There is a decrease in shear strength between pure epoxy samples (including those with positioning fabric present) and the epoxy-tungsten composite, most notably between 0 and 15% vol. W. In samples with ≥15% vol. W, the shear strength remains relatively constant at ≈60% below that of the pure epoxy samples. This may be unacceptable in applications where maximum bond strength is the critical requirement of the adhesive, such as in applications subject to vibrations or extreme conditions. However, an adequate bond strength is maintained that could be suitable where high bond strength is not a priority, such as in transducers. Variation of shear strength with increased % vol. W (all erroneous data is marked with a red X).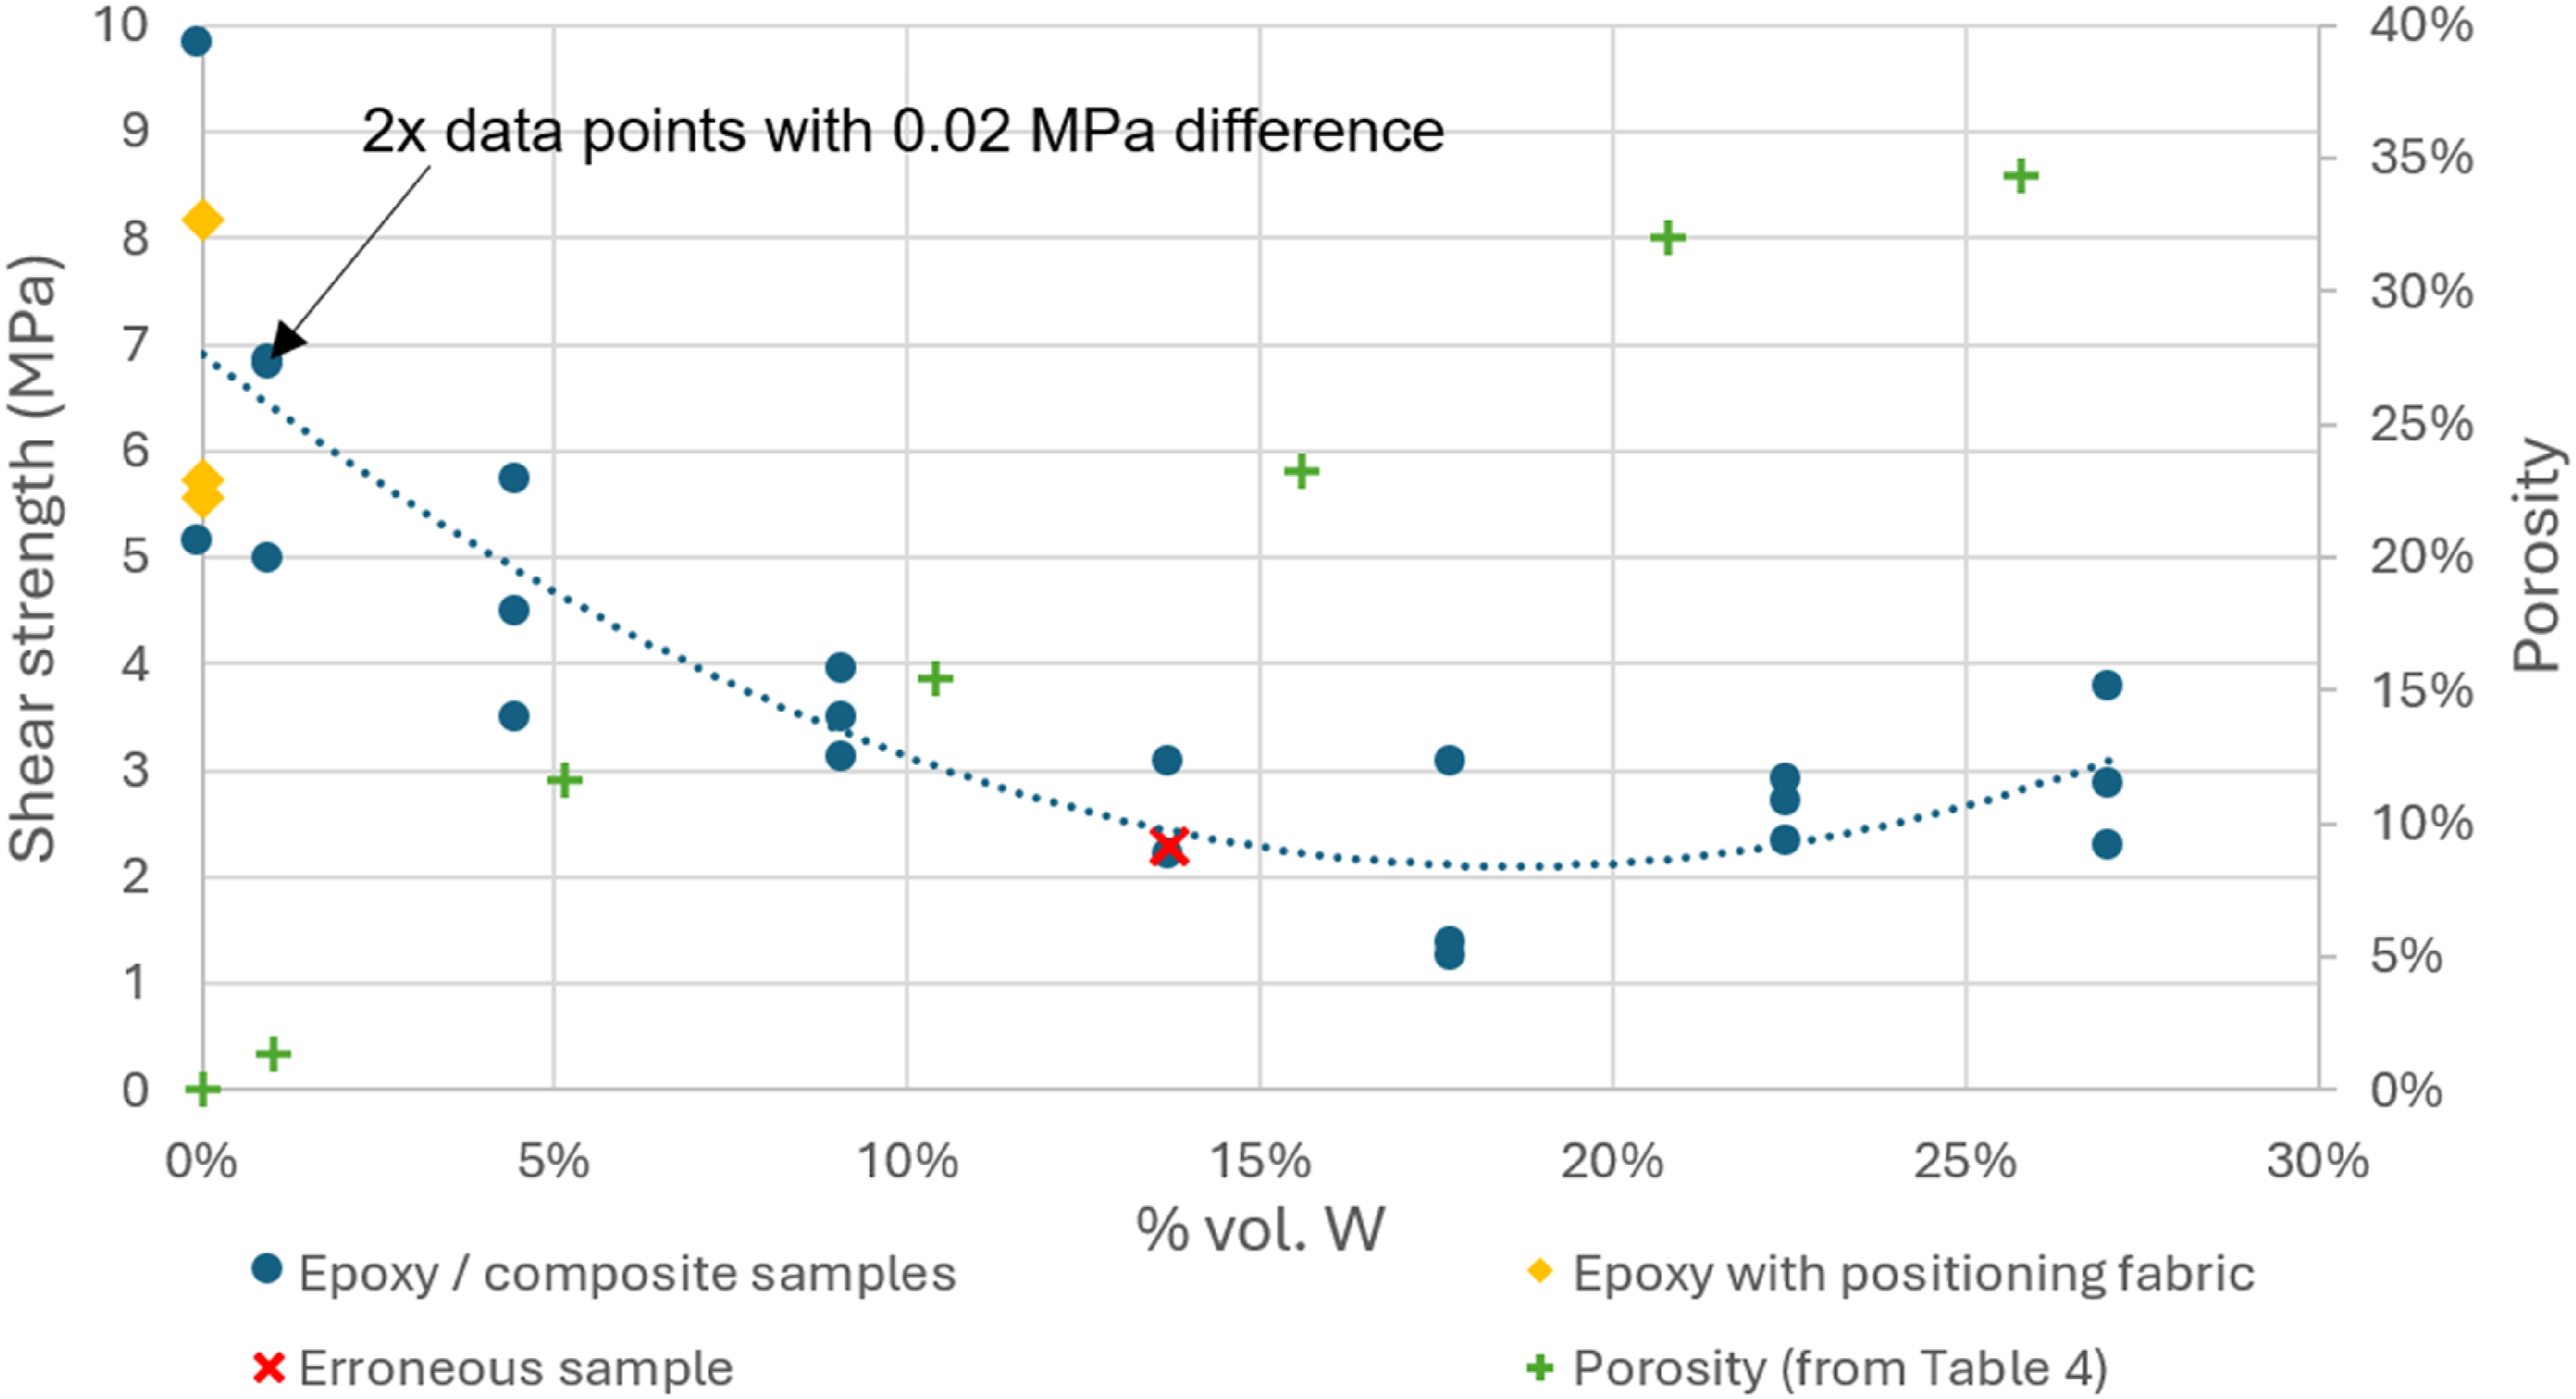
Notably, the reduction in shear strength broadly correlates with the estimated porosity (taken from Table 4 for samples made under the same atmospheric conditions) for each sample; porosity has been observed elsewhere as the primary cause for a reduction in shear strength. 45 Beyond porosity, the reduction in shear strength with increased % vol. W would also be caused by the dispersion of particles within the epoxy matrix disrupting the cohesive failure mechanism and dispersion of energy through cross linking when compared to pure epoxy. Increased % vol. W would also lead to more particles being in direct contact with the bonding interfaces, reducing the bonding area and thus the shear strength. The latter two contributing factors to reduced shear strength would also be influenced by increased porosity, either through more pores causing a greater disruption the cohesive failure mechanism of the epoxy, or through these pores interfering with the substrate–epoxy bonding interface. Porosity is therefore considered to be the primary cause for the reduced shear strength observed in these samples. AC samples would likely eliminate these pores and isolate the effects of the tungsten particles on the epoxy shear strength, likely improving adhesive bonding.
Interestingly the pure epoxy samples without the positioning fabric (and therefore without semi-controlled bond line thickness) demonstrated the greatest shear strength variability, whilst even the thin positioning fabric appeared to reduce this effect. The introduction of tungsten particles seemingly decreased the variability of shear strength between identical samples, believed to be due to the controlled bond line thickness, which could be beneficial. However, the random distribution of the tungsten particles within the composite may be responsible for the smaller but significant variations in the 5% and 20% vol. W samples, suggesting that increased % vol. W may cause undesirable inconsistencies in bond performance.
One of the 15% vol. W samples formed with an inconsistent bond thickness of ±75 μm (marked with a red cross in Figure 15) compared to the other composite samples that were all within ±15 μm of one another. However, in this sample the calculated shear strength remained comparable to the other two 15% vol. W samples. This provides tentative evidence that inconsistent interlayer thickness across two bonded components may have little effect on the shear strength of the epoxy mixture (provided it does not cause a particularly thin bond line to form at any point), increasing the simplicity of manufacturing tolerances involving this composite and potentially allowing for thicker bond line thicknesses (and the accompanying benefits of these, such as attenuation acting over a thicker bond line) to be considered.
The observed reductions in shear strength could be overcome by employing better surface preparation techniques. When used on etched or grit-blasted surfaces, DP190 epoxy is seen to have greatly increased shear strength when compared to smooth surfaces, 34 whilst plasma cleaning has also been shown to increase shear strength between ceramics and composite resins. 46 Additional additives to the tungsten–epoxy mixture could also help improve this bond strength.12,13,24
Conclusions
Tungsten–epoxy particulate composites were fabricated using relatively large tungsten particles under both atmospheric and autoclave conditions, and subsequently characterised. Extensive analysis through CT scanning and optical microscopy allowed for both qualitative and quantitative analysis of the distribution of both tungsten and pores in composites with various % vol. W. Functional grading of tungsten particles was evident in samples formed under atmospheric conditions with up to 10% vol. W, whereas the introduction of autoclave conditions allowed functional grading to occur up to 20% vol. W. The use of an autoclave also considerably reduced porosity in the samples, resulting in higher densities and longitudinal sound speeds that ultimately led to increased acoustic impedances (8.41 MRayl vs 3.90 MRayl at ≈20% vol. W for autoclave and atmospheric samples, respectively). Attenuation across multiple transmitted wave reflections under ultrasonic testing rapidly increased with the introduction of tungsten particles, although this was lessened in the autoclave samples once more due to their lack of porosity. There was a reduction in shear strength with the introduction of tungsten particles, although the effect of this reduction would likely be minimised by including other filler materials or through manufacturing process optimisation.
This study was undertaken to demonstrate the viability of particulate composites as a bonding interlayer where control of waves through this interlayer was required. The difference between properties in different % vol W. samples suggests that adhesive bonding interlayers (albeit with reduced bond strength) with a range of properties can be created as required through controlling the manufacturing process and materials within the composite. Furthermore, the capability to produce functional grading within this interlayer suggests that the acoustic impedance and attenuation can be altered throughout the depth of the bond thickness to control the passage of waves across such an interlayer (or other material properties that would be altered but that were not measured within this work, such as electrical conductivity, thermal conductivity, or fracture toughness, to name a few). Overall, the wide range of impacts of changing tungsten loading on multiple key properties shows considerable promise for these materials in terms of tailoring for interlayer/matching layer applications and appears a novel innovation as, to the authors’ knowledge, it is not something that has been widely considered previously.
A limitation highlighted at this early stage of research is the inherent thickness required for functional grading to occur; functional grading typically occurred over >1 mm, which is considerably thicker than the optimum bond line thickness for most epoxies. Furthermore, thinner bond lines that are typically optimal would have minimal disruptive/attenuative effect on the passage of waves through this interlayer. The optimisation of thicker bonding layers or the production of functional grading over a thinner region through refinement of the manufacturing process would likely improve the feasibility of the concepts studied in this work being applied more widely in industry. Alternatively, these particulate composite interlayers could be produced as a standalone material that is then bonded to other adherends using conventional structural adhesives; this would create a sandwiched ‘macro-interlayer’ between the two primary adherend materials that could be tightly controlled without risk of reducing the overall bond strength through overly thick bond lines. A final alternative application of this research is the use of relatively thick functionally graded particulate composites in larger components (such as the backing material for transducers), allowing optimal wave control.
Footnotes
Acknowledgements
This work was supported by Adrian Mustey, Andrew Roberts, and Karl Norris of Cranfield University in the preparation of samples and support with critical testing equipment. Dr Fiona Brock of Cranfield University was instrumental in the setup and running of the CT scanner and the provision of information surrounding this equipment.
Author contributions
Daniel Powell was responsible for the conceptualisation, methodology, data gathering and curation, investigation, and visualisation of all work within this paper, alongside writing both the original and final draft.
Gareth Appleby-Thomas and Jonathan Painter were academic supervisors for the research activity, with further involvement in conceptualisation, funding acquisition, project administration, resources, and the review and editing of this paper.
Kam Sagoo, Nick Brown, and Chris Livesey were industrial supervisors for this research activity, with further involvement in conceptualisation, funding acquisition, project administration, resources, and the review and editing of this paper.
Funding
The authors disclosed receipt of the following financial support for the research, authorship, and/or publication of this article: This work was supported by the United Kingdom Research Institute (UKRI) and European Physical Sciences Research Council (EPSRC), in collaboration with Rheinmetall BAE Systems Land (RBSL).
Declaration of conflicting interests
The authors declared no potential conflicts of interest with respect to the research, authorship, and/or publication of this article.
Data Availability Statement
Data sharing Data is available upon request by email to the corresponding author.