
Abstract
This study explores the development of conductive co-continuous polyvinylidene fluoride/polypropylene/graphite (PVDF/PP/GR) composites with varying PVDF/PP ratios (60:40 and 70:30) to evaluate the effects of single and hybrid GR fillers on composites’ electrical conductivity, morphology, thermal stability, and mechanical properties. The composites were prepared with GR fillers ranging from 20 to 60 wt.% and particle sizes between 5.9 and 564 µm. Morphological analysis using scanning electron microscopy (SEM), supported by selective solvent extraction of the PVDF phase, confirmed a well-developed co-continuous structure at a PVDF/PP ratio of 70:30. Key performance metrics, including through-plane electrical resistivity (inverse of conductivity), thermal degradation, and mechanical strength, were systematically analyzed. The results showed that the addition of 60 wt.% GR reduced melting temperature while improved overall crystallinity and the degradation temperature from 440°C to 480°C, with a corresponding increase in residual ash content from 15 to 70 wt.%. Among the single-filler composites, medium-sized GR particles (17.8 µm) at 60 wt.% in the PVDF/PP (70:30) system exhibited the lowest electrical resistivity (3.41 Ω·cm). Additionally, the incorporation of 60 wt.% hybrid GR fillers, mixture of medium (17.8 µm) and large (561 µm) particles in an 80:20 ratio, further reduced resistivity to 1.17 Ω·cm, showing the synergistic effect of hybrid GR fillers of different sizes. Small GR particles act as bridges between the larger ones, leading to a more electrically conductive GR network. Mechanical testing revealed a flexural modulus ranging from 0.9 to 9.9 GPa and a flexural strength ranging from 7.0 to 26.3 MPa. The compressive elastic modulus varied between 0.1 and 0.2 GPa, while the compressive strength ranged from 7.8 to 22.9 MPa. These results highlight the suitability of PVDF/PP/GR composites as electrically conductive materials, particularly for applications in proton exchange membrane fuel cell (PEMFC) bipolar plates, as their main properties are in the range aimed by the U.S. Department of Energy (DoE).
Keywords
Introduction
The incorporation of reinforcing fillers into polymeric materials has become increasingly prominent over the last decades due to their unique properties, which yield significant improvements in electrical conductivity, mechanical strength, thermal resistance, and barrier characteristics among other material attributes.1–4 This surge in interest has particularly impacted the development of conductive polymer composites (CPC) across various industries, including conductors, 5 proton exchange membrane fuel cells (PEMFC),6,7 sensors, 8 and electronic equipment. 9 Typically, inducing conductivity in insulating polymers requires a substantial inclusion of conductive fillers, such as carbon black (CB) or graphite (GR), which raises the electrical percolation threshold. A notable strategy is the utilization of high aspect ratio conductive fillers, including carbon nanotubes (CNTs), carbon fiber (CF), and Graphene (Gr). These fillers enable a marked enhancement in the electrical conductivity of polymer composites, while allowing for reduced filler loadings.
Another approach involves tailoring the microstructure of CPC, such as adopting a co-continuous morphology. 10 This morphology often appears when two immiscible polymers are mixed. 11 Here, immiscible polymer blends refer to a thermodynamic condition in which the system’s Gibbs free energy change is positive (ΔGmix > 0), indicating thermodynamic incompatibility. 12 However, the formation of co-continuous morphology depends on several crucial factors, including the system’s composition, the structural characteristics of the polymers, and processing conditions, such as the rotational speed of the mixing elements, the mixing temperature, and the mixing time. 13
Blending multiple polymers results in a composite that integrates various properties of the constituent materials, leading to improvements in toughness, stiffness, electrical conductivity, and heat resistance.14–16 It is important to note that even within a co-continuous network, achieving effective conductivity generally requires a high loading of conductive fillers. When these conductive fillers, such as CB, GR, Gr, CF and CNT are incorporated, they are positioned either between the two polymer phases or within one phase. The concept of “double percolation” describes the non-uniform distribution of conductive fillers in the filler-rich phase of co-continuous composites. For effective conductivity, it is crucial to establish a percolation network in the filler-rich phase and maintain continuity through the whole composite. 17 Alo et al. 18 demonstrated that composites made of polypropylene (PP), epoxy, and GR in both single and co-continuous morphology matrices showed that the latter with 50 wt.% GR exhibited superior electrical conductivity compared to its single matrix counterpart. Similarly, Fina et al. 19 reported increased electrical conductivity in PVDF/malleated-PP (PP-g-MA)/GR composites with rising in GR content from 0 to 30 wt.%. The enhanced conductivity in these composites, relative to GR-single polymer composites with similar GR loadings, can be attributed to the confined concentration of the conductive particles within the co-continuous polymer blend matrix. Tarannum et al. 20 developed expanded graphite/polyetherimide (EG/PEI) composites using a solution casting followed by short-time ultrasonication. The resulting composites exhibited an electrical conductivity of 969 S/m at just 10 wt.% EG, attributed to the preservation of a 3D interconnected graphitic network that minimized EG structural damage during processing. Similarly, Ramadani et al. 21 developed polybenzoxazine nanocomposites incorporating EG through solution blending and compression molding. Their study reported a significant electrical conductivity enhancement, reaching 28.3 S/cm at 15 wt.% EG. This improvement was linked to the high aspect ratio of EG, its honeycomb-like structure, and the formation of effective 3D conductive pathways within the polybenzoxazine matrix. Bajpai et al. 22 explored ethylene vinyl acetate (EVA)-GR composites using a pellet-based extrusion method with a computer numerical control (CNC)-assisted extrusion tool. By varying GR content from 5 wt.% to 30 wt.%, they reduced resistivity from about 215 × 103 Ω·cm to 32.6 Ω·cm, respectively.
For conductive fillers such as GR, not only the quantity but also the shape and size of the particles play crucial roles in determining the material’s performance. For example, Hui et al. 23 studied the effect of GR particle size on the electrical conductivity of polymer composites. Their findings revealed that electrical conductivity increased from 79 S/cm to 167 S/cm as the GR particle size increased from 325 to 100 mesh. This improvement is likely due to larger GR particles reducing the number of conductive interfaces, thereby decreasing contact resistance and enhancing overall conductivity. Furthermore, combining fillers of different particle sizes can further improve conductivity. Chunhui et al. 24 showed that adding 10 wt.% of smaller-sized particles while maintaining a constant total filler loading of 75 wt.% resulted in a considerable increase in electrical conductivity. Other studies have demonstrated that introducing small amounts of additional fillers can significantly enhance the electrical conductivity of composites by improving the conductive pathways. Ozlek et al. 25 prepared GR/Gr/polyaniline composites using a direct mixing method. By incorporating 14 wt.% Gr into a composite containing 74 wt.% GR and 12 wt.% polyaniline (PANI), they achieved an electrical conductivity of 210 S/cm under 527 MPa pressure. Similarly, Mathew et al. 26 developed epoxy-based composites filled with GR, obtaining an electrical conductivity of 75 S/cm with 70 vol% GR. The addition of 10 vol% CB as a secondary filler further increased the conductivity to 120 S/cm.
Polyvinylidene fluoride (PVDF) is a prominent engineering plastic that has received significant research interest due to its outstanding properties, including a high dielectric constant, strength, thermal stability, chemical resistance, as well as resistance to UV radiation, nuclear radiation, and weather. 27 PVDF is known to form co-continuous phase composites with various polymers, such as polyethylene terephthalate (PET), 28 PP-g-MA, 19 polyamide 6, 29 and PP. 30 In contrast, PP is known for its toughness, impact resistance, cost-effectiveness, and ease of processing, however it typically has a lower modulus and stiffness than engineering plastics like PVDF. 31 Blending these two polymers allows for the creation of composite materials that combine their advantageous properties into a single material.
In this study, PVDF and PP were selected as immiscible matrix components, with GR added to enhance the electrical conductivity of the resulting (PVDF/PP)/GR composites, due to GR’s superior electrical conductivity. 32 A series of co-continuous (PVDF/PP)/GR composites with varying PVDF/PP ratios were prepared to investigate this effect. The research focused on assessing the influence of GR filler concentration, particle size, and combinations of hybrid GR/GR systems on the composites’ electrical conductivity, morphology, thermal, and mechanical properties. It introduces a novel strategy for enhancing the properties of conductive polymer composites by incorporating hybrid GR fillers with varying particle sizes. This approach enables a tailored and optimized filler system for advanced applications. While previous research has investigated synergetic effects using different types of fillers, the impact of particle size variation within the same filler material remains insufficiently explored. The proposed hybridization strategy demonstrates significant synergistic effects, markedly improving electrical, thermal, and mechanical properties beyond what is achievable with a single particle size.
Experimental
Materials
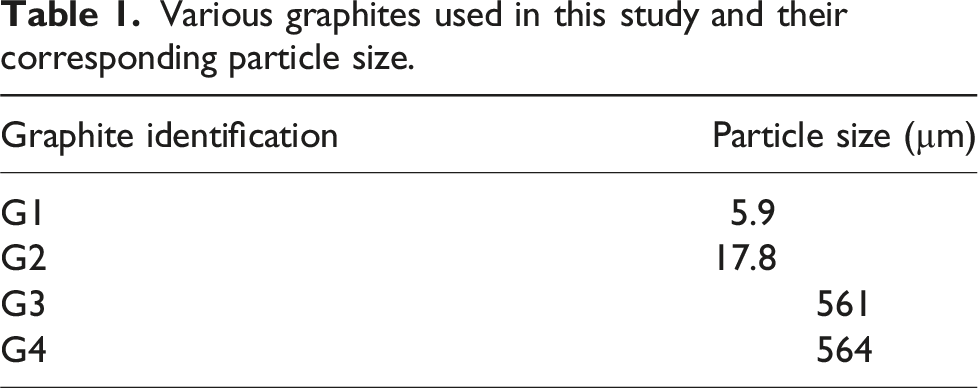
Various graphites used in this study and their corresponding particle size.
Composite preparation
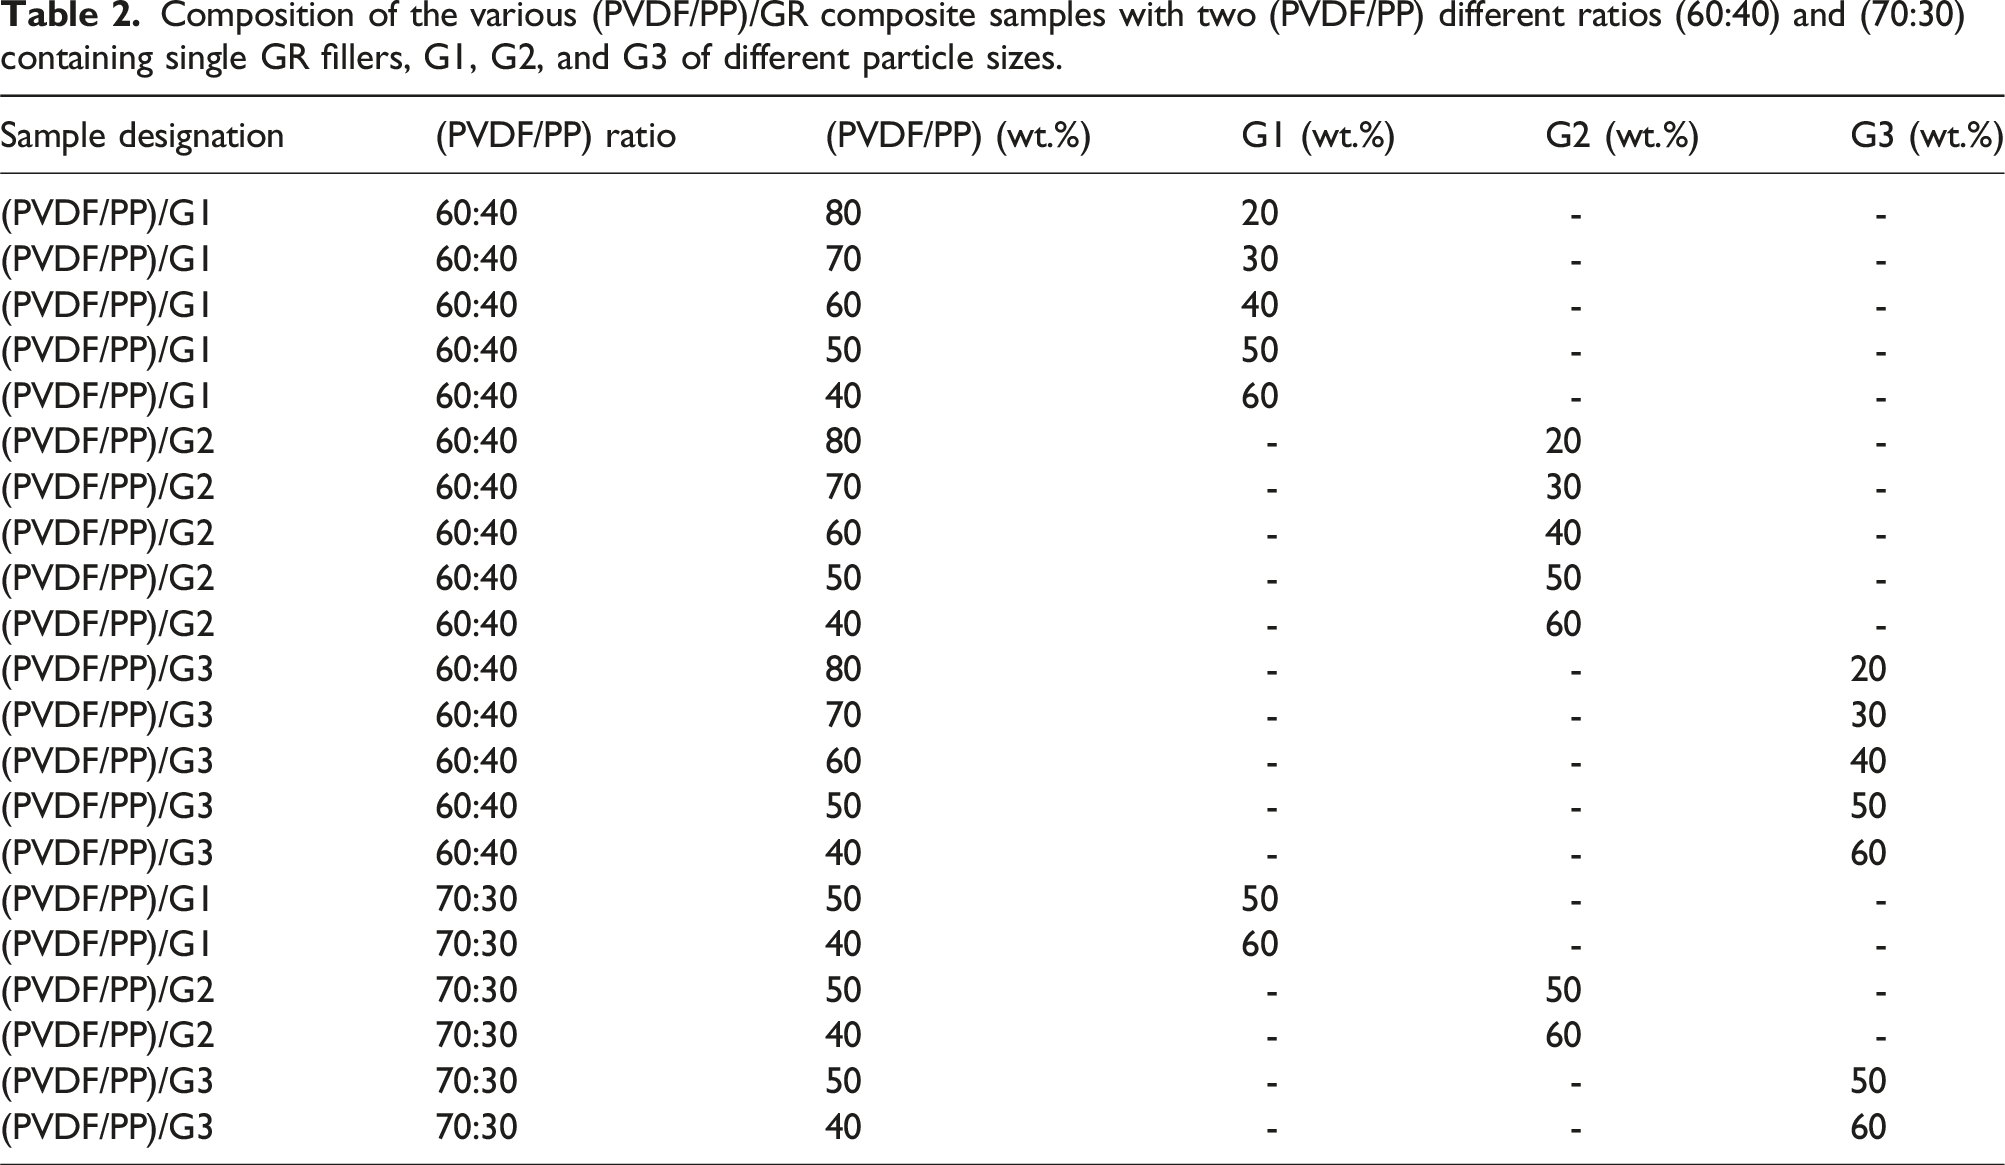
Composition of the various (PVDF/PP)/GR composite samples with two (PVDF/PP) different ratios (60:40) and (70:30) containing single GR fillers, G1, G2, and G3 of different particle sizes.
Composition of various (PVDF/PP)/GR composite samples with (PVDF/PP) ratio of (70:30) containing 60 wt.% of hybrid GR/GR fillers of different sizes.
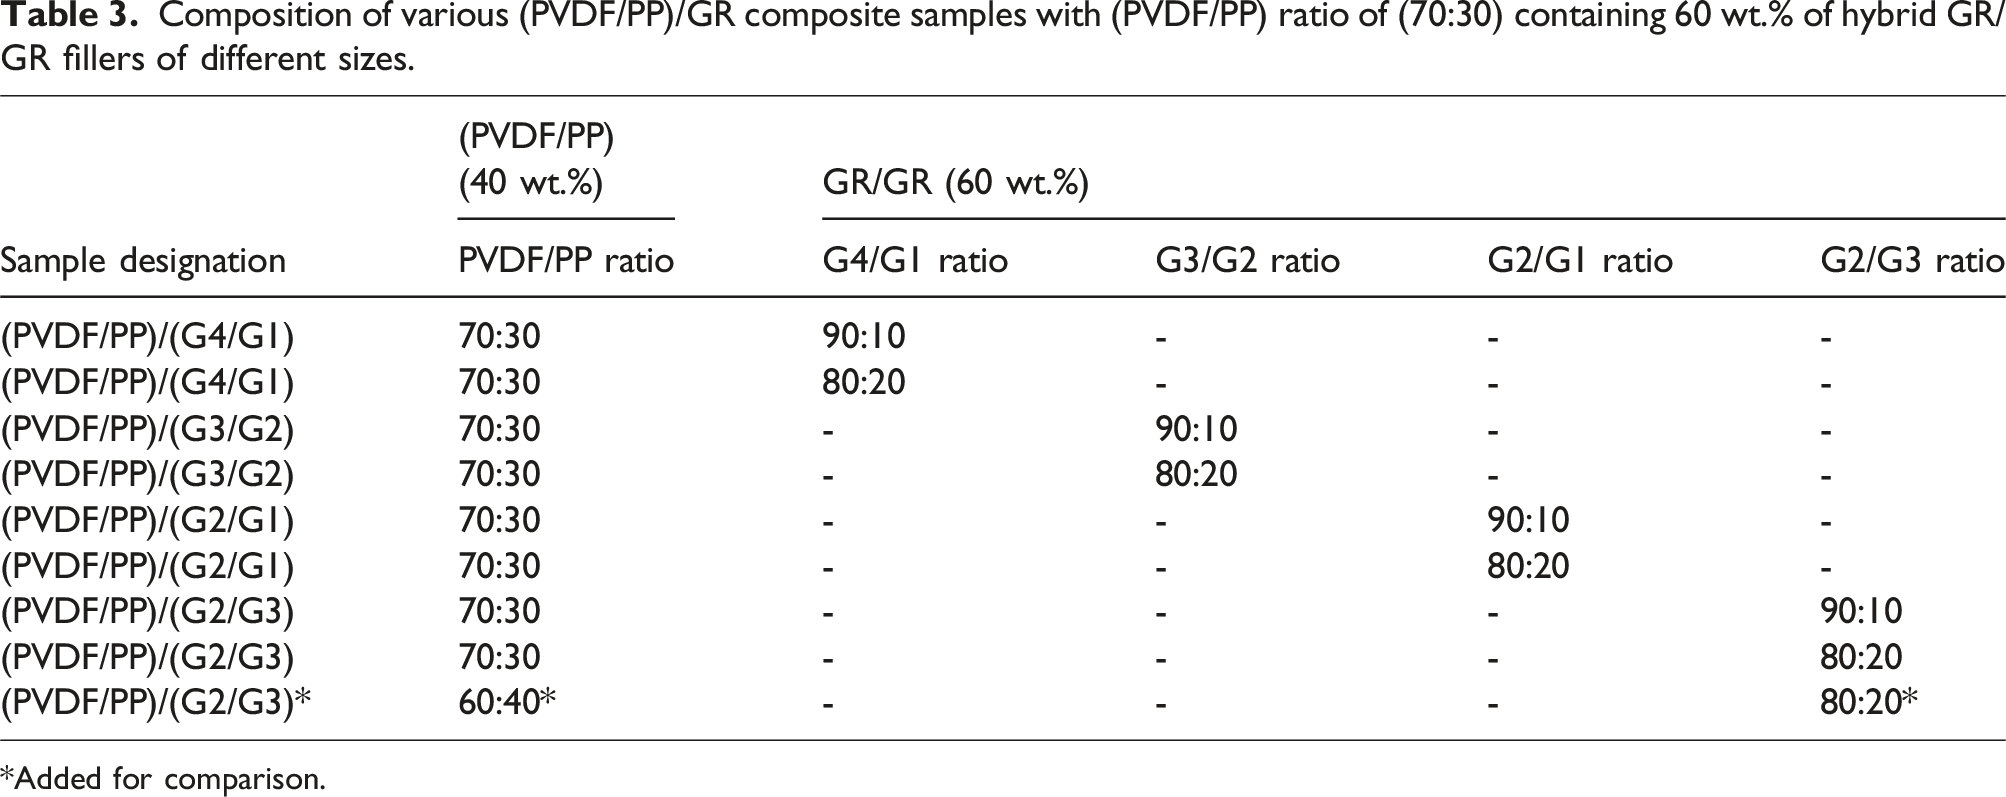
*Added for comparison.
Characterization
Scanning electron microscopy (SEM)
The morphology of the produced composites was examined with a JEOL scanning electron microscope (SEM; model JSM-840A) at a voltage of 15 kV. Samples were initially cryo-fractured in liquid nitrogen before being sputter-coated with a gold/palladium (Au/Pd) layer to improve surface conductivity during imaging. To explore phase morphology, samples without GR were etched in dimethylformamide (DMF) for 1 hour at 50°C to selectively dissolve the PVDF phase, allowing for visibility of the co-continuous structure.
Thermogravimetric analysis (TGA)
The thermal stability of the nanocomposites was characterized in a nitrogen atmosphere using a thermogravimetric analyzer (TGA SDTA851e) at a heating rate of 10°C/min, ranging from 50 to 700°C.
Differential scanning calorimetry (DSC)
Differential scanning calorimetry (DSC) analysis was conducted to determine the phase transition temperatures and melting/crystallization enthalpies, utilizing a single heating and cooling cycle. The analysis was performed using a Discovery DSC 25 (TA Instruments, USA) in an aluminum pan, with a heating rate of 10°C/min from −50°C to 250°C under a nitrogen atmosphere. Samples weighing 3-10 mg were initially heated to 250°C and held isothermally for 10 minutes to eliminate any complex thermal history. Subsequently, the samples were cooled to −50°C at a rate of 10°C/min and maintained isothermally for another 10 minutes. Finally, a second heating cycle was conducted up to 250°C at the same heating rate of 10°C/min. Various parameters were derived from the second and third cycles of the DSC curves, including the melting temperature (Tm), crystallization peak temperature (T
c
), onset temperature of crystallization (Tcon), enthalpy of melting (ΔH
m
), and degree of crystallinity (X
c
). The degree of crystallinity of the PVDF and PP components was calculated based on the melting enthalpy of perfect crystals of PVDF (ΔH
m
0
= 104.6 J/g)
34
and PP (ΔH
m
0
= 207 J/g),
35
as well as the weight fraction (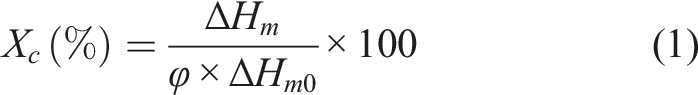
Through-plane electrical resistivity
Measurements of through-plane electrical resistivity were performed on compression-molded discs with a thickness of 2 mm and a diameter of 25 mm. The discs were positioned between two highly conductive, gold-plated cylindrical electrodes under a force of 450 N, with a constant current (I) of 5 A applied. To reduce contact resistance, a layer of highly conductive carbon cloth was placed between each side of the sample and the electrodes. The voltage drop measured across the carbon cloth alone was subtracted from the total measured voltage. The total electrical resistance (R) of the sample was calculated by dividing the corrected voltage drop by the applied current. The volume resistivity ρ (ohm·cm) was calculated using the following equation (2):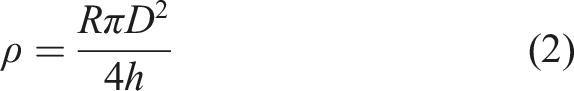
Mechanical characterization
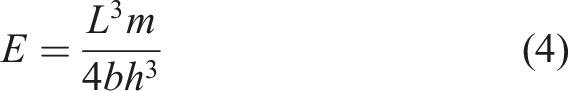
The flexural characterization was performed at room temperature in accordance with ASTM D790, using an Instron universal testing machine (model 5565, Instron, USA) equipped with a 5 kN load cell and a crosshead speed of 2 mm/min. The three-point bending test employed a support span with equal length and width of 12 mm × 12 mm. For each nanocomposite, three different samples were tested to obtain the average values for flexural strength, σ (MPa), which reflects the material’s capacity to withstand the maximum applied force, F
max
(N), before failure, and the flexural modulus, E (GPa), which indicates the material’s stiffness or resistance to deformation under load. These parameters were calculated using the following equations (3) and (4):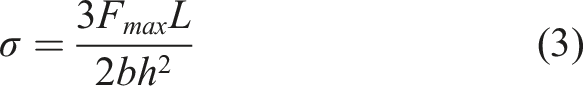
Compression testing was carried out at room temperature using an Instron universal testing machine (model 5565, Instron, USA) equipped with a 5 kN load cell. The samples, prepared in a cylindrical shape with a diameter of 12.7 mm and a length of 25.4 mm, were tested in accordance with ASTM D695. The crosshead speed was set to 1.3 mm/min to determine the compressive elastic modulus, representing the slope of the linear strain region, and the compressive strength, defined as the maximum stress the material can withstand.
Results and discussion
Morphology characterization
Figure 1 presents the SEM micrographs of cryo-fractured surfaces of pure PVDF/PP and (PVDF/PP)/GR composites, with two PVDF/PP ratios (60:40 and 70:30) and varying GR contents. To enhance contrast and assess the level of co-continuity, the PVDF phase in the 60:40 and 70:30 PVDF/PP systems was selectively dissolved using DMF solvent. The composite with 60:40 PVDF/PP ratio (Figure 1(a)) exhibited partially co-continuous regions, with large droplets forming in certain areas, resulting in a partially co-continuous structure. When the PVDF concentration was increased to 70 wt.% (Figure 1(b)), a noticeable increase in droplet size and coalescence occurred, leading to a more pronounced co-continuous structure in both the PP and the PVDF phases, as indicated by holes left after extraction. Changes in the PVDF/PP ratio primarily influence the composites’ morphology, with minimal impact on PVDF/PP interfacial adhesion and phase compatibility due to the inherent immiscibility of PVDF and PP, stemming from their differing chemical structures and polarities. However, the PVDF/PP ratio can indirectly affect these properties through the following mechanisms: (i) Morphology Adjustment: Increasing the PVDF content promotes the formation of a continuous PVDF phase, which may slightly enhance mechanical interlocking at the interface. Conversely, a higher PP content results in a dominant PP phase with dispersed PVDF domains, limiting phase interactions; (ii) Co-Continuity: At specific ratios, a co-continuous phase structure may emerge, increasing the interfacial area. While this does not inherently improve chemical compatibility, it can create more opportunities for mechanical interlocking; (iii) Interfacial Area: A higher concentration of the minor phase (whether PVDF or PP) increases the interfacial area, potentially amplifying the effects of any compatibilizers used. However, without compatibilizers or surface treatments, adjustments in the PVDF/PP ratio primarily modify the physical phase distribution rather than significantly enhancing adhesion or compatibility. SEM micrographs of (a) pure PVDF/PP (60:40), (b) pure PVDF/PP (70:30), (c) (PVDF/PP) (60:40)/(20 wt.% G2), (d) (PVDF/PP) (70:30)/(20 wt.% G2), (e) magnification of GR-filled phase.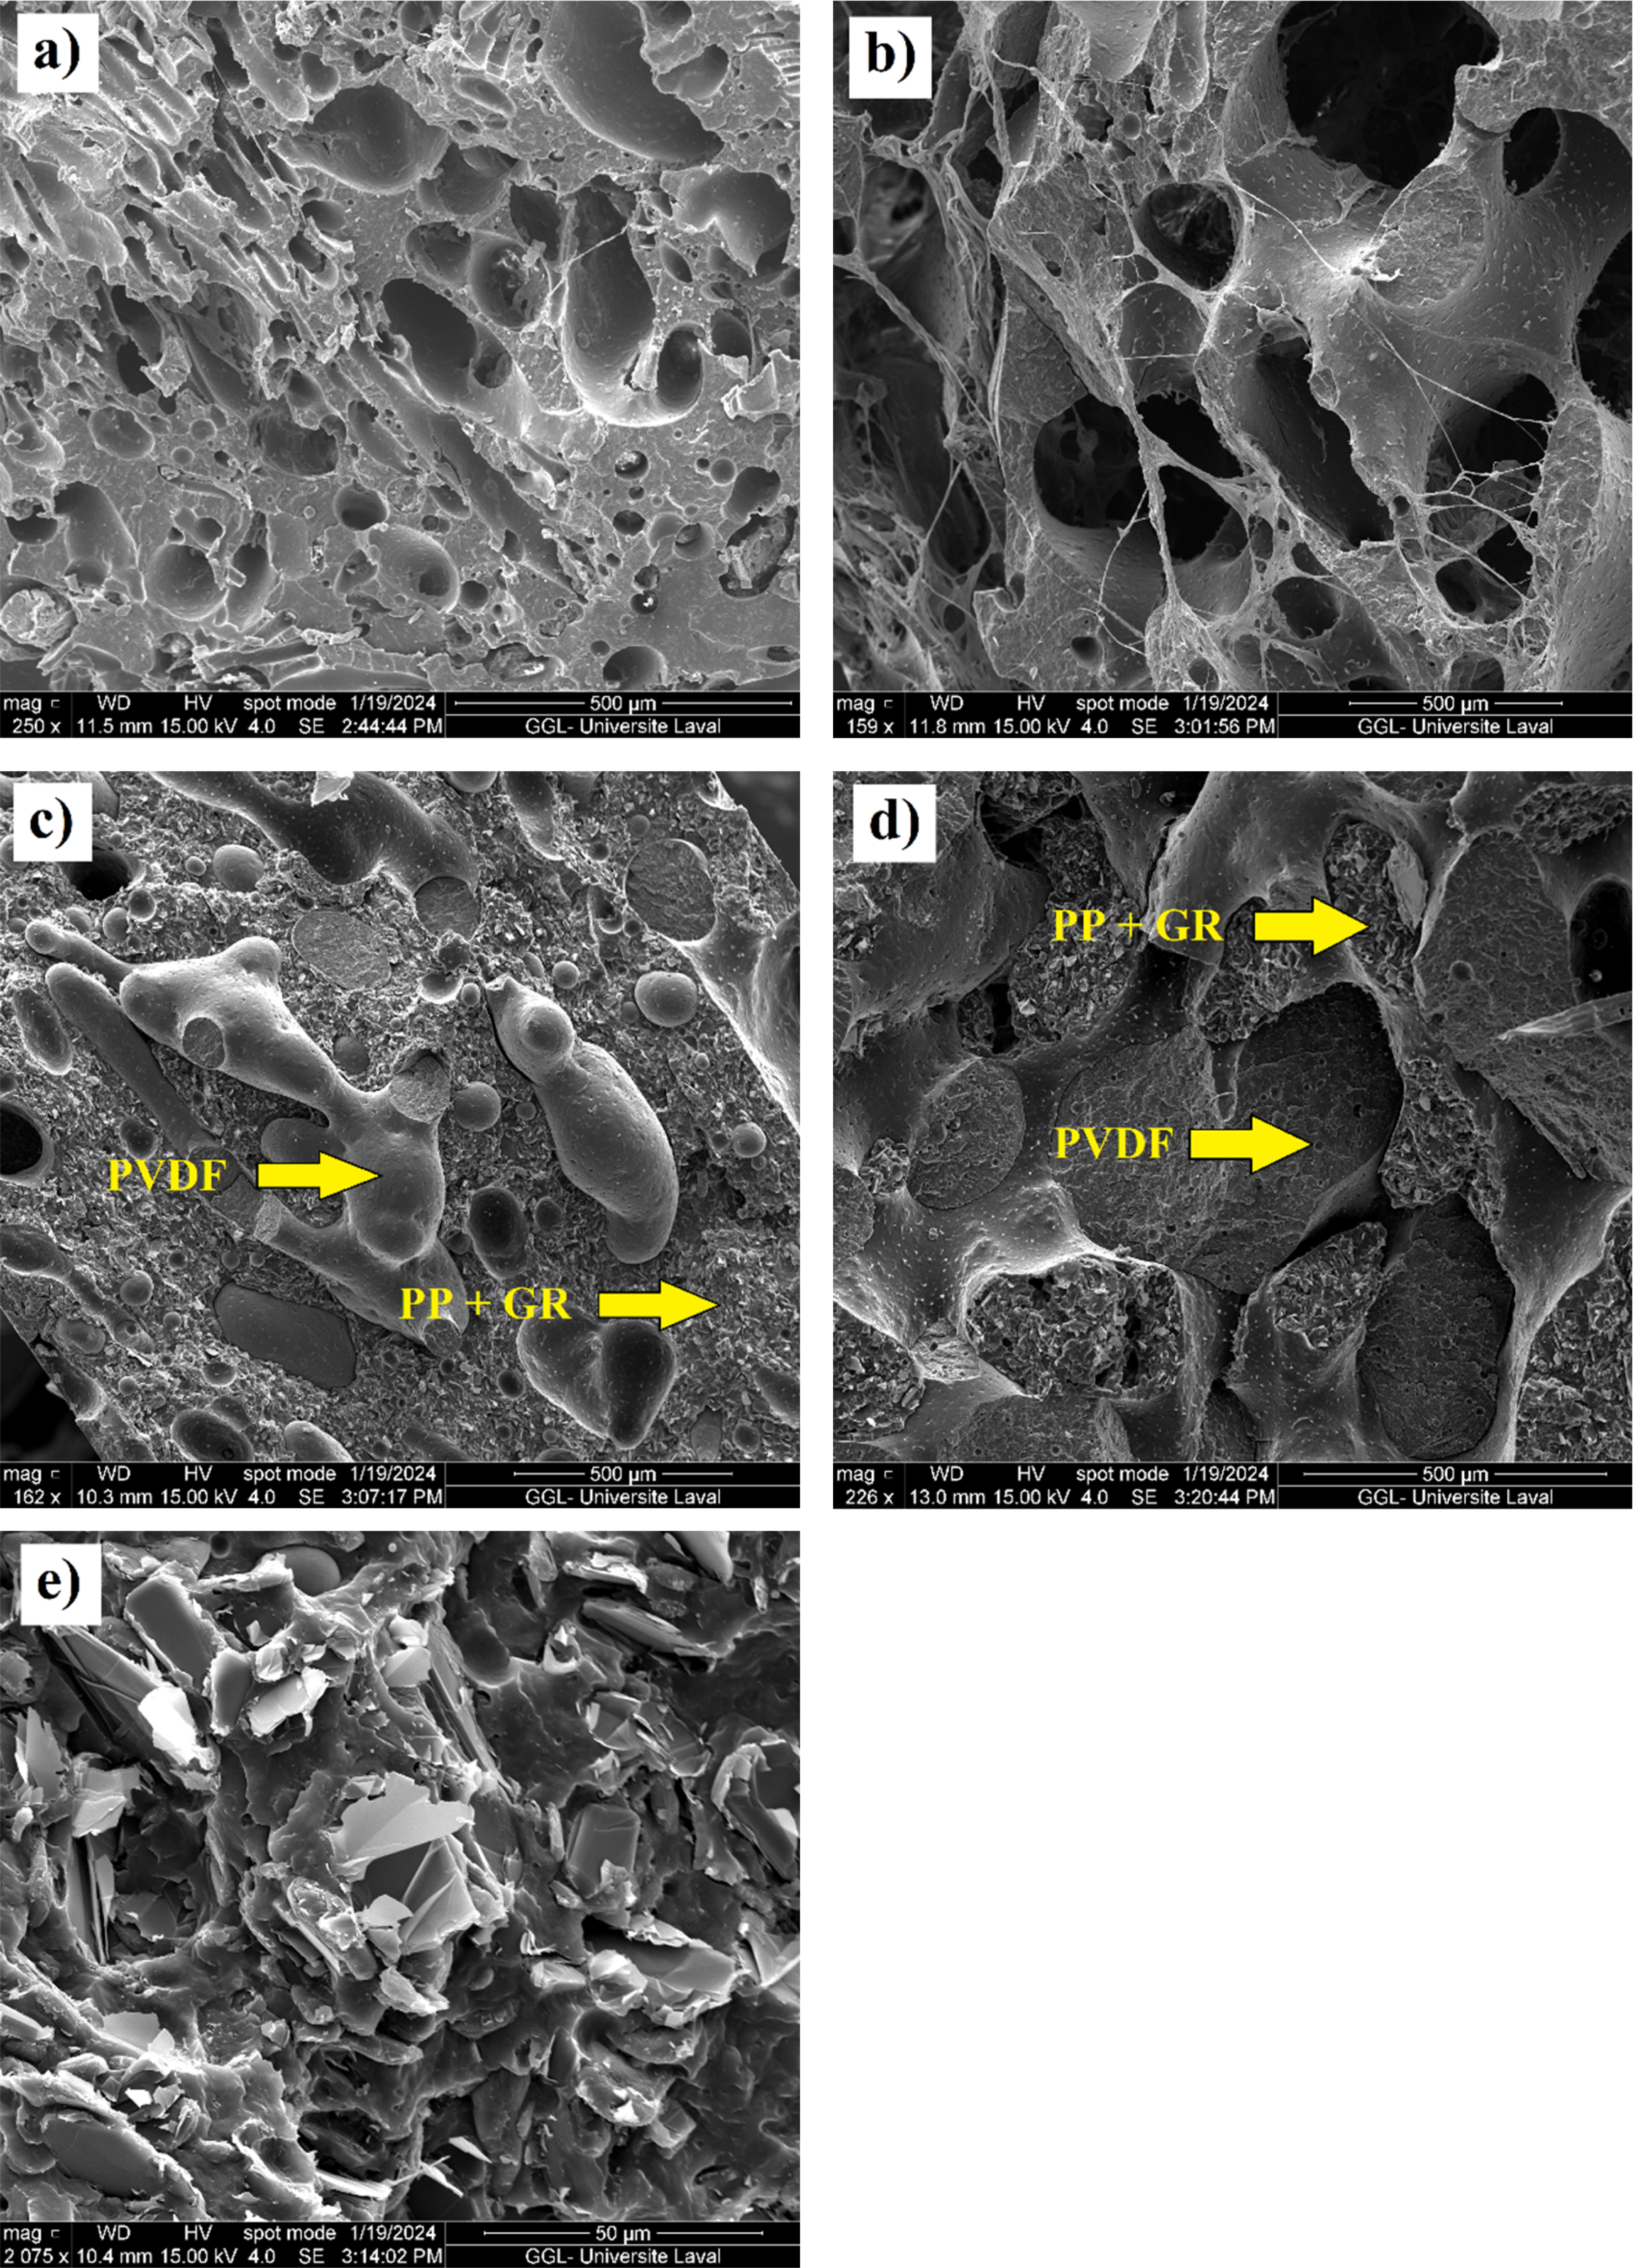
In the GR-filled composites (Figures 1(c) and 1(d)), a distinct phase separation is evident due to the selective dispersion of GR fillers in the PP phase. The positioning of carbon fillers in one polymer phase is influenced by two factors: (i) solid conductive fillers tend to migrate to the polymer phase with the lowest melt viscosity, following the path of least resistance, and (ii) when the polymer phases have similar melt viscosities, fillers migrate to the phase with the lowest interfacial energy.36,37 Previous studies have shown that CB tends to localize in the PP phase due to its lower interfacial energy. 30 Similarly, in (PVDF/PP-g-MA)/GR composites, GR is found in the PP phase, likely because PP’s lower viscosity allows for easier adsorption onto GR compared to PVDF. 19
In the (PVDF/PP)/G2 composite with a 60:40 PVDF/PP ratio and 20 wt.% G2 content (Figure 1(c)), GR particles are predominantly located in the PP phase, as highlighted in Figure 1(e). However, the GR-containing phase is quite coarse, with limited continuity in the PVDF phase. In contrast, for the same G2 content in the 70:30 composite (Figure 1(d)), the microstructure shows improved phase separation and greater continuity in both phases, forming a more effective co-continuous network. It is worth noting that the size of GR particles is a key factor in shaping the network structure and dispersion within the PP matrix. Larger particles enhance network continuity by increasing contact areas and reducing gaps, thereby facilitating efficient conductive pathways. 38 However, their size can sometimes lead to uneven dispersion. In contrast, smaller particles, despite their higher surface area, are prone to agglomeration, which disrupts uniform dispersion and weakens network efficiency. Medium-sized particles offer the best balance, ensuring adequate connectivity while maintaining good dispersion, ultimately leading to a more effective conductive network.
Thermal stability
TGA characterization
The thermal stability of two pure PVDF/PP composites and three filled (PVDF/PP)/GR composites was investigated, with corresponding results presented in Figure 2. During the TGA tests conducted in a nitrogen atmosphere, the samples showed an unusual mass gain between 250°C and 350°C. This unusual behavior can be explained by the buoyancy effect, which significantly influences the apparent mass of the samples. The buoyancy effect, as described in literature,
39
arises from the upward force exerted by the surrounding gas on the sample. As the temperature increases, the density of the surrounding atmosphere decreases, leading to an apparent mass gain. Thermal degradation behavior of pure PVDF/PP composites with (PVDF/PP) ratios of (60:40) and (70:30) and their corresponding (PVDF/PP)/(60wt.% G2) and hybrid (PVDF/PP 70:30)/(60 wt.% G2/G3 80:20) composites: (a) TGA curves and (b) DTG curves.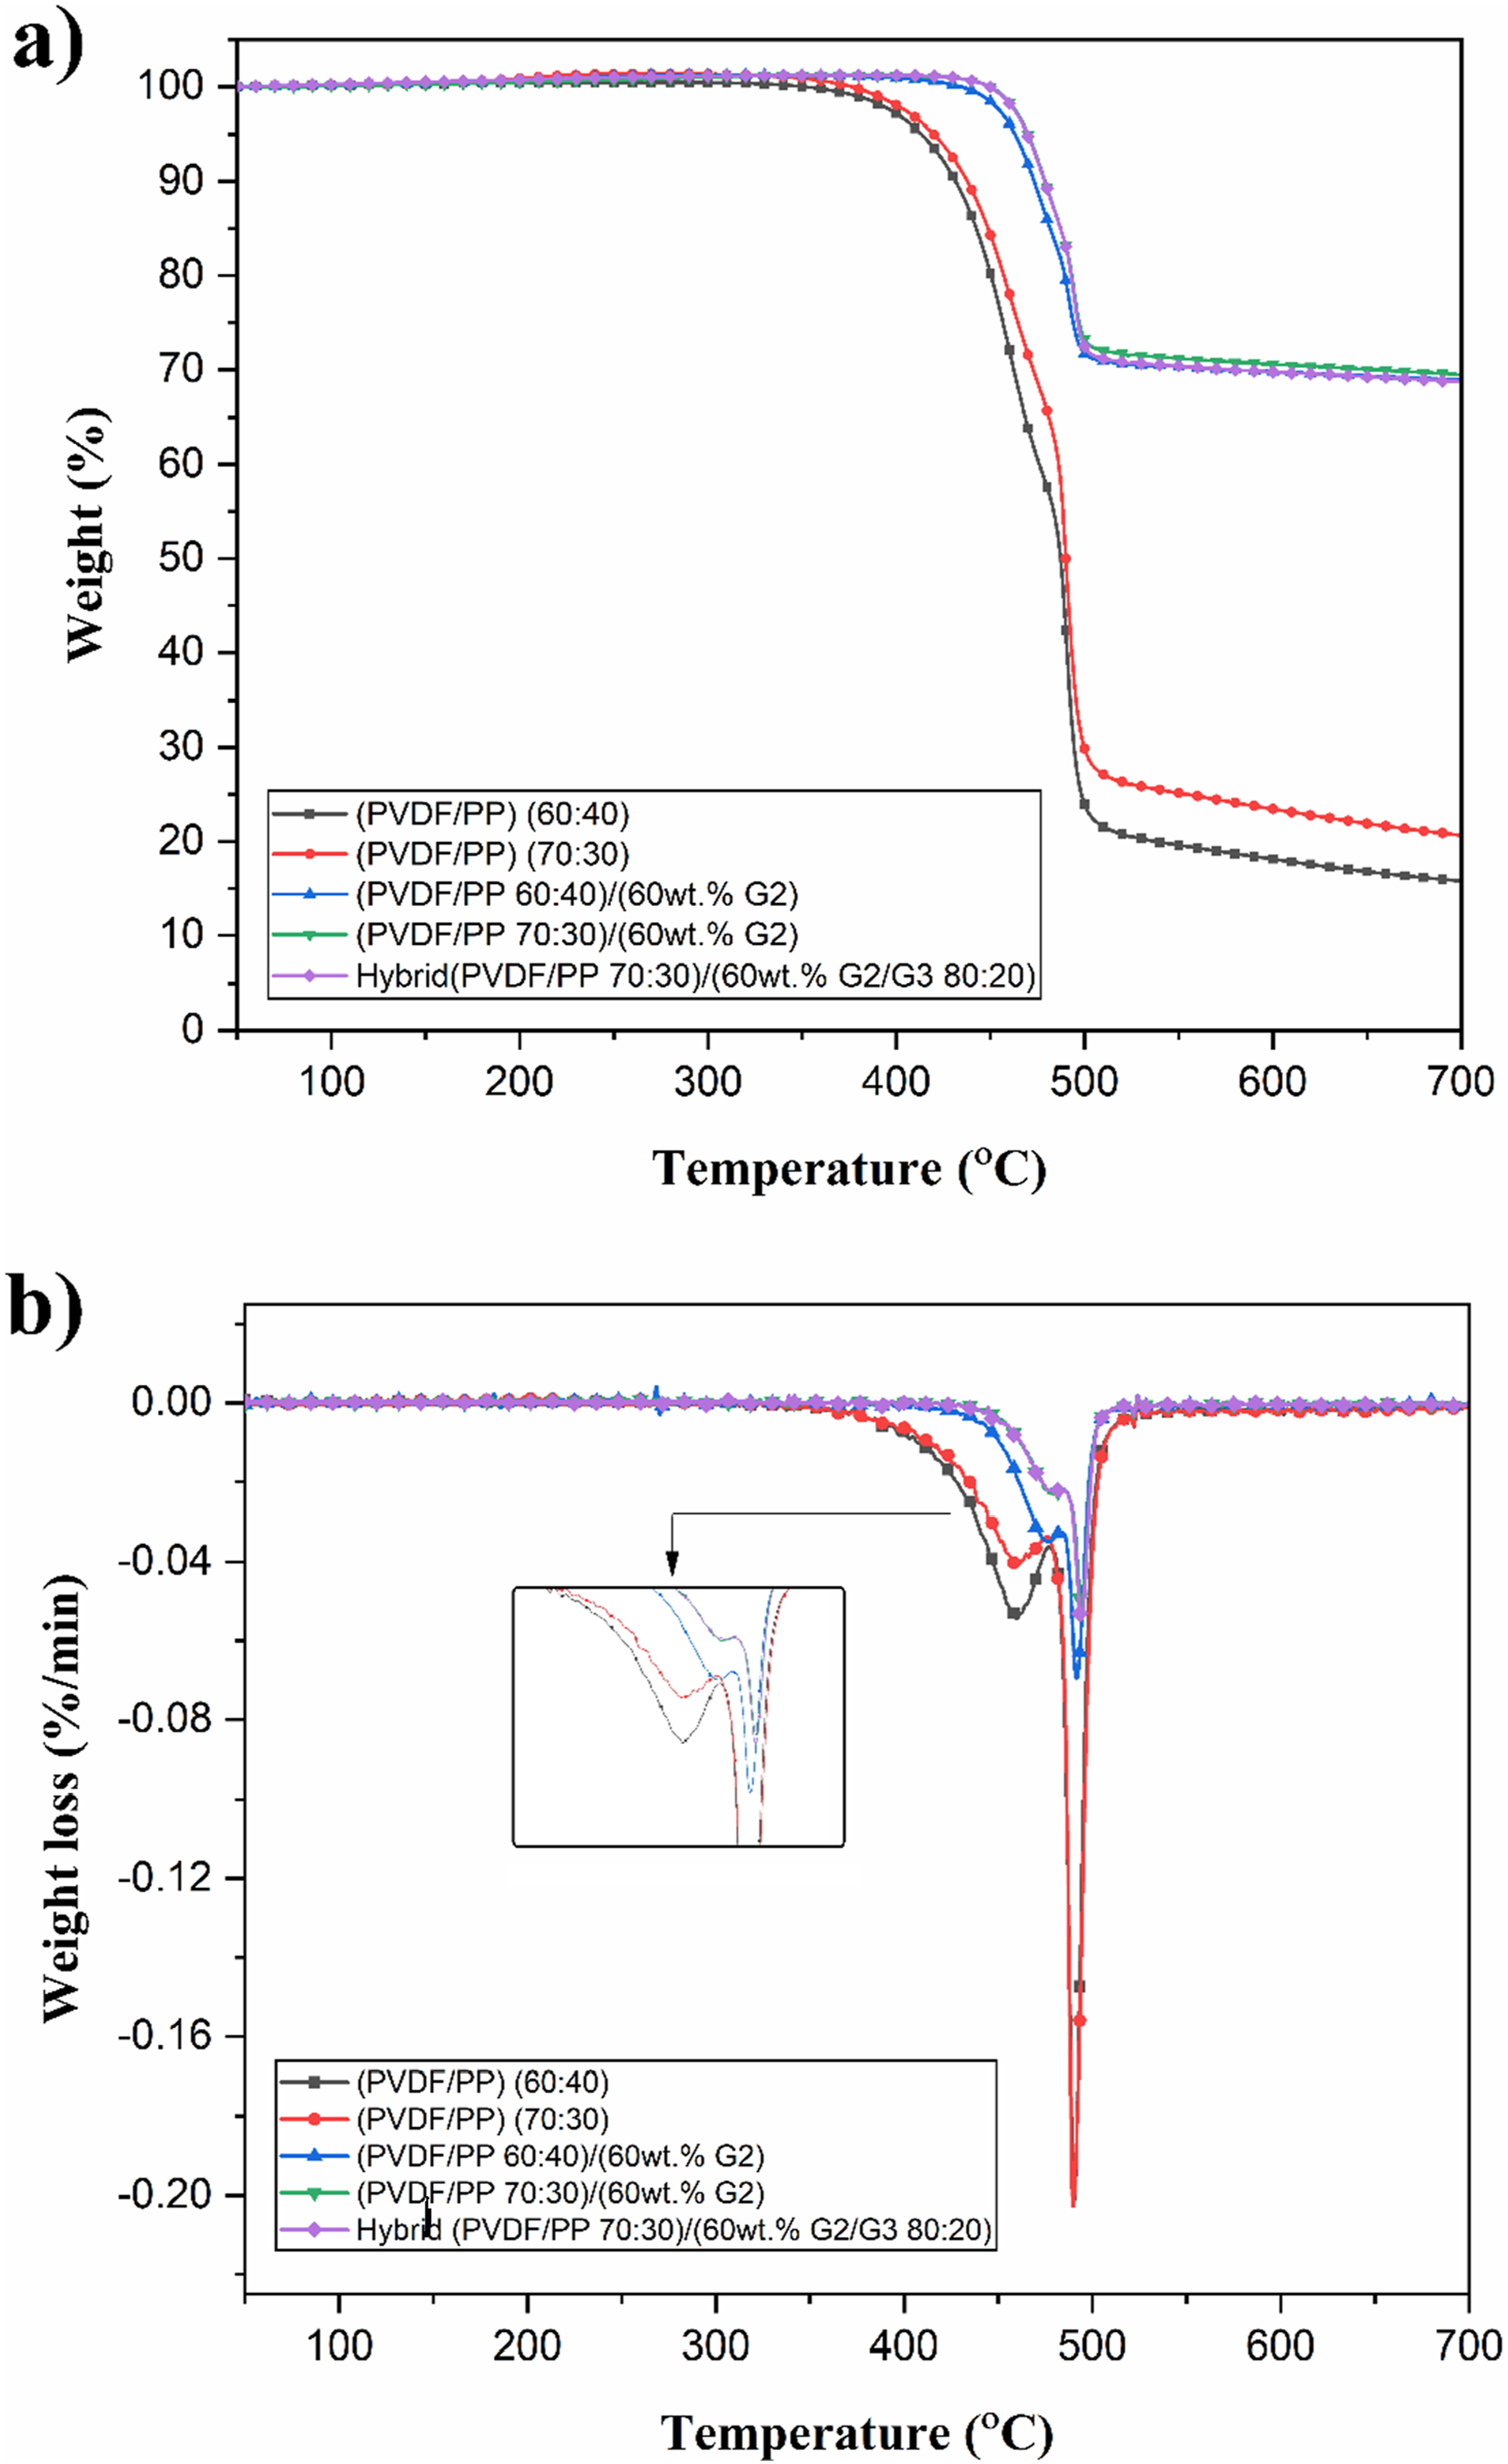
As shown in Figure 2(a), the TGA curves of all samples exhibit a two-step thermal degradation process, while their derivatives (Figure 2(b)) reveal two distinct peaks corresponding to the respective weight losses. The first peak, observed around 440°C for pure PVDF/PP samples and 480°C for (PVDF/PP)/GR samples, is associated with the degradation of the PP phase. The second peak, occurring between 490°C and 500°C, corresponds to the degradation of the PVDF phase, as reported in literature.40,41 Figure 2(a) clearly demonstrates that the pure PVDF/PP composite with a 70:30 PVDF/PP ratio shows improved thermal stability compared to the composite with a 60:40 ratio. At 700°C, the residual weight for the PVDF/PP (70:30) composite was approximately 20%, compared to 15% for PVDF/PP (60:40) composite.
This increased stability can be attributed to the higher proportion of PVDF in the 70:30 composite, which inherently possesses superior thermal properties. The addition of GR further enhanced the thermal stability of the samples, as evidenced by the shift in the maximum DTG peaks to higher temperatures (from 440°C to 480°C). This shift became more pronounced with increasing amounts of GR and PVDF. The improvement in peak temperatures was particularly significant in the PVDF/PP (70:30) sample, owing to its naturally higher thermal stability. In summary, incorporating GR significantly improves the thermal stability of the composites, with GR particles acting as barriers that delay the degradation process of the PVDF/PP polymer matrix. This enhancement is attributed to the ability of carbon-based fillers to insulate the polymer matrix from heat and impede the migration of degradation gases, thereby creating a more tortuous pathway for the gases to escape, as described in literature. 42
Figure 2(a) shows that (PVDF/PP)/(60 wt.% G2) composite with a PVDF/PP ratio of 70:30 exhibited a residual weight of 72%. In contrast, at the same GR content of 60 wt.%, both the (PVDF/PP)/(60 wt.% G2) and hybrid (PVDF/PP)/(60 wt.% G2/G3 80:20)) composites, with a PVDF/PP ratio of 60:40, showed a residual weight of 70%. The slight decrease in residual weight from 72% to 70% in the hybrid sample suggests that the inclusion of larger G3 particles, when mixed with G2 particles, may create additional pathways for heat transfer within the composite. This enhanced heat dissipation during the TGA test could result in a lower residual weight percentage due to the faster decomposition of the polymer matrix.
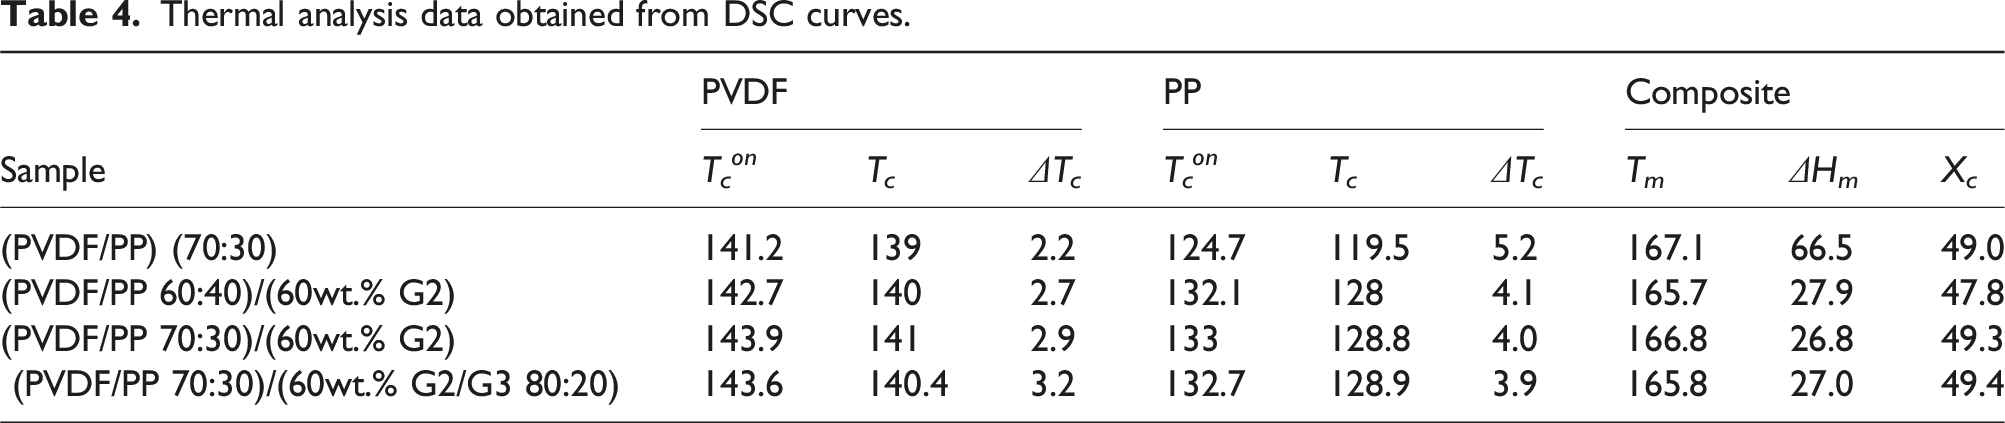
DSC characterization
Figure 3 presents the DSC curves measured at cooling and heating rates of 10°C/min, with the corresponding data summarized in Table 4. The heating (Figure 3(a)) and cooling (Figure 3(b)) thermograms illustrate the melting and crystallization behaviors of the blends. Although the composites consist of two semicrystalline polymers, all composite samples exhibit a single melting peak, suggesting that the melting transitions of PVDF and PP overlap. This overlap is likely due to their relatively close melting temperatures (PVDF: 168°C, PP: 165°C). A slight reduction in Tm (1 °C–2 °C) is observed with the addition of GR, which can be attributed to the formation of smaller or less perfect crystals. This reduction results from restricted polymer chain mobility and strong polymer-filler interactions, which hinder the growth of well-ordered crystalline regions, leading to crystals that melt at lower temperatures.
43
Despite the decrease in Tm, the degree of crystallinity (X
c
) increases slightly from 49.0% to 49.4% with the addition of GR. This slight increase is attributed to the nucleating effect of GR particles, which promote polymer chain alignment and enhance crystallization.
44
The PVDF/PP (70:30) composite exhibits a slightly higher X
c
(49.3%) due to its higher PVDF content, as PVDF crystallizes more readily than PP. In contrast, the PVDF/PP (60:40) blend shows a lower X
c
(47.8%), indicating that an increased PP content reduces overall crystallinity under high GR loading. (a) DSC melting curves and (b) DSC crystallization curves of various composite samples. Thermal analysis data obtained from DSC curves.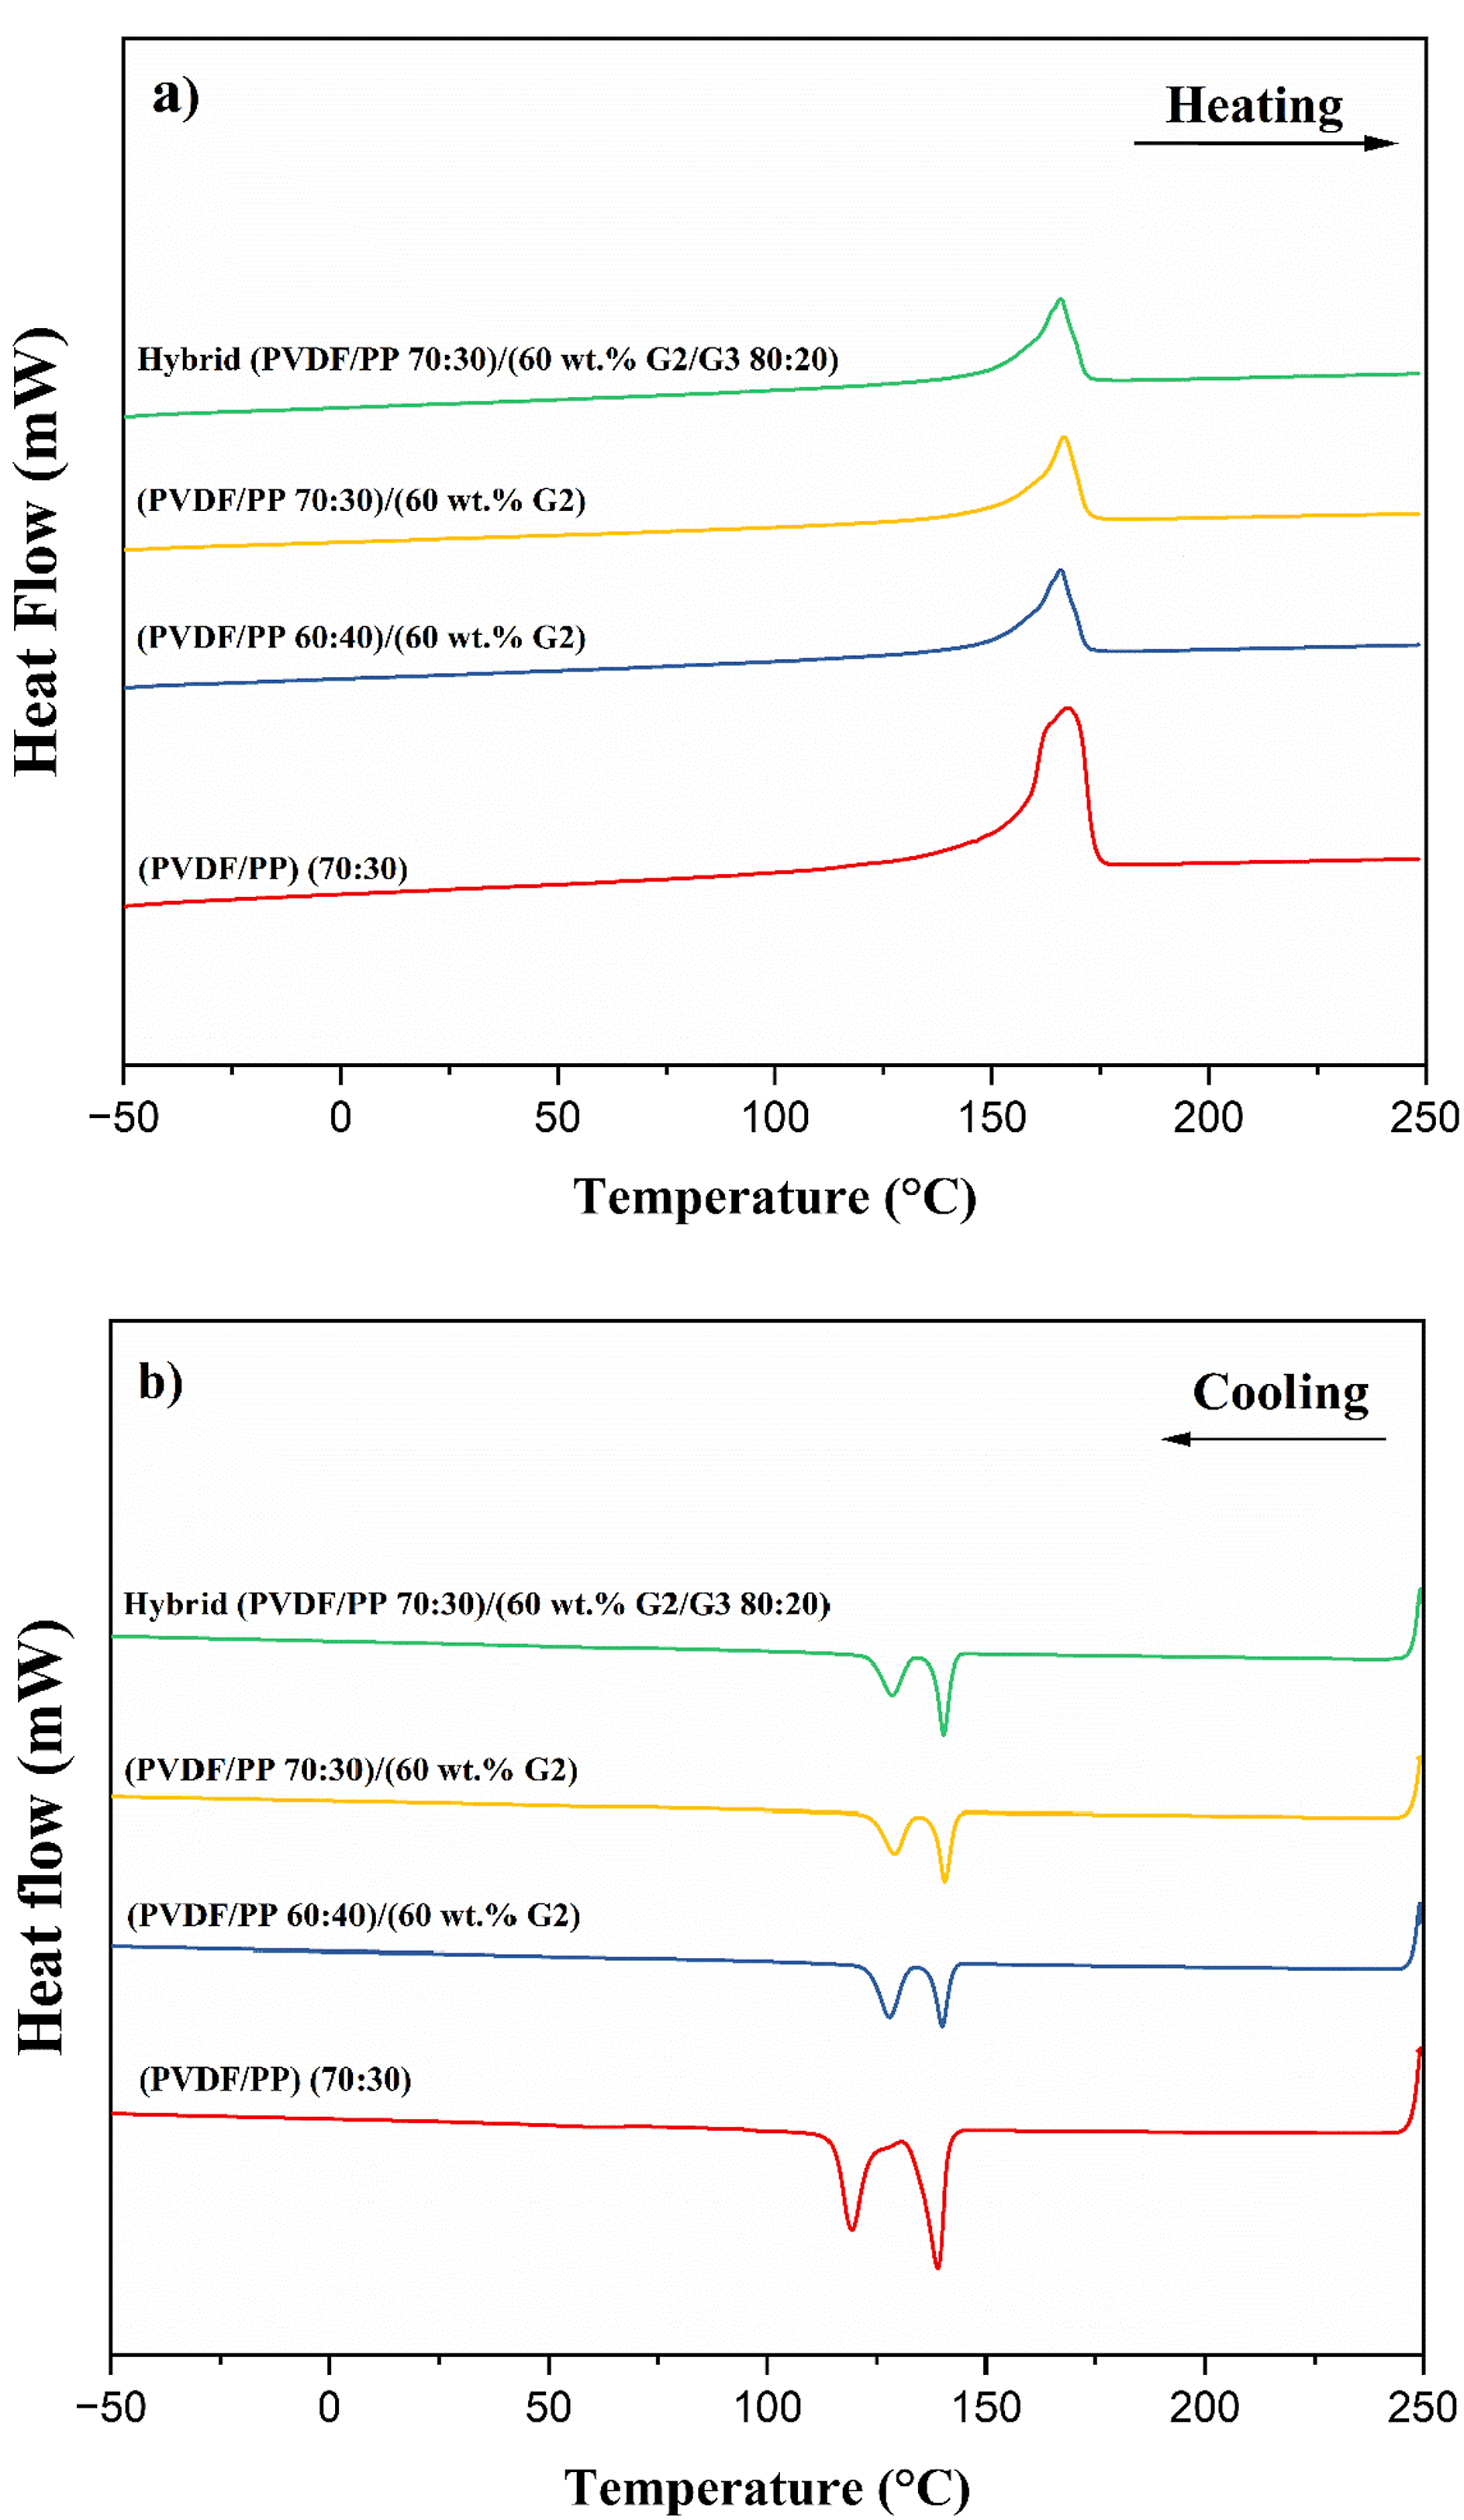
In contrast to the single melting peak, the cooling thermograms reveal two distinct crystallization peaks for all samples, corresponding to the independent crystallization of PVDF and PP. The higher-temperature crystallization peak is associated with PVDF, while the lower-temperature peak corresponds to PP, confirming phase separation during crystallization. As observed, the incorporation of GR shifts the crystallization onset temperature (T c on ) to higher values, indicating its role as an effective nucleating agent. 44 Notably, the PVDF/PP (70:30) composite exhibits a more significant shift in T c on (143.9°C for PVDF and 133.0°C for PP) compared to the PVDF/PP (60:40) composite (142.7°C and 132.1°C, respectively), suggesting that a higher PVDF content enhances the nucleation effect of GR. The hybrid sample (PVDF/PP 70:30)/(60wt.% G2/G3 80:20) shows the highest T c on values at 143.6°C (PVDF) and 132.7°C (PP), emphasizing the synergistic nucleation effect of combining G2 and G3. Interestingly, the temperature difference between the crystallization onset and peak (ΔT c ) exhibits opposite trends for the two polymer phases. For the PVDF phase, ΔT c increases from 2.2°C to 3.2°C with the addition of GR, indicating a more gradual crystallization process. This suggests that while GR provides nucleation sites, it may also hinder PVDF crystal growth, possibly due to restricted chain mobility or interfacial interactions. 45 Conversely, for the PP phase, ΔT c decreases from 5.2°C to 3.9°C with GR incorporation, implying a faster and more uniform crystallization process. The decrease in ΔT c for PP suggests that GR acts as a more effective nucleating agent for PP, facilitating rapid crystallization once nucleation occurs. 45 The hybrid G2/G3 composite further supports this observation, exhibiting the narrowest ΔT c for PP, which underscores the synergistic nucleation effect of combining different GR grades.
Through-plane electrical resistivity
Figure 4 presents the through-plane resistivity results for PVDF/PP (60:40) composites filled with different types of GR (G1, G2, and G3) at concentrations ranging from 20 to 60 wt.%. The data reveals a decreasing resistivity trend with increasing GR content and particle size. Notably, in samples containing 50 wt.% GR, resistivity dropped from 20.0 to 11.4 Ω.cm as the GR particle size increased from 5.9 µm (G1) to 561 µm (G3). This reduction is attributed to the larger particle size, which decreases the number of conductive particles, thereby lowering contact resistance and through-plane resistivity, ultimately enhancing conductivity.23,46 Moreover, the through-plane resistivity values for 60 wt.% GR highlights the significant influence of GR particle size on the electrical conductivity of the composites. At this filler loading, the medium-sized GR particles (G2) exhibit the lowest resistivity (3.4 Ω.cm) compared to G1 and G3. Medium-sized particles (G2) provide the optimal balance between dispersion and connectivity, forming the most efficient conductive network. While larger G3 particles offer good connectivity, their dispersion may be less uniform, slightly increasing resistivity. Conversely, the small G1 particles tend to agglomerate, resulting in less effective conductive pathways and the highest resistivity. These findings underscore the critical role of particle size in optimizing the electrical properties of the composites. Through-plane resistivity of (PVDF/PP 60:40)/GR as a function of GR weight concentration: effect of GR particle size (G1, G2, and G3).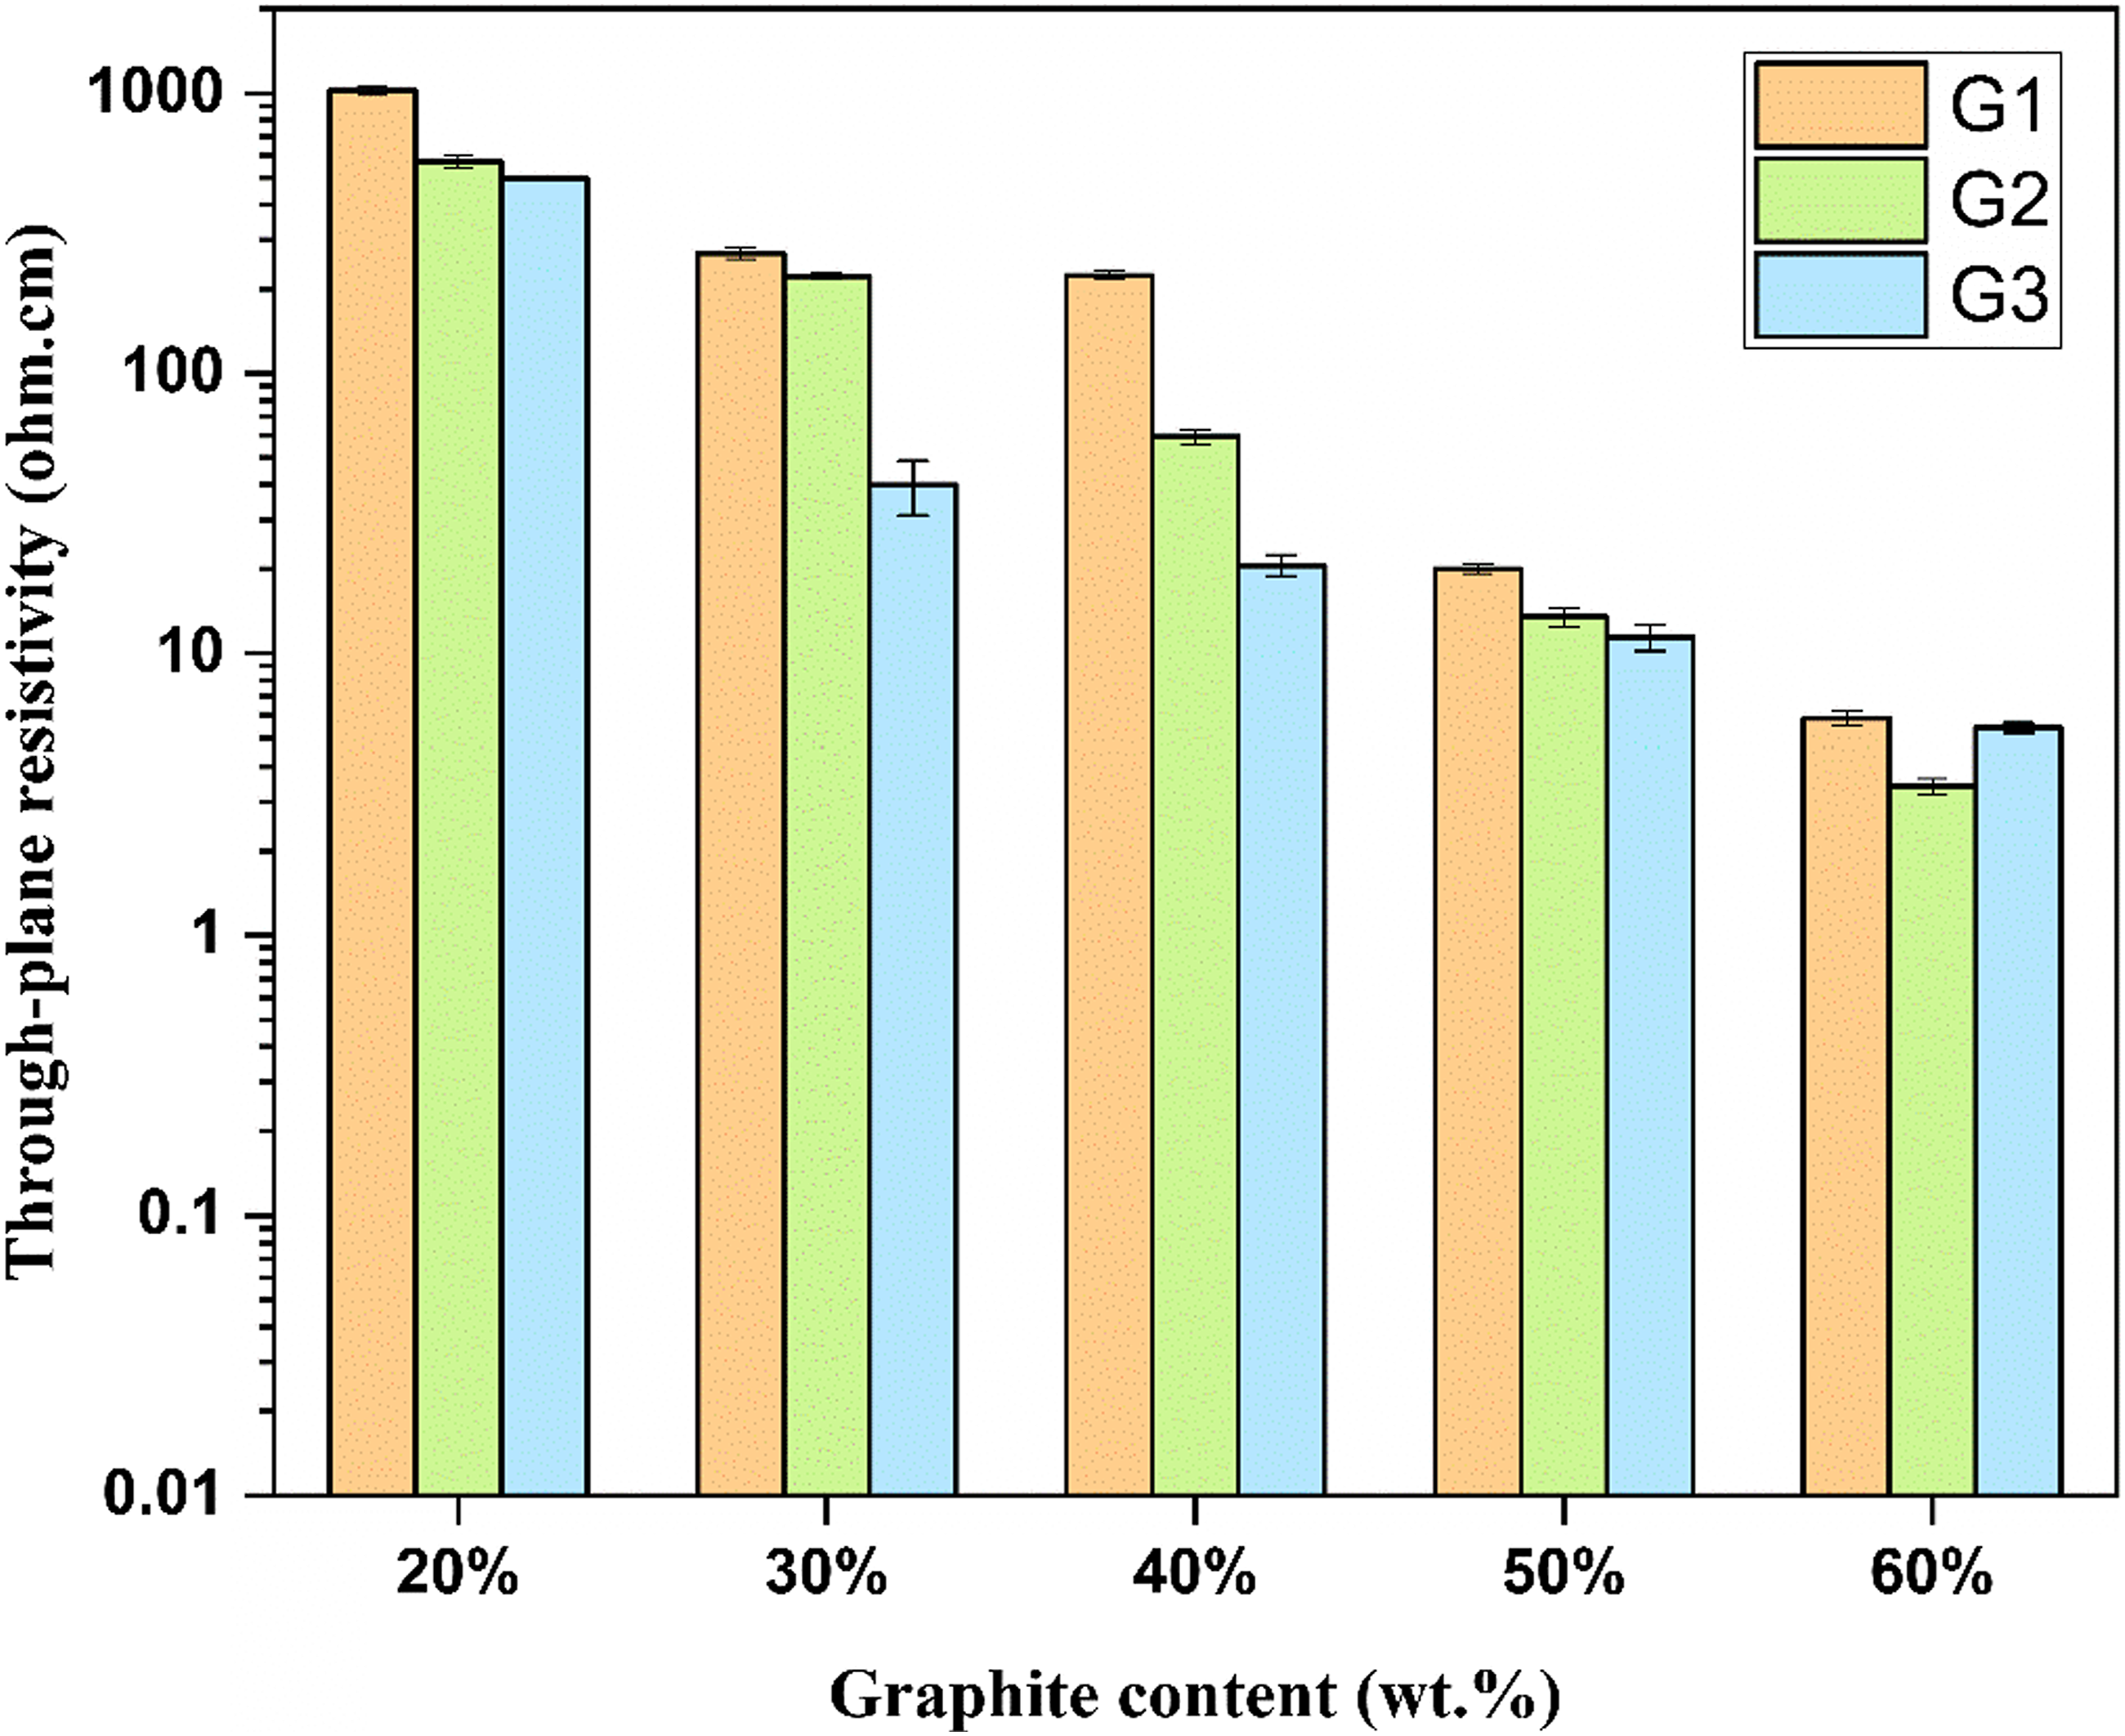
To evaluate the effect of varying the PVDF/PP ratio on composite resistivity, PVDF/PP (70:30) composites containing 50 and 60 wt.% of GR types (G1, G2, and G3) were characterized to examine how different levels of co-continuity influence resistivity. The corresponding results are presented in Figure 5. For the composites with 50 wt.% GR, the largest particle size, G3, exhibited its lowest resistivity at 7.9 Ω.cm. This reduction in resistivity is attributed to G3’s larger particles, which promote more efficient electron transport pathways within the polymer matrix, thus reducing resistance. Through-plane resistivity of (PVDF/PP 70:30)/GR composites as a function of GR weight content: effect of GR particle size (G1, G2, and G3).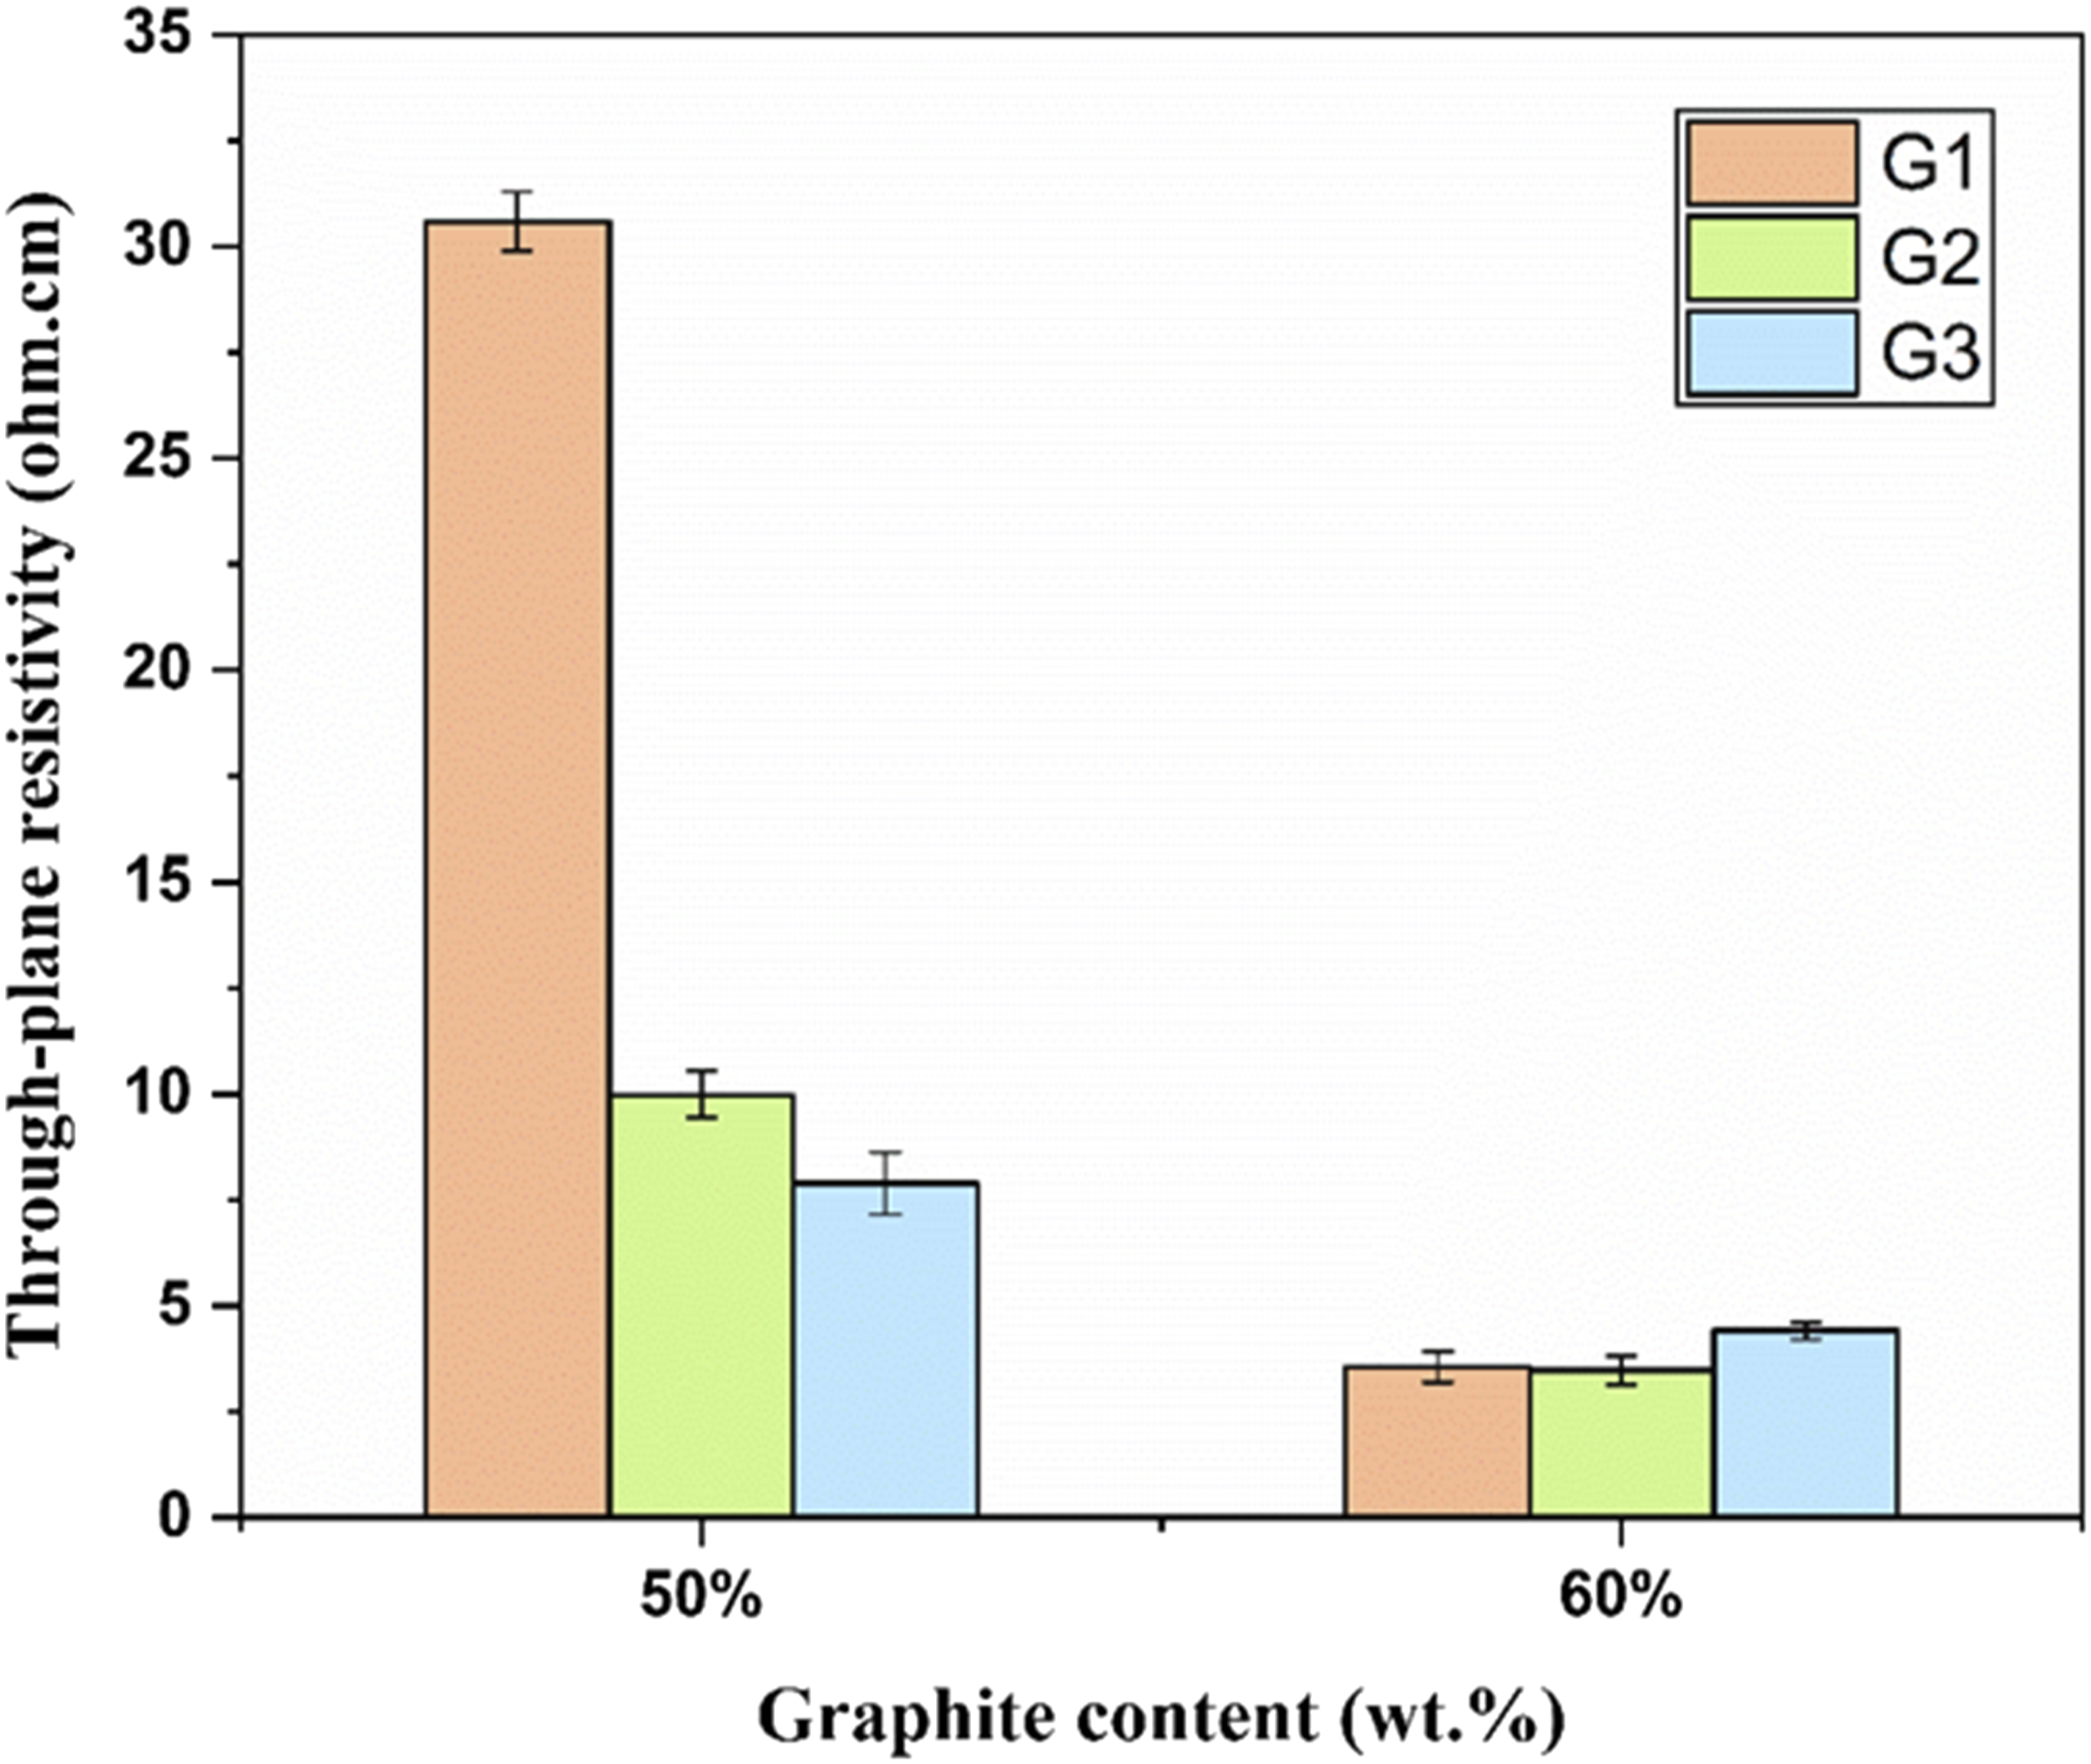
At 60 wt.% GR, however, the medium-sized particles, G2, achieved resistivity of 3.5 Ω.cm, compared to 3.6 Ω.cm for G1 and 4.4 Ω.cm for G3. The better performance of G2 is due to its smaller size GR relative to G3, leading to better dispersion and reduced agglomeration within the matrix. Additionally, G2’s larger size compared to G1 results in fewer conductive particles and reduced contact resistance, thereby enhancing overall conductivity.
While PVDF/PP (60:40) composites filled with 60 wt.% G2 exhibited lower resistivity, as shown in Figure 4, a more significant reduction in resistivity was observed in PVDF/PP (70:30) composites with the same GR content. This enhanced reduction is attributed to the improved co-continuity in the PVDF/PP (70:30) matrix, which facilitates a more efficient percolation network. Specifically, increasing the PVDF phase ratio from 60 wt.% to 70 wt.% results in a thinner PP phase, thereby increasing the density and efficiency of the conductive pathway. Consequently, PVDF/PP (70:30) was chosen as the matrix for further investigation of hybrid GR composites.
Figure 6 presents the resistivity results for PVDF/PP (70:30) composites using hybrid GR/GR fillers of different particle sizes and concentrations. The data show that composites primarily composed of medium-sized G2 particles, with the addition of either smaller G1 or larger G3 particles, exhibited more reduced resistivity among all samples. Notably, the combination of medium and small GR particles (G2/G1) at a 90:10 ratio resulted in a densely packed composite structure, where the medium-sized particles formed a strong framework while the smaller particles effectively filled voids. However, increasing the proportion of small GR particles to an 80:20 G2/G1 ratio led to a higher resistivity to 2.64 Ω.cm, likely due to agglomeration. In contrast, the G2/G3 composite at 80:20 ratio achieved the lowest resistivity, at 1.17 Ω.cm, making it the most electrically conductive sample in this study. Through-plane resistivity of hybrid (PVDF/PP 70:30)/(60 wt.% GR/GR) composites, as a function of GR/GR ratio (*(PVDF/PP 60:40)/(60 wt.% G2/G3 80:20) is presented for comparison).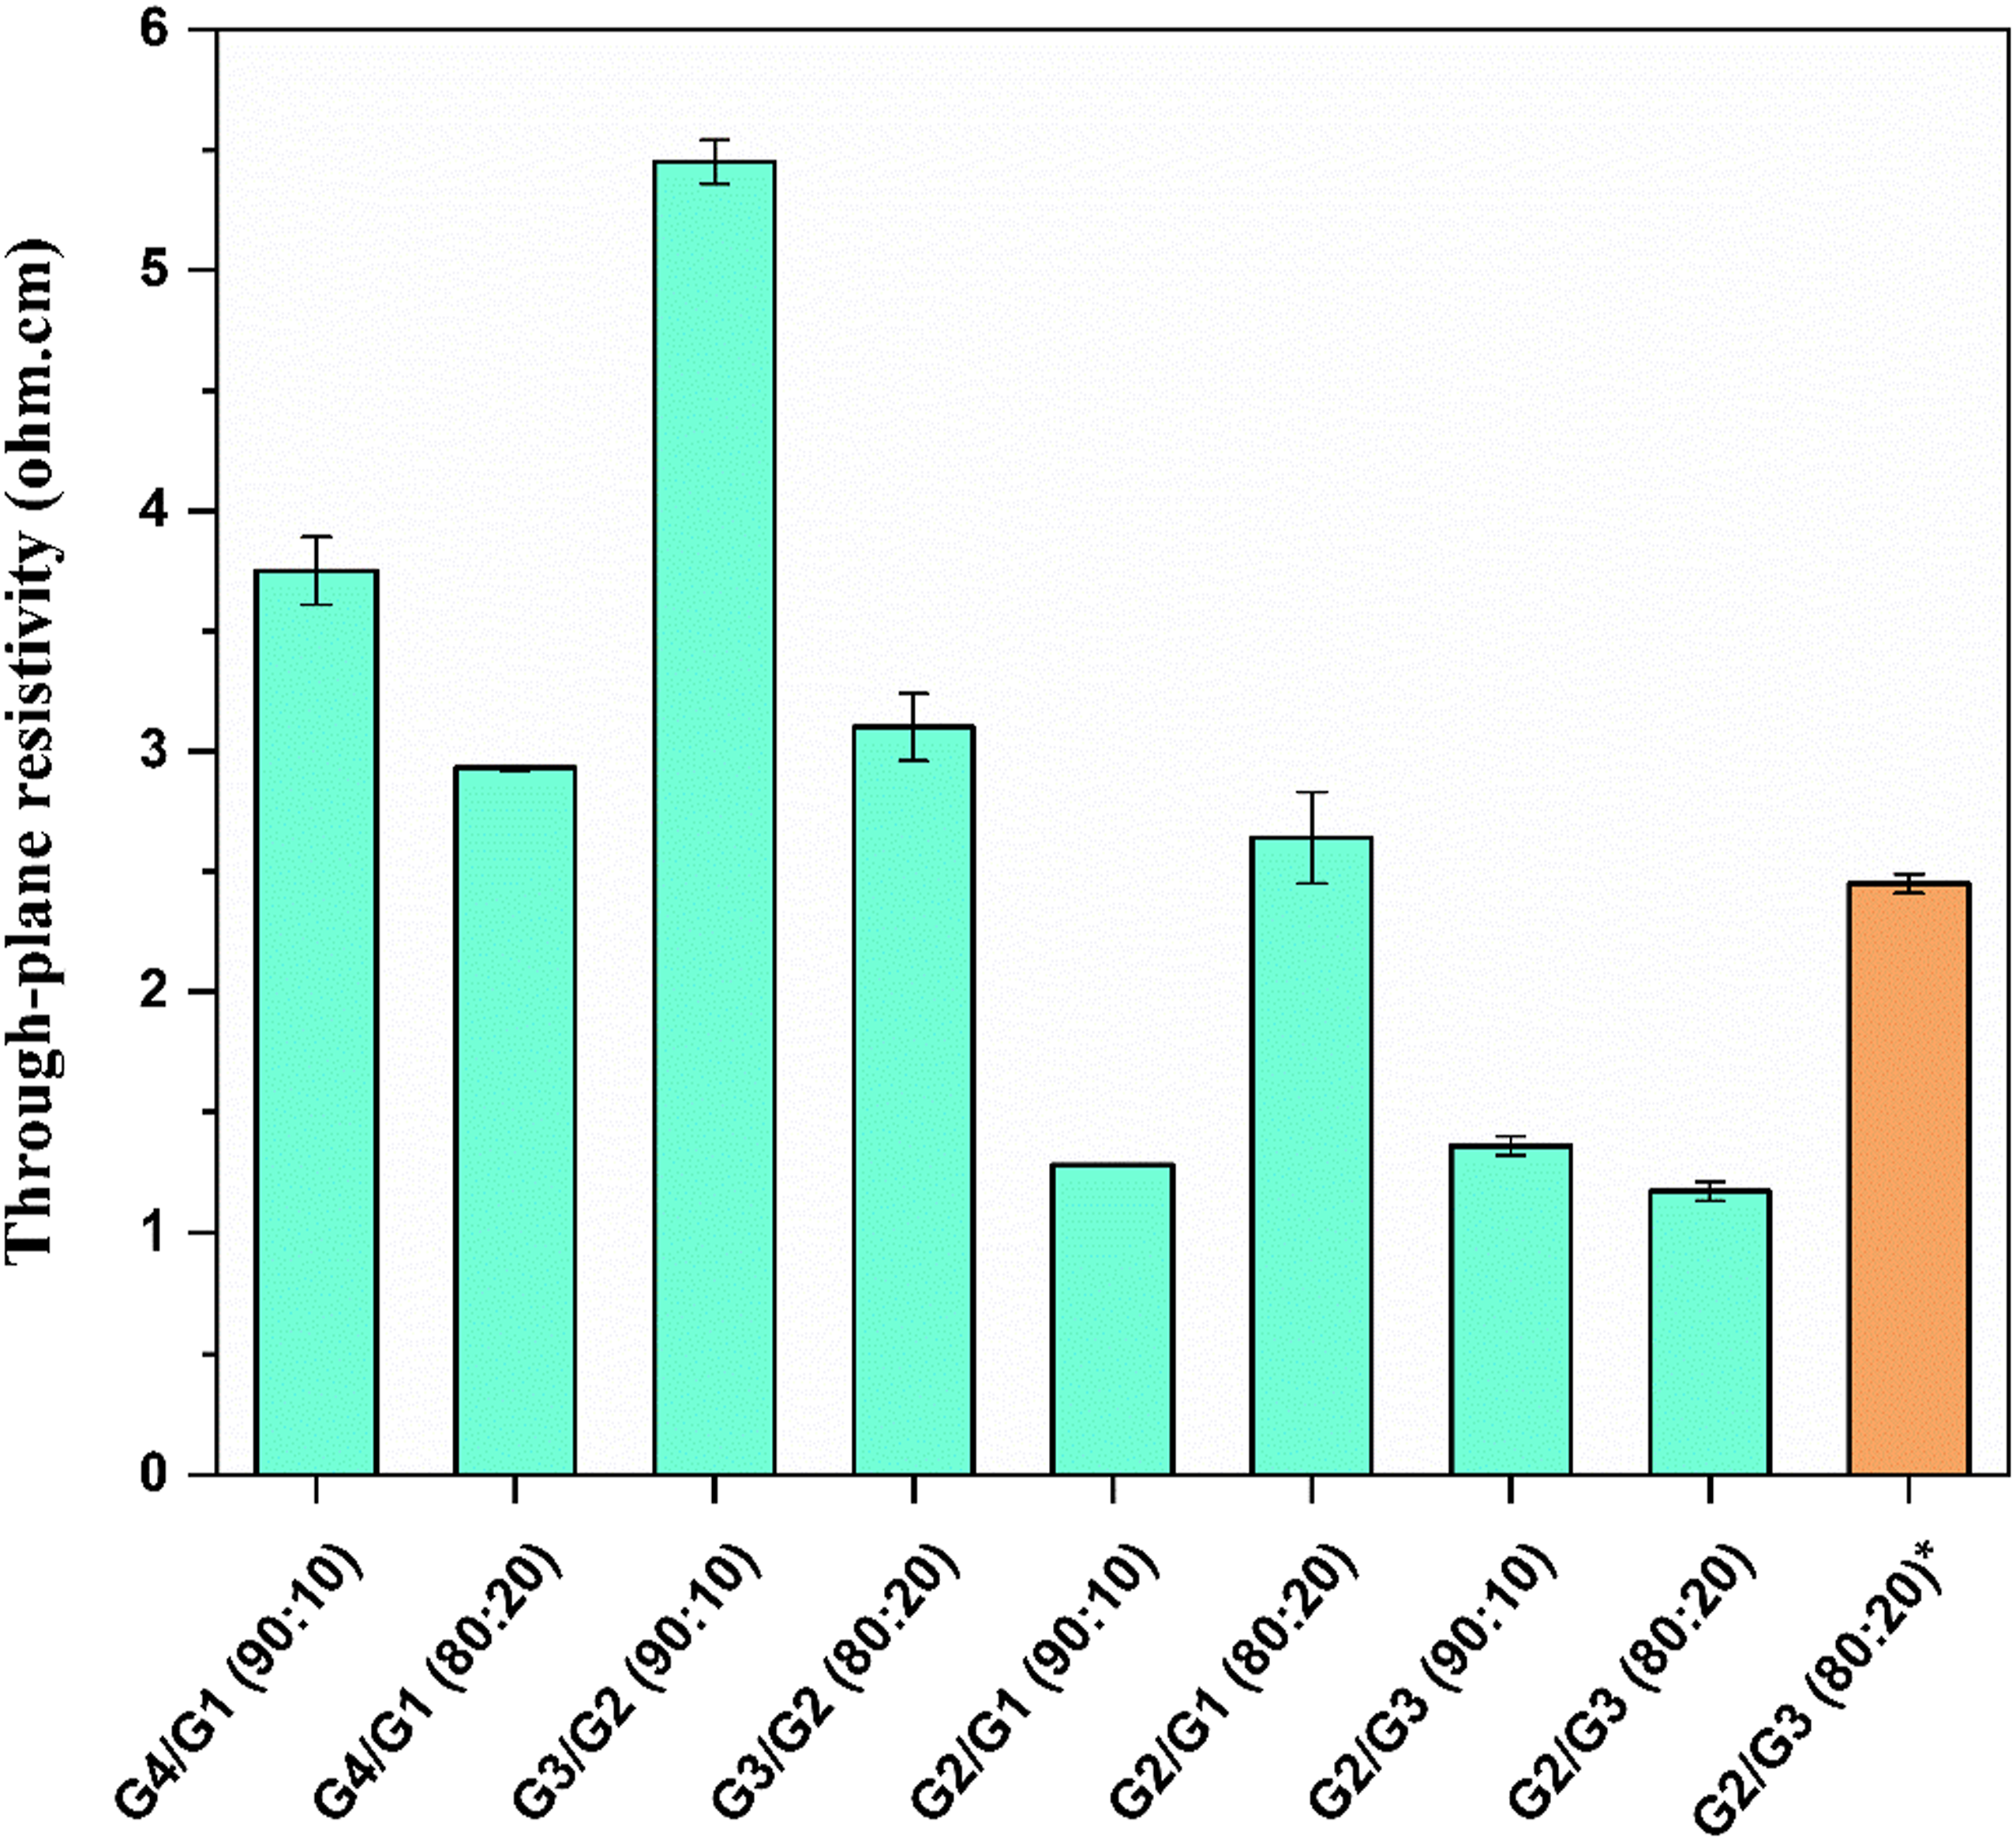
The combination of medium and large particles in the composite can create a more interconnected and efficient percolation network. Larger particles help bridge gaps between medium-sized particles, enhancing the connectivity of conductive pathways. Additionally, the presence of larger particles can mitigate the agglomeration of medium-sized particles, promoting a more uniform and dispersed filler distribution within the matrix, thereby reducing overall resistivity. Thus, strategically combining a majority of medium-sized G2 with smaller proportions of either large-sized G3 or small-sized G1 can harness synergistic effects, maximizing the benefits of each particle size to achieve optimal conductivity.
Conversely, when a higher concentration of larger G3 particles is combined with a smaller amount of G2, higher resistivities are observed. For example, the G3/G2 (80:20) composite exhibited a resistivity of 3.10 Ω.cm, likely due to G3’s higher tendency to agglomerate, which disrupts the efficiency of the percolation network. Similarly, hybrid G4/G1 fillers in 90:10 and 80:20 proportions resulted in even higher resistivities of 3.75 Ω.cm and 2.93 Ω.cm, respectively. These outcomes suggest potential incompatibilities or mismatches between the particle sizes of G4 and G1 or G2 and G3, which may lead to suboptimal packing and hinder the formation of an efficient conductive network. Additionally, non-optimal particle size combinations can cause agglomeration or segregation, further negatively impacting resistivity.
Finally, the optimal GR particle combination, G2/G3 (80:20), was selected for use in a composite with PVDF/PP ratio of 60:40 for comparison. Since the co-continuity of PVDF/PP (70:30) is superior to that of PVDF/PP (60:40), the PVDF/PP (70:30) composite containing 60 wt.% of the G2/G3 (80:20) hybrid filler demonstrated a 52% reduction in resistivity compared to the PVDF/PP (60:40) composite with the same GR content. This result underscores the critical of matrix co-continuity in enhancing the electrical properties of the composites.
Mechanical properties
Flexural characterization
Figures 7(a) and 7(b) present the flexural modulus and flexural strength results, respectively, for neat and GR-filled PVDF/PP composites with varying GR concentrations and particle sizes. The neat PVDF/PP (70:30) composite showed a 17% higher modulus and an 8% higher strength compared to the pure PVDF/PP composite with a 60:40 ratio. This improvement is attributed to better phase compatibility and stronger interfacial adhesion between the PVDF and PP phases in the 70:30 composition, leading to more effective load transfer. Additionally, incorporating 20 wt.% GR fillers into the PVDF/PP (60:40) composite increased the modulus from 0.90 to 1.38 GPa, enhancing the stiffness, although the strength decreased from 16 MPa to 14 MPa, likely due to stress concentrations around the filler particles.
47
Increasing the G2 concentration from 20 to 60 wt.% further enhanced the modulus to 2.90 GPa, while reducing the strength to 11.21 MPa. This effect is primarily due to the reinforcing properties of G2, which significantly improve the modulus, but the decrease in strength is likely a result of filler agglomeration and weakened interfacial bonding between G2 and the polymer matrix, compromising the composite’s structural integrity.
48
Flexural modulus (a) and flexural strength (b) of (PVDF/PP)/GR composites as a function of hybrid GR/GR fillers concentration and GR particle size.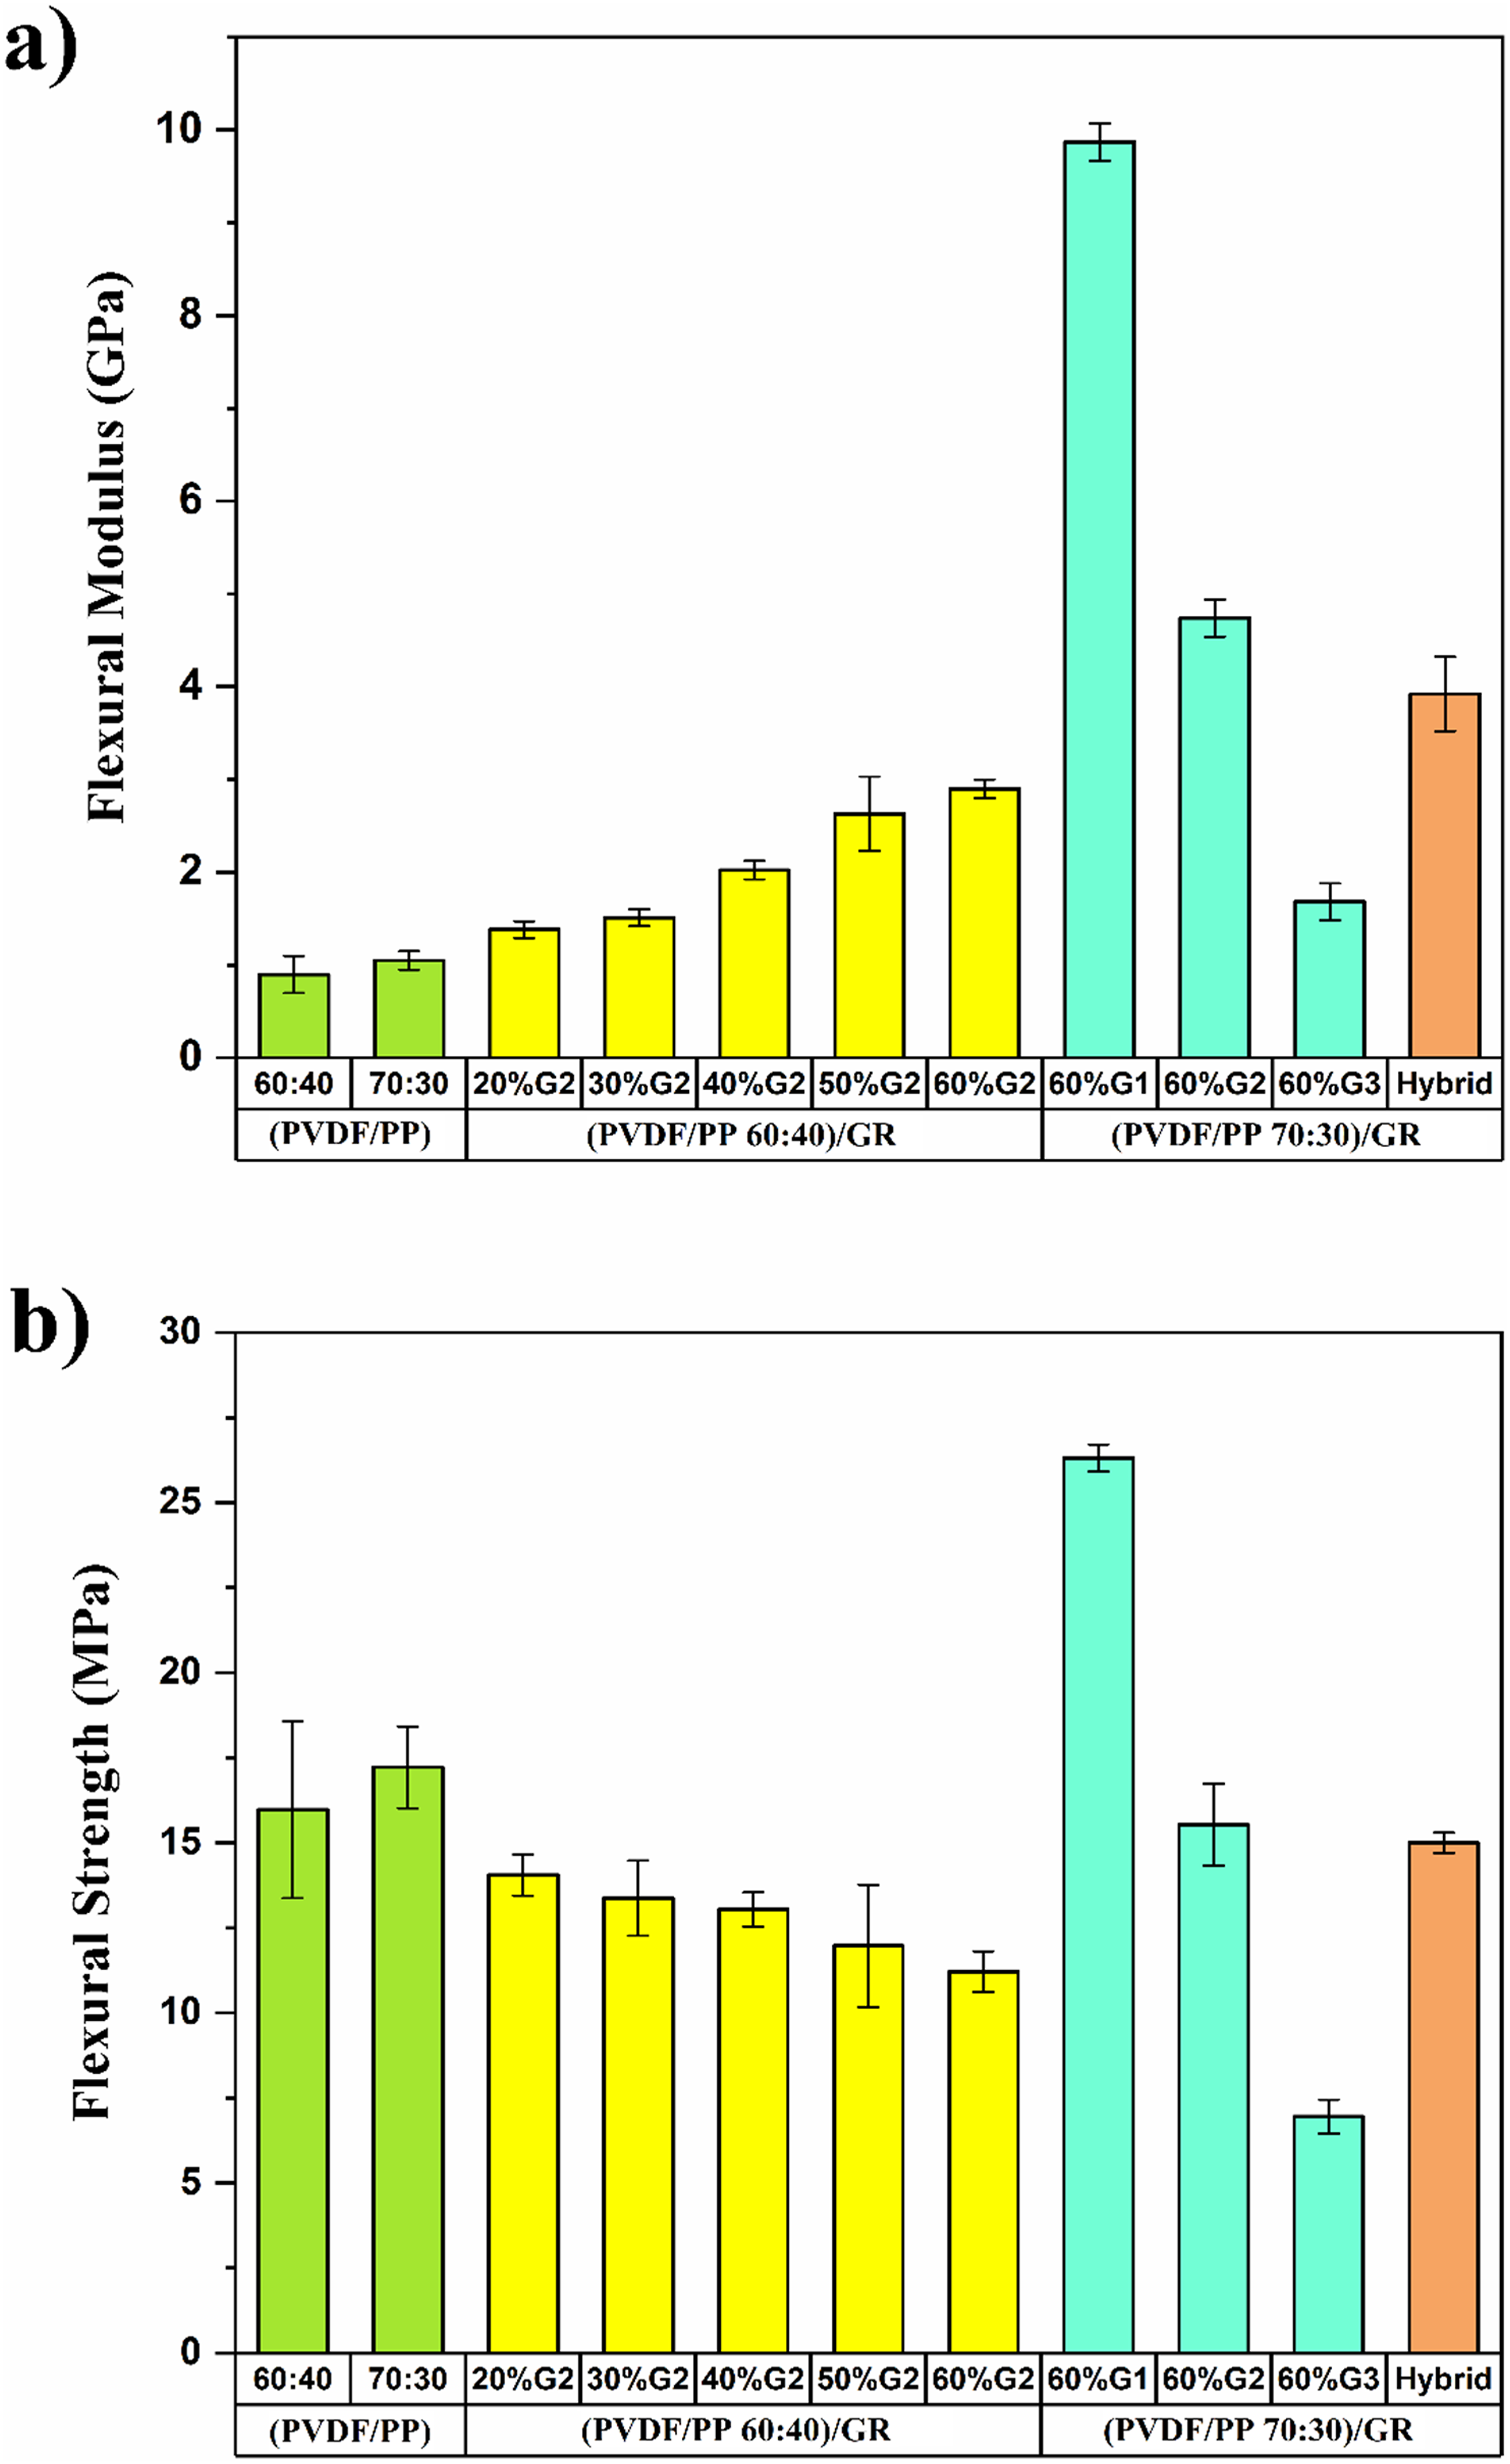
In the PVDF/PP (70:30) composites containing 60 wt.% GR with varying particle sizes, the smallest G1 filler demonstrated the highest modulus (9.87 GPa) and strength (26.31 MPa) compared to the medium-sized G2 and larger G3 fillers. This enhanced performance of G1 is attributed to its higher surface area-to-volume ratio, which promotes stronger interactions between G1 particles and the polymer matrix. The increased surface area improves interfacial bonding, leading to better mechanical properties of the composite. In contrast, for the hybrid filler sample PVDF/PP (70:30) with 60 wt.% of G2/G3 (80:20), the modulus and strength were lower, measured at 3.92 GPa and 15 MPa, respectively.
Compression characterization
The compressive properties, compressive elastic modulus and compressive strength, shown in Figures 8(b) and 8(c) were derived from the stress-strain curves of the samples. Since all samples exhibited similar stress-strain behavior, only a selection of representative curves is shown in Figure 8(a) to ensure clarity in curve evolution. The compressive strength is identified by the maximum stress value on the stress-strain curves, representing the maximum load the material can withstand under compression before failure. As shown in Figure 8(a), (PVDF/PP 70:30)/(60 wt.% G1) composite exhibits the highest compressive strength, approximately 15 MPa. In contrast, the (PVDF/PP 60:40)/(60 wt.% G2) composite shows the lowest compressive strength, about 7 MPa, suggesting that increasing the PP content leads to a more flexible structure under compression. The compressive elastic modulus is determined from the slope of the initial linear portion of the stress-strain curves, where the material undergoes elastic deformation. A steeper slope in this range signifies a stiffer material, indicating greater resistance to deformation under compressive forces. The highest modulus is observed for the (PVDF/PP 70:30)/(60 wt.% G1) sample, reflecting its enhanced stiffness and structural integrity. Figures 8(b) and 8(c) present the compressive elastic modulus and compressive strength, respectively, for neat and GR-filled PVDF/PP systems at various GR concentrations and particle sizes. The pure PVDF/PP composites with a 70:30 ratio exhibit a 5% higher compressive elastic modulus and a 15% higher compressive strength compared to those with 60:40 ratio. This improvement is attributed to the enhanced co-continuity in the 70:30 composites, which promotes more efficient load transfer and a more uniform stress distribution, thereby increasing both modulus and strength. Compressive stress-strain curves (a) compressive elastic modulus (b) and compressive strength (c) of (PVDF/PP)/GR composites as a function of hybrid GR/GR concentration and GR particle size.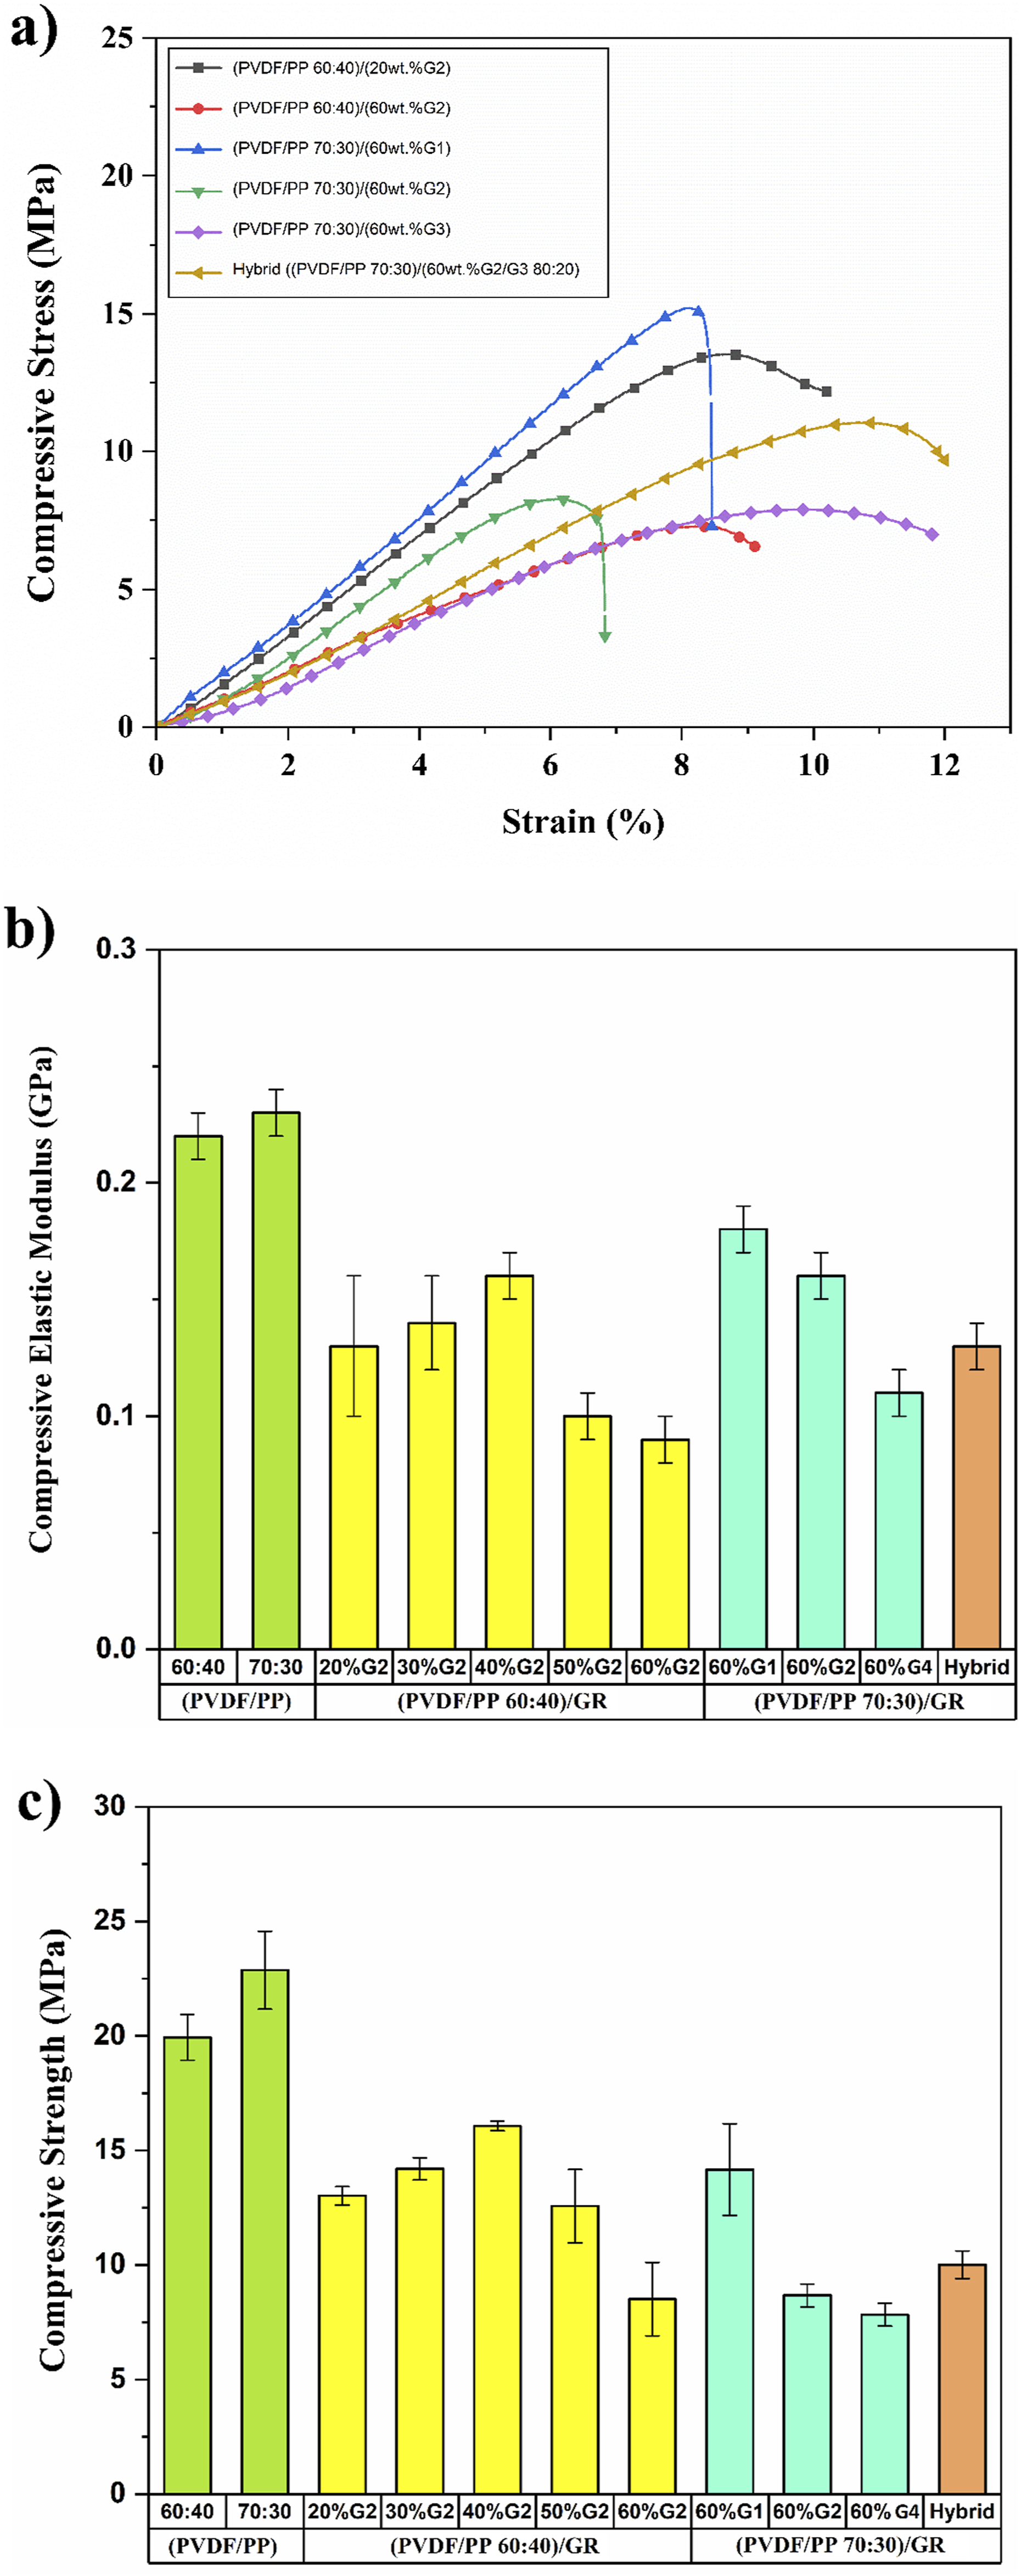
In the PVDF/PP (60:40) composites, increasing the G2 content from 20 to 40 wt.% resulted in a 23% improvement in both compressive strength and elastic modulus. However, a further increase to 60 wt.% of G2 caused a significant decline, with compressive strength and elastic modulus decreasing by 47% and 44%, respectively. This trend is attributed to optimal polymer-filler interactions at 40 wt.% G2, where sufficient interfacial bonding enhances mechanical performance. Beyond this concentration, excessive G2 content likely disrupts the matrix, weakening interfacial bonding and reducing adhesion, thereby diminishing the compressive properties.
As shown in Figures 8(b) and 8(c), PVDF/PP (70:30) composites with a constant 60 wt.% GR content, increasing the particle size from 5.1 μm (G1) to 561 μm (G3) resulted in a 39% decrease in elastic modulus and a 45% decrease in compressive strength. The larger GR particles likely introduced more defects in the composite structure due to incomplete wetting or particle agglomeration. In contrast, smaller GR particles, with their larger surface area, promoted stronger interfacial bonding between the GR particles and polymer matrix, improving overall structural integrity. Additionally, incorporating a hybrid mix of G2/G3 (80:20) fillers at 60wt.% increased compressive strength from 8.51 MPa with 60 wt.% G2 to 10.01 MPa with the same concentration of the G2/G3 (80:20) hybrid mix.
Conclusion
Conductive (PVDF/PP)/GR composites with PVDF/PP ratios of 70:30 and 60:40, incorporating various GR particle sizes, were successfully developed using internal mixer melt blending and compression molding. The PVDF/PP (70:30) composites exhibited superior co-continuity, significantly enhancing thermal stability, electrical conductivity, and mechanical properties compared to the PVDF/PP (60:40) composites. Among the tested GR sizes, medium-sized GR particles (G2) provided the best balance of dispersion and connectivity, achieving the through-plane resistivity of 3.41 Ω.cm. Furthermore, a hybrid GR/GR filler system combining GR (G2) and larger GR particles (G3) in an 80:20 ratio demonstrated a synergistic effect, further reducing resistivity to 1.17 Ω·cm and optimizing electrical performance. Thermal analysis revealed a significant improvement in the composites’ thermal stability, with residual weight increasing from approximately 15% to 70% upon the addition of 60 wt.% of GR. Also, the DSC analysis showed that increasing PVDF content in PVDF/PP composition leads to higher crystallinity, melting temperature, and crystallization temperatures. The addition of GR enhances nucleation, raising crystallization onset temperatures and overall crystallinity. Mechanical testing showed that smaller GR particles (G1) yielded the highest flexural modulus (9.87 GPa) and strength (26.31 MPa), attributed to their larger surface area and improved interfacial bonding with the polymer matrix. However, the addition of GR generally reduced compressive strength, highlighting the need for optimized filler-matrix interactions in applications where mechanical integrity is critical. Based on these findings, the hybrid composite (PVDF/PP 70:30)/(60 wt.% G2/G3 80:20) emerged as the most promising composition, offering the lowest electrical resistivity and high thermal stability. These properties make it particularly suitable for polymer-based bipolar plates in Proton Exchange Membrane Fuel Cells (PEMFC). Finally, future research should explore advanced conductive fillers, such as carbon nanotubes or graphene, to enhance conductivity while maintaining or improving mechanical properties. Investigating filler surface modifications, particle geometry, and hybrid combinations, alongside advanced processing techniques, could further optimize the electrical and mechanical performances of these composites for high-performance applications, including fuel cell bipolar plates and electronic devices.
Footnotes
Declaration of conflicting interests
The author(s) declared no potential conflicts of interest with respect to the research, authorship, and/or publication of this article.
Funding
The author(s) disclosed receipt of the following financial support for the research, authorship, and/or publication of this article: The authors are grateful to the Natural Sciences and Engineering Research Council of Canada (NSERC) (ALLRP 566716-21) and PRIMA Quebec (R22-13-003), as well as the Research Center for High-Performance Polymer and Composite Systems (CREPEC) for their financial support of this work.
Data Availability Statement
The data supporting the findings of this study are available from the corresponding author upon reasonable request.