
Abstract
This study investigates stress waves application for non-destructive inspection and structural health monitoring in large laminated composite panels. This study investigates Lamb wave dispersion under two boundary conditions: fixed support and simply support. Lamb wave propagation is examined under two conditions: one with a 100 kHz excitation frequency to simulate internal defects, and the other with a 30N impulse load to simulate external events. Both scenarios include cases with and without cutouts. Experimental and numerical analyses are conducted to examine stress wave propagation characteristics in these panels. The experimental phase focuses on discerning propagation time differences attributable to cutouts, while the three-dimensional (3-D) numerical model analyses propagation time, path, and frequencies. Results reveal a significant time discrepancy between panels with and without cutouts, indicating that cutouts introduce delays in wave propagation due to disruptions in the propagation path. Comparative analysis affirms the reliability and accuracy of the numerical approach, aligning with outcomes from the experimental approach. This research contributes insights into stress wave behaviour, demonstrating its potential for effective non-destructive inspection and structural health monitoring in laminated composites across diverse structural applications.
Keywords
Introduction
Laminated composite materials have gained widespread use in various industries due to their exceptional characteristics, such as lightweight, durability, resistance to fatigue and corrosion, high stiffness, and an impressive strength-to-weight ratio. Carbon fibre, a prominent composite material, exemplifies this by weighting only about 25% as much as steel while offering significantly greater strength. These properties make laminated composites an ideal choice for applications in aerospace, marine, automotive manufacturing, and sports equipment. Notably, the Airbus A350 XWB (eXtra Wide Body) showcases the extensive use of composites, with over half of its structure composed of these materials, highlighting their critical role in advancing engineering standards. 1
Despite their numerous advantages, laminated composite structures pose challenges, especially concerning barely visible impact damage (BVID). 2 Unlike visible damage that is easily detectable and manageable, low-velocity impact (LVI) damage in composites is often invisible or barely visible during typical visual inspections. 3 Defined as impacts where the velocity is typically below a threshold, generally considered to be around 1 to 10 m/s, LVI can cause significant damage through mechanisms including matrix cracking, indentation, delamination and fibre breakage, rather than always resulting in perforation or visible cutouts. 4 This broad spectrum of potential damage outcomes underscores the importance of accurately assessing and monitoring composite structures for hidden damage, as undetected defects caused by LVIs and fatigue can compromise structural integrity over time. 5
The laminated composite structures have been traditionally evaluated by non-destructive evaluation (NDE). 6 However, structural health monitoring (SHM) has become a contemporary method for ensuring their integrity.7,8 Stress wave propagation in laminated composites is a complex phenomenon influenced by material anisotropic, layered build-up, wave propagation direction, excitation frequency and interface conditions. 9 Analysing Acoustic Emission (AE) data derived from stress wave propagation can serve as a data-driven tool for proactive decision-making, providing insights into damage detection, localization, and assessment.
Guided waves, including Lamb waves, play a crucial role in SHM and non-destructive inspection of laminated composites. 10 Leveraging the long-range propagation ability of Lamb waves, efficient defect identification method can be devised, offering advantages over laborious point-to-point ultrasonic measurements. 11 Previous studies using commercial FEA packages such as; ANSYS and ABAQUS have accurately captured the wave-pulse widening effect caused by dispersion within short distances.12,13 Guided stress waves, especially Lamb waves, excel in in-situ monitoring of large areas, sensitivity to small damages, and inspection of inaccessible areas without service interruption. 13
There are two types of Lamb waves, symmetric Si and antisymmetric Ai modes, which are characterized by the uniform in-plane and out-of-plane displacement behaviours or the particles, because of which theoretically both modes are capable of damage detection. 14 This study investigates the propagation of the A0 mode in large, laminated composite panels with and without cutouts, aiming to gain insights into stress wave behaviour. The numerical model is refined using experimental data. A controlled impulse hammer and accelerometer are employed for precise impact loads, deviating from the traditional Pencil Lead Break (PLB) test. The main objective is to understand stress wave propagation in composite structures subjected to LVI, including various damage mechanisms such as matrix cracking, indentation, delamination, and fibre breakage, under internal failure or external impact scenarios, such as bird strikes or drops.
The objective of this paper is to understand the complex stress wave propagation in the composite structures subjected to low-velocity impact, employing, and validating using experimental and numerical approach. Impulse hammer tests with accelerometer and Acoustic Emission sensors were conducted in a large (1 m × 1 m) simply supported CFRP laminate panel capturing acceleration, AE signals, and stress wave propagation. The detailed study of Lamb wave characteristics through numerical modelling of wave propagation excited by impulse load mimicking tool drop and high frequency excitation (100 kHz) mimicking fibre breakage and matrix cracking was performed in ANSYS/Explicit Dynamics. This study showcases a more realistic numerical modelling of Lamb wave that could significantly reduce the need for experimental testing and allow for rapid SHM solutions for composite structures used predominantly in defence and aerospace applications.
Fundamentals of lamb waves
Elastic waves are mechanical waves that propagate within a structure due to a perturbation 15 and possess the ability to excite particles at a distance from the source. These waves induce elastic deformation without causing a net displacement of the particles. The classification of elastic waves is based on their distinct characteristics, resulting in longitudinal waves, shear waves, Rayleigh waves, Lamb waves, Stonely waves and Love waves.
Lamb waves are specific to thin plate like structures, 16 emerge from the superposition of numerous longitudinal and shear waves as they traverse a structure. These waves undergo continuous reflections and mode conversions at the free boundaries. 14 This superposition gives rise to Lamb waves generating particle displacement in the thickness direction, with the wave motion extending radially outward from the excitation source. 17
Two Lamb modes, symmetric S
i
and antisymmetric A
i
, as shown in Figure 1, are characterized by the displacement behaviour of the particles.
15
The arrow shows displacement with respect to neutral plane. The velocity of Lamb wave propagation through a structure is dependent on the excitation frequency and the thickness of the medium,
18
as the energy within a wave packet propagates at different speeds. Types of Lamb waves (a) Symmetric Lamb wave which causes predominantly in-plane displacement and (b) Antisymmetric Lamb wave which causes predominantly out-of-plane displacement.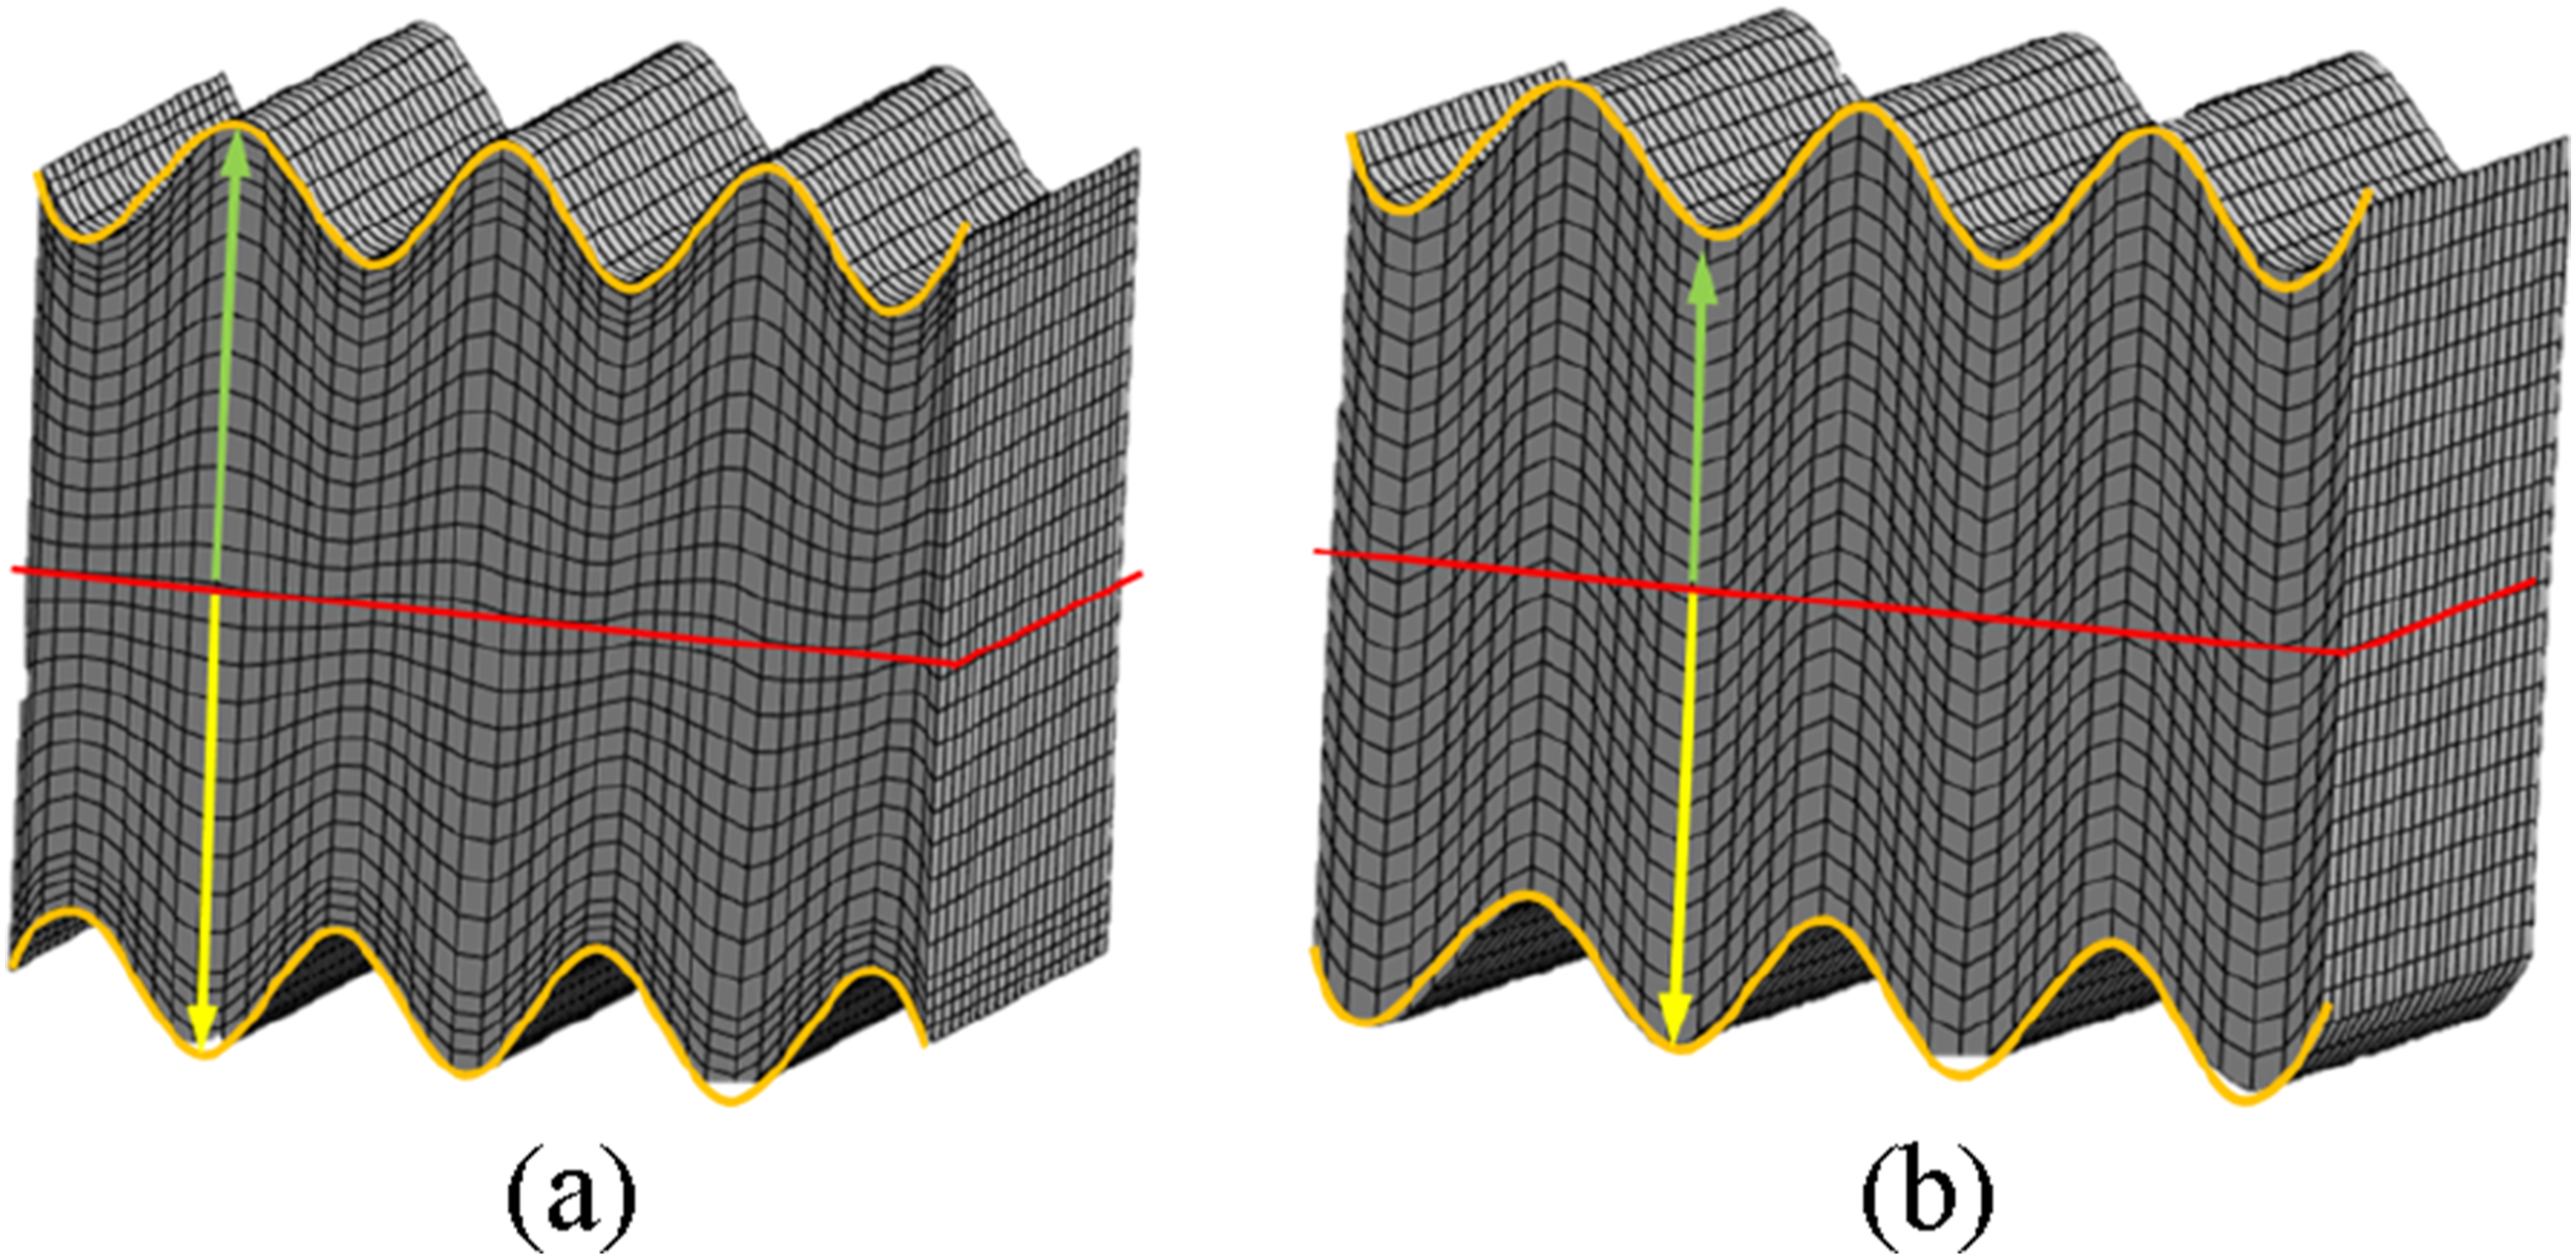
A wave packet refers to a localized disturbance that travels through a medium, formed by the combination of multiple wave frequencies and wavelengths. Analysis of wave packet aids in understanding the behaviour of Lamb waves and find application in non-destructive testing and SHM.
Symmetric and antisymmetric waves have infinite modes denotated by S0, S1, S2, … and A0, A1, A2, …, respectively, with S0 and A0 being the lowest-order fundamental modes. 18 Antisymmetric Lamb wave which is characterized by predominantly out-of-plane displacements are sensed using various tools such as piezoelectric sensors, optical method and Laser Doppler Vibrometry (LDV). Higher-order modes manifest at higher excitation frequencies, with each mode exhibiting distinct velocities and wavelengths, a consequence of the dispersive nature of Lamb waves.
Phase and group velocity
Elastic waves, fundamental to understanding Lamb wave behaviour, are characterized by various parameters essential for deriving their analytical solution. The propagation of Lamb waves is intricately described by phase velocity (c) and group velocity (c g ).
The Phase velocity of a wave describes the relationship between the spatial frequency (k) and the temporal frequency (ω), representing the propagation speed of the phase for a given frequency within a wave packet.
15
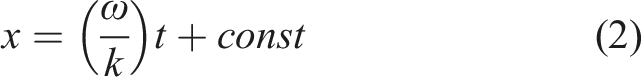
For the specific point on the wave, the spatial frequency (k) and the temporal frequency (ω) remains constant and is given by equation (1).

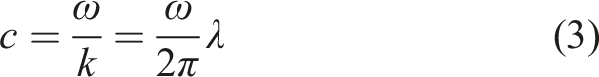
Group velocity (cg) is defined as the speed at which the overall wave packet propagates through a medium. The wave packet is a superposition of a carrier wave and a modulating wave. For a constant phase, the wave propagation can be expressed as
Dispersion of Lamb waves
The velocity of guided wave propagation through a structure depends on the excitation frequency and the thickness of the medium, a phenomenon known as dispersion. 19 This dispersion arise from the varying speeds at which energy within a wave packet travels, depending on the frequency. 20 As Lamb waves traverse a medium, they exhibit a spreading effect due to their dispersive nature.
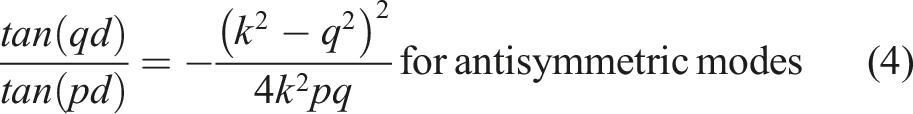
The Rayleigh-Lamb equation, also known as the dispersion equation,
15
characterizes the dispersive features of the Lamb waves. It is expressed as
CL and CS are essential for generating dispersion curves, solving wave equations, predicting mode conversions, characterizing material properties, and performing numerical simulations. 21
Using the Rayleigh-Lamb equations allows for the numerical solution of dispersion curves, which relate the group velocity or phase velocity of a Lamb mode to the excitation frequency and the thickness of the medium.
An illustration of the phase-velocity dispersion curve for both symmetric (S0) and antisymmetric (A0) modes of Lamb waves in a quasi-isotropic composite laminate with the stacking sequence [(0.90)Woven/45/-45]s is shown in Figure 2. The data points on these curves were generated using the LAMSS
22
Waveform Revealer, a specialized software developed by the University of South Carolina. To obtain these curves, the material properties of the composite laminate were inputted, which were determined through ANSYS ACP by specifying lamina material properties and stacking sequences. Phase-velocity dispersion curves (symmetric and antisymmetric modes) of the [(0.90)Woven/45/-45]s quasi-isotropic composite laminate.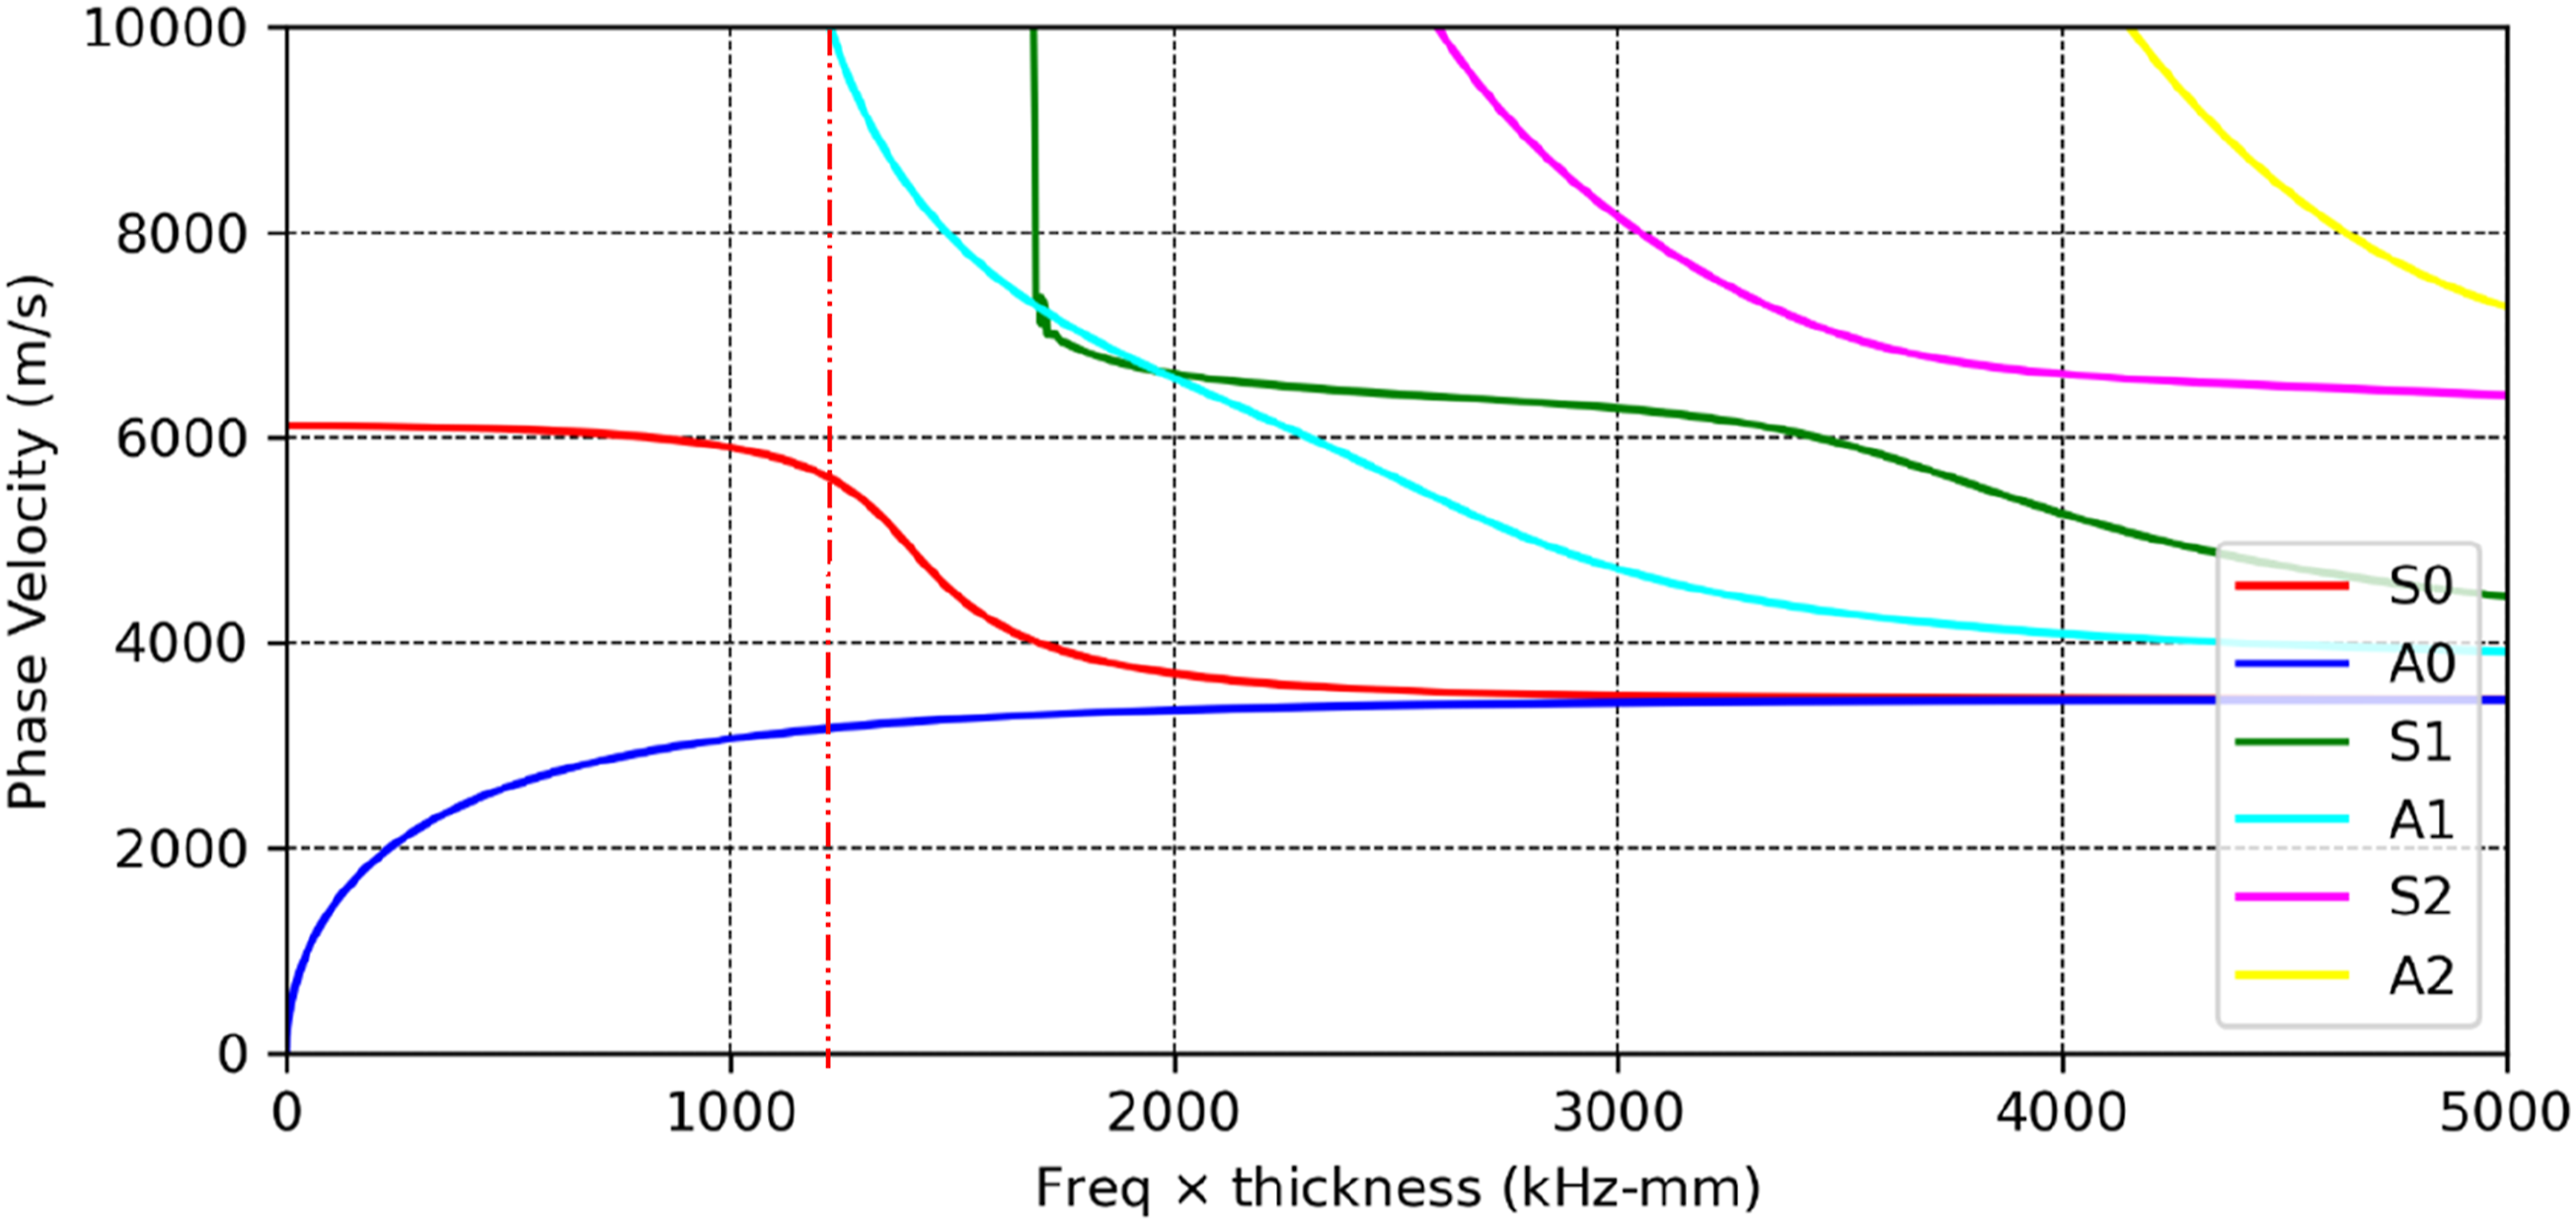
The A0 mode of Lamb waves exhibits a characteristic flexural mode, while the S0 mode demonstrates an extensional mode in the transverse direction to the direction of propagation. 23 Analysing Figure 2, it is evident that below a certain frequency (∼1250 kHz), only the fundamental (A0 & S0) antisymmetric and symmetric modes exist. The energy associated with excitation signals in the low-frequency region is insufficient to activate the higher-order Lamb modes. 18 This threshold frequency above which higher-order modes are excited is known as the cut-off frequency. This frequency, termed the cut-off frequency, is approximately 1250 kHz-mm (refer Figure 2), below which only the A0 and S0 modes are induced. The practice of exciting only fundamental Lamb modes aids in signal processing, simplifying the analysis by avoiding complications associated with multiple higher-order modes within a response signal. 24 The lower velocity of the A0 mode enhances its usability in pulse-echo NDE scenarios, making reflected signals more easily distinguishable due to increased time separation between sent and received signals. Therefore, A0 mode is often preferred in SHM applications, especially for composite structures, due to its sensitivity to delamination, simplicity, and dominant presence at lower frequencies.
Test procedure
Engineering material properties
For this study, a flat prefabricated large carbon fibre composite panel measuring 1000 mm by 1000 mm was sourced from Enhanced Composites. 25 The 8-ply laminate featured a layup sequence of [(0.90)Woven/45/-45]s, with the top and bottom plies being 2 by 2 twill woven prepreg. The fabrication of the composite laminates involved autoclaving prepregs containing TORAY-supplied carbon fibre (T300).
A schematic diagram of the [(0.90)Woven/45/-45]s quasi-isotropic composite laminate is illustrated in Figure 3 showing the orientation and arrangement of the individual layers within the laminate. Schematic diagram of [(0.90)Woven/45/-45]s composite laminate.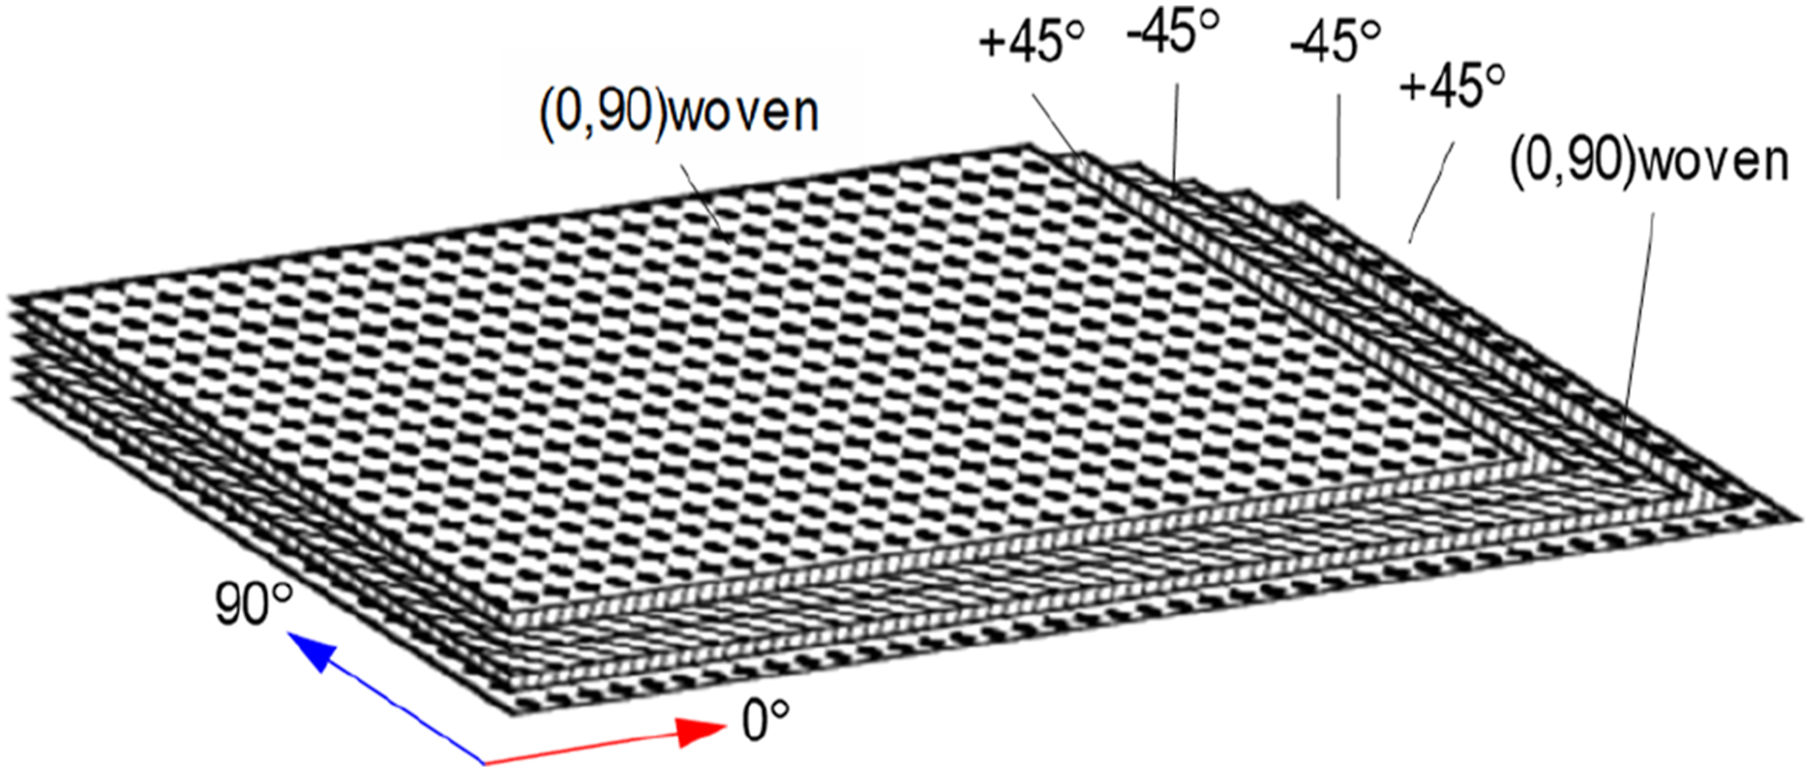
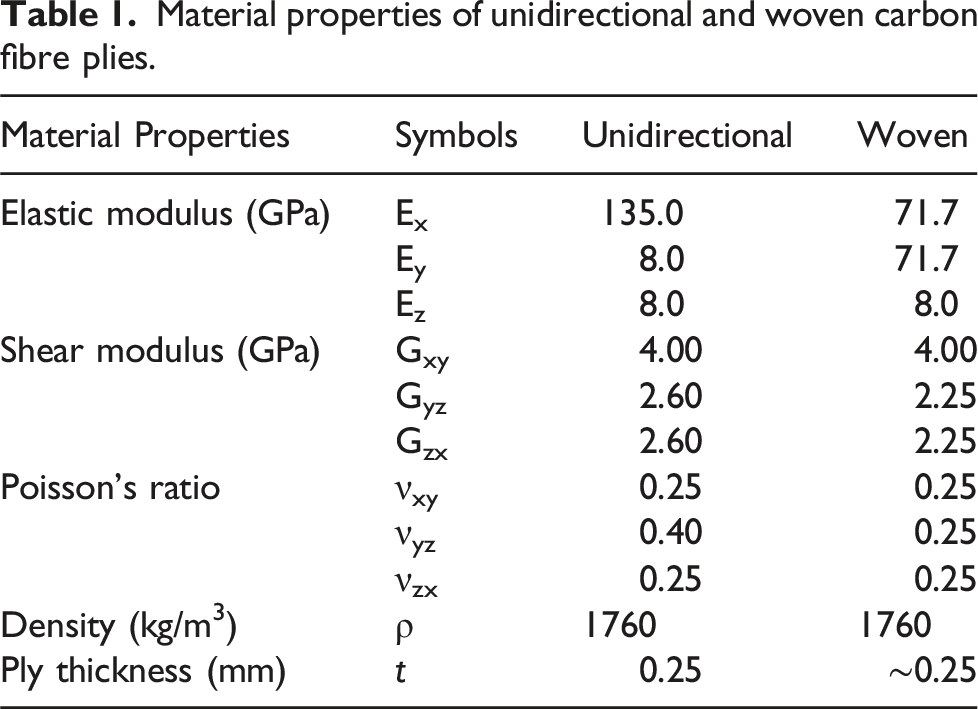
Material properties of unidirectional and woven carbon fibre plies.
Experimental setup
In hammer impact testing, an impact (impulse) hammer is employed to induce excitations in the structure under examination. This method involves applying an impulse force to the structure, creating a broadband range excitation that encompasses energy up to a specified frequency range. The versatility of the impulse hammer test lies in its efficiency-it is not only quick to set up but also straightforward to execute, making it a widely embraced approach in various applications across diverse fields. The schematic of experimental test setup, featuring the impulse hammer, sensors, accelerometer, wave propagation and data acquisition system is shown in Figure 4. Experimental setup with impulse hammer and accelerometer with DAQ.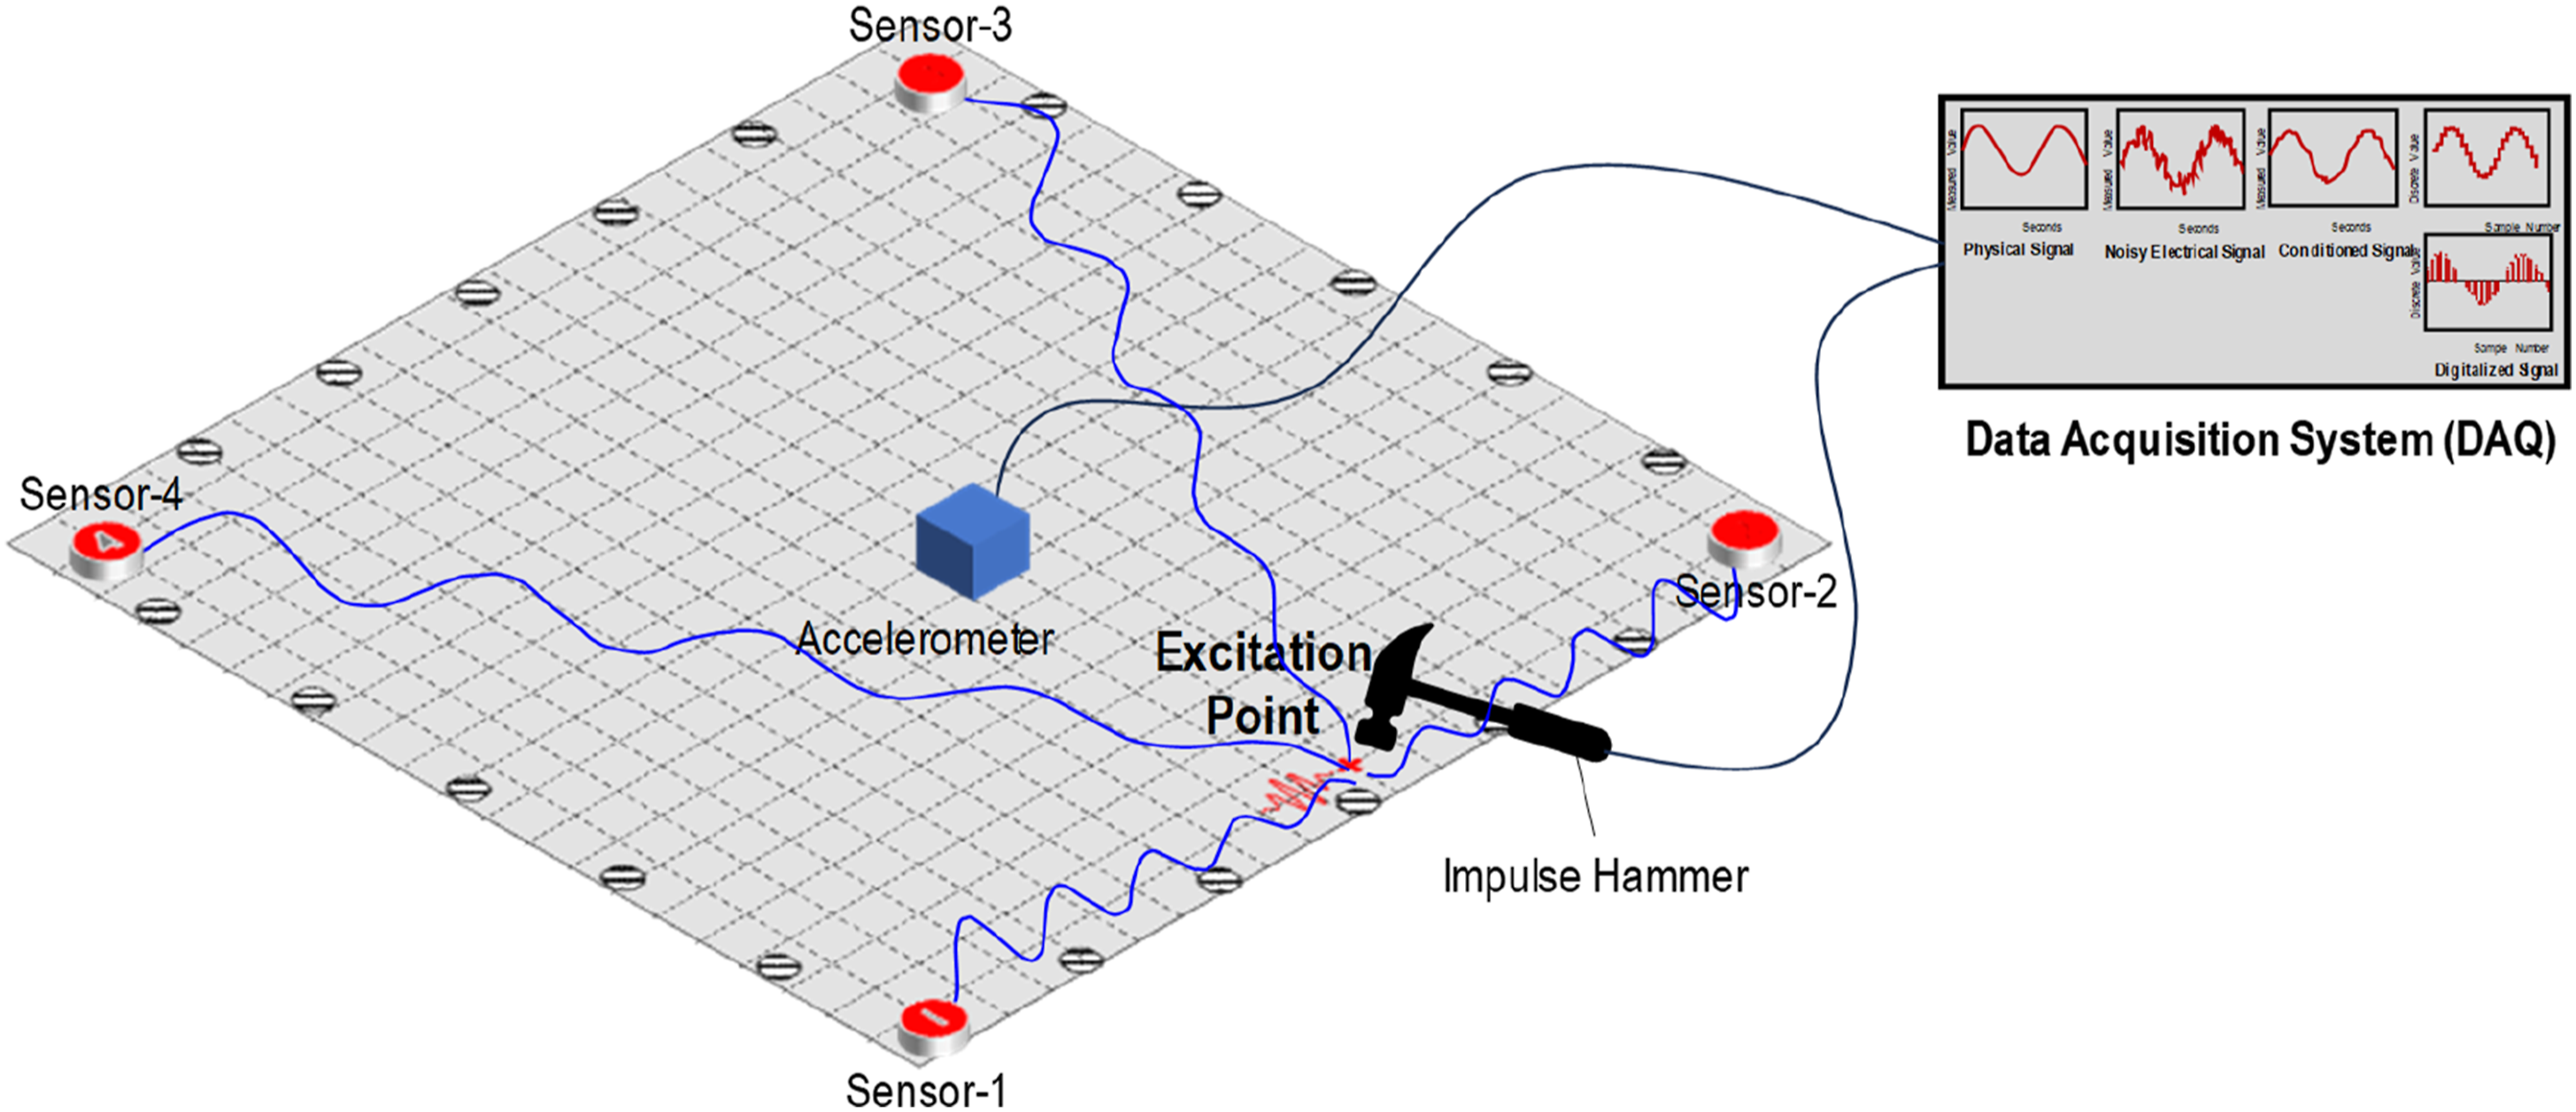
To emulate real-world engineering scenarios, impulse load was employed that simulates low-velocity impacts, such as hammer strikes, tool drops, or bird strikes on composite structures. The experiment was conducted using an impulse hammer (Dynapulse instrument Inc) and an accelerometer (KS97B10) on the test specimen. The data acquisition (DAQ) system employed was the imc CRONOSflex CRFX-2000 with imc Wave Structural Analyzer software, configured with a maximum sampling rate of 100 kHz. For precise measurements, the Dytran DytranpulseTM 5800, with a resonance frequency of 75 kHz and sensitivity of 2.2 mV/N, was utilized in conjunction with the DAQ imc Wave featuring an 8-channel high-performance universal measurement amplifier.
The experimental setup, illustrated in Figure 5(a), offers a comprehensive overview of the procedure, highlighting key components such as the impulse hammer, sensors, the accelerometer and the DAQ. Correspondingly, Figure 5(b) details the distribution of test points across the grid, with marked sensor locations represented by × symbols. Additionally, a ∅100 mm cutout (elaborated upon later) is visible at coordinates (500, 275). Experiment details (a)Experimental setup showing laminate composite panel, AE system and DAQ used in the study and (b) test point and location of sensors and ∅100 mm cutout (only for cutout experiments).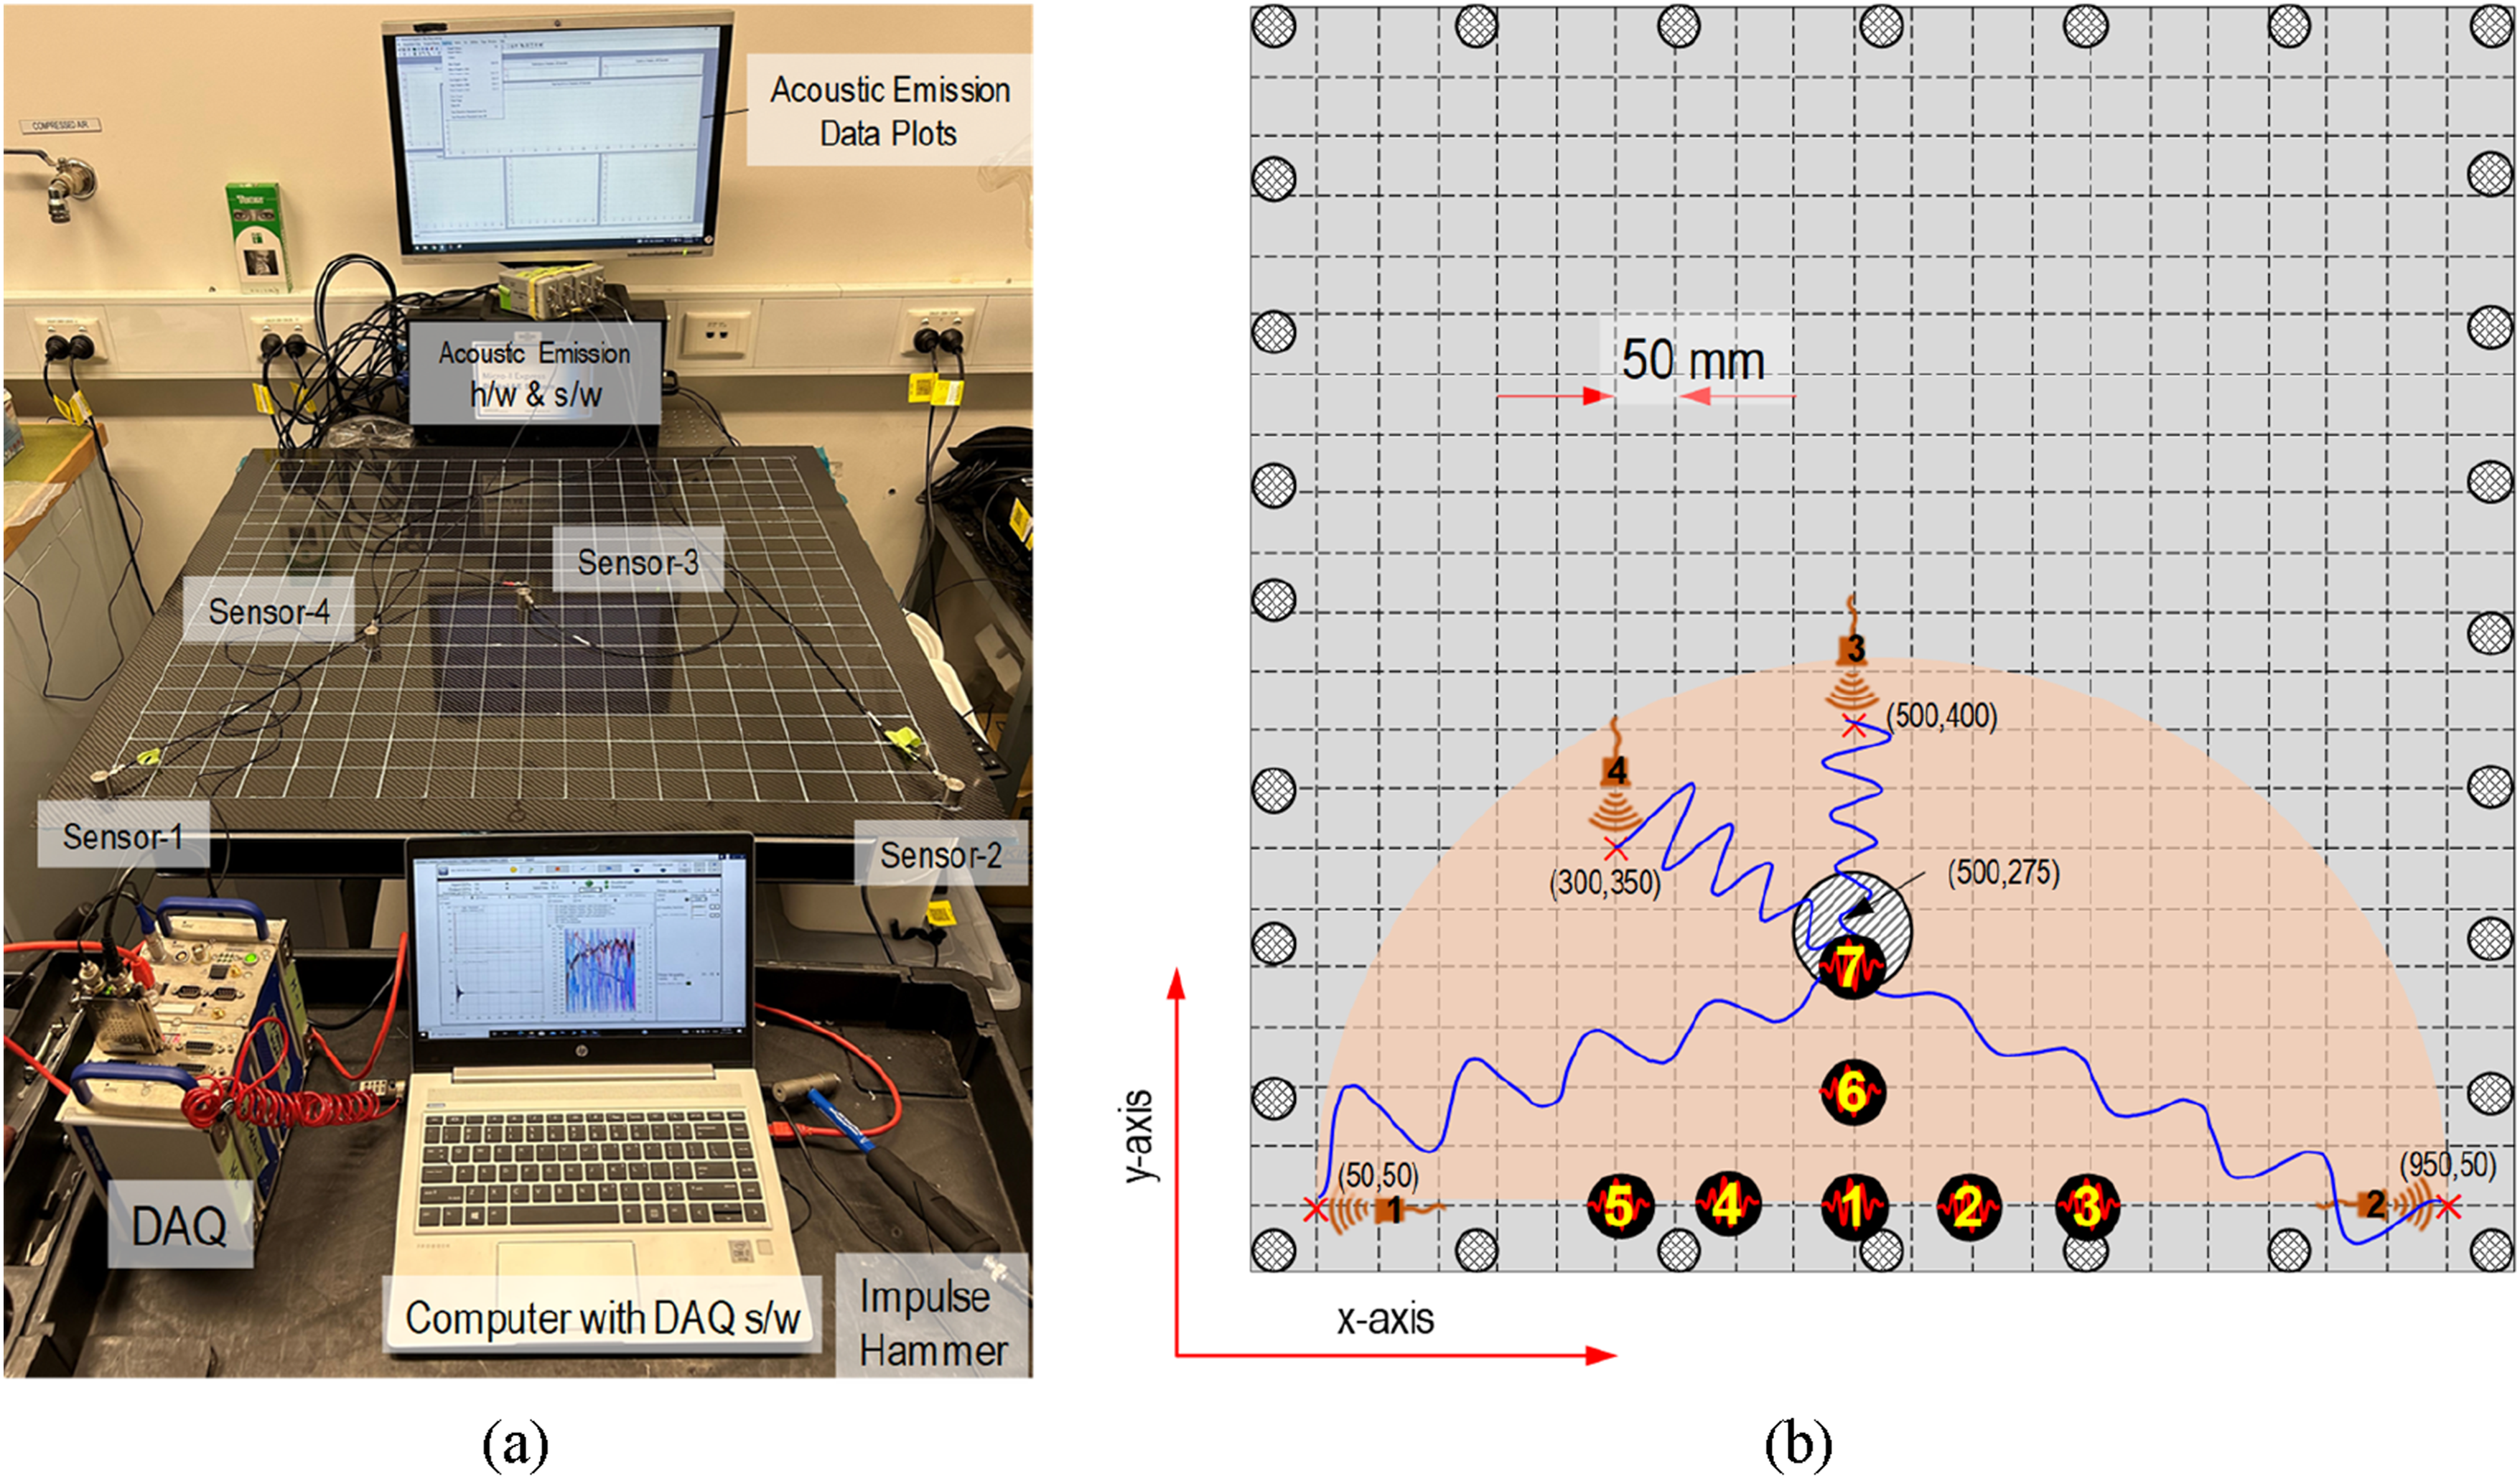
Selection of the impulse load and excitation frequency
To stimulate the structure under test, an impulse hammer was chosen to excite the structure under test due to its ability to contain energy within a specific frequency range.
The results of the impulse hammer test are presented in Figure 6(a). It can be seen that the impulse force is approximately 25N. Corresponding acceleration data captured by the accelerometer, is depicted in Figure 6(b). Double-hit impact tests data were discarded to prevent distortion in the excitation spectrum and subsequent signal distortion. The experimental impulse load data were then filtered to retain only the primary impulse load. Experimental data (a) Impulse load by impulse hammer and (b) corresponding acceleration data at the centre of the panel.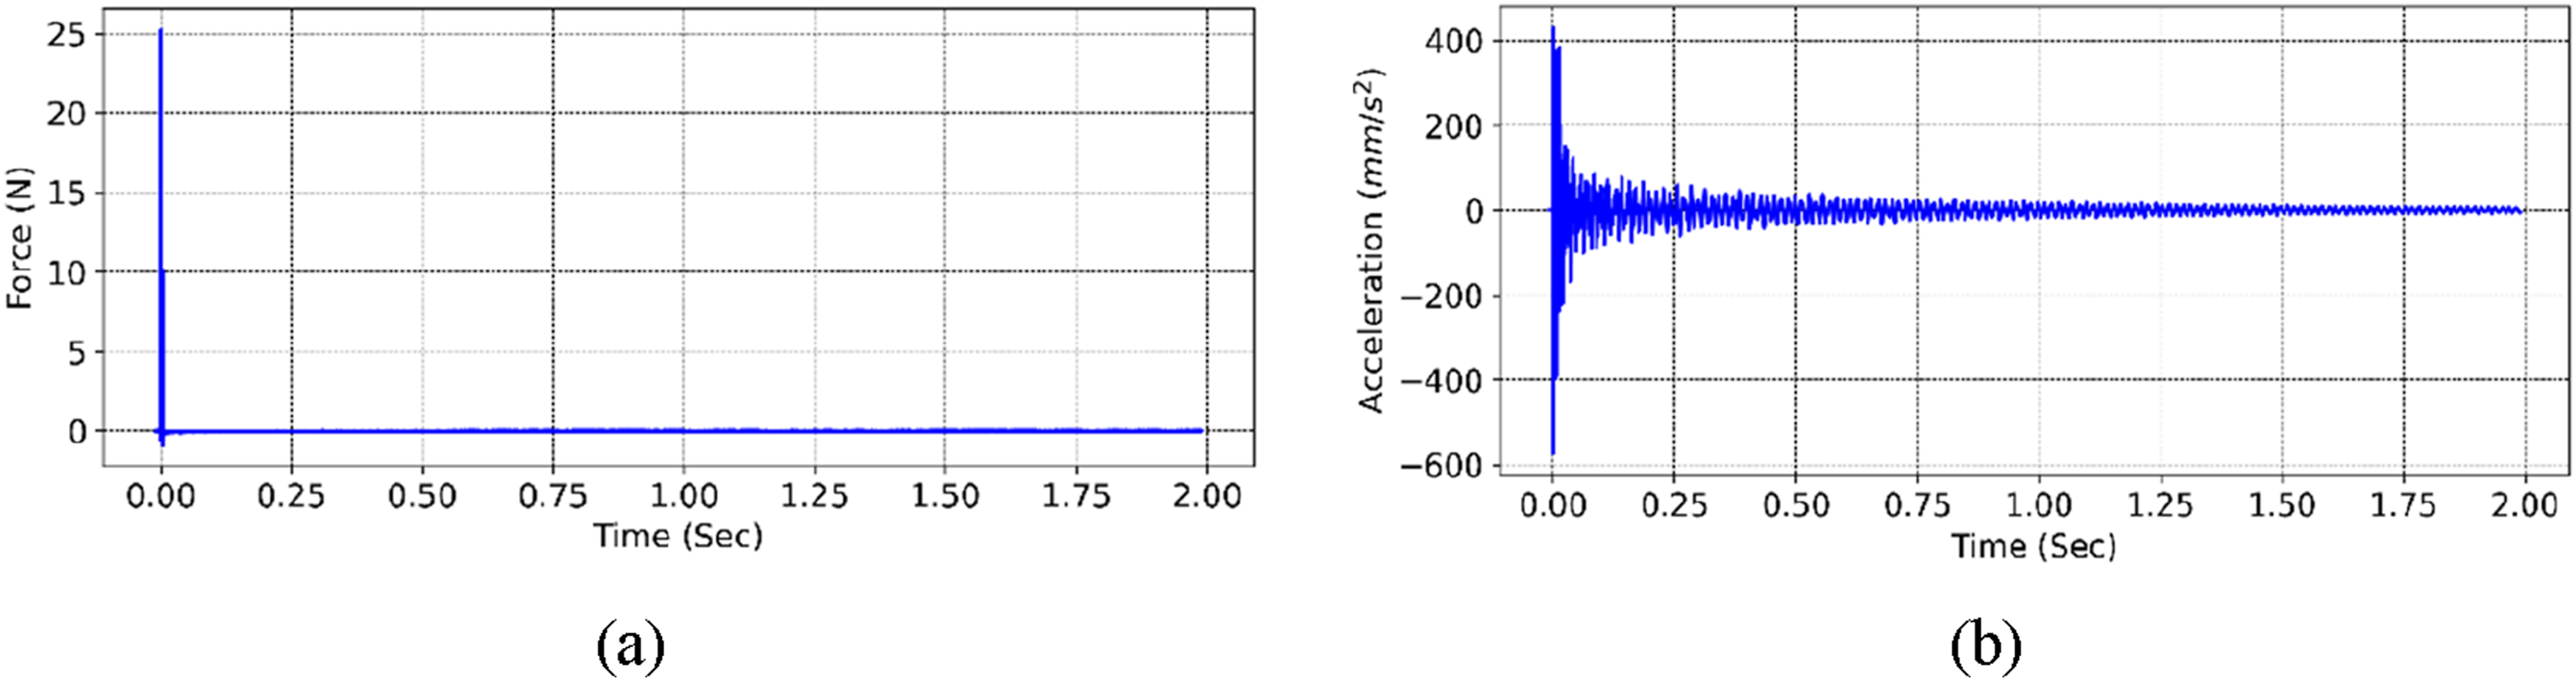
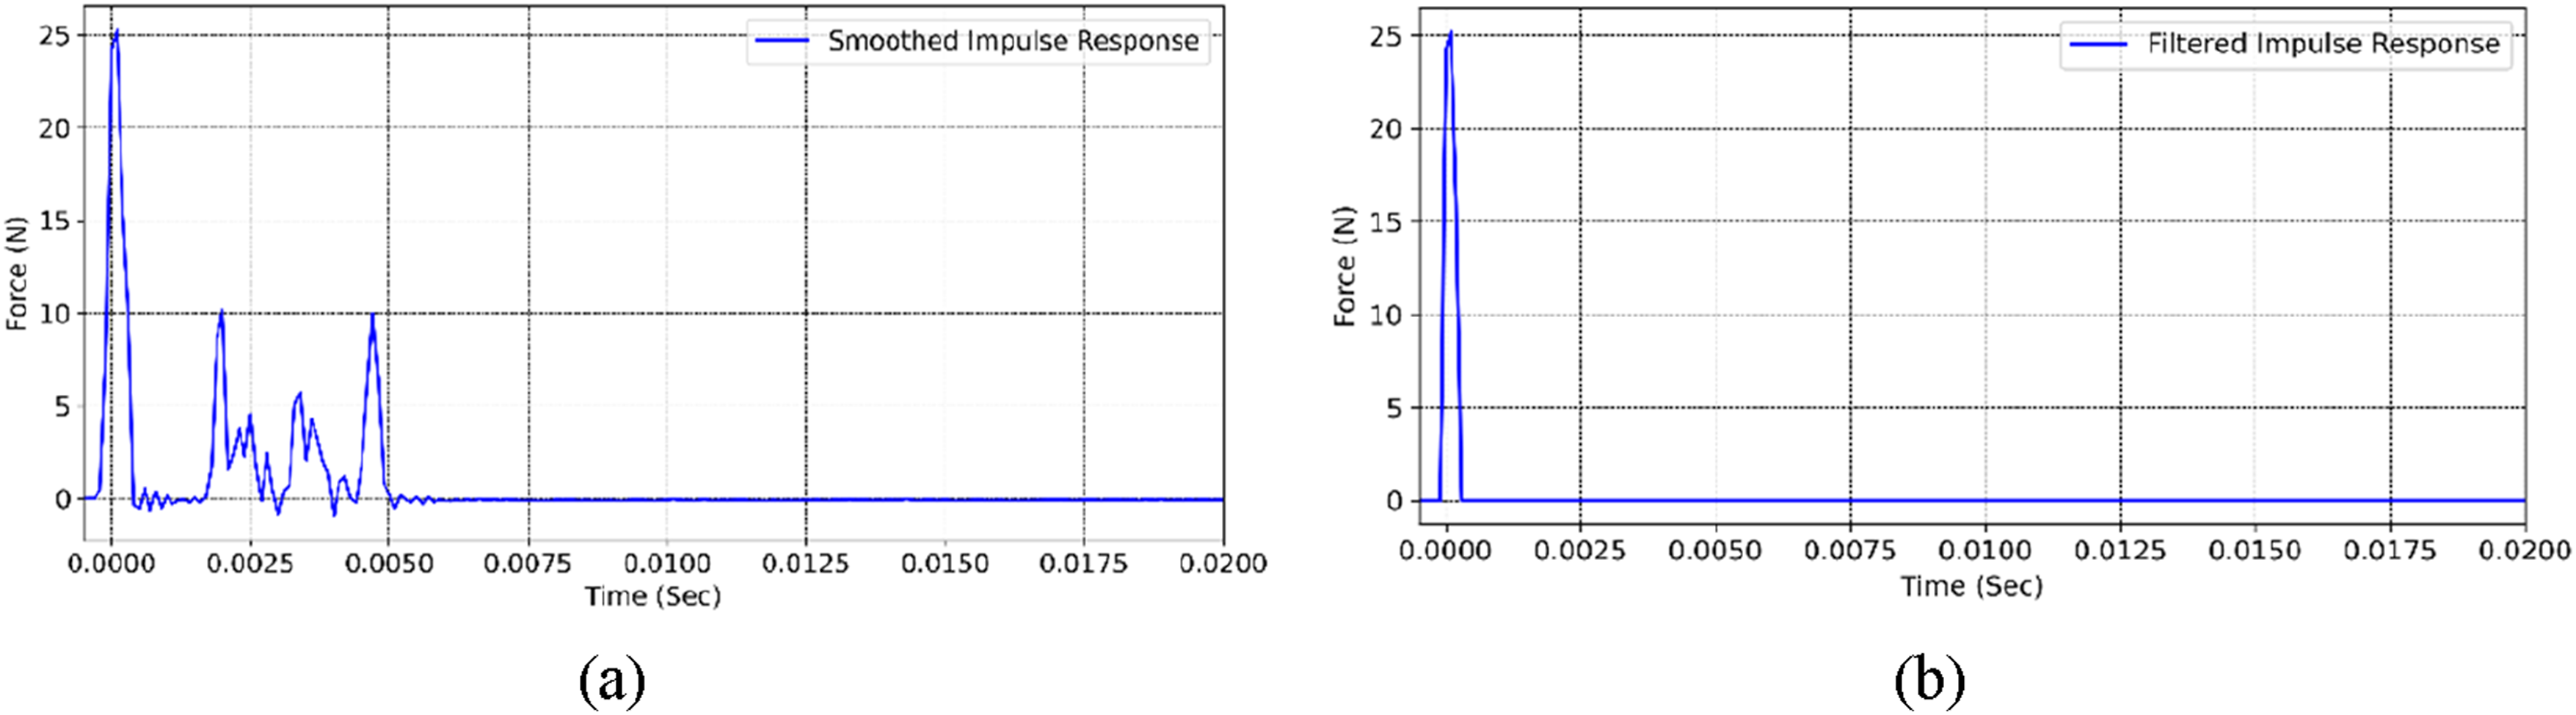
The original impulse data is illustrated in Figure 7(a), while Figure 7(b) displays the filtered impulse response, using Dirac Delta Function, δ(x) which has an infinitely high, infinitesimally narrow spike with unit area, mathematically it can be written as were utilized. Zoomed impulse data up to 20 millisecond (a) shows the original impulse data and Figure 6(b) shows the filtered impulse response.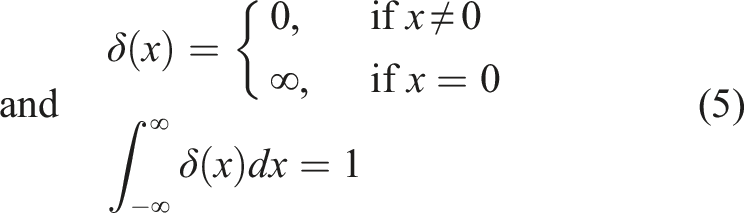
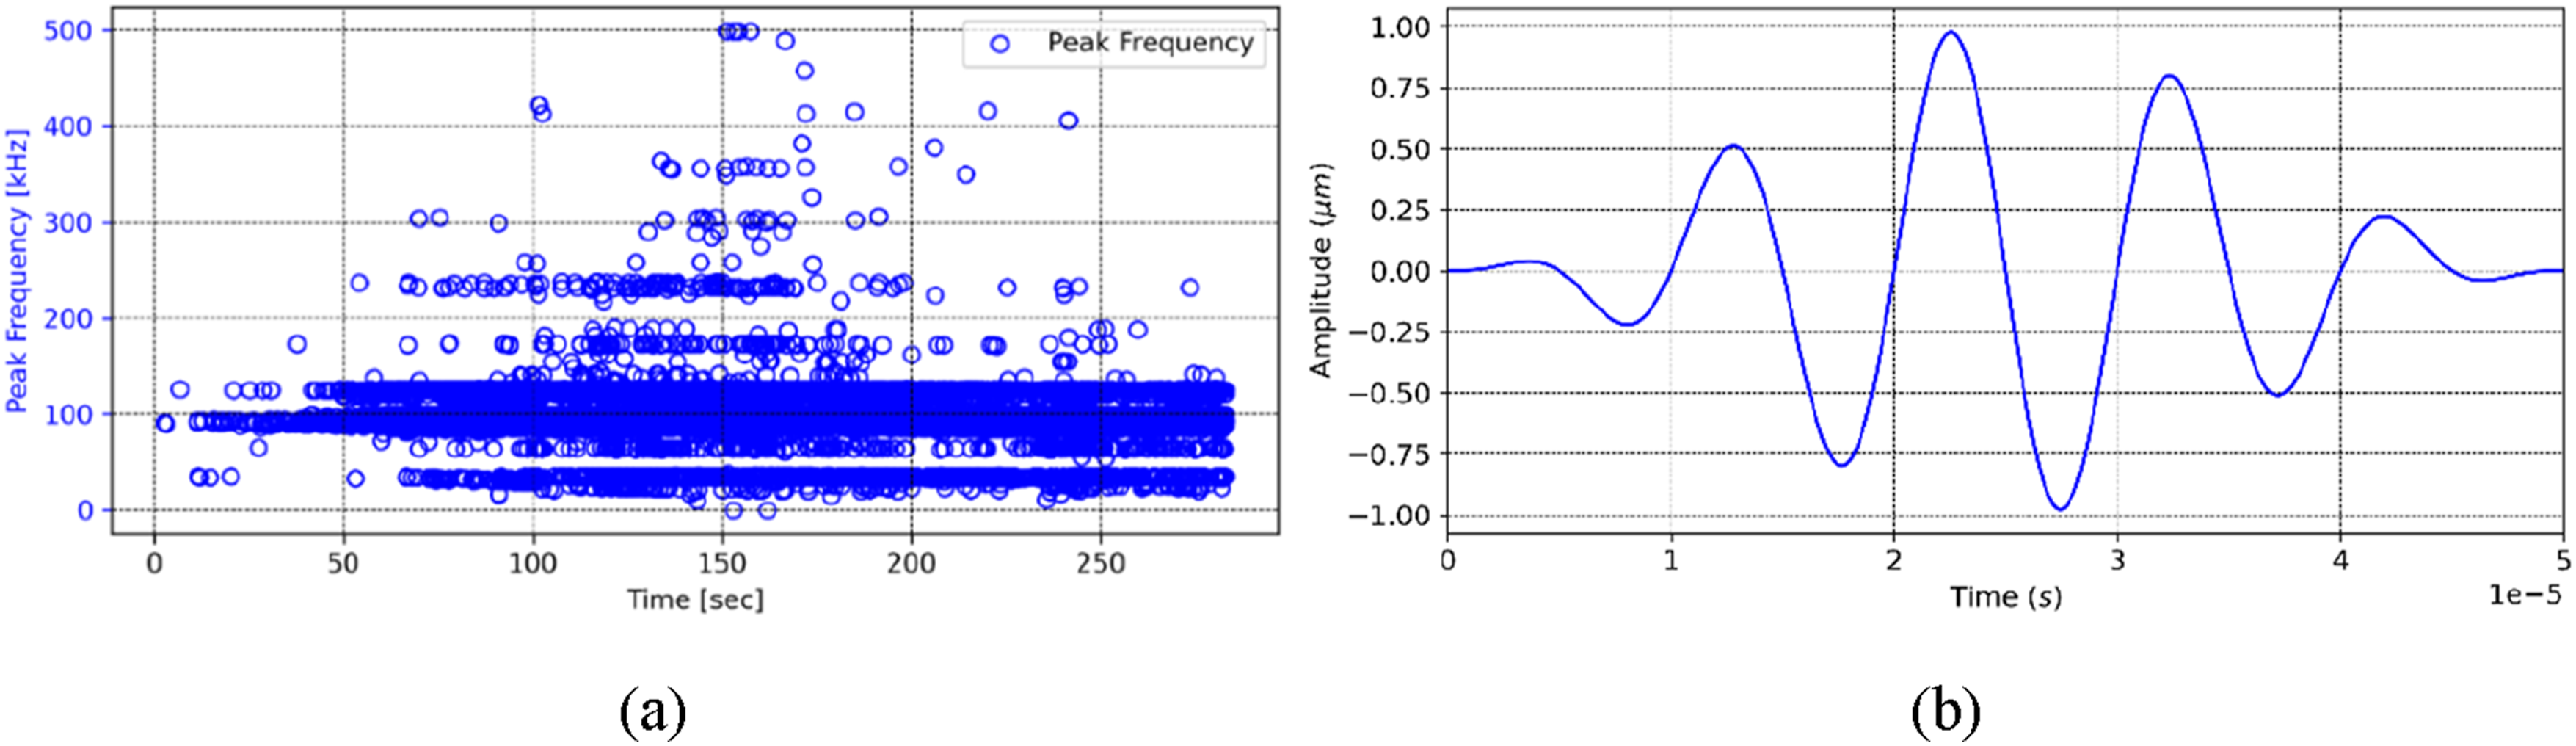
To discern the frequency pattern induced by quasi-static loading, leading to diverse failure modes like matrix cracking, fibre breakage, and delamination, a comprehensive test was performed on a composite coupon using a four-point bending setup. As illustrated in Figure 8(a) a significant number of AE events were concentrated around 100 kHz. To replicate the damage resulting from quasi-static loading, a 100 kHz, 5-cycle sinusoidal tone burst modulated by a Hamilton window function was used. The signal as depicted in Figure 8(b) was generated by implementing the mathematical expression given by equation (6) written in Python. Acoustic Emission Data and Waveform (a) AE on the test specimen showing the peak frequency for AE events (b) Theoretical waveform of 100 kHz sinusoidal tone burst (10µs).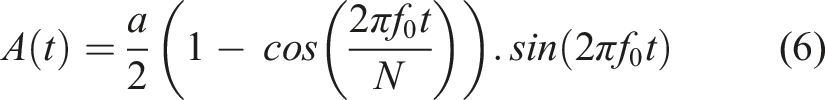
In the low-frequency domain, the A0 Lamb mode exhibits a lower phase velocity than the S0 mode, resulting in a shorter wavelength for the same frequency. This characteristic enhances the A0 mode’s sensitivity to small defects, a crucial factor in damage detection. 26 The effect is demonstrated in Figure 2, illustrating the substantial difference in phase velocity, and consequently wavelengths, between the A0 and S0 modes in quasi-isotropic CFRP laminate at lower frequency. This particular characteristic is vital for detecting damage, as a shorter wavelength signifies increased sensitivity to small defects. Numerous authors exploring Lamb wave damage detection techniques have emphasized this characteristic in their model selection.26–31
Numerical method
To simulate stress wave propagation in a large laminated panel, ANSYS Explicit dynamics 32 was employed. ANSYS Explicit dynamics is specifically designed to handle highly nonlinear, high-speed, and short-duration events under rapidly changing conditions, making it suitable for scenarios involving free falls, high-speed impacts, and interactive applied loads.
The numerical model investigated two distinct scenarios. The first scenario simulated low-velocity impacts by applying an impulse load at specific node, resembling hammer strikes for a realistic emulation. In contrast, the second scenario utilized five-cycle tone burst signals with a central frequency of 100 kHz. This was employed to replicate AE signals during quasi-static test on composite plate. The 100 kHz, 5-cycle Hamilton signal, generated using a Python program, was then input as the nodal displacement in the z-axis.
A comprehensive 3D finite element model was developed in ANSYS 2023R2, resembling the physical attributes of the real panel and incorporating relevant testing boundary conditions. The primary goal of this numerical model was to scrutinize the propagation of the antisymmetric Lamb wave mode in simple laminated composites, both with and without cutouts. This foundational investigation would pave the way for tackling more intricate geometries in subsequent studies.
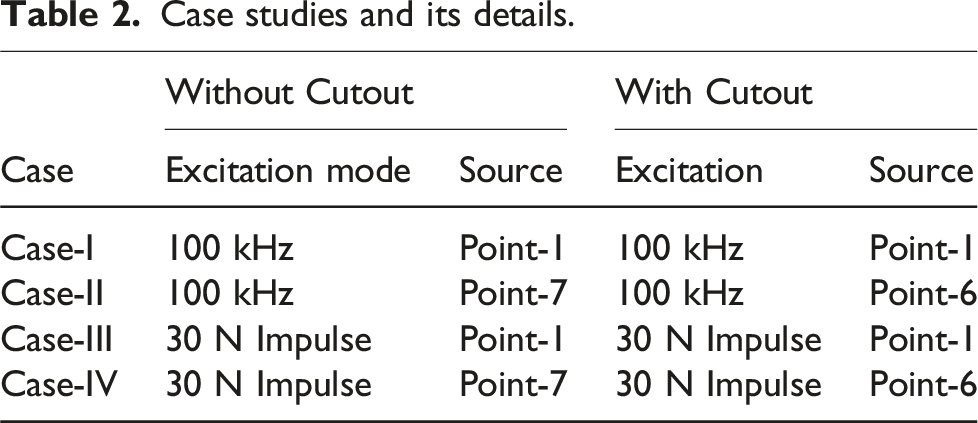
Case studies and its details.
Sensitivity analysis
Summary of the sensitivity study on varying element size on the computational results.
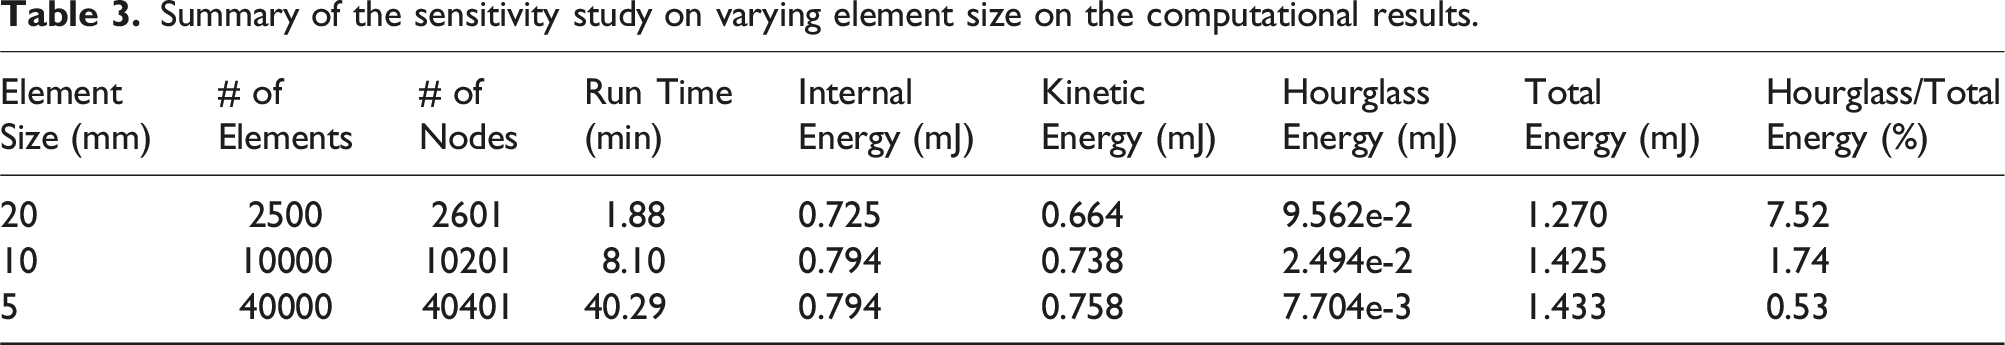
The hourglass energy, which is used as an ‘error indicator’ was used to measure adequate mesh refinement. 33 The sensitivity analysis revealed that while smaller mesh sizes exhibited lower hourglass values, they also required significantly more computational resources. Conversely, larger mesh sizes maintained stability with higher hourglass value.
Generally hourglass energy less than 5% of the total energy in the simulation is considered to be acceptable. The hourglass energy percentages were 7.52% for the 20 mm mesh size, 1.74% for the 10 mm mesh size, and 0.53% for the 5 mm mesh size. Based on these values, both the 10 mm and 5 mm mesh sizes fall well within the acceptable threshold, while the 20 mm mesh size slightly exceeds the recommended limit.
Based on the results, the 10 mm element size was selected for our modelling approach. This decision was influenced by a balance between computation time and the accuracy of results, with the 10 mm element size demonstrating a reasonable runtime while maintaining results consistent with those obtained using smaller element sizes.
Boundary conditions
Two boundary conditions were explored. Figure 9(a) and (b) shows the Lamb wave propagation at 750 µs for fixed support and simply support boundary conditions, respectively, following excitation at point 1. To enhance clarity, the results are magnified to 50kX. Stress wave propagation on the panel at 750µs (a) 100 kHz excitation frequency at point 1 with fixed support boundary conditions and (b) 100 kHz excitation frequency at point 1 with simply support boundary conditions.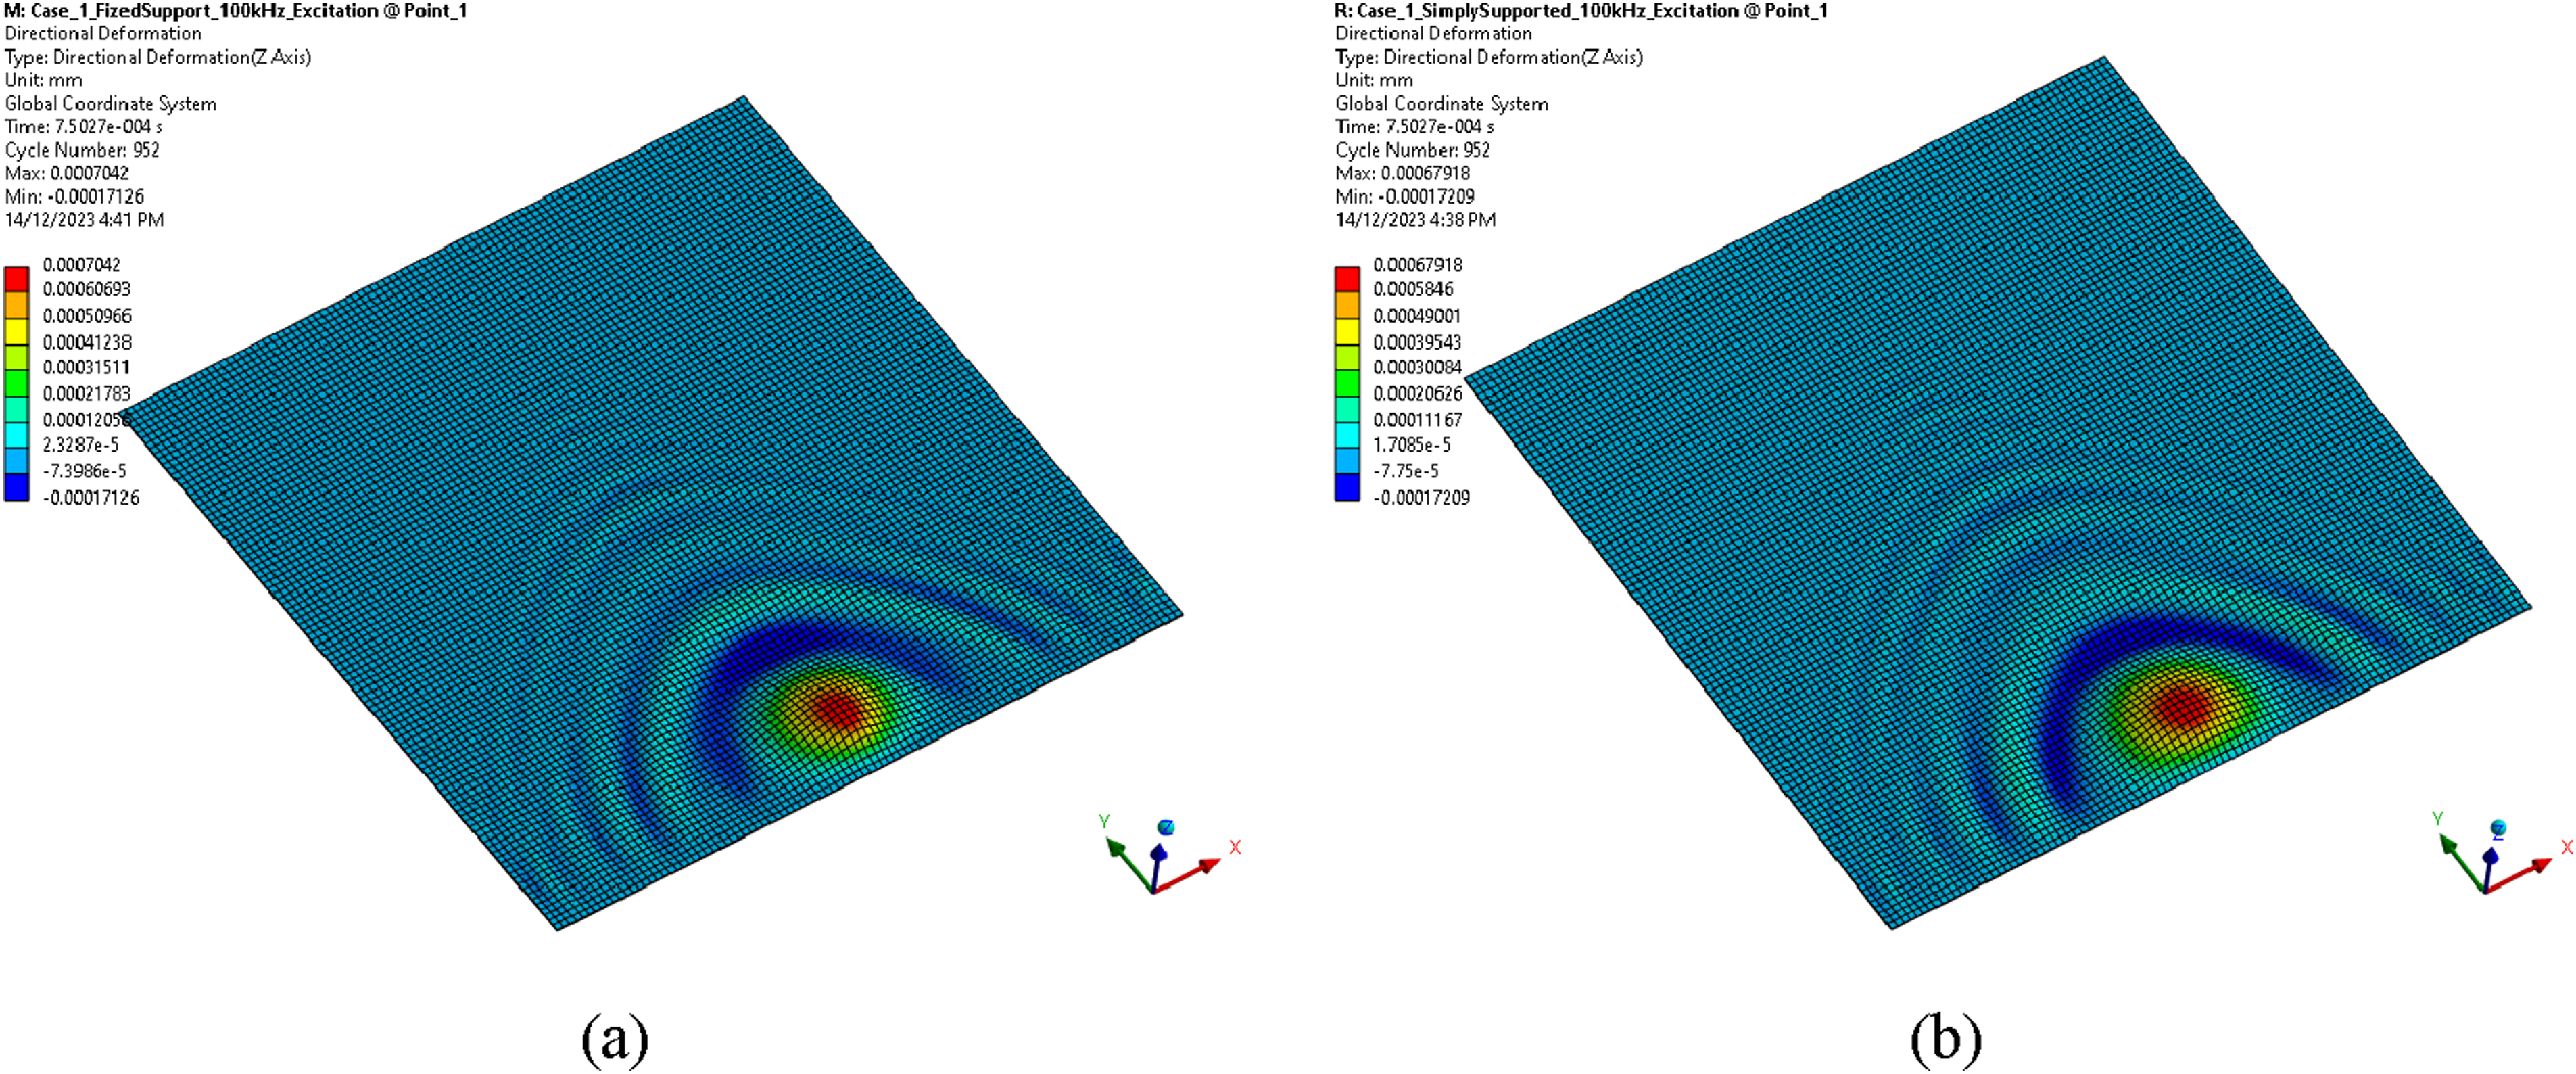
For the fixed boundary condition, all four edges of the panel were fixed and constrained in all six degrees of freedom (Ux, Uy, Uz, Rx, Ry, Rz). In contrast, for the simply supported boundary conditions, the four edges of the panel were only constrained in the three translational degrees of freedom (Ux, Uy, Uz) while leaving the three rotational degrees of freedom (Rx, Ry, Rz) free.
It can be seen that stress waves do not propagate in a perfect radial direction from the source along the plane of the surface because of coupling effect of anisotropic material. As a result, different wave speeds and modes can occur in different directions, leading to complex propagation patterns. However, despite this directional variation, the deformations exhibited remarkable similarity. Due to the resemblance in results and a boundary condition representation that more accurately mirrors the experimental condition, it was determined that only cases with simply supported boundary conditions would be reported.
Numerical modelling
The modelling process involved using SpaceClaim to create the 2D surface representation of the panel, which was then imported into the ACP. The ‘NamedSelection’ option facilitated the identification of sensor placement locations and excitation points using the worksheet scoping method.
The simulation was conducted in a single step with ‘Explicit Time Integration,’ setting the simulation end time to 3000 µs. To capture detailed displacements, the FEA output was configured with 500 equally spaced points for the analysis duration.
The ANSYS Explicit Dynamics analysis system, leveraging the Autodyn solver, was instrumental in this investigation. Autodyn, an explicit integration solver utilizing the Lagrangian integration scheme, excels in simulating solid elastic systems undergoing high-speed deformations, making it particularly suited for scenarios like drop tests, impacts, and shocks. 34
To ascertain the optimal sensor placement on the panel, a preliminary study was conducted to analyse the reflected waves originating from the panel’s edges. The postprocessing results from FEA, depicted in Figure 10, vividly showcases the reflected waves extending beyond the primary wave at 175 µs for the 100 kHz excitation at point 1. This examination provides valuable insights into identifying an appropriate location for sensor deployment to capture relevant wave phenomena. The chosen placement within the semicircular region, with the diameter of circle corresponding to the width of the panel, was employed to ensure optimal capture of the primary wave while minimizing the influence of the reflected waves. The reflected waves as seen in the FEA postprocessing at 175 µs for the 100 kHz excitation at point 1.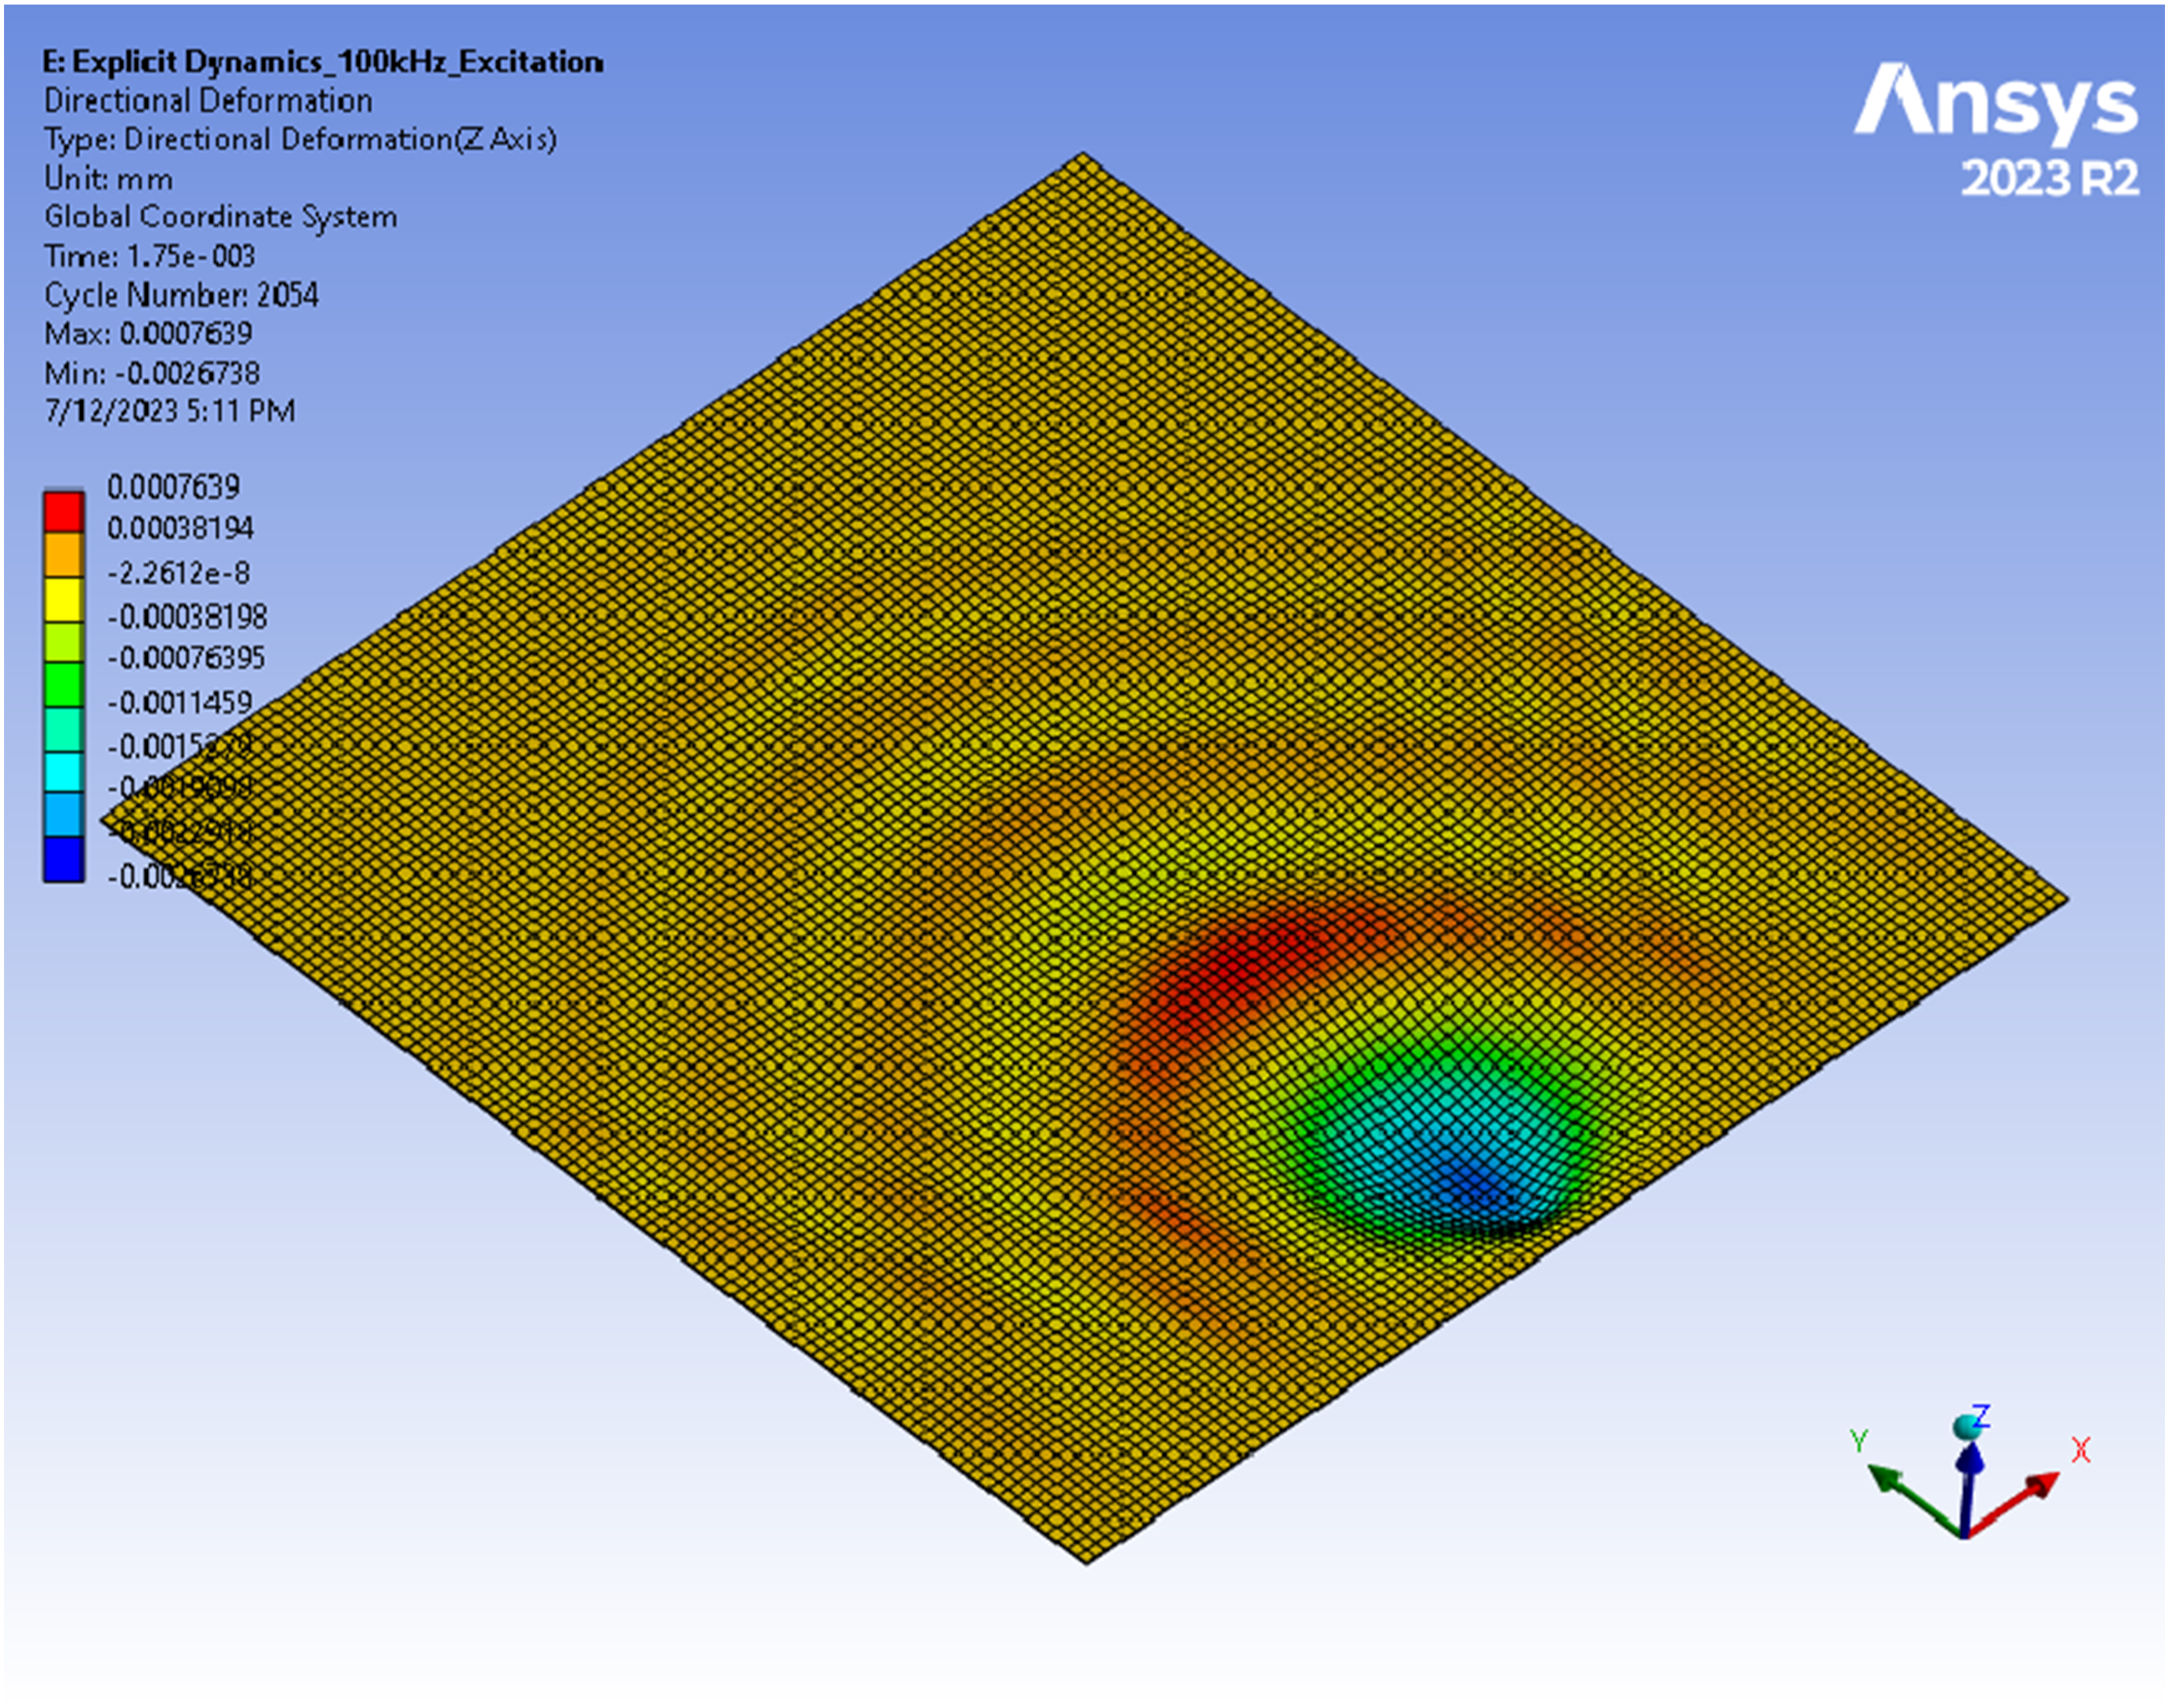
Results
Experimental results
To capture the stress wave effectively, four Acoustic Emission (AE) sensors were strategically placed at coordinates (50, 50), (950, 50), (500, 400) and (300, 350), respectively, as shown in the Figure 4(b). A 50 mm offset from the edge was employed to minimize the influence of reflected waves. The impulse hammer test was conducted at each test point, repeated three times, addressing instances of double impact, as explained in the previous section. To further isolate the panel from the metallic support, sealant tape was applied on the bottom side of the panel.
The Acoustic System employed in this includes Micro-II Digital AE system from Physical Acoustics Corporation (USA) 35 and PZT R6α - 60 kHz general purpose AE sensor. 36 To enhance the AE signal amplitude, MISTRA voltage amplifiers with a gain of 40 dB were individually assigned to each sensor. Real-time AE data acquisition, waveform processing, display, and data storage were facilitated using AEwinTM Windows®-based program. 37
The accelerometer data obtained from the impact hammer test was transformed from the time domain to the frequency domain using Fast Fourier Transform (FFT), thereby unveiling the dominant frequencies. The observed dominant frequency was approximately 70 Hz as seen in the Figure 11. Frequency spectrum of the accelerometer data.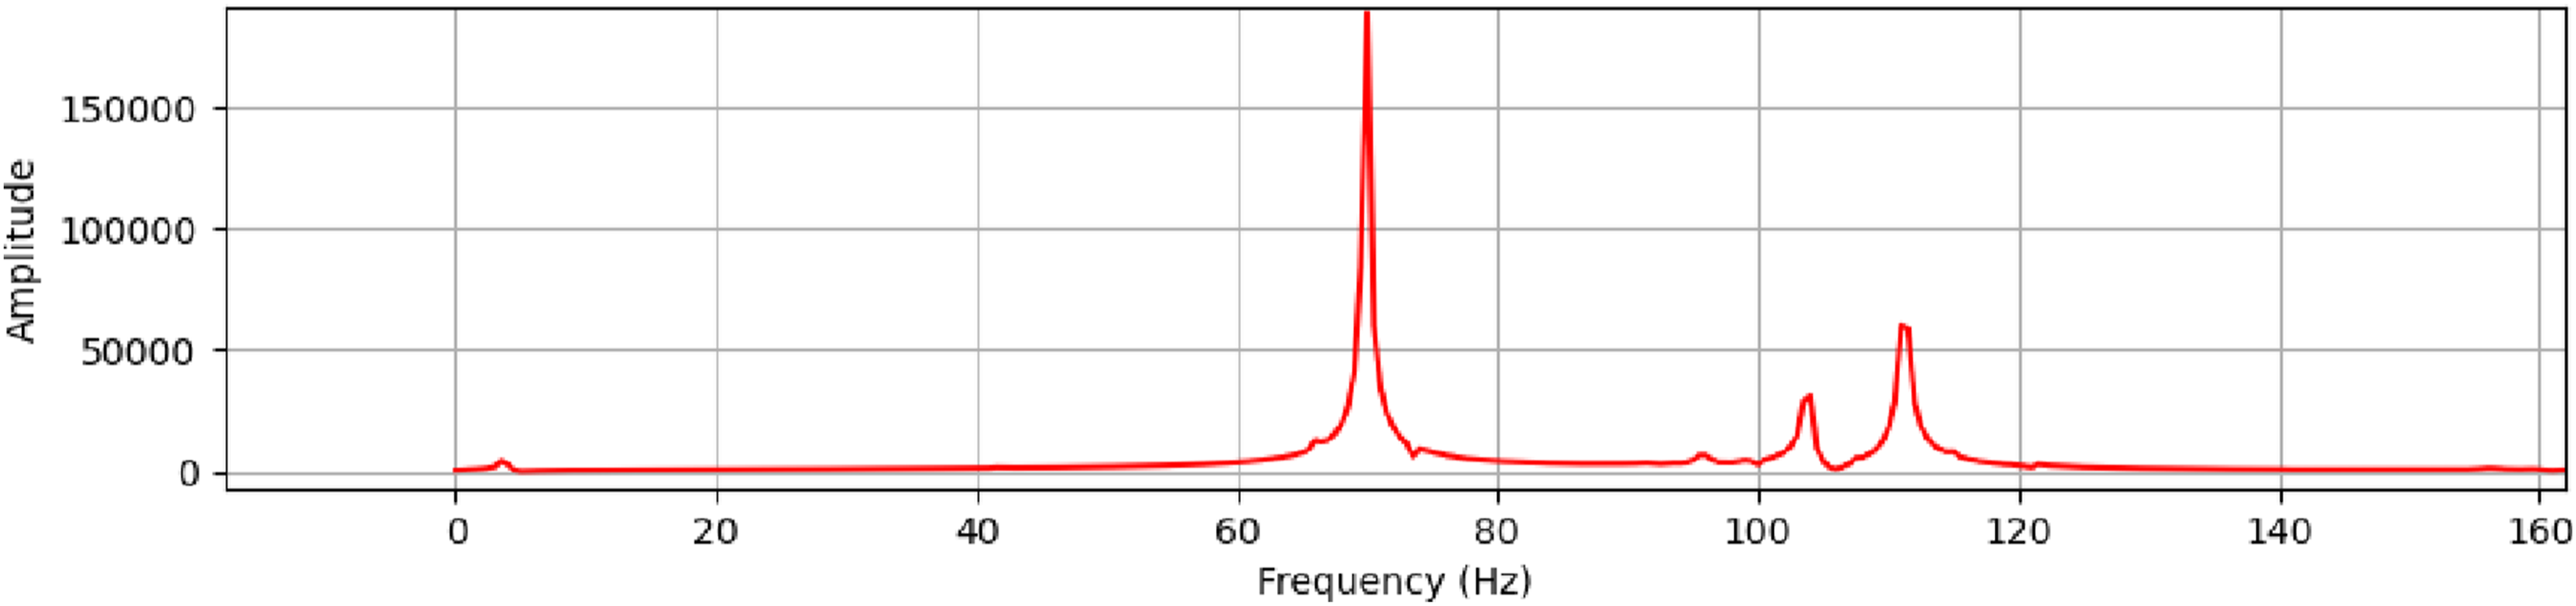
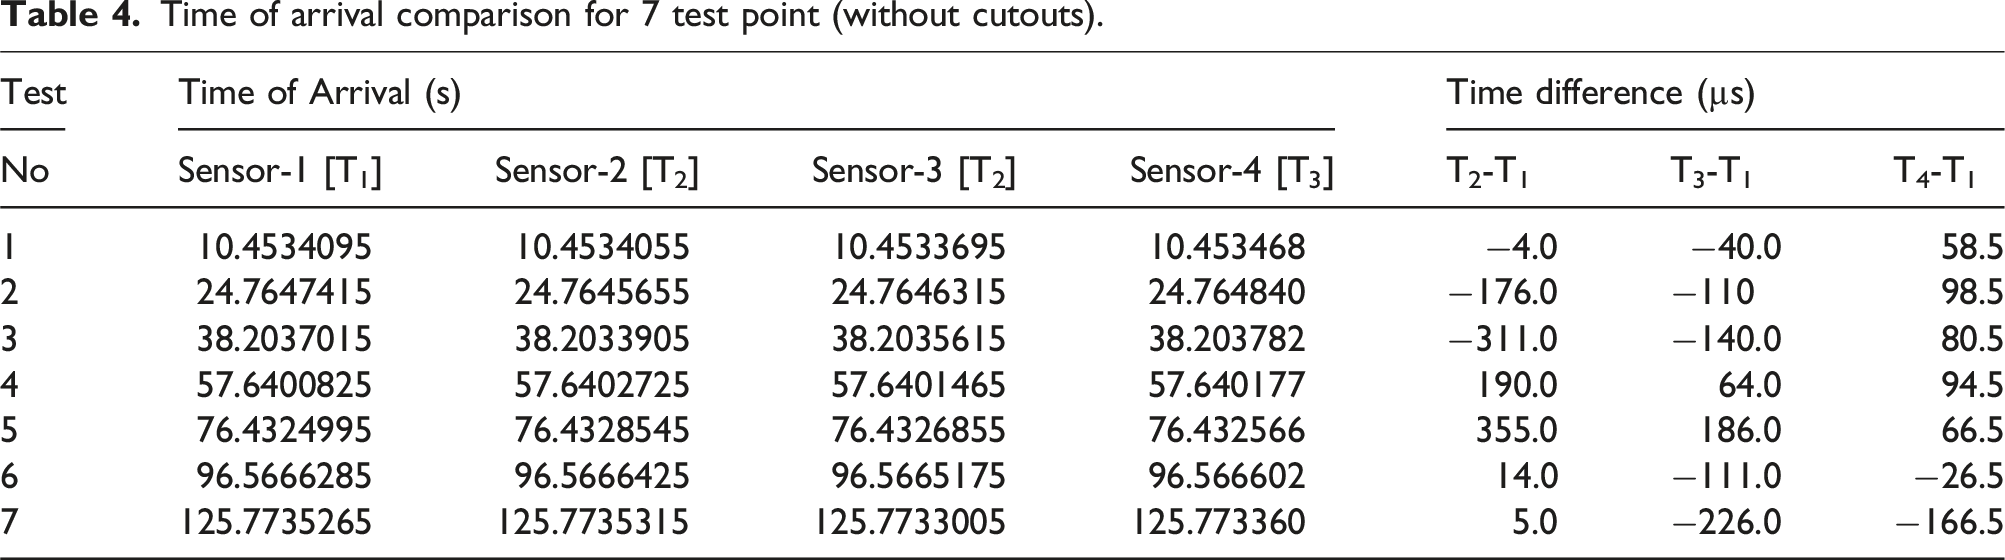
Stress wave time of arrival comparison
Time of arrival comparison for 7 test point (without cutouts).
Time of arrival comparison for 6 test point (with cutouts).
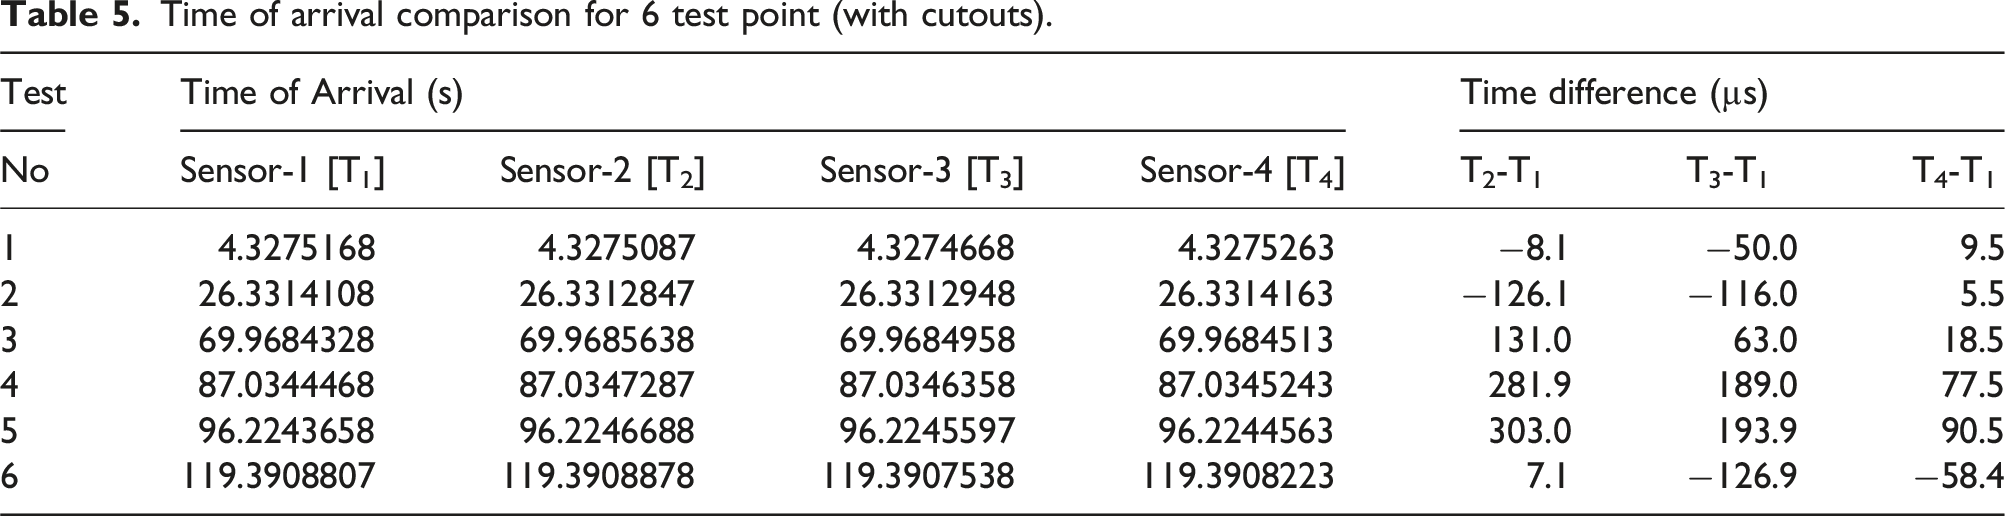
It is noteworthy that only six test points are considered for the panel with cutouts, as the seventh test point is located within the cutout and, consequently, has been excluded from the analysis.
Numerical analysis results
In SHM applications utilizing Lamb waves, a network of transducers emits stress waves, while sensors detect guided waves propagating along the surface of the surface. This approach enables the assessment of structural integrity and the detection of defects. However, accurately simulating Lamb wave propagation requires models that can capture the intricate complexities of real-world scenarios.
In this regard, three-dimensional finite element models (3D-FEM) offer significant advantages over their two-dimensional counterparts. By incorporating three-dimensional geometries and material properties, 3D-FEMs provide a more comprehensive representation of the structure, including features such as cutouts and heterogeneous material distributions. This enhanced level of detail enables a more accurate simulation of Lamb wave behaviour under realistic conditions. Furthermore, the three-dimensional nature of 3D-FEMs facilitates the capture of scattered waves from edges and discontinuities within the structure. This capability is crucial for accurately predicting wave interactions and assessing the effectiveness of SHM techniques.
The numerical analysis was performed on a PC with Windows 11 Enterprise OS with 64 GB RAM and an 11th Generation Intel Core i7-11700 processor. Displacement versus time data was recorded at each sensor node, focusing on the out-of-plane displacement (z-axis) using the Directional Deformation probe. The excitation signal was input into ANSYS through the tabular Data option for Nodal Displacement boundary conditions. Throughout the simulations, the hourglass energy remained below 5%, and the hourglass damping control was maintained at default settings, which are deemed most efficient in terms of memory and speed according to the Ansys Autodyn user manual. 38 The analysis was set to last for 3000µs, allowing ample time for the Lamb wave to traverse the composite panel’s length, reflect off the edges, and complete a full incident and reflection cycle.
Below sections details the numerical result of the Lamb wave propagation in the pristine panel and panel with cutouts. All data processing and plotting was performed using custom-written Python codes. ‘find_peaks()’ function from ‘scipy.signal’ was used to detect local maxima and minima in the signal. It employs sophisticated algorithms to located points where the signal transitions from increasing to decreasing, providing a convenient way to identify significant features within the data. Only the first stress wave reaching at the sensor-point is reported in the tables below.
Case – I: 100 kHz at point 1 (with and without Cutout)
This section presents the finite element (FE) numerical results of Lamb wave propagation in the panel, both with and without a ∅100 mm cutout, for a 100 kHz excitation at point 1. Figure 12 illustrates the Lamb wave propagation at 750 µs following the excitation at point 1. Stress wave propagation on the panel with circular cutout at 750µs and 100 kHz excitation frequency at point 1.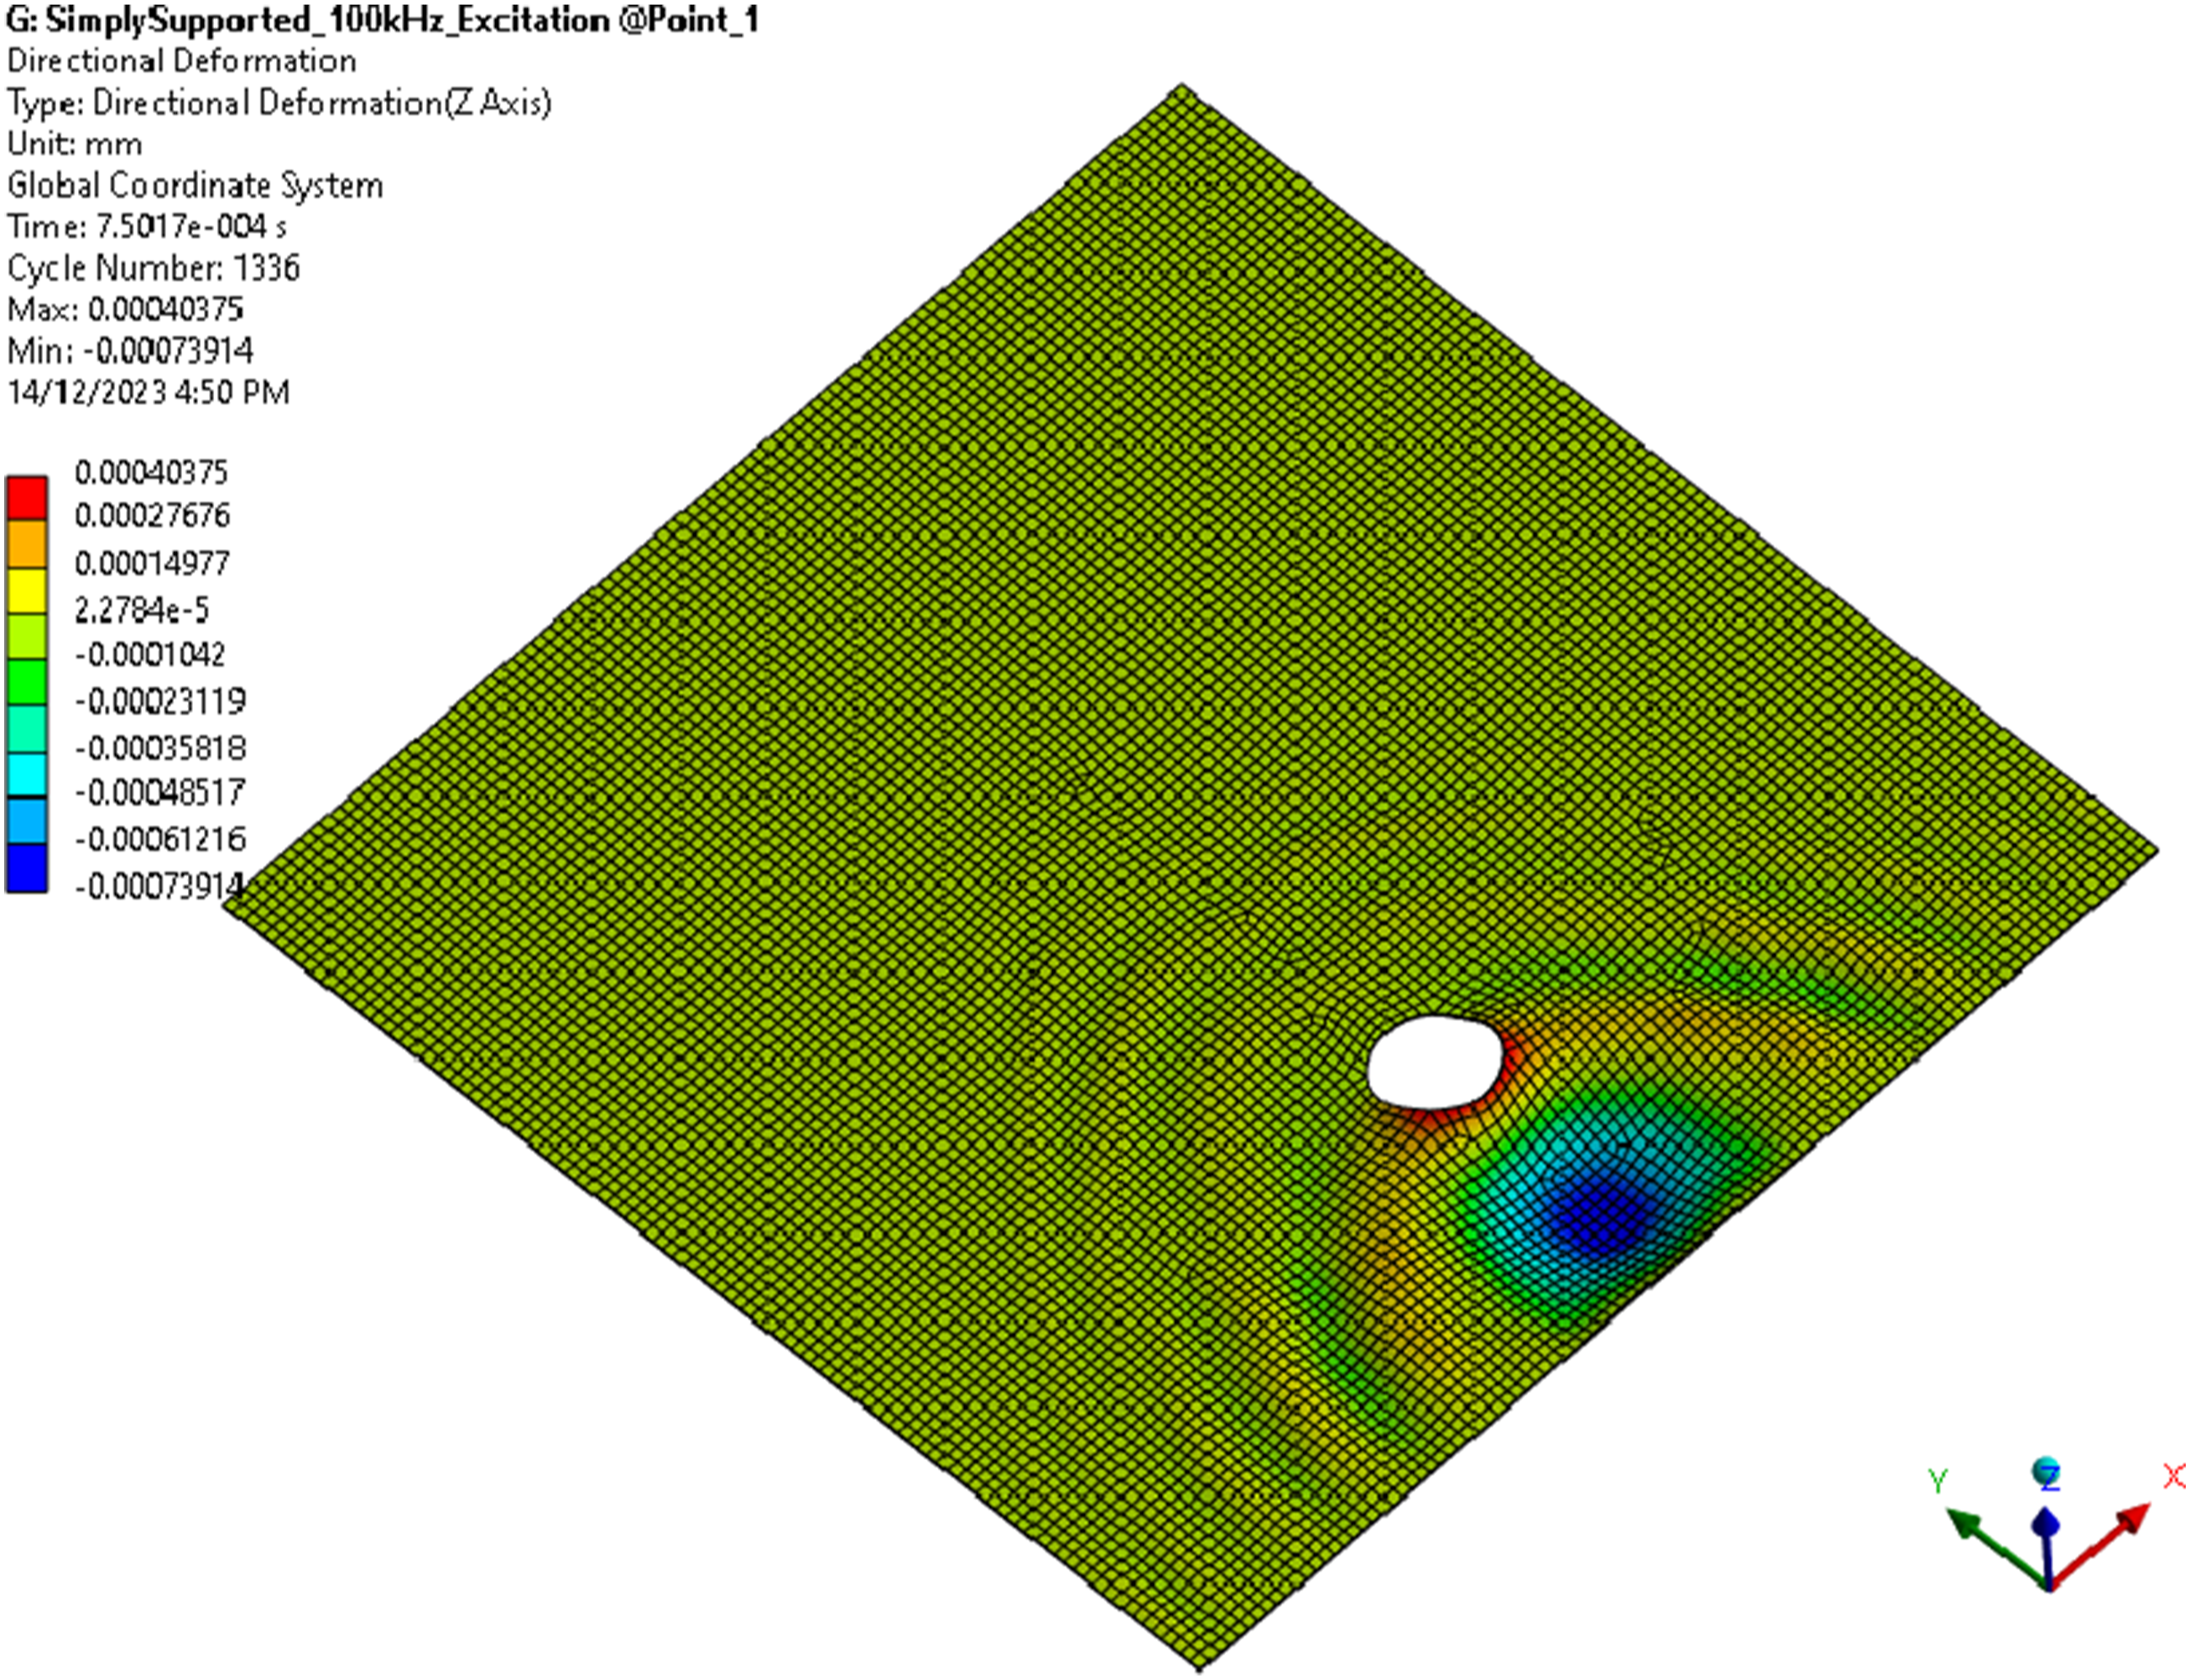
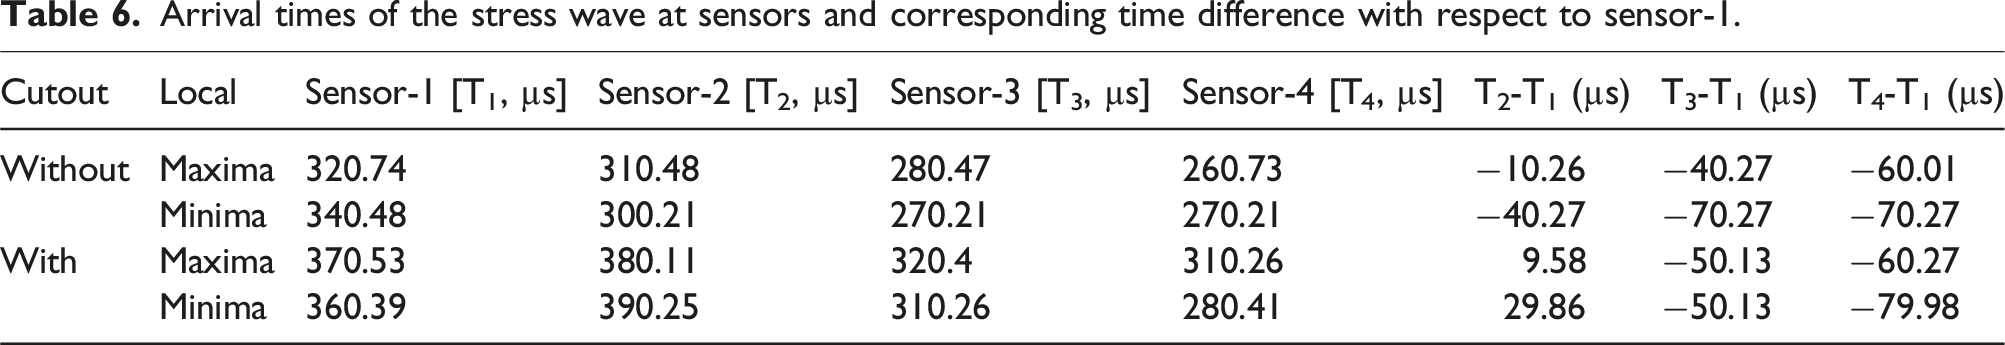
Due to the significant orders of magnitude difference, displaying the deformation data for sensors 1 through 4 on a single plot is impractical. Consequently, two separate plots have been created; one for sensor-1 & 2, and another for sensor-3 & 4. In Figure 13(a), the time of arrival of the first wave at sensor-1 is noted at 320.74 µs post-excitation based on the local maxima, whereas the stress wave reaches sensor-2 at 340.48 µs when considering the local minima. An analysis of the complete graph in Figure 13(a) reveals that the peak amplitude is observed after the wave passes the sensors, strikes the edge, reflects back, and results in the interference of the reflected waves, approximately at 600 µs. Interestingly, as time progresses, the amplitude behaviour for sensors 3 and 4 reverses, suggesting this may be due to the interference of reflected waves. Out-of-plane deformation plots showing sensor 1 & 2 and sensor 3 & 4 on left and right, respectively, for (a) without cutout panel and (b) with cutout panel.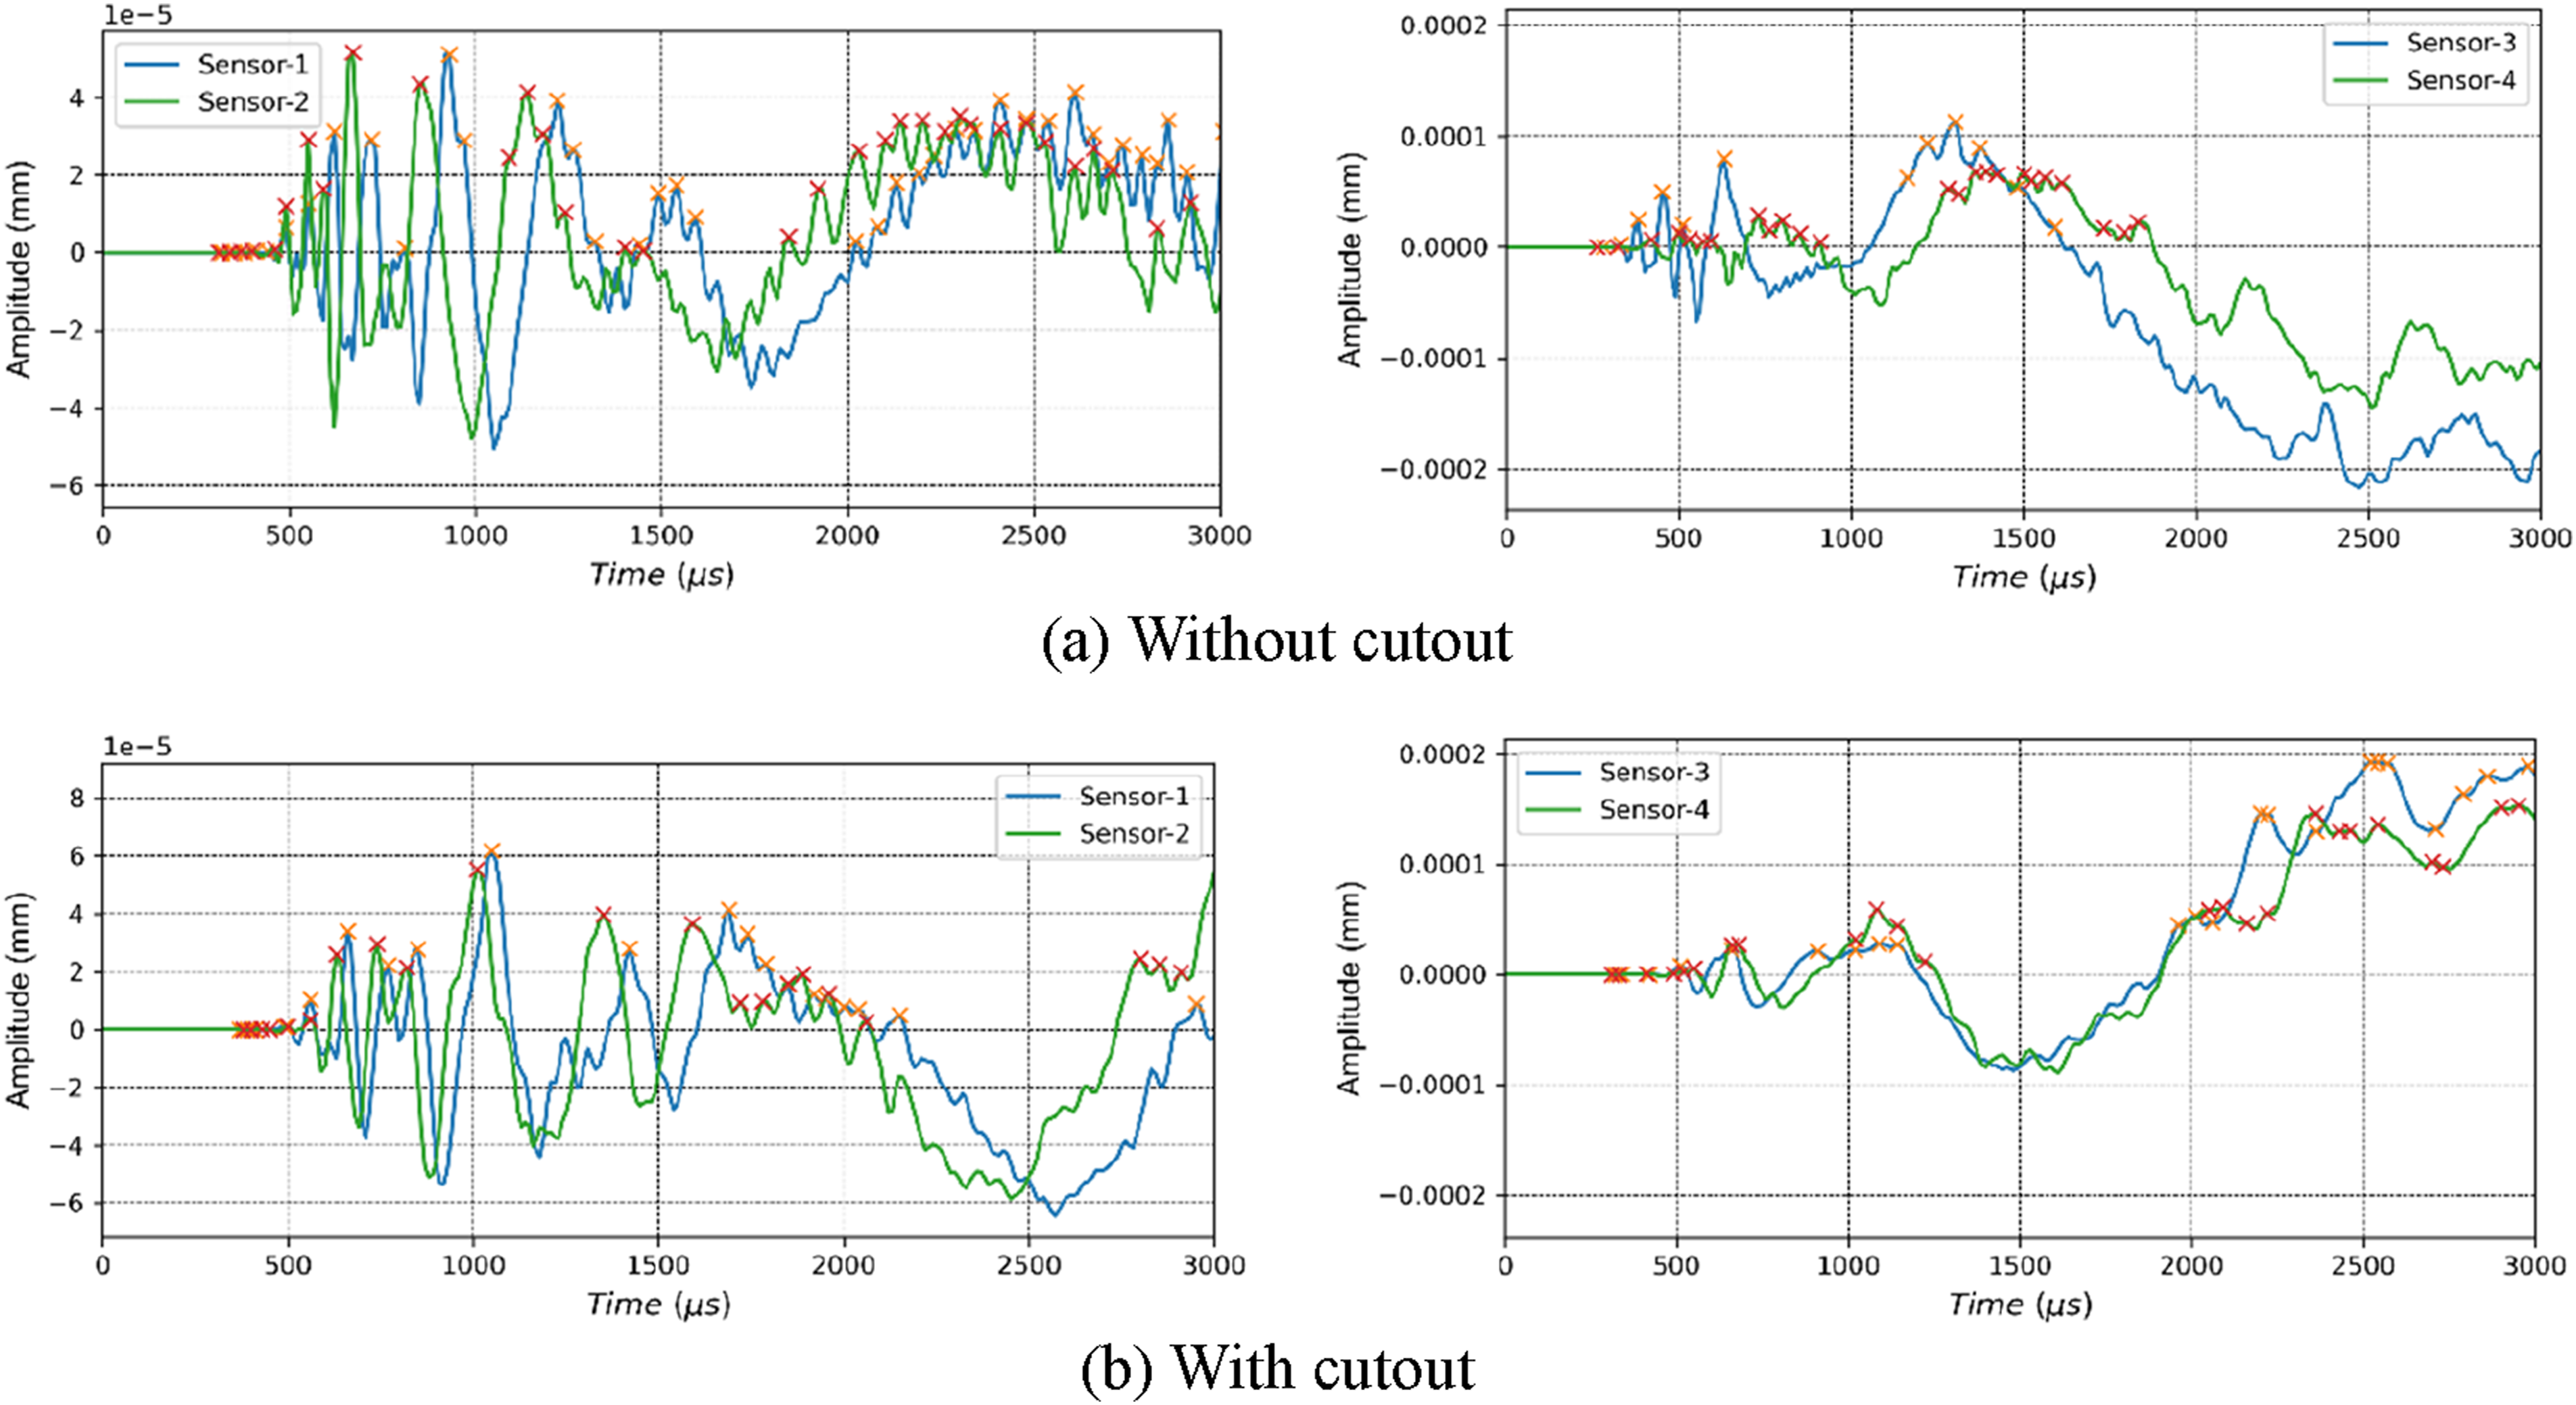
Arrival times of the stress wave at sensors and corresponding time difference with respect to sensor-1.
Case – II: 100 kHz at point 7 or 6 (without and with Cutout)
The Lamb wave propagation at 750 µs following the excitation at point 6 and point 7 for without cutout and with cutout panel are illustrated in Figure 14(a) and (b), respectively. Stress wave propagation on the panel with and without circular cutout at 750s and 100 kHz excitation frequency (a) at point 7 and (b) point 6.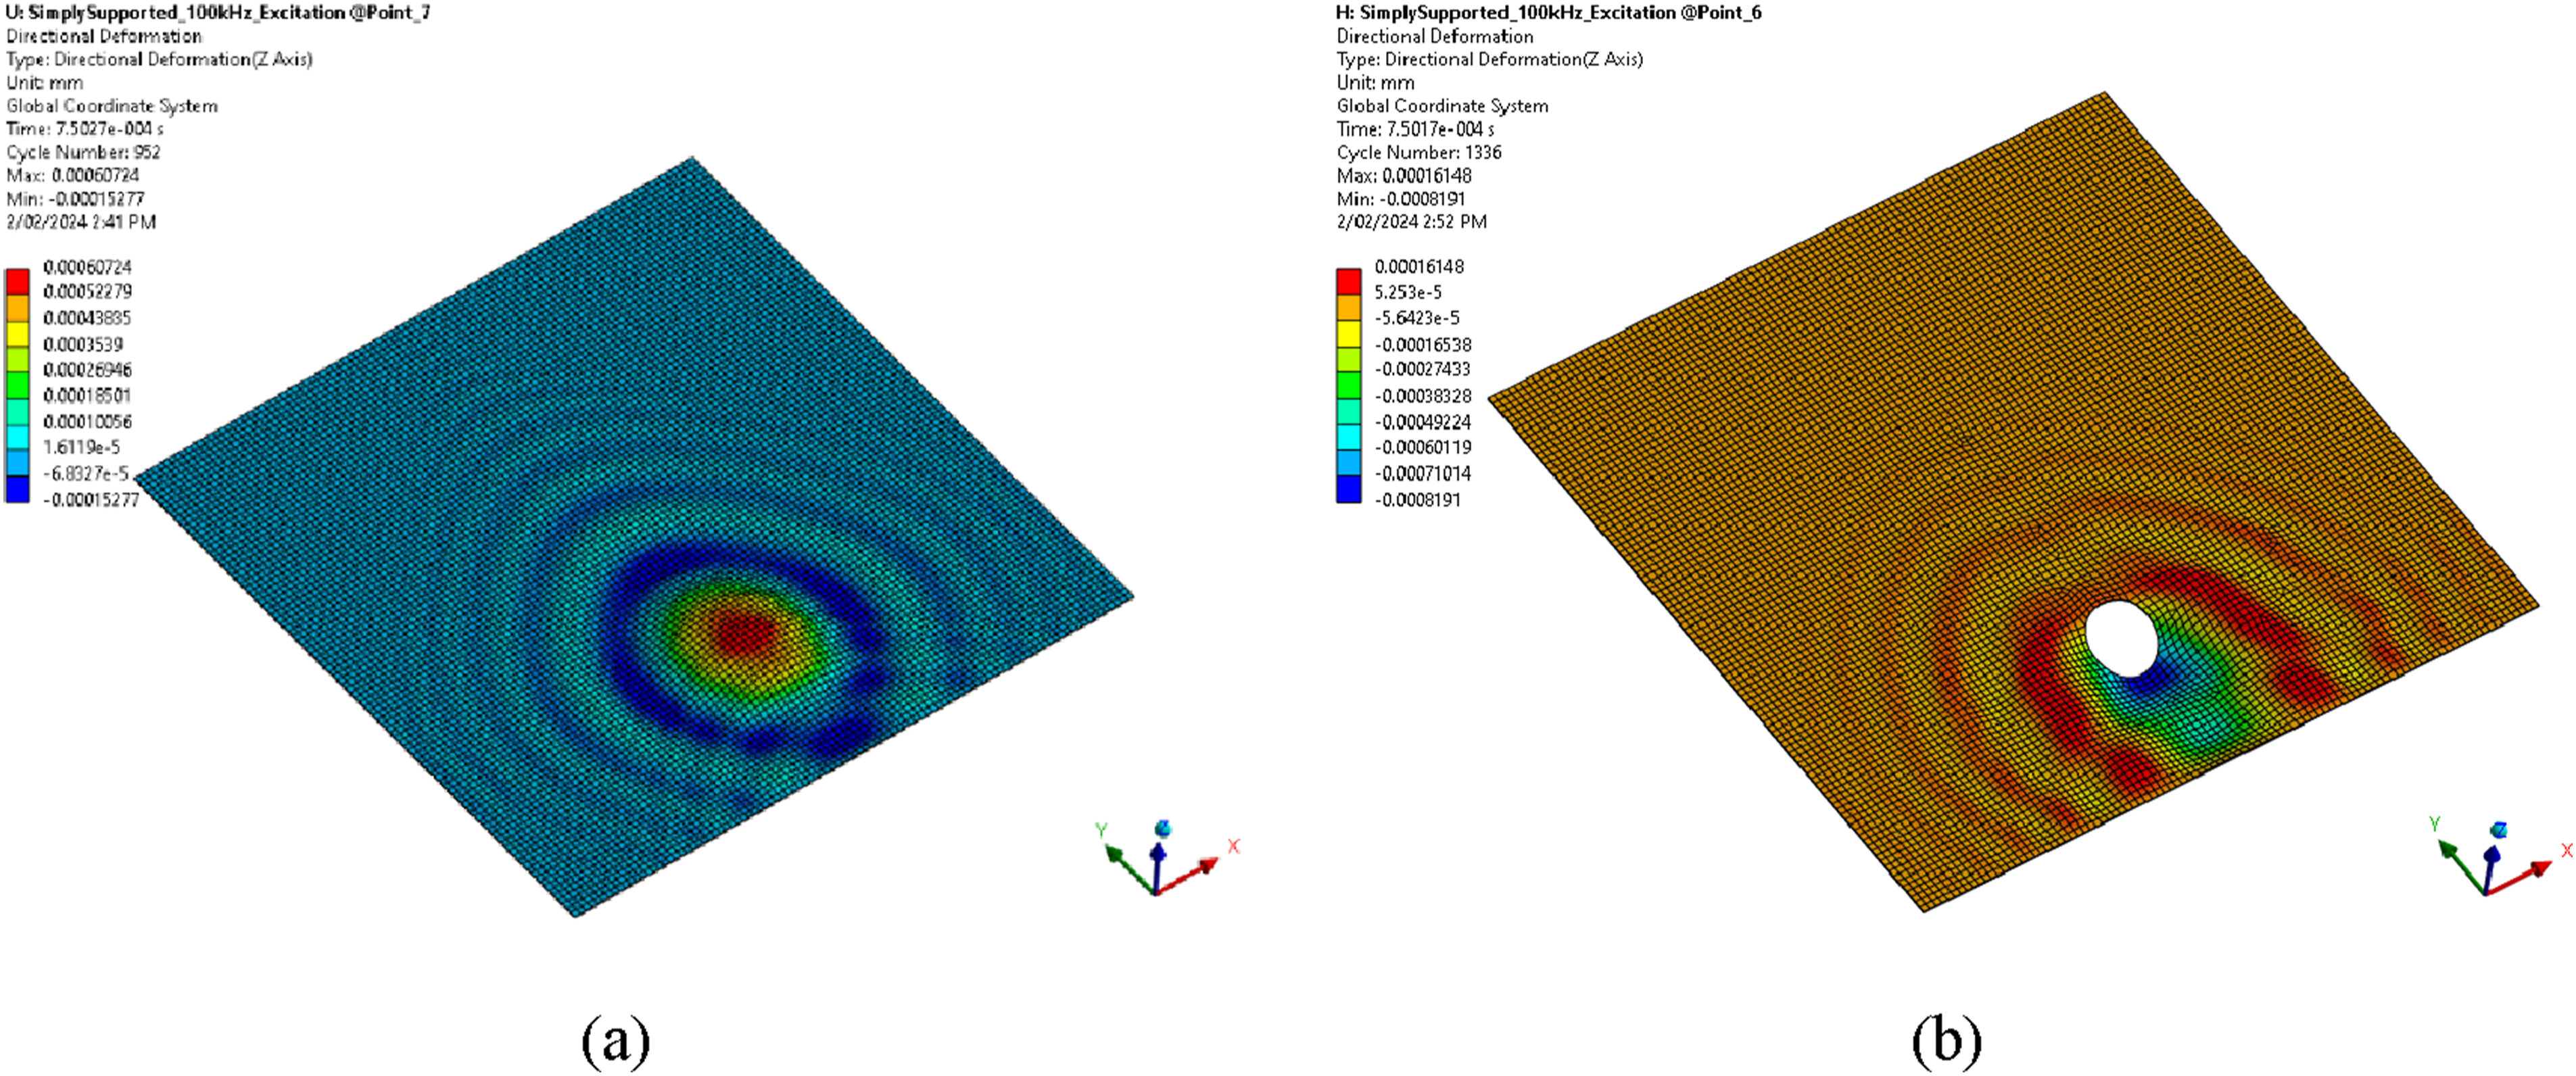
Figure 15(a) plots the arrival of the stress wave at sensor-1 & sensor-2 and sensor-3 & sensor-4 on left and right plots, respectively. Similarly Figure 15(b) shows the plots for the sensors for the panel with cutout. Out-of-plane deformation plots showing sensor 1 & 2 and sensor 3 & 4 on left and right, respectively, for (a) without cutout panel and (b) with cutout panel.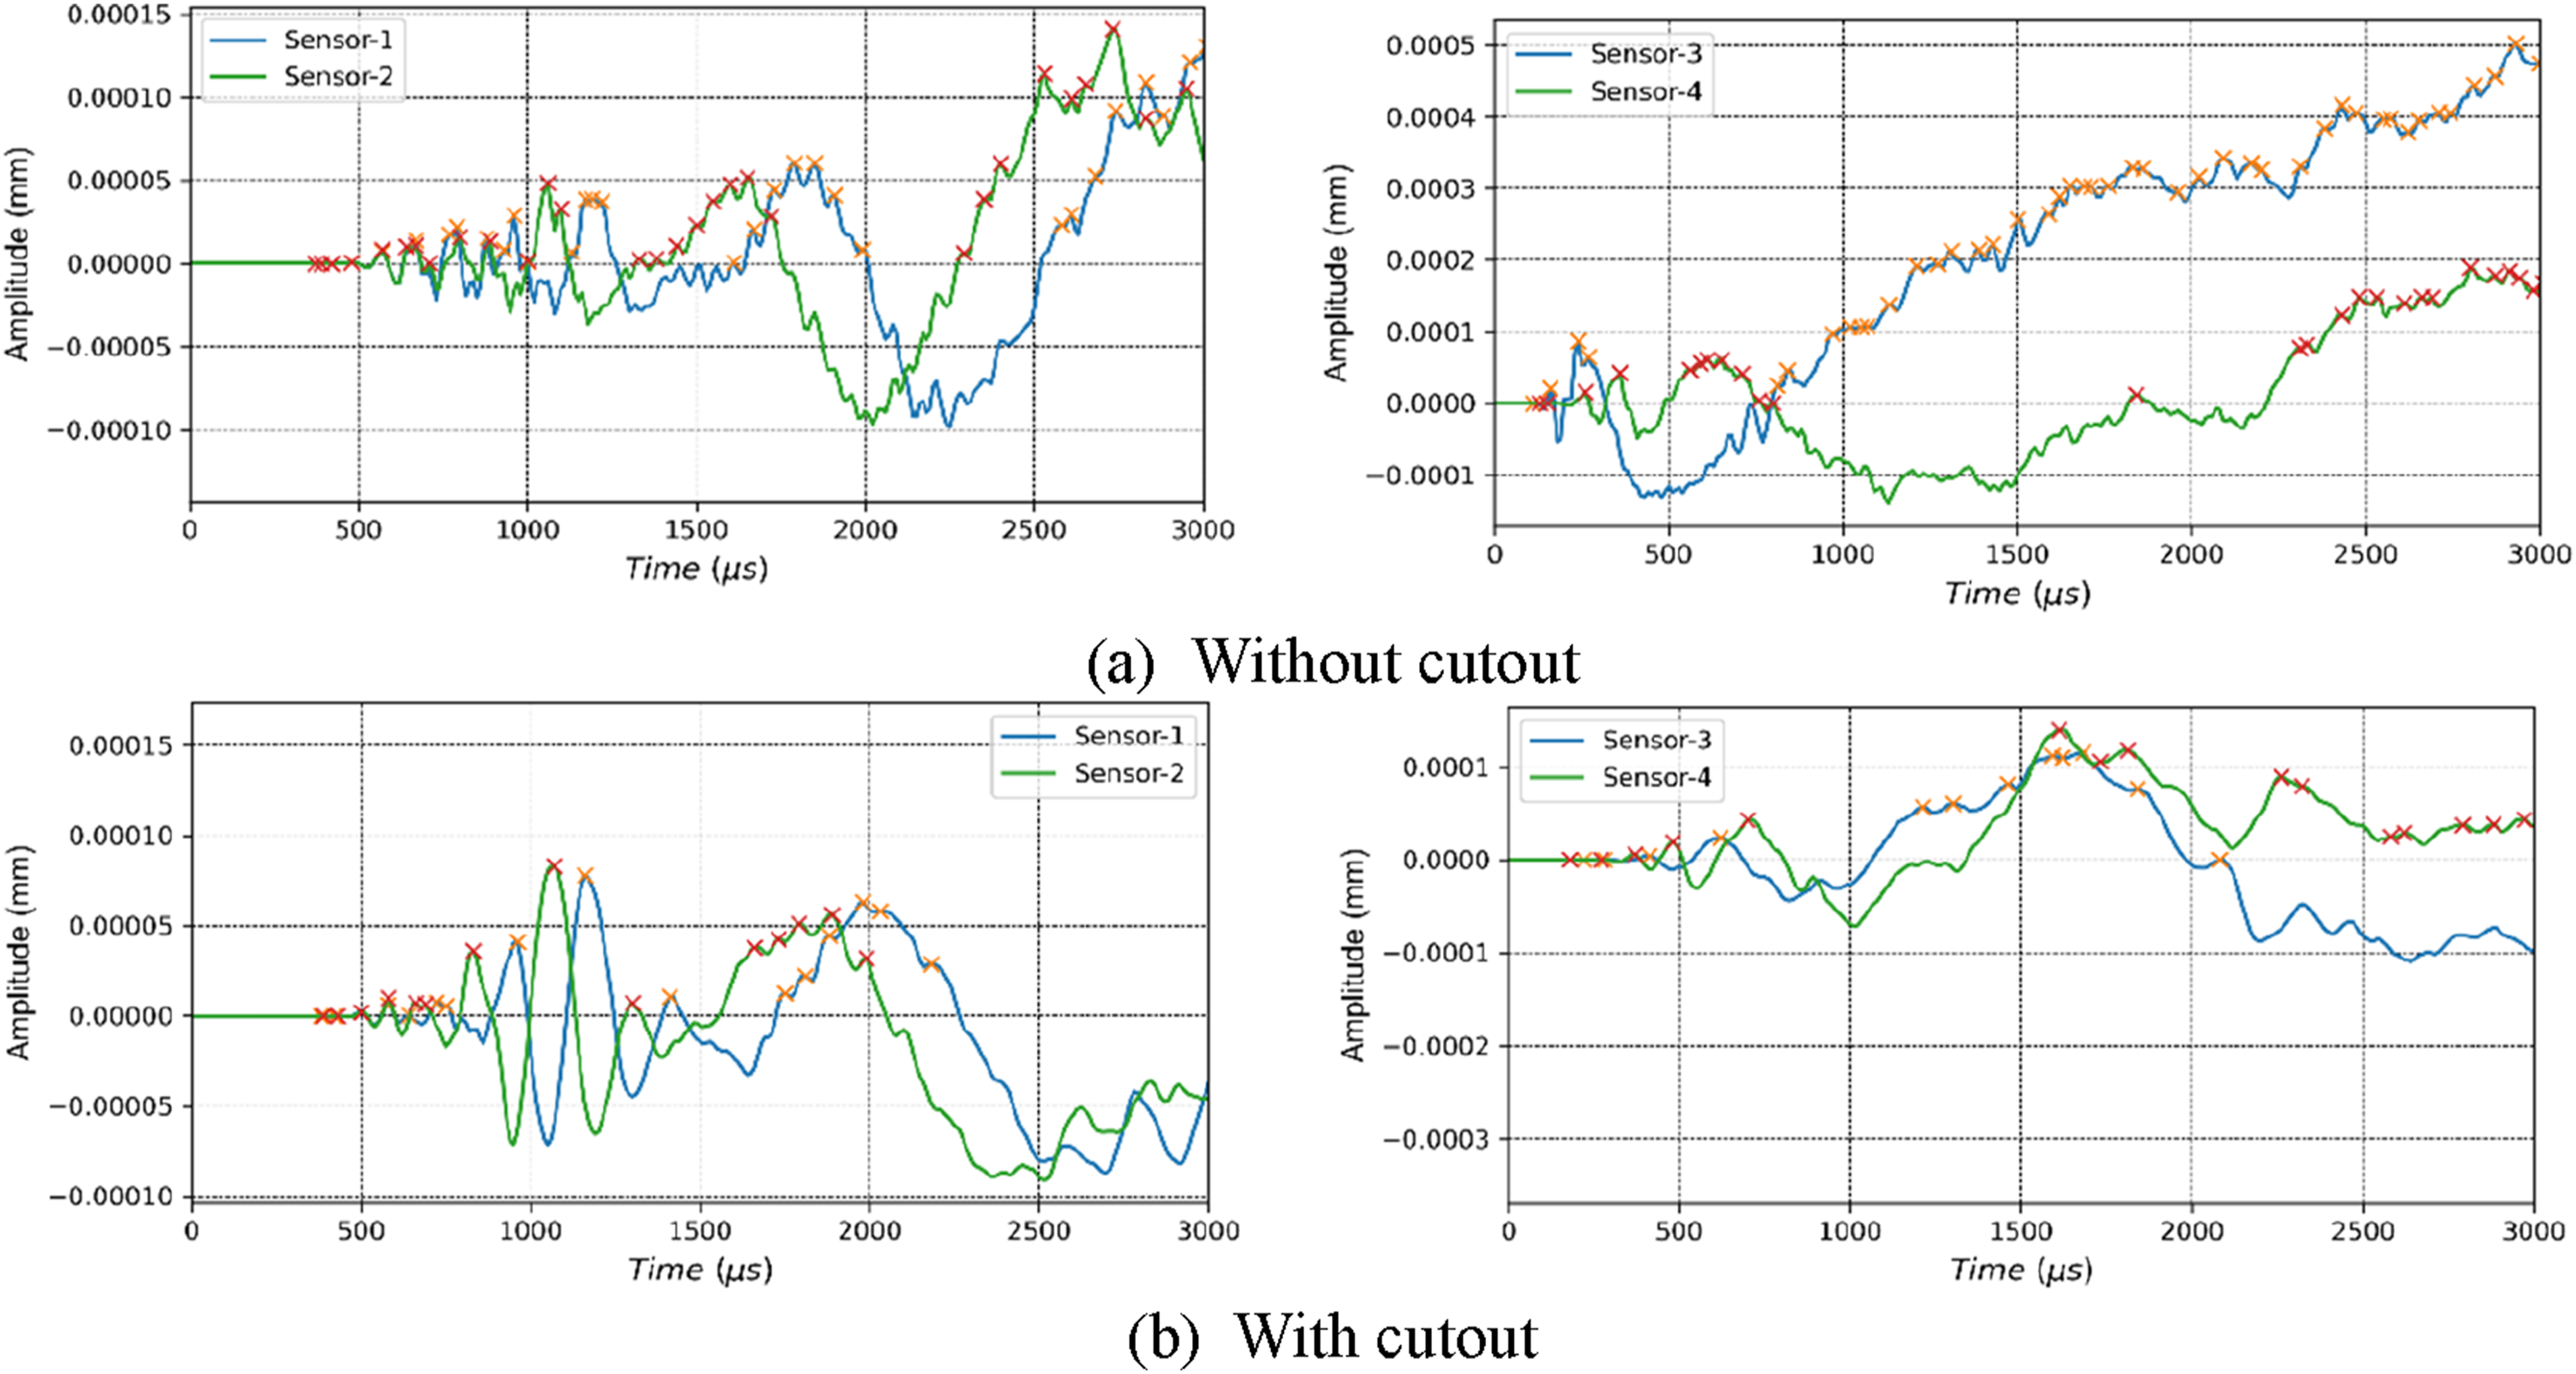
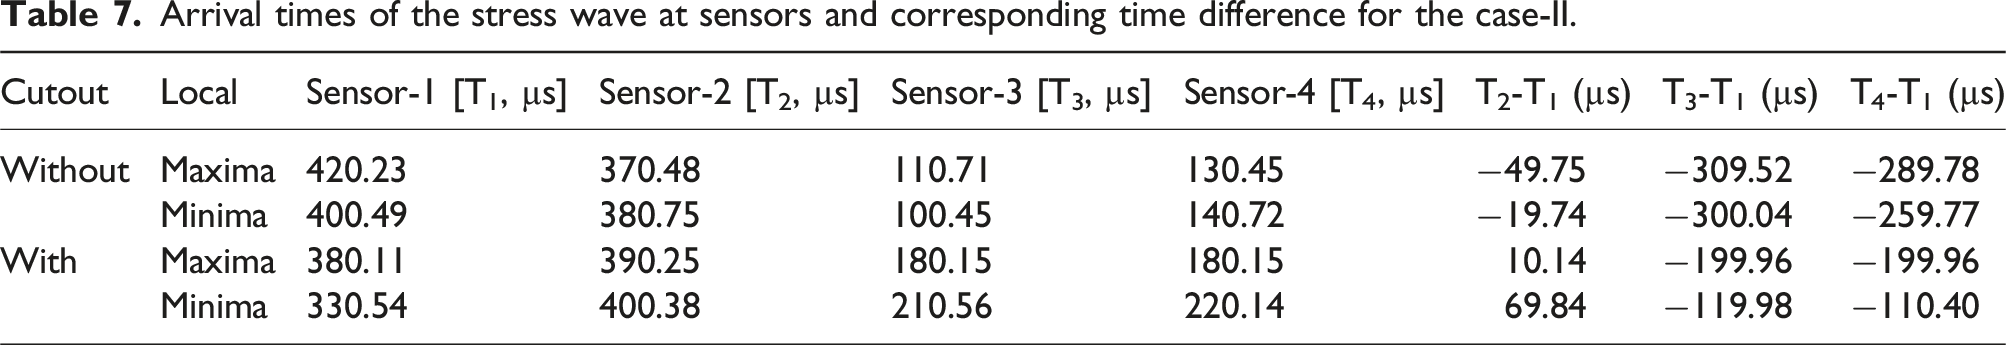
Arrival times of the stress wave at sensors and corresponding time difference for the case-II.
Case – III: 30N impulse at point 1 (without and with cutout)
Unlike high frequency excitation results, the 30N impulse excitation created low-frequency stress waves. Figure 16(a) and Figure 16(b) shows the out-of-plane deformation at 750 µs. When compared to the wave propagation in Figure 14(a) and (b), it is clear that impulse load creates low frequency but large amplitude waves. Stress wave propagation on a panel at 750µs for 30N impulse excitation at point 1 (a) without cutout and (b) with cutout.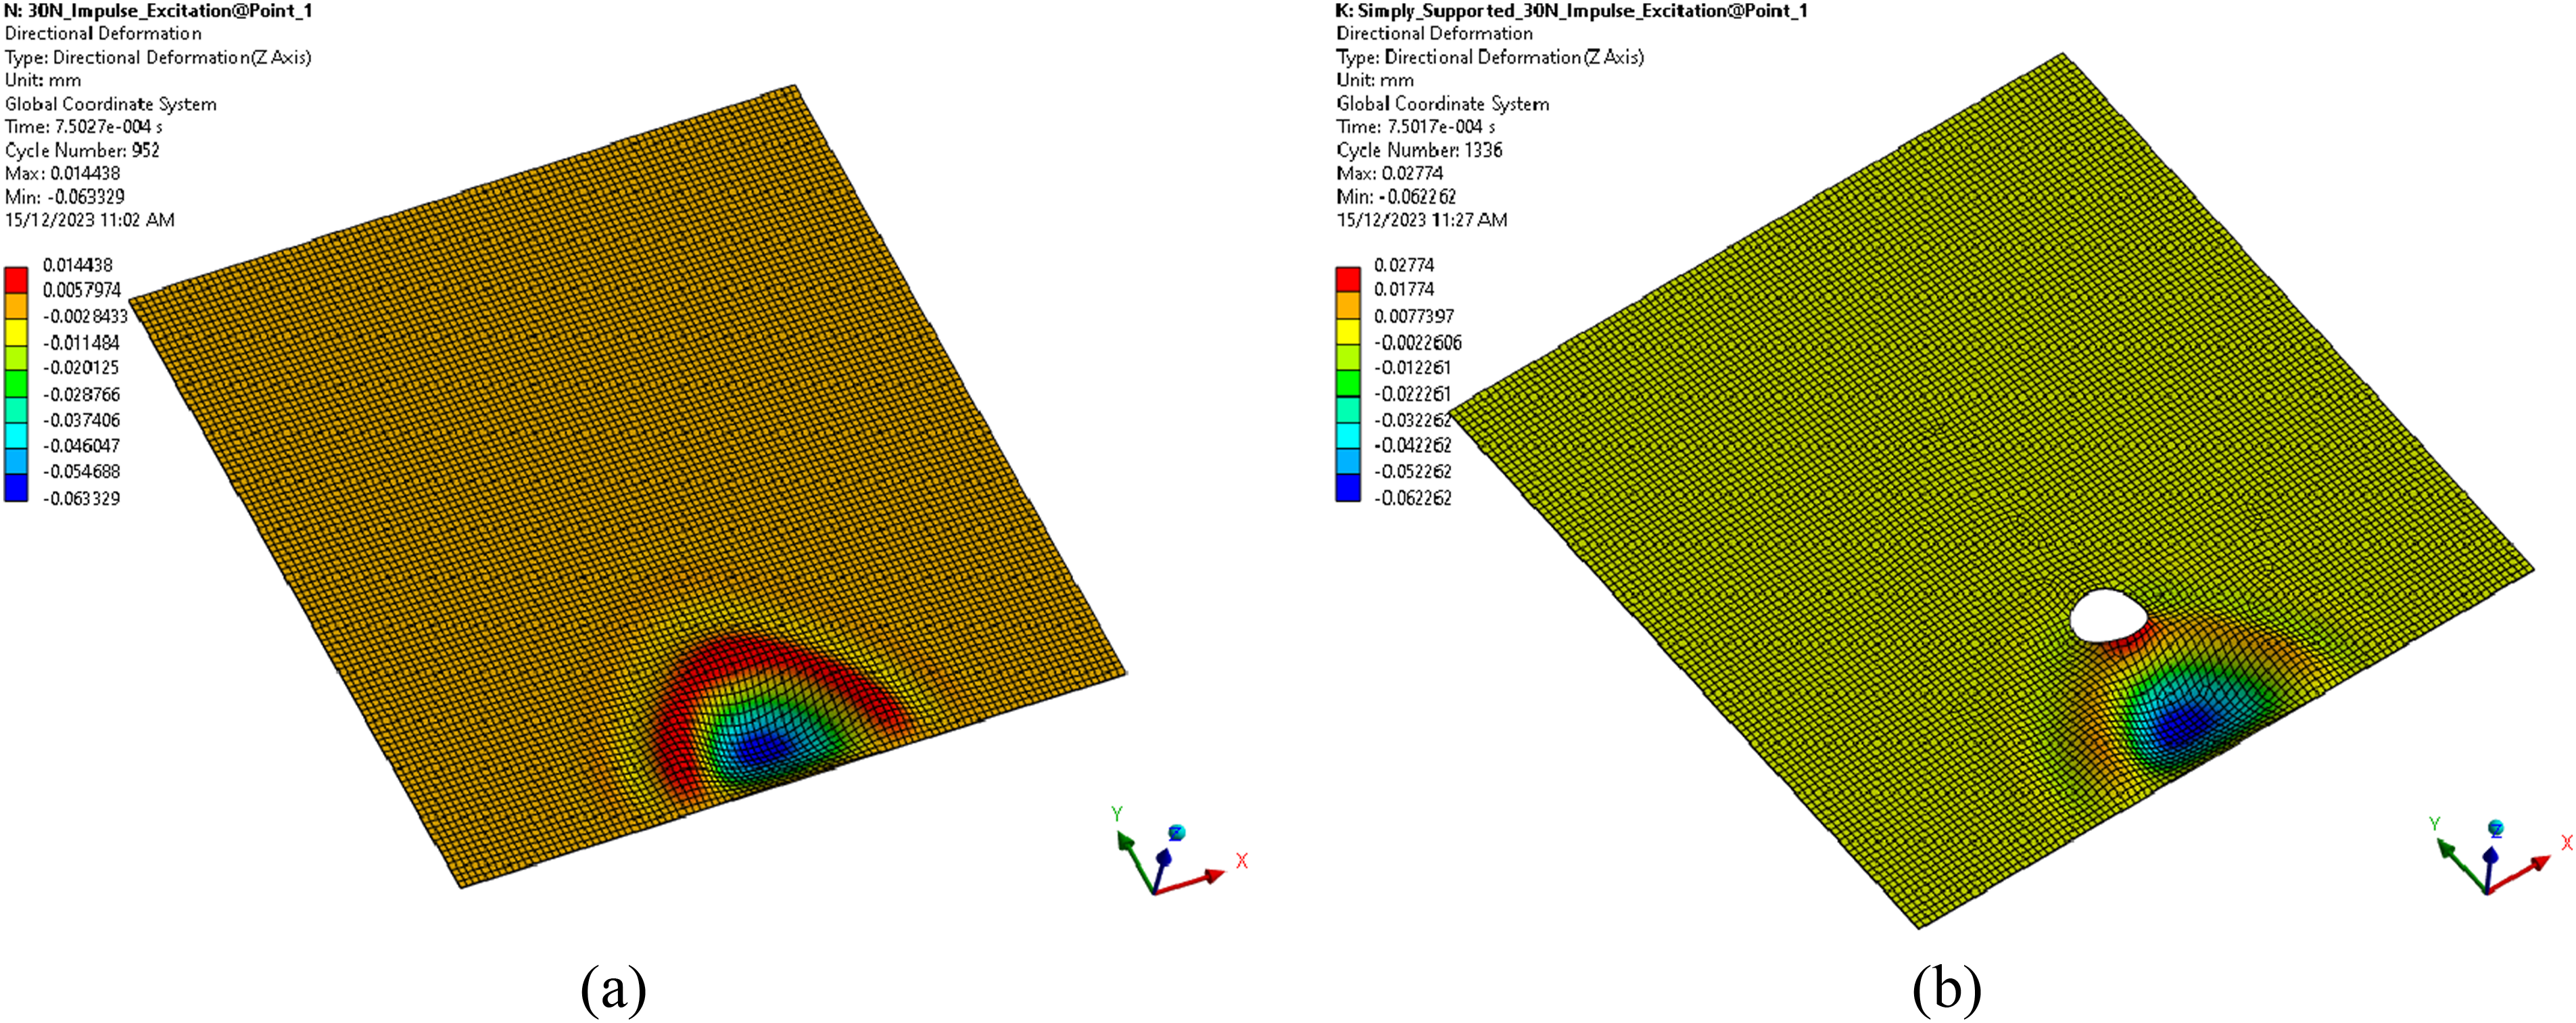
Figure 17(a) shows the plot of out-of-plane deformation at sensor 1 and 2 probe locations and Figure 17(b) shows the plot of sensor 3 and 4. Out-of-plane deformation plots showing sensor 1 & 2 and sensor 3 & 4 on left and right, respectively, for (a) without cutout panel and (b) with cutout panel for Case III.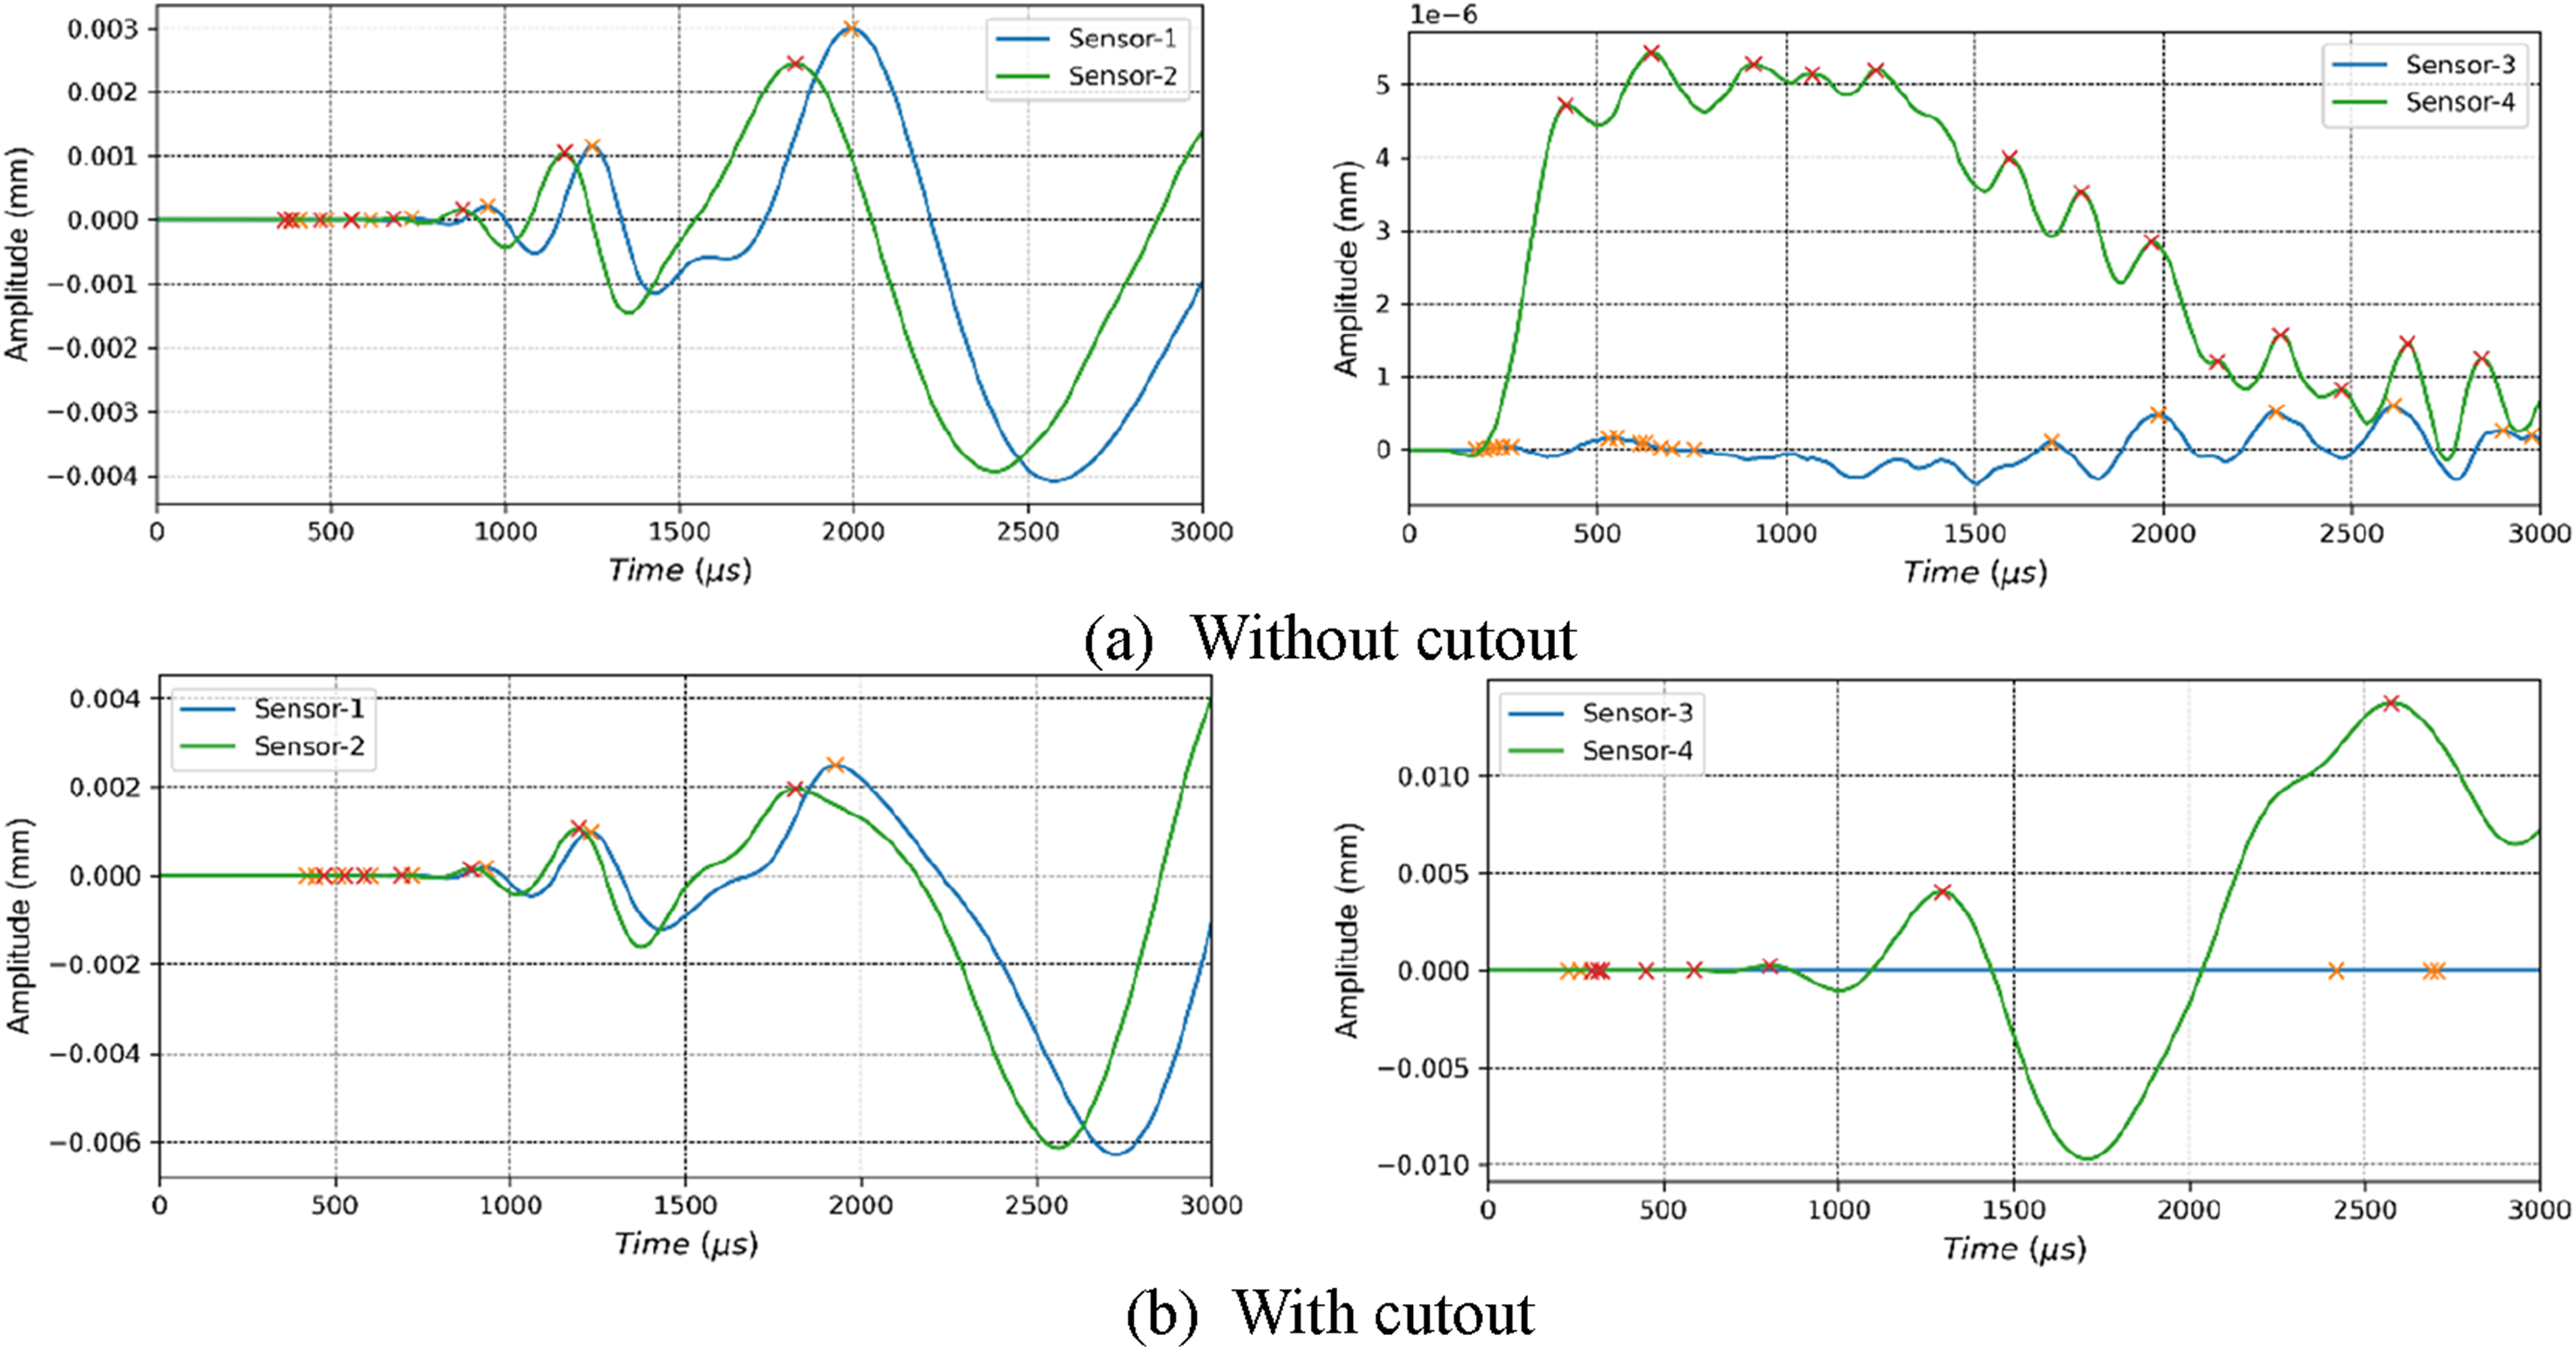
Arrival times of the stress wave at sensors and corresponding time difference for the case-II.
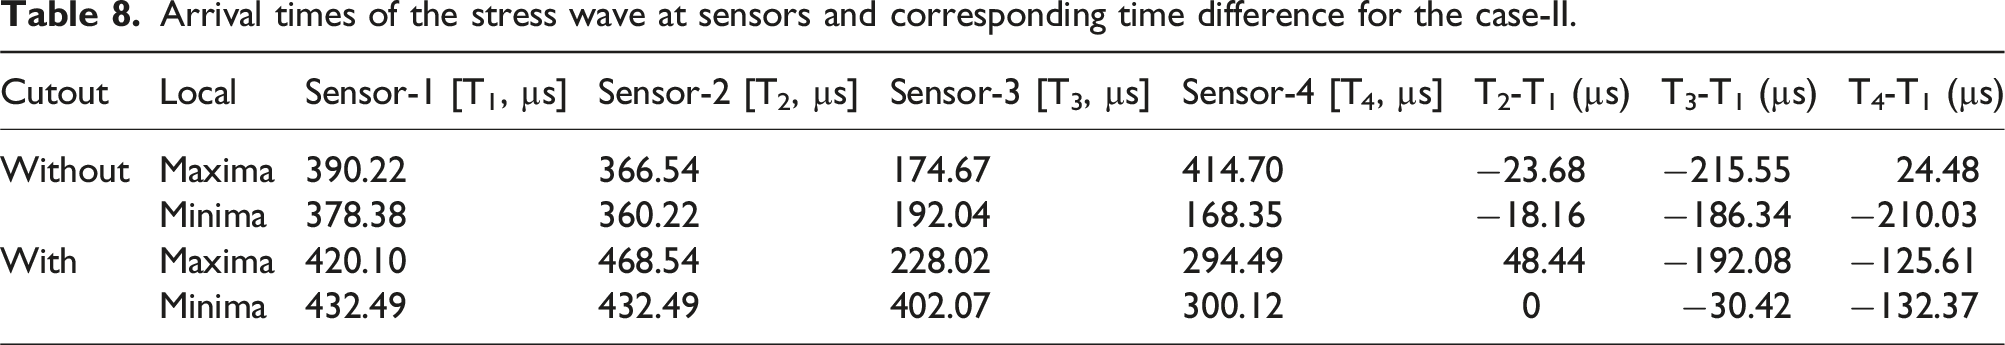
Case – IV: 30N impulse at point 7 (without and with cutout)
The illustration in Figure 18 portrays the propagation of stress waves across the surface of the panel. Notably, the observed wave propagation from point 7 exhibits a non-circular pattern, instead manifesting higher intensity along two perpendicular directions. This distinct behaviour is indicative of the influence of the woven layer situated on the upper surface of the panel and precisely captures the intricate effects introduced by the woven layer within the composite structure. Stress wave propagation on a panel at 750µs for 30N impulse excitation at (a) point 6 without cutout and (b) at point 7 for cutout.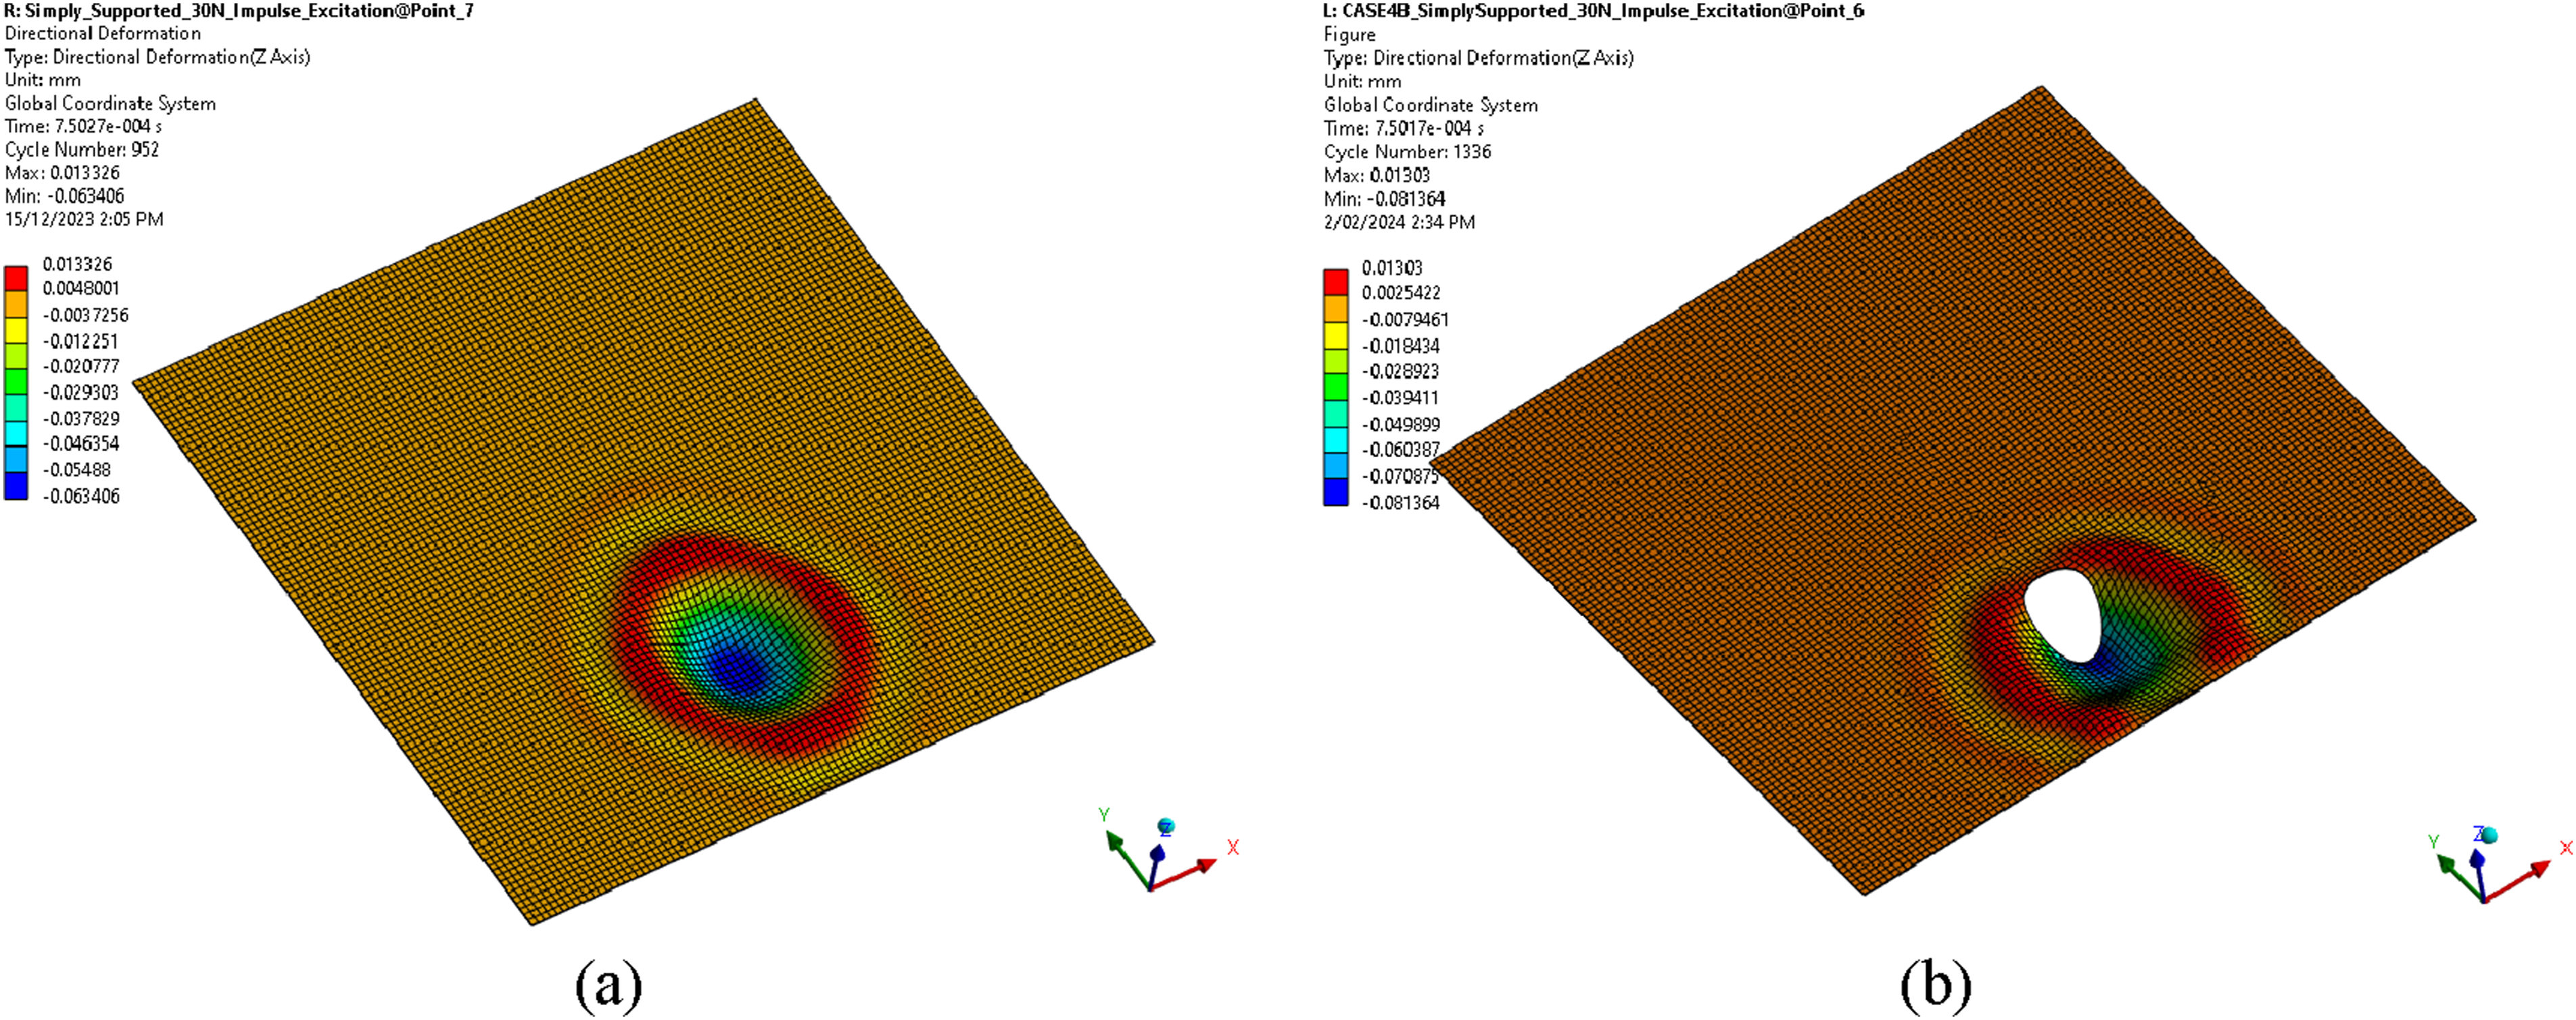
A plot in Figure 19 shows out-of plane deformations of each sensor for the case IV that shows signal arrival time and corresponding amplitude. Out-of-plane deformation plots showing sensor 1 & sensor 3 & 4 for (a) panel without cutout and (panel with cutout for Case-IV).
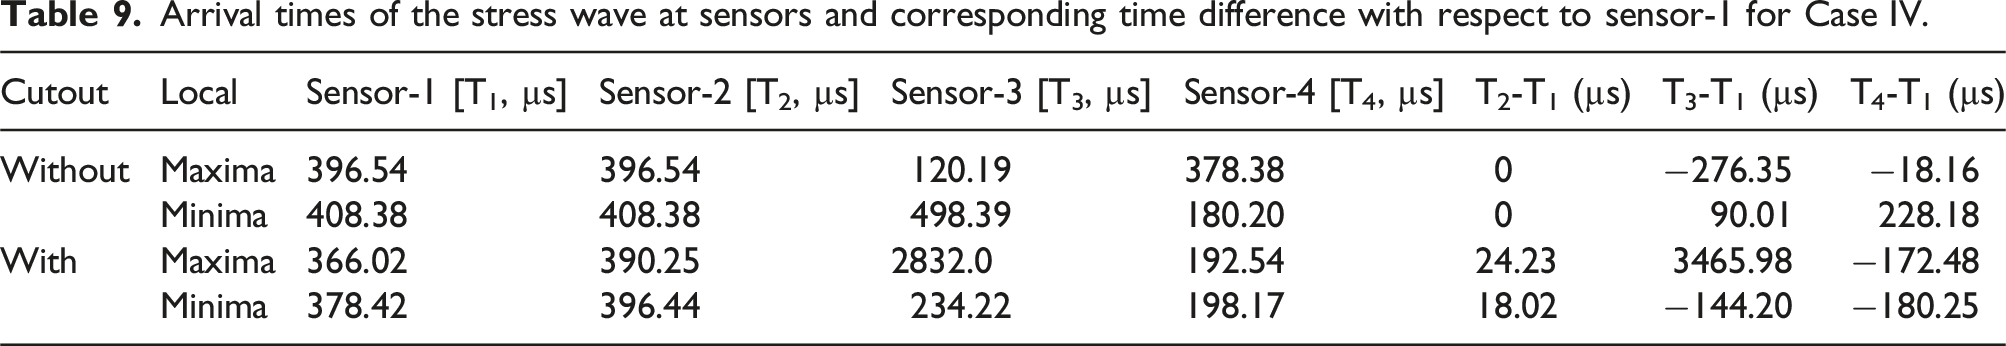
Arrival times of the stress wave at sensors and corresponding time difference with respect to sensor-1 for Case IV.
Conclusions
In this study, the objective was to develop and evaluate the robustness of numerical modelling for simulating Lamb wave propagation within laminated composite structures, employing commercial Finite Element Analysis (FEA) software. The primary motivation was to establish a validated simulation methodology for modelling the A0 Lamb wave in laminated composite structures, providing a foundation for future research endeavours. The results obtained from the numerical modelling were systematically validated with experimental data, confirming the accuracy of the proposed methodology in accurately representing antisymmetric wave propagation in laminated composite structures.
A large three-dimensional CFRP panel was used for laboratory testing, and a corresponding numerical model was created meticulously crafted in ANSYS Explicit Dynamics. Both pristine panels and those with cutouts were examined under fixed support and simply supported boundary conditions, considering scenarios involving 100 kHz and 30 N impulse loads. An out-of-plane nodal displacement probe was strategically placed at the sensor location to capture displacement over a 3000 µs timeframe. The accuracy of the numerical model was verified by comparing the Time of Arrival (ToA) with experimental test results.
Through ToA analysis, it was revealed that the FEA simulation accurately captured wave dispersion in the A0 mode. The ToA results from both numerical and experimental analysis exhibited a high degree of agreement, particularly in capturing wave propagation through the woven layer. Discrepancies observed in the T3 - T1 and T4 - T1 between the 100 kHz and 30 N impulse load scenarios were attributed to low-frequency wave propagation in the case of impulse load. This divergence was evident in the ToA of stress waves reaching sensors 1–4 from the excitation point for both pristine panels and those with cutouts.
The consistent alignment between simulation and experimental results attested to the study’s validity, indicating that numerical modelling is a promising, cost-effective alternative to labour-intensive experiments. Additionally, the streamlined data processing associated with numerical modelling suggests its potential as a standalone Structural Health Monitoring tool for composite structures.
Limitations and future study
While the results from this study are promising, there are some limitations to be addressed.
Firstly, this study primarily focuses on prismatic laminated composite panel sections with uniform cross-sections along their lengths, as these are relatively straightforward to model and analyse. However, real-world applications often involve non-prismatic sections with varying cross-sectional geometries, which introduce additional complexities due to change in wave propagation characteristics. Future experiments and numerical modelling will be conducted to validate the developed numerical model on non-prismatic sections of panels with varied lamination sequences.
Secondly, the current study focused on a single circular cutout scenario. However, real structures often have complex cutout shapes and stiffeners that can alter the AE waveform and propagation characteristics. Therefore, future research will involve numerical modelling of AE propagation in more complex composite structures to better understand these effects.
Finally, further insights can be gained by studying real structures, which will provide valuable information on how to proceed with improvements. Future studies will concentrate on practical deployment to collect more data and refine the numerical models accordingly.
Footnotes
Acknowledgements
The authors would like to thank Matthew Donough for his support in manufacturing CFRP panel using hot-press. The authors would like to acknowledge the following funding: ARC LIEF: Australasian facility for the automated fabrication of high-performance bespoke components (LE140100082) and ARC ITTC: ARC Training Centre for Automated Manufacture of Advanced Composites (IC160100040).
Authorship contribution
Binayak Bhandari: Conceptualization, methodology, Computer Programming, Validation, Formal analysis, Investigation, Writing -original draft, reviewing & editing, Visualization. Phyo Thu Maung: Reviewing original draft, assisting in experimentation, manufacturing of composite panel. Gangadhar B. Prusty: Project administration, reviewing, funding acquisition, supervision.
Declaration of generative AI and AI-assisted technologies in the writing process
During the preparation of this work the author(s) used ChatGPT 3.5 in order to smoothen the language flow. After using this tool/service, the author(s) reviewed and edited the content as needed and take(s) full responsibility for the content of the publication.
Declaration of conflicting interests
The author(s) declared no potential conflicts of interest with respect to the research, authorship, and/or publication of this article.
Funding
The author(s) disclosed receipt of the following financial support for the research, authorship, and/or publication of this article: ARC LIEF (IC160100040 and LE140100082).
Data availability statement
The raw data required to reproduce these findings is available from the authors upon formal request.