
Abstract
Shear failure in reinforced concrete (RC) beams have always been a serious concern due to its brittle fracture mode. In addition, many questions are raised about the accuracy of current design guidelines for predicting the shear resistance contribution of externally bonded carbon fiber-reinforced polymers (EB-CFRPs) to the ultimate shear strength of strengthened RC beams, particularly with regard to the inverse interaction of the shear contribution between steel-stirrups and EB-CFRPs. The main objective of the present study is to implement experimental and numerical tests to develop analytical and numerical models for RC beams strengthened in shear using EB-CFRPs. Emphasis is placed on the negative inverse interaction between the steel-stirrups and the EB-CFRPs as the ratio of EB-CFRP-to-steel-stirrups increases with increasing the CFRP rigidity (CFRP thickness and CFRP width). The inverse interaction is not included in the design models proposed by most current guidelines, although it has a considerable effect on shear resistance as predicted by the guidelines. In fact, the shear contribution associated with EB-CFRP decreases as the ratio of EB-CFRP-to-steel-stirrups increases. Therefore, proposing reliable effective strains by including these parameters improve the calculated shear contribution of EB-CFRPs. First, an analytical model is proposed for CFRP effective strain considering the inverse interaction between EB-CFRPs and steel-stirrups. Afterward, a validation of the proposed model with experimental data is done by conducting a parametric study of the increasing trends with respect to the ratio of EB-CFRP-to-steel-stirrups. A numerical finite-element model for the reduction factor and the corresponding effective strain based on the inverse interactions between EB-CFRPs and steel-stirrups is also proposed, and the results are compared with various current guidelines. The results are presented in terms of shear crack patterns, load-midspan deflections, shear stresses, strain responses along the fibers, maximum strain profiles for all the CFRPs and specimens, applied shear forces and strains for all the steel-stirrups and EB-CFRPs, and interactions between steel-stirrups and EB-CFRPs based on their maximum strain contributions at the maximum shear forces and the maximum strain they experience after shear failure.
Keywords
Introduction
Fiber-reinforced polymers (FRPs) have been extensively applied for various industrial purposes, including the construction industry, due to their numerous advantages such as high strength-to-weight ratio, high resistance at low temperature, low cost, and ease of installation. One of their applications in construction is to rehabilitate damaged concrete structures. Therefore, researchers have been conducting various experimental, analytical, and numerical investigations to calculate their contribution to the strengthening of concrete structures. Shear failures in reinforced concrete (RC) beams have always been a serious concern for practicing engineers because of their complexity and tendency to brittle failure without warning. However, there are many contradictions in the existing analytical models to calculate the shear contribution of FRP to the ultimate shear strength of RC beams strengthened with externally bonded FRP (EB-FRP). Various parameters are missing in these analytical models, which affect the accuracy of the guideline predictions for the contribution of EB-FRP to the ultimate load-carrying capacity of RC beams. The inverse interaction between steel-stirrups and EB-FRP, the size effect, the angle of the shear crack, the distribution of the shear crack over the EB-FRP, and the effect of bond-slip between concrete and EB-FRP are examples of such parameters. The inverse interaction between EB-FRP and steel-stirrups has been recently shown by researchers to have an important impact. Indeed, it was shown that increasing the amount of internal and external reinforcement resulted in various distributions of shear cracks, leading to less effective bond length.1–5 In addition, there are some issues regarding these models that need to be questioned. Khalifa et al. 1 proposed a model that relates the fraction of the effective strain and the ultimate strain to the EB-FRP ratio, where neither the shear crack distribution nor the EB-FRP-to-steel-stirrup ratio is considered. Chaallal et al. 2 proposed a model where the effective strain is a function of the total reinforcement (EB-FRP + steel-stirrups), in which the EB-FRP-to-steel-stirrup ratio is not considered. Therefore, this model shows the effective strain for specimens that are not even strengthened with EB-FRP and does not consider inverse interaction between internal and external reinforcements. The reduction factor proposed by Pellegrino and Modena 3 does not include the EB-FRP-to-steel-stirrup ratio, but rather the reduction factor is a function that relates the shear gain due to EB-FRP to the ratio A s .E s /ρ f .E f . In addition, Chen 5 defined a model in which the mobilization factors (reduction factors) were attributed to EB-FRP and steel-stirrups where a single shear crack opening is concerned, without considering the distribution or the nonlinearity of shear cracks. On the other hand, Mofidi and Chaallal 4 considered the shear crack distribution by converting the trapezoidal area to the rectangular area in the zone where EB-FRP contributes to the total shear resistance of the beam by including the effective bond length and width. Although similar to the model proposed by Chaallal et al., 2 this model is based on the total ratio (i.e., internal steel-stirrups plus external EB-FRP), not considering the ratio of the EB-FRP to the steel-stirrups.
The current research study aims to improve the model proposed by Mofidi and Chaallal 4 by focusing on the effect of inverse interactions between EB-ERP and steel-stirrups on the one hand and the shear crack distribution on the other. First, a database of 100 previous experimental studies was gathered and analyzed; then, based on regression of laboratory test results, an analytical model was developed and compared to existing guidelines. After this, a parametric finite-element (FE) study was conducted considering different ratios of FRP-to-steel-stirrups to evaluate FRP effective strain. The results of the numerical study were evaluated based on the shear crack distributions, shear stress, and strain profiles with respect to the direction of fibers crossed by the main shear crack, the strain distribution factor, the effective strain, the load-deflection responses (concrete, steel-stirrups, and fibers), and the amounts of EB-FRP and steel-stirrup strain versus the applied shear force.
Research significance
Research on the effect of the inverse interaction between EB-CFRP and steel-stirrups is not considered in current guidelines, and the number of studies on this topic is limited. However, this phenomenon has a considerable influence on the components of an RC beam strengthened with EB-FRP, in the sense that not recognizing its effect results in misconceptions about the shear contributions of EB-FRP and steel-stirrups. Furthermore, numerical studies of this inverse interaction are limited, although FEA facilitates the prediction of component responses during the loading process and paves the way for proposing models that consider the effect of major parameters. The present study plays a role in better understanding the inverse interaction between EB-FRP and steel-stirrups and developing analytical and numerical models for future research.
Proposed model
The model proposed by Mofidi and Chaallal
4
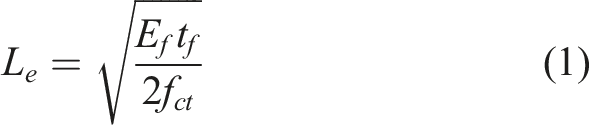
shows better accuracy than most current guidelines and considers the effect of total shear reinforcement on the shear crack distribution because the effective bond length is reduced as the total amount of shear reinforcement increases. The accuracy of this model reflects its better prediction of EB-FRP shear contribution compared to the reviewed guidelines. This model replaces the trapezoidal areas with rectangular areas of effective length (L
e
) and effective width (w
fe
). The effective length was obtained based on the model of Neubauer and Rostasy
6
:

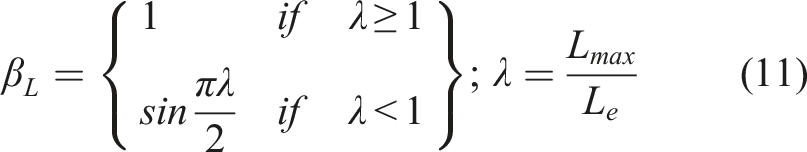
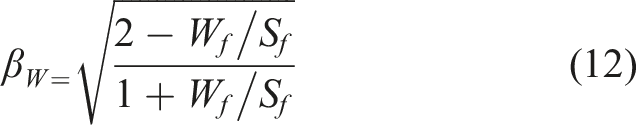
For calculating w
fe
, this model proves that both the number of stirrups
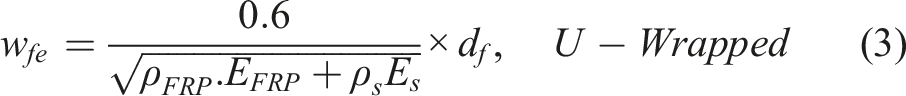
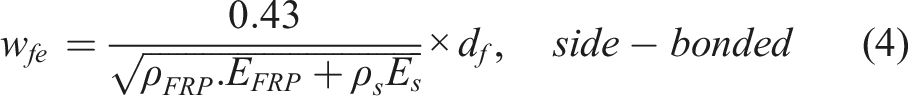
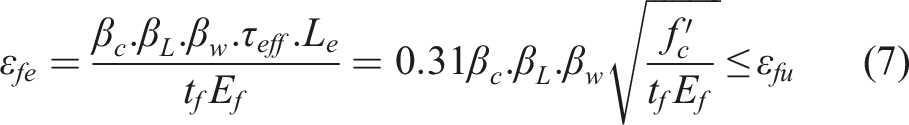
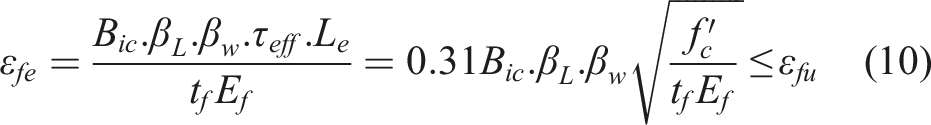
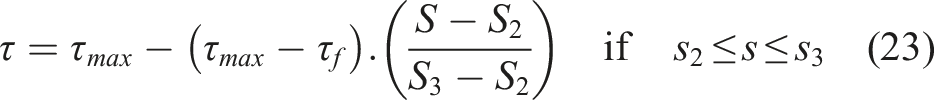
The effective strain is given by:
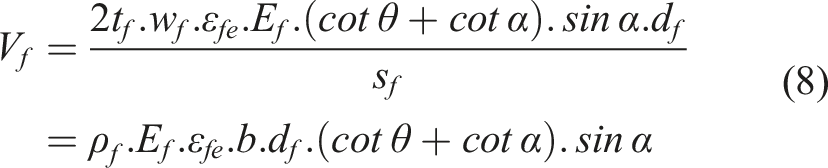
The contribution of FRP composites to shear resistance can be determined using the following equation:
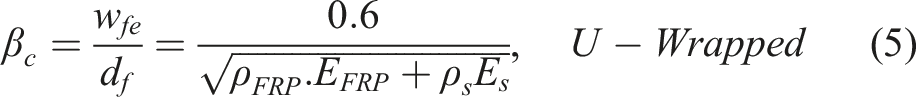
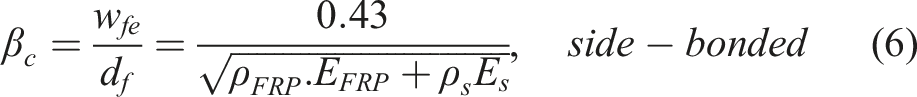
The proposed model addresses the observed inverse interaction between EB-FRP and internal steel reinforcement by substituting the βc coefficient in Mofidi and Chaallal 4 effective strain with a factor accounting for shear crack distribution evolution and the ρ FRP .E FRP /ρ s .E s ratio.
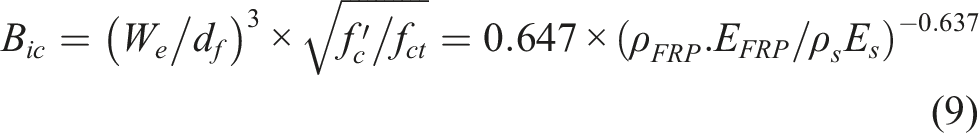
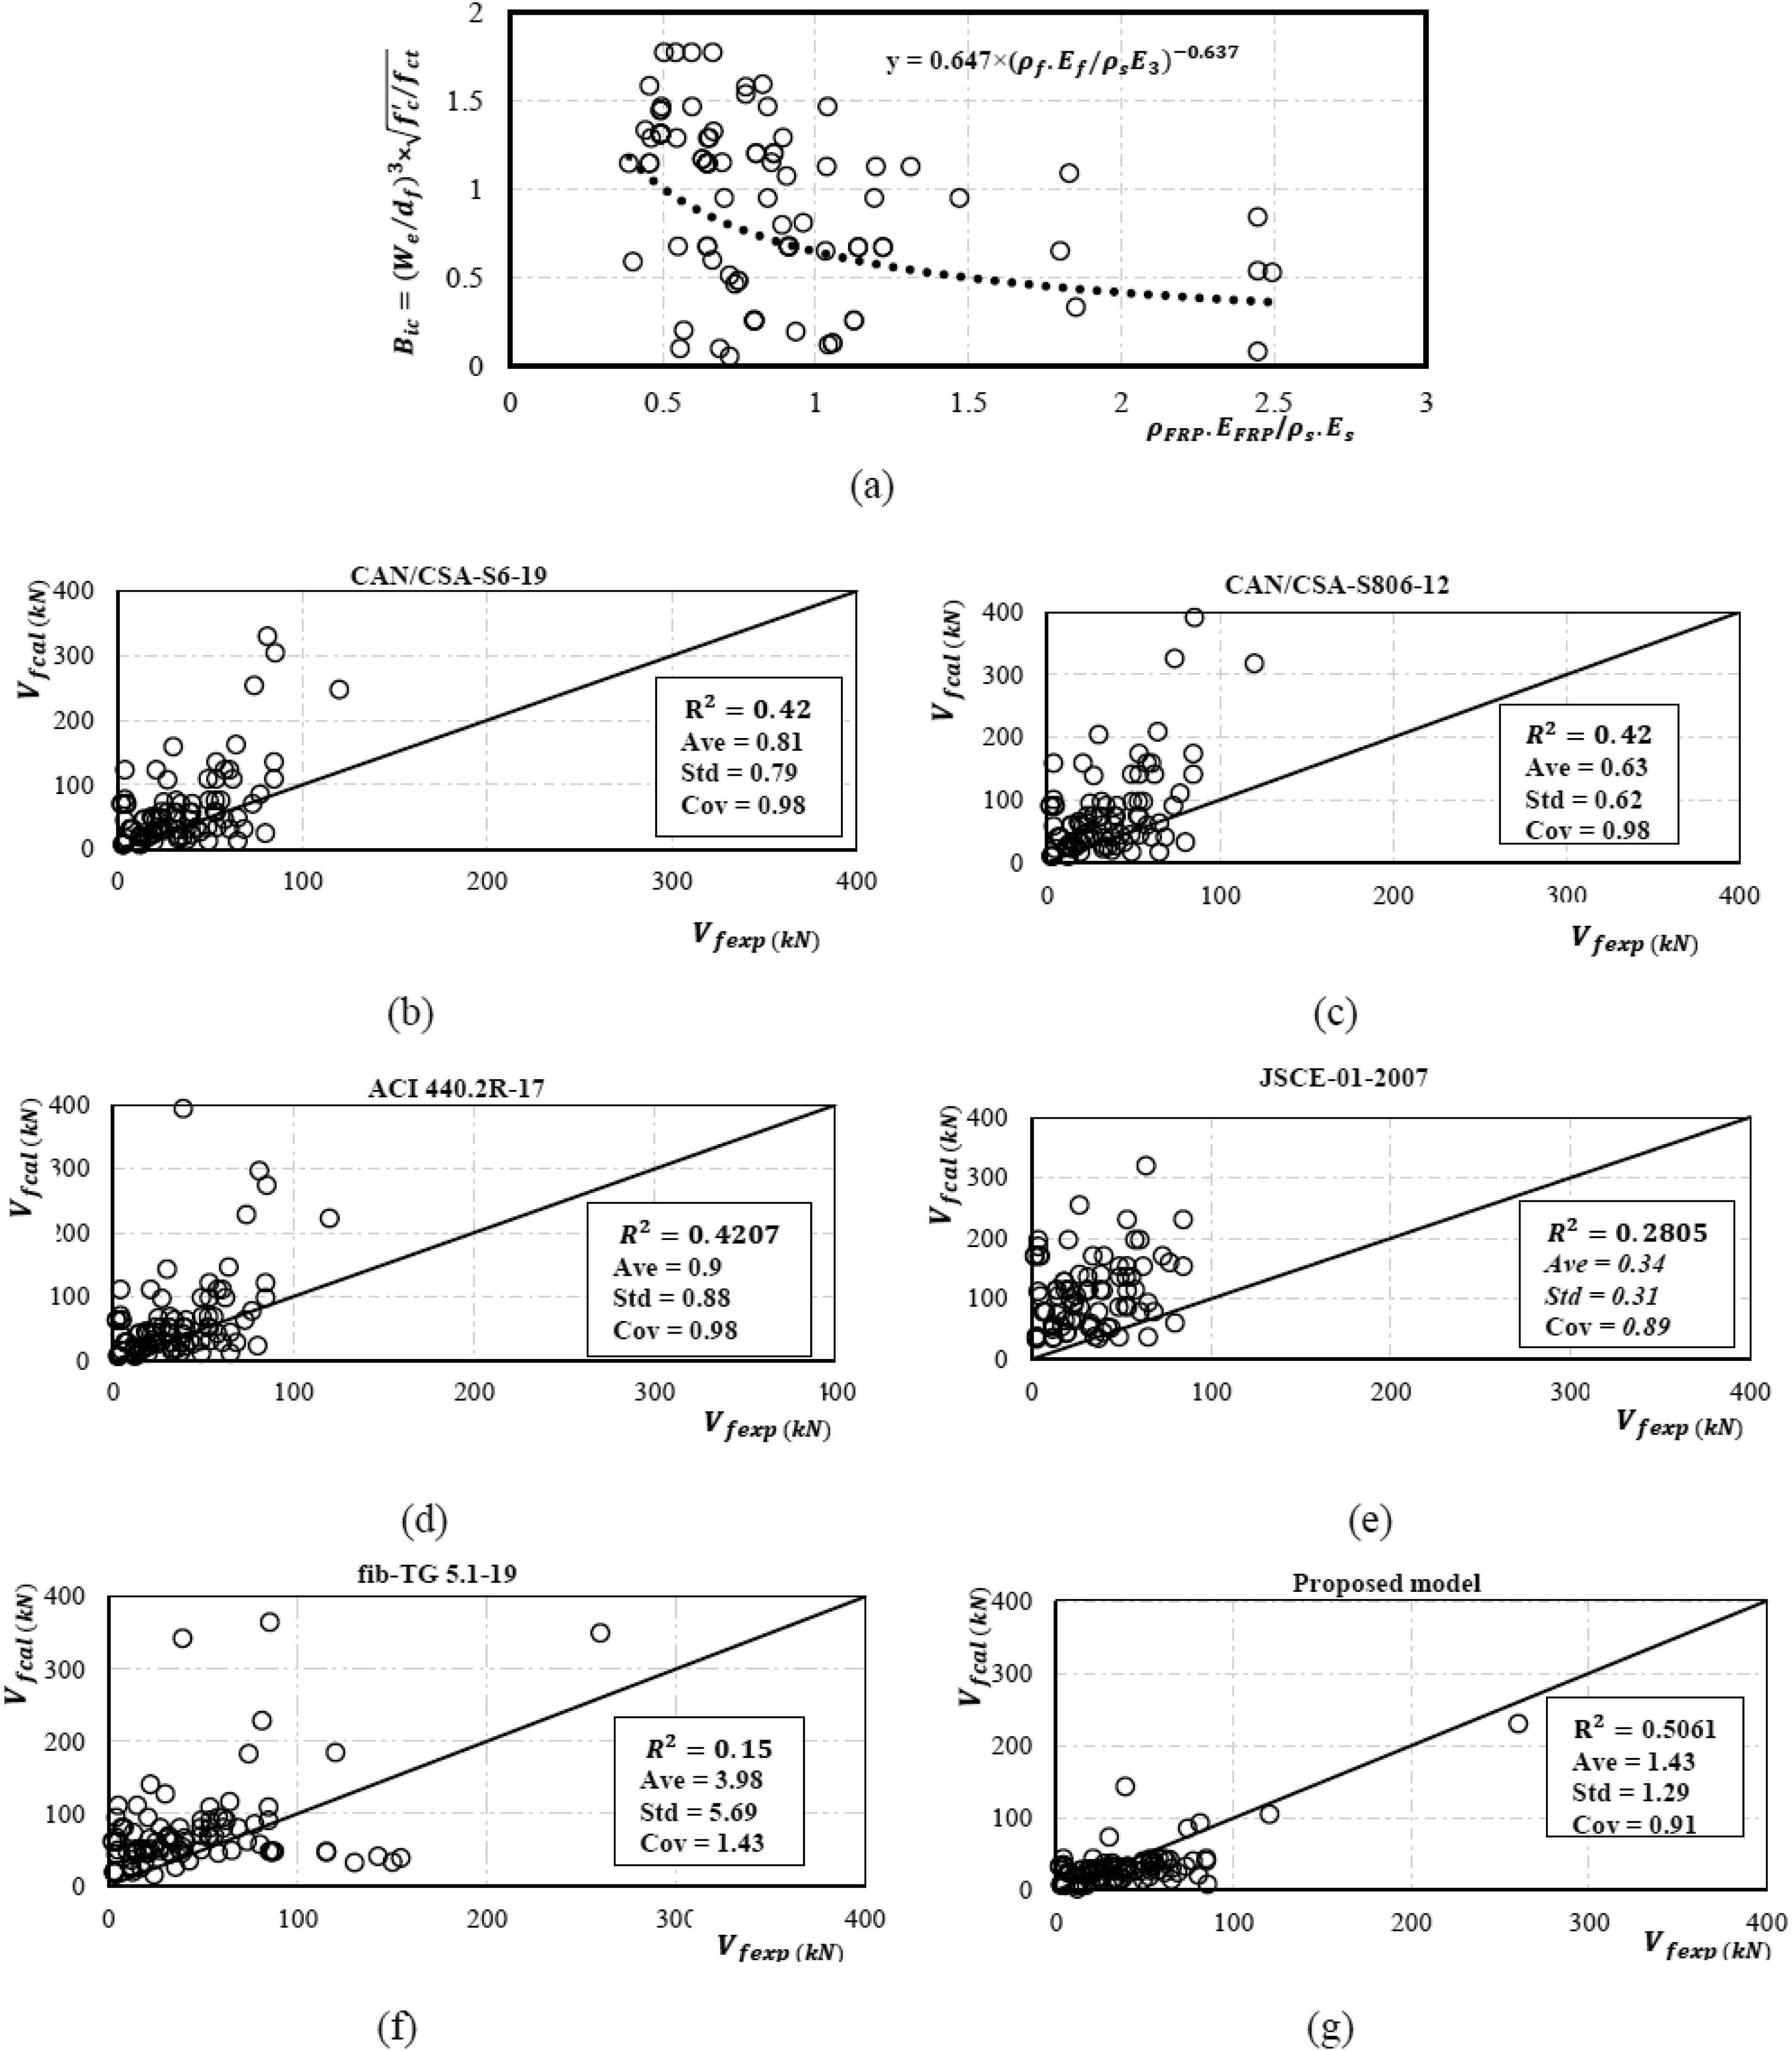
Previous studies2,3,7 show that increasing ratios of EB-FRP and steel-stirrups result in broader shear crack distributions, accelerating EB-FRP debonding. This debonding progresses until the entire zone loses strength. Strengthening with EB-FRP leads to wider shear crack distributions, reducing EB-FRP’s contribution to total shear resistance as the ratio of external to internal shear reinforcement increases. The proposed model addresses these trends by considering crack distribution coefficient (β ic ) based on the ratio of external to internal reinforcement ρ FRP .E FRP /ρ s .E s .

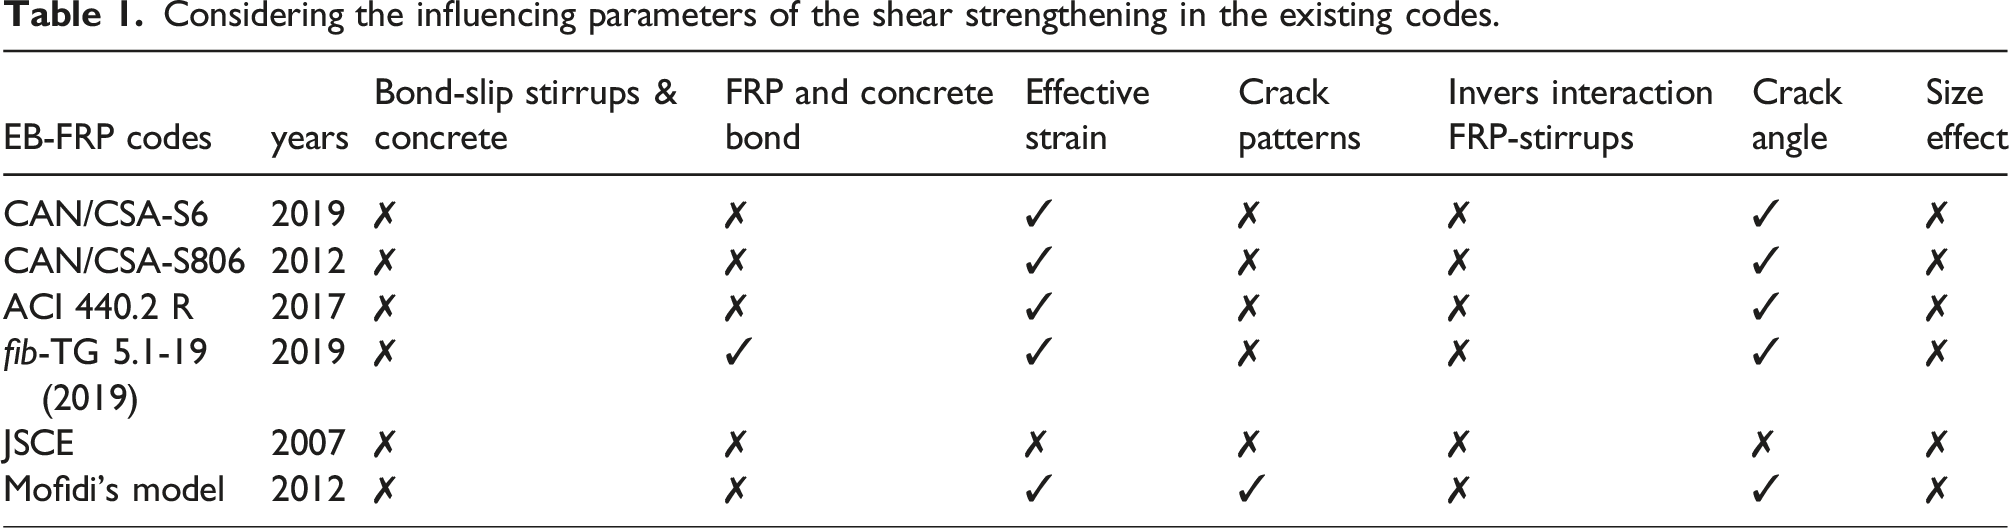
Considering the influencing parameters of the shear strengthening in the existing codes.
(a)
Verification of the proposed model
A database of specimens strengthened in shear with U-shaped EB-CFRP and steel-stirrups based on several studies13–18 was gathered to evaluate the validity of the proposed model (Figure 1). All the database specimens were strengthened with steel-stirrups and U-shaped EB-CFRP to evaluate and compare the shear resistance of EB-CFRP in the presence of steel-stirrups. The comparison was drawn between the proposed model and the guidelines. Figure 1 presents the calculated Vf(cal) according to current codes and design guidelines19–23 versus experimental tests Vf(exp) in terms of R2, average, estimated standard deviation based on a sample (STDEV), and covariance. Indeed, the proposed model shows the highest R2(R2=0.5061), followed by the Canadian guidelines19,20 and those from the ACI 21 showing the same R2 value (0.42). The lowest R2 is related to JSCE 23 (R2=0.28), which does not use the effective strain for calculating V f , and fib-TG 5.1 22 (R2=0.15). This demonstrates that the inverse shear interaction between internal and external shear reinforcement as well as the shear crack distribution should be included in the calculation of V f .
Parametric finite-element analysis
Definitions of studied specimens
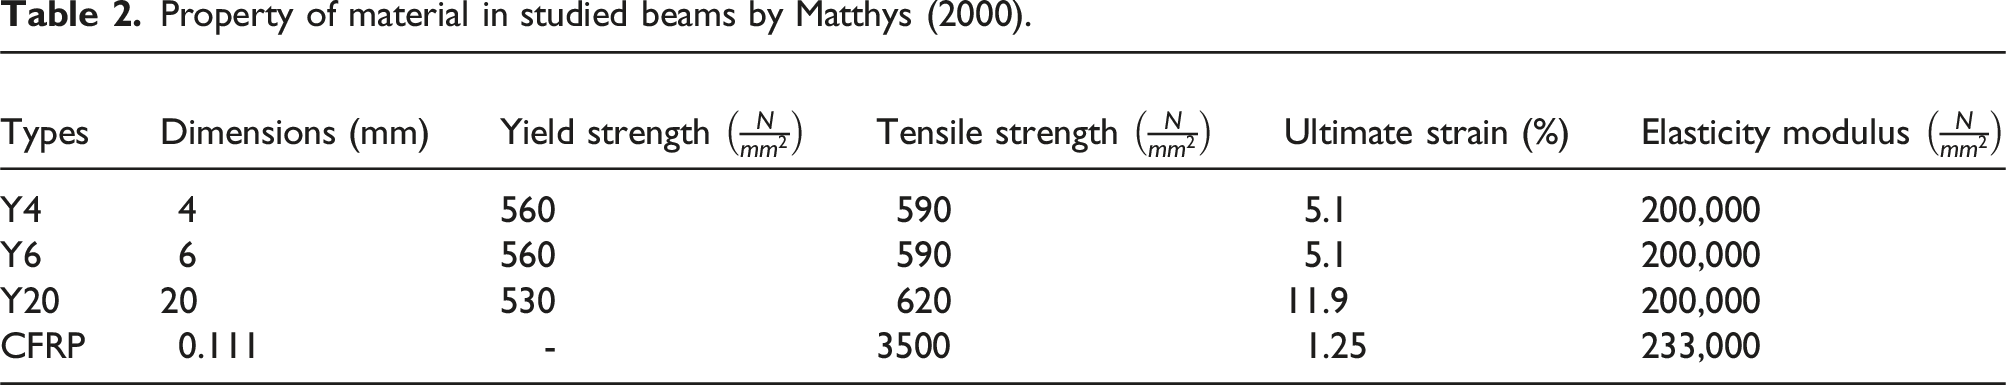
Parametric and numerical studies were carried out on 10 beams. The reference beam was adopted from the Matthys
24
study, which used B3 (control beam) and B5 with small modifications in steel-stirrups and concrete strength (using Y4 instead of Y6 for the steel-stirrups and Details of beams: (a) cross-sections of the specimens (mm) and (b) elevation of beam and position of four points loading. Property of material in studied beams by Matthys (2000). Specimens and the amounts of EB-FRP and steel-stirrups in the current numerical parametric study.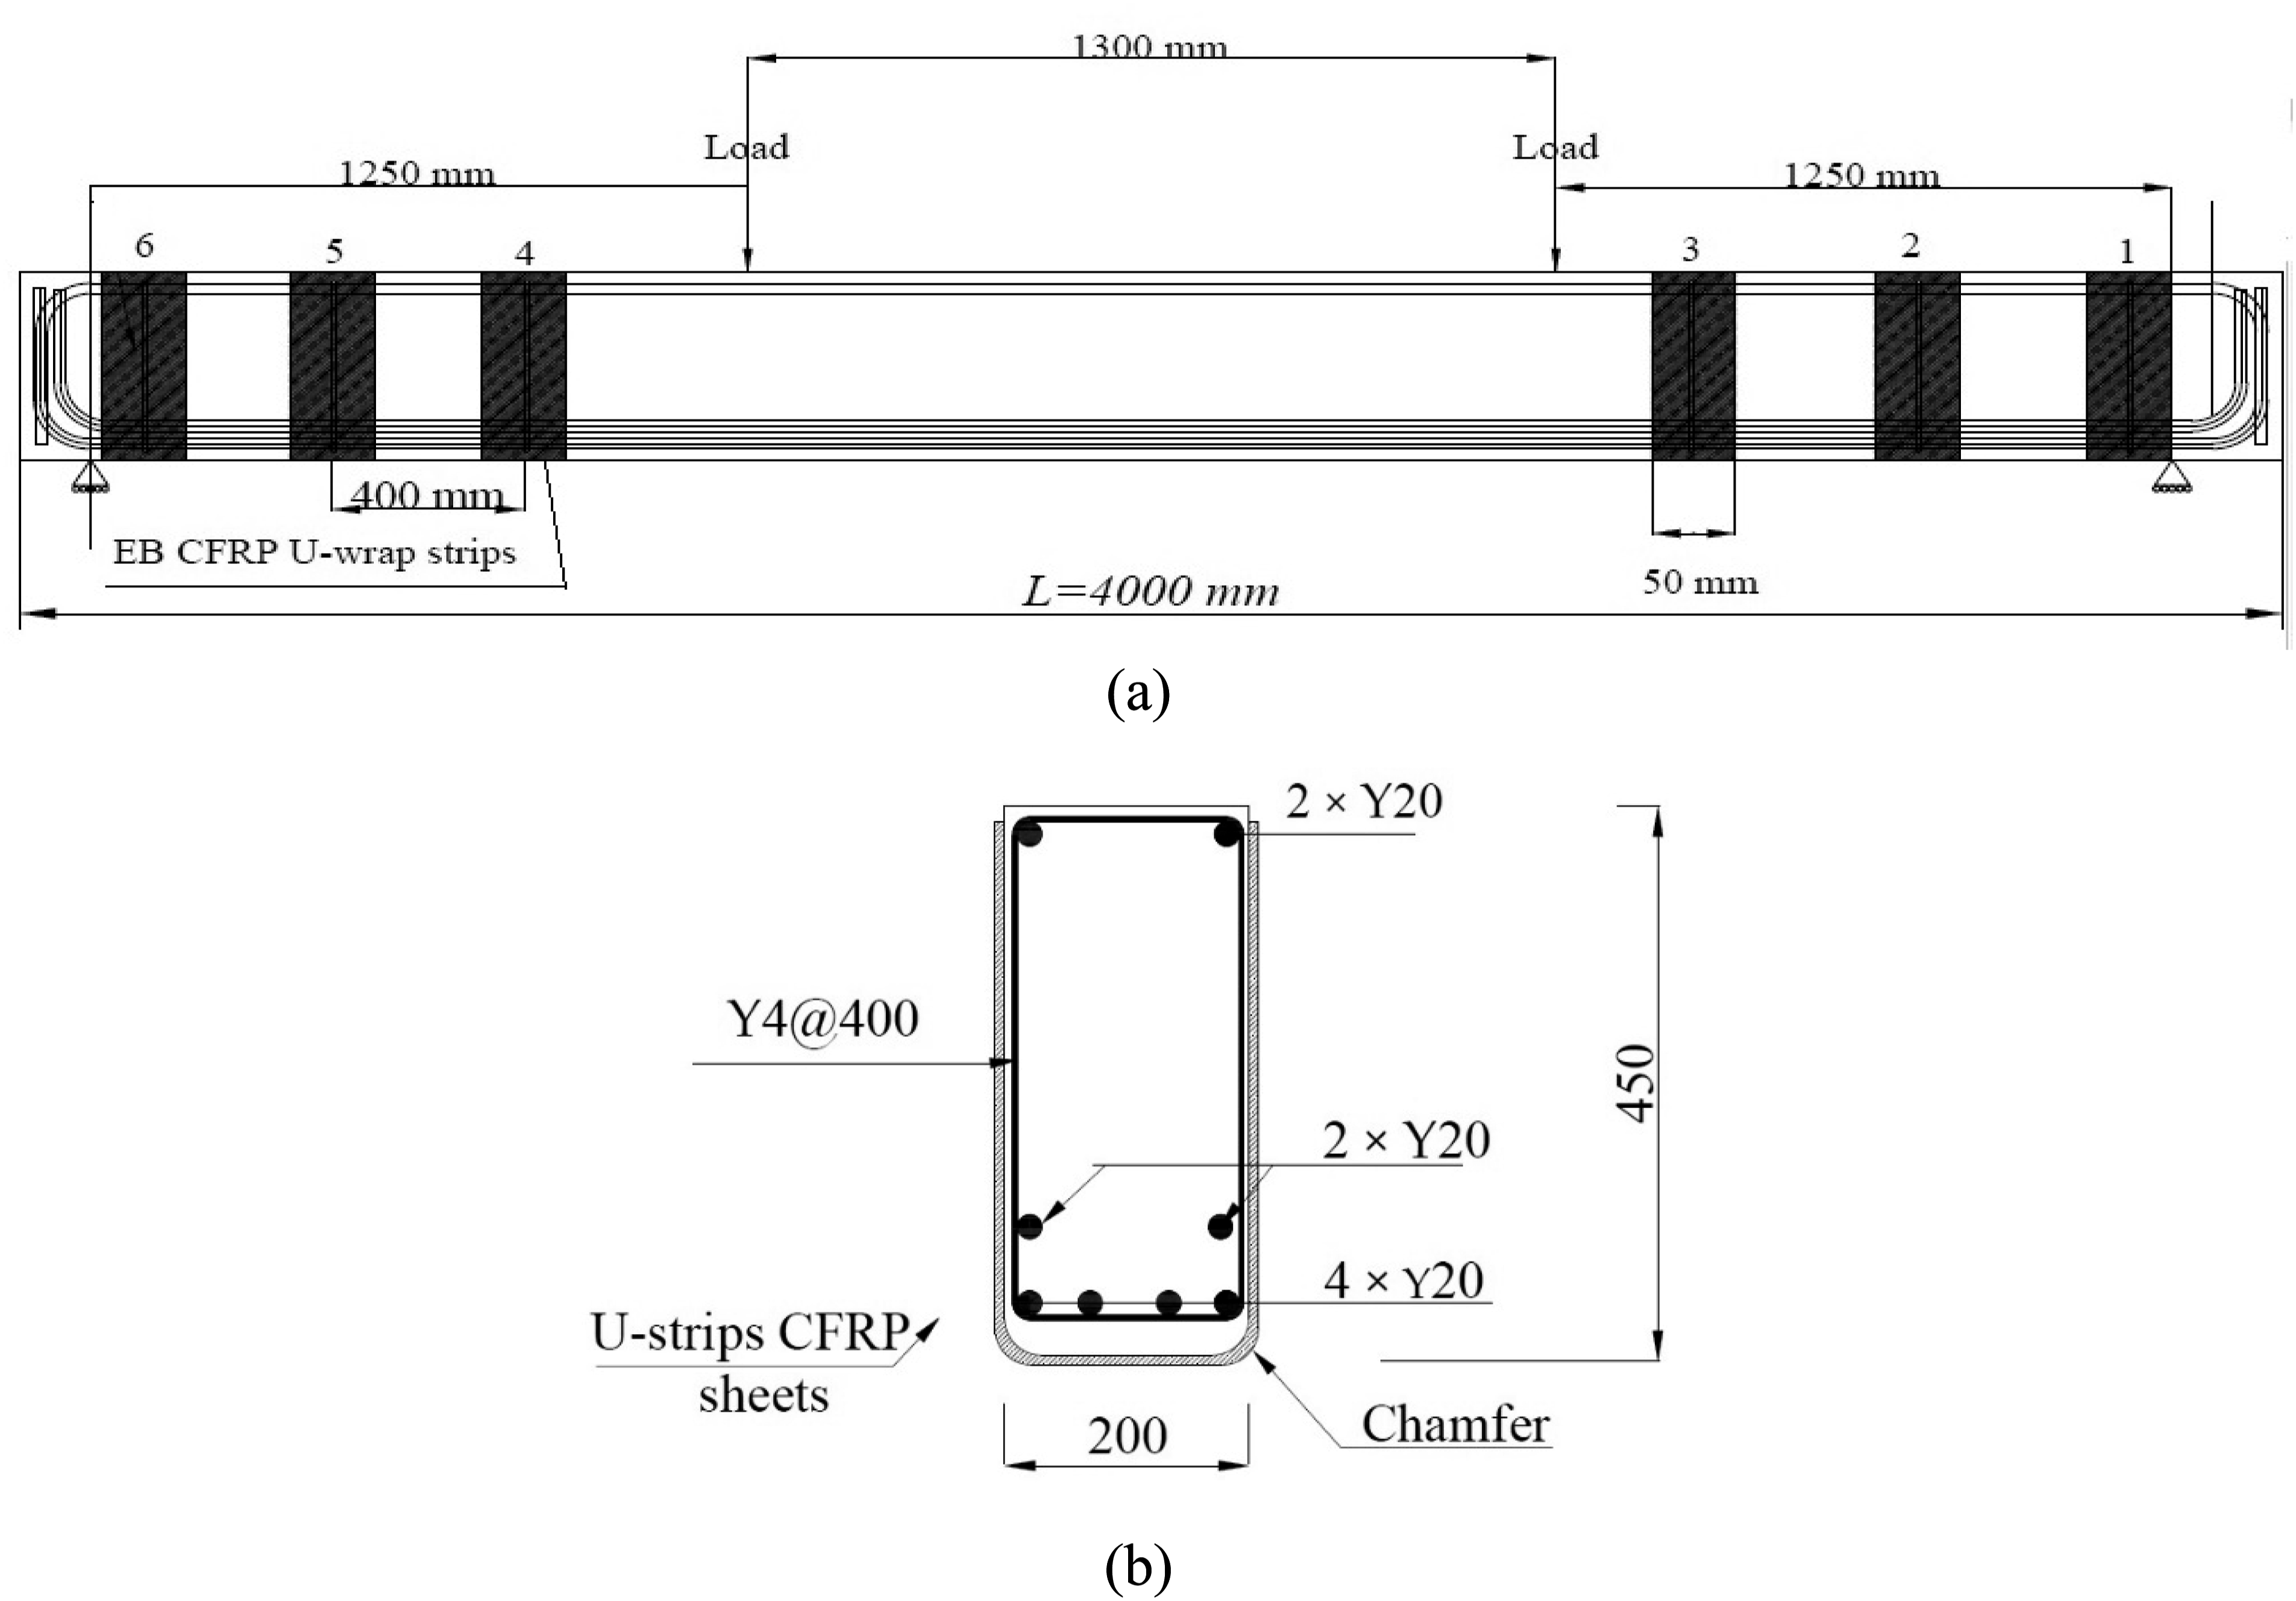
Suggested FE modeling
A summary of the nonlinear finite-element analysis (FEA) assumptions implemented in the current parametric study corresponding to the concrete materials, the definitions of a crack in concrete, steel reinforcement, CFRP sheet, bond-slip behavior between CFRP and concrete and between steel bars and concrete, and the types of analysis adopted for the simulation model is presented in this section (Figure 3). To reduce the time required for analysis and increase the accuracy of the results (by selecting a small discretization) and with regard to the behavior of the beam (bending in its own plane), two-dimensional (2D) FEA (plane stress technique) was applied for the concrete, the support, the load plate, and the cohesive layer between concrete and EB-CFRP, as well as for the cohesive layer between the concrete and the steel reinforcement. As for the CFRP sheets and the steel bars, two-dimensional truss elements were used to simply transfer the load in the direction of the truss elements. To avoid convergence challenges, especially post-failure of specimens (due to brittle behavior of concrete and nonlinearity of the bond-slip layer) produced by static analysis methods such as Newton-Raphson and arc-length analysis, explicit analysis (central difference analysis in ABAQUS) was used in this study.
5
However, the options (load scheme, loading time, damping ratio, and time increment size) should be selected cautiously in the dynamic analysis to obtain a reliable response when solving static problems. Properties and assumption of the materials implemented in FE simulations (a) tension-softening curves for the concrete,
24
(b) damage in the concrete versus shear retention factor,
22
(c) bond-slip model between concrete and CFRP,
10
(d) bond-slip model between concrete and steel-stirrups,
11
(e) stress-strain relation for steel reinforcement, and (f) stress-strain relation for CFRP fabrics.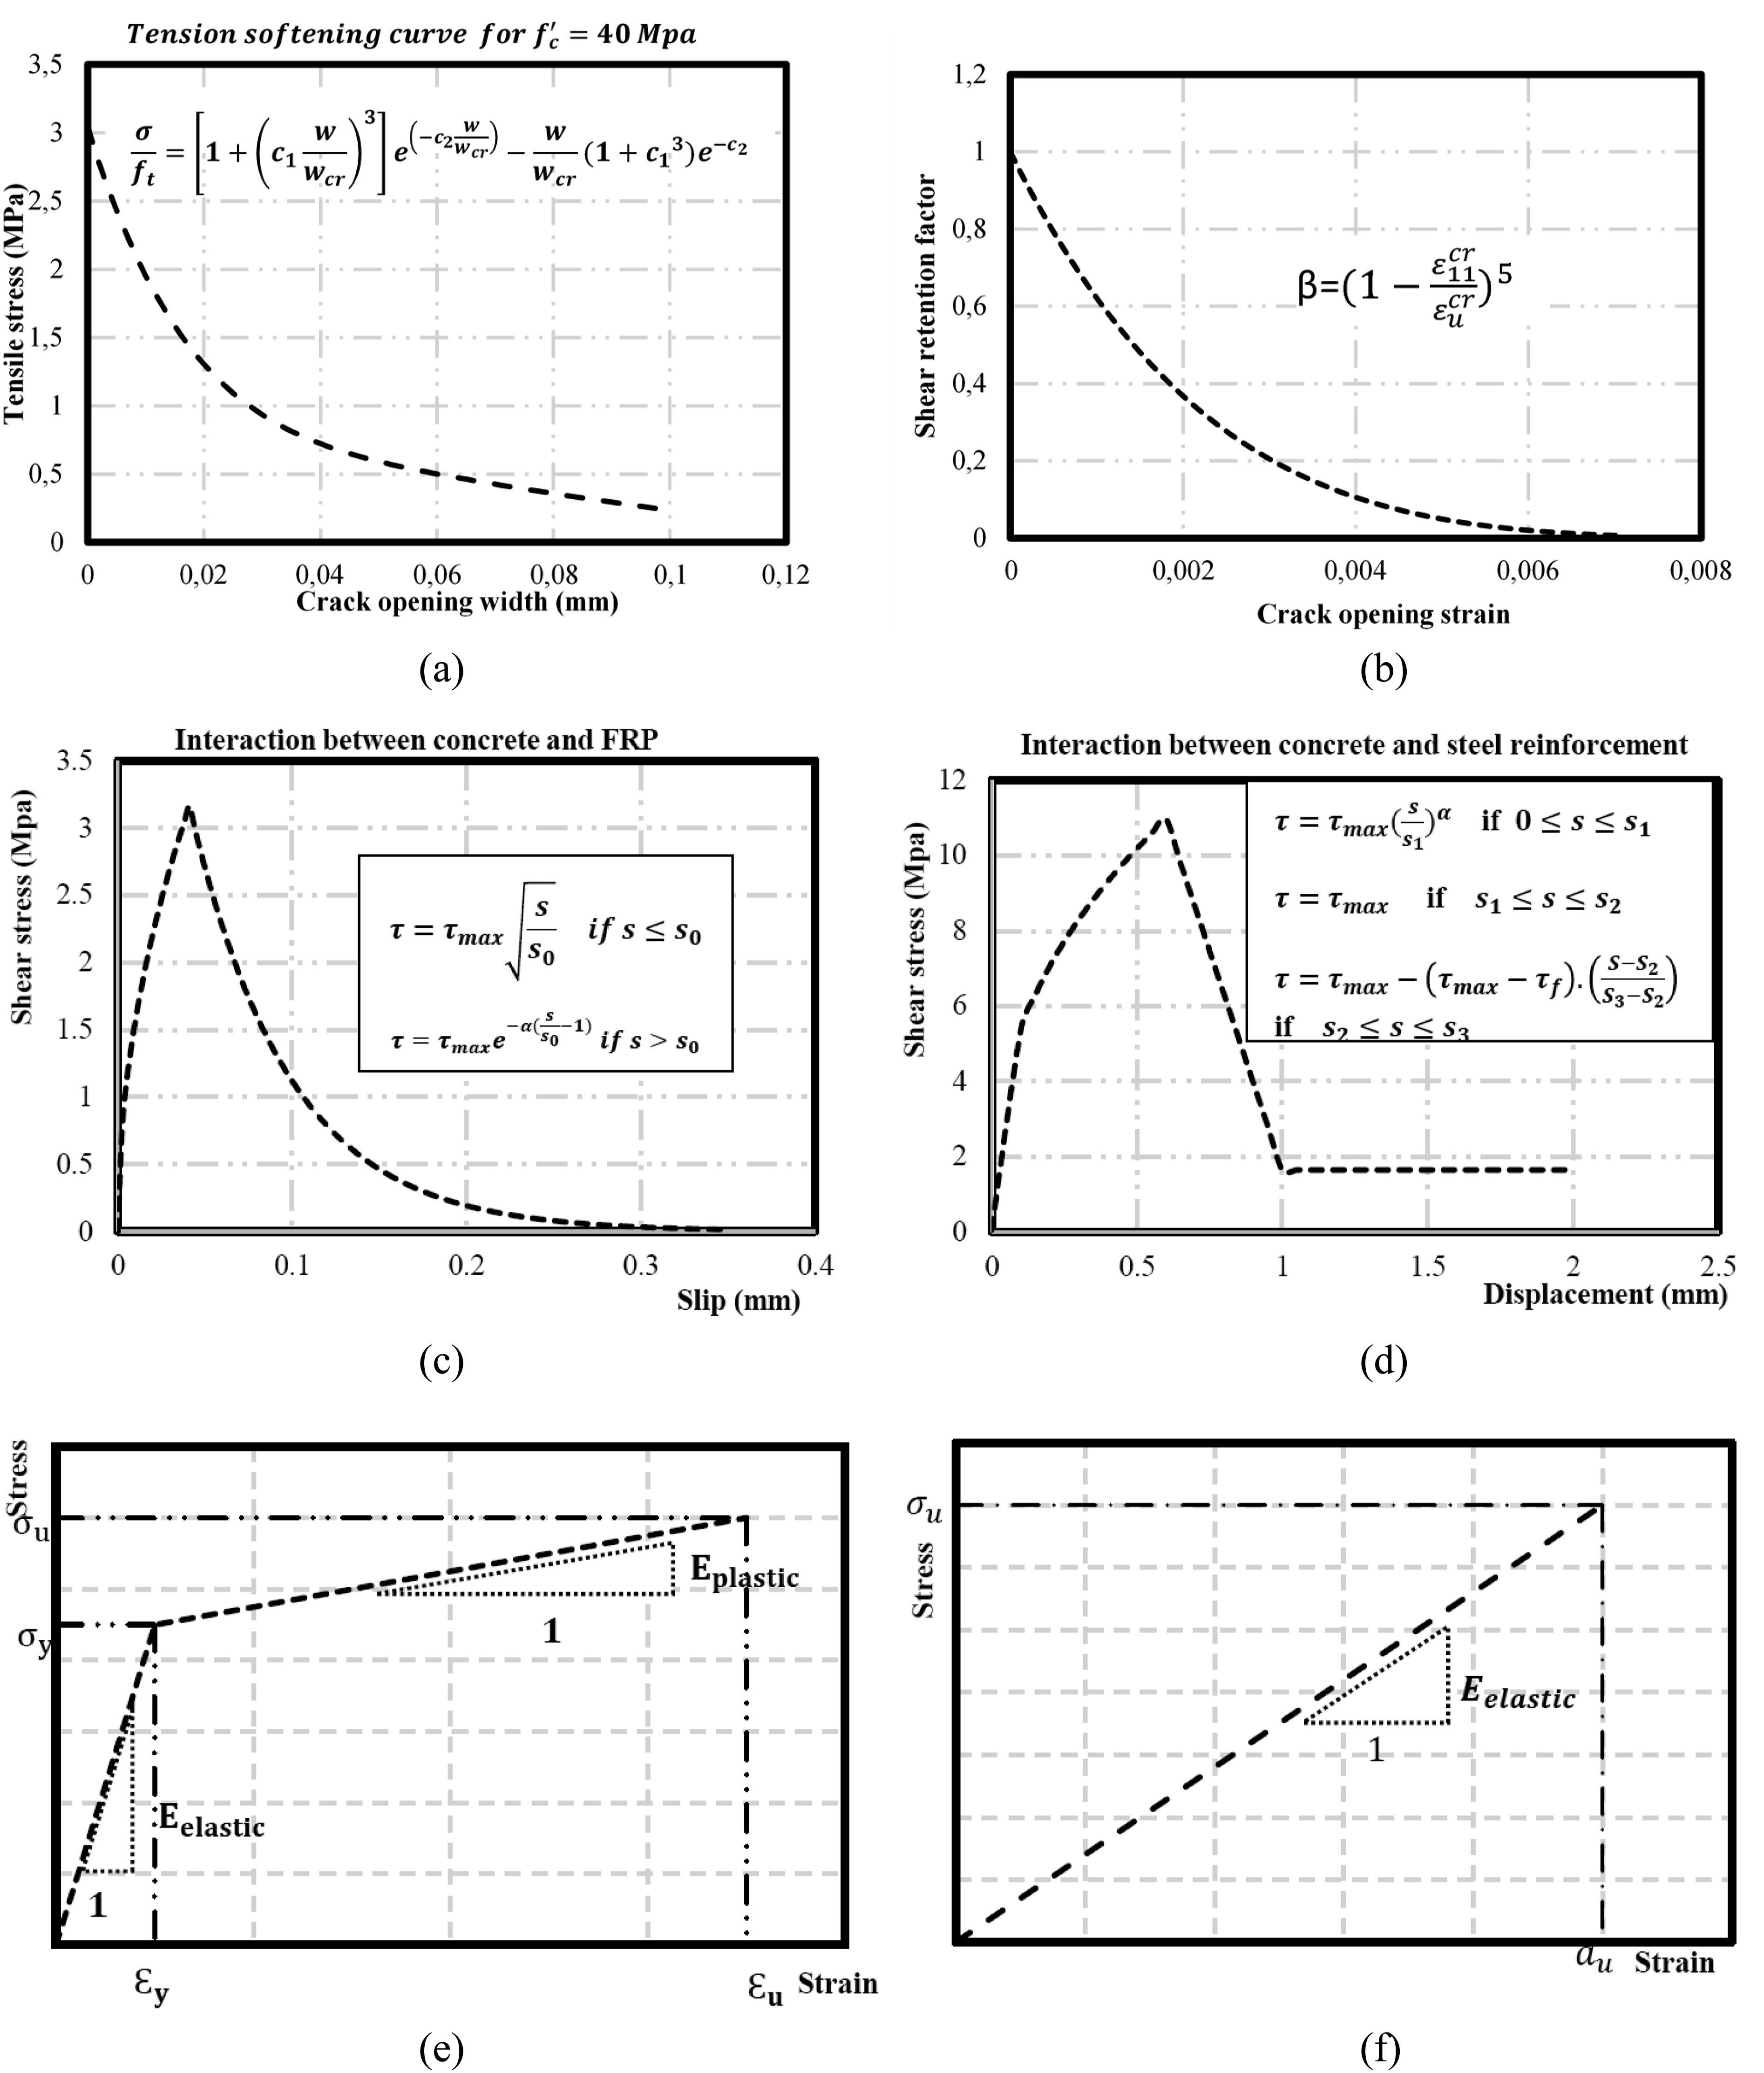
Constitutive models of materials
Concrete cracking models
A suggested model for situations where the structural response is primarily influenced by the tensile and shear characteristics of fractured concrete is the brittle cracking model.25,26 Brittle cracking (BC) model was implemented in the advanced FE model in the current study, which is proposed for scenarios dominated by tensile and shear behavior of cracked concrete. The model assumes linear elastic compression. Using an orthogonal fixed smeared crack approach allows the emergence of up to two orthogonal cracks in 2D elements. Crack initiation, identified via the maximum tensile stress criterion (Rankine criterion), considers both Mode I (tension-softening) and Mode II (shear retention) behavior. The exponential tension-softening curve of concrete in tension proposed by Hordijk
27
was used to represent the tensile behavior of cracked concrete. The shear retention factor (𝛽s), which significantly influences post-cracking behavior of concrete, is modeled using Rots
28
approach. Both the tension-softening curve and shear retention factor are consistent between the concrete damaged plasticity model and the BC model, although the BC model uses an orthogonal fixed smeared crack approach and the concrete damaged plasticity model employs a rotating smeared crack model.25,26 Friction is considered in the shear retention curve by accounting for the reduction in shear transfer capacity across cracks due to the presence of friction along the crack surfaces (Figure 3(b)). The BC model focuses on simulating the initiation and propagation of cracks in concrete. It employs a smeared crack approach to represent cracks as distributed damage within the material, without explicitly modeling friction effects. Since in the specimens studied, the tensile-shear failure mode is dominant, the shear retention factor considers the friction effect and friction due to compression is negligible. Therefore, the BC model was implemented for concrete cracking. The same BC model has been implemented by Nie, X.
26
to simulate RC beams, in which brittle cracking predicted the response of RC beams with high accuracy. The BC was assumed to represent the behavior of concrete in shear cracking (when shear failure is more probable than flexural failure). It can predict the pattern of shear cracks in RC beams if the shear retention factor is defined precisely. The behavior of concrete in compression is considered to be elastic in the brittle cracking model. Various types of crack models are defined in FE programs, such as the discrete crack model, the rotating smeared crack model, and the fixed smeared crack model, but the fixed smeared crack model is implemented in the framework of brittle cracking in concrete. In this study, the shear retention factor was selected from Rots
28
as follows: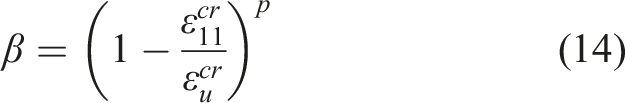
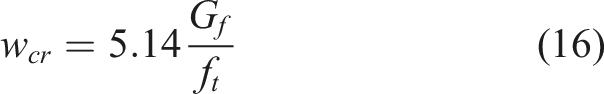
To implement the tension-softening behavior of concrete, the formula defined by Hordijk
27
based on the stress-crack width was used in this study as follows: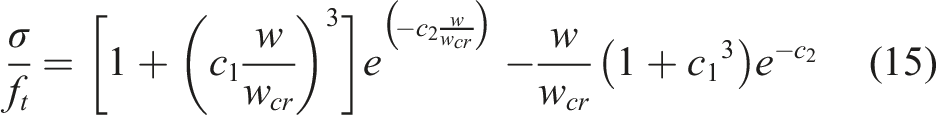
Modeling internal steel reinforcement and EB-CFRP
As for the behavior of steel reinforcement materials, the linear and nonlinear response of steel materials was represented by a bilinear curve, as shown in Figure 3(e)–(f). This approach to representing their elastic-plastic behavior was taken to reduce calculation time and avoid divergence in FEA. Regarding EB-CFRPs, its behavior was assumed to be linear before rupture occurred. Detailed properties of materials are shown in Table 2 and Table 3.
Bond model between concrete and CFRP sheet
The tangential damage (debonding, Mode II and Mode III) and normal damage (delamination, Mode I) parameters are considered in two-dimensional cohesive elements (COH2D4). The ultimate load-carrying capacity of specimens is completely dependent on their bond-slip behavior. To obtain a reliable response from FEA, the parameters of the bond-slip modulus (the modulus of elasticity, the maximum shear stress, the fracture energy (which is the area under the shear stress curve along the cohesive layer), the maximum slip during failure, and the damage parameters) should be defined precisely. In this study, the properties of the interface layer between the concrete and the EB-FRP sheet were obtained from the model proposed by Lu et al.
10
for 

Bond model between concrete and steel reinforcement
The same approach, two-dimensional cohesive elements (COH2D4), was used to describe the bond-slip behavior between concrete and steel reinforcement. The bond-slip model recommended in CEB-FIP design code
11
was considered to characterize the behavior of the cohesive layer for the deformation, for 


Dynamic versus static analysis
In this study, a dynamic analysis approach was adopted, specifically utilizing the explicit central difference method available in ABAQUS. This choice was made to address significant numerical convergence challenges frequently encountered when modeling cracked concrete using static analysis methods such as the Newton-Raphson method and the arc-length method, as highlighted in previous researches.32,33 The difficulties in convergence are primarily attributed to the pronounced nonlinearities arising from strain softening phenomena associated with concrete cracking.26,33
It is important to emphasize that the application of dynamic analysis techniques to solve static or quasi-static structural issues is not unprecedented. Chen et al. 33 extensively reviewed various dynamic analysis approaches employed for solving static/quasi-static structural problems and evaluated their effectiveness. From their findings, an advanced dynamic approach was proposed, demonstrating its efficacy in accurately predicting FRP debonding failure in FRP-strengthened RC beams. As recommended by the authors, when employing the explicit central difference method within the dynamic approach, crucial factors such as loading time and damping scheme warrant meticulous consideration to ensure an accurate and reliable prediction. 26 These considerations constitute a pivotal aspect of the present study.
Validation of the proposed FE model
To verify the simulated model, the control beam (B3) and the beam strengthened with CFRP (B5) were selected from the research conducted by Matthys. 19 Comparisons were drawn with experimental results to evaluate the accuracy of the numerical model. After the simulated models were validated, a parametric study was conducted to shed light on negative inverse interactions between internal and external shear reinforcement of RC beams strengthened in shear with U-shaped FRP sheets.
Failure modes, crack distributions, and shear force-midspan deflections
The failure modes for both specimens (B3 and B5) were loss of shear resistance. However, for the strengthened specimen (B5), debonding occurred at the interface between concrete and CFRP1 strip (Figure 4). The maximum strain on CFRP1 at the major shear crack obtained from FEA before shear failure was 10,254 µԐ at 110.637 mm from the lower surface of the beam, which was close to experimental results reported (9900 µԐ) (Figure 4). The difference might be attributable to the dynamic analysis implemented in this study, which amplified the strains on fibers that did not exist in the static analysis, or to strain gauges in the experimental test not being placed at the exact location where the fiber experienced maximum strain.
7
The ultimate shear load before failure obtained from the numerical model for B3 was 142.7 kN, compared to 136.6 kN for the experimental results, which indicates that the numerical test forecast a 4.2% higher value for the strengthened specimen (B5). The ultimate shear force was 188 kN, which was almost 10% greater than the experimental tests (170 kN), as shown in Figure 4, and the reported results by Matthys
19
and Chen et al.
7
Figure 4(e) defines the discretization of the reinforced beam (B5) before starting the analysis, while Figure 4(f) shows the shear crack patterns at the ultimate state for the control beam (B3). These observed patterns align compatibly with the crack formations obtained during experimental testing. Therefore, it can be concluded that the numerical results can predict the laboratory results. Verifications of the suggested FE models and experimental results (a) load-midspan deflections for the specimens B3 (control beam not strengthened with EB-CFRP0 and B5 (strengthened beam, (b) strain response among CFRPs1 in the specimen B5, (c) distributions of the shear crack for the control beam at the ultimate state, (d) distributions of the shear cracks for strengthened beam at the ultimate state, (e) discretization of the strengthened beam before starting the analysis, and (f) shear crack pattern in the control beam.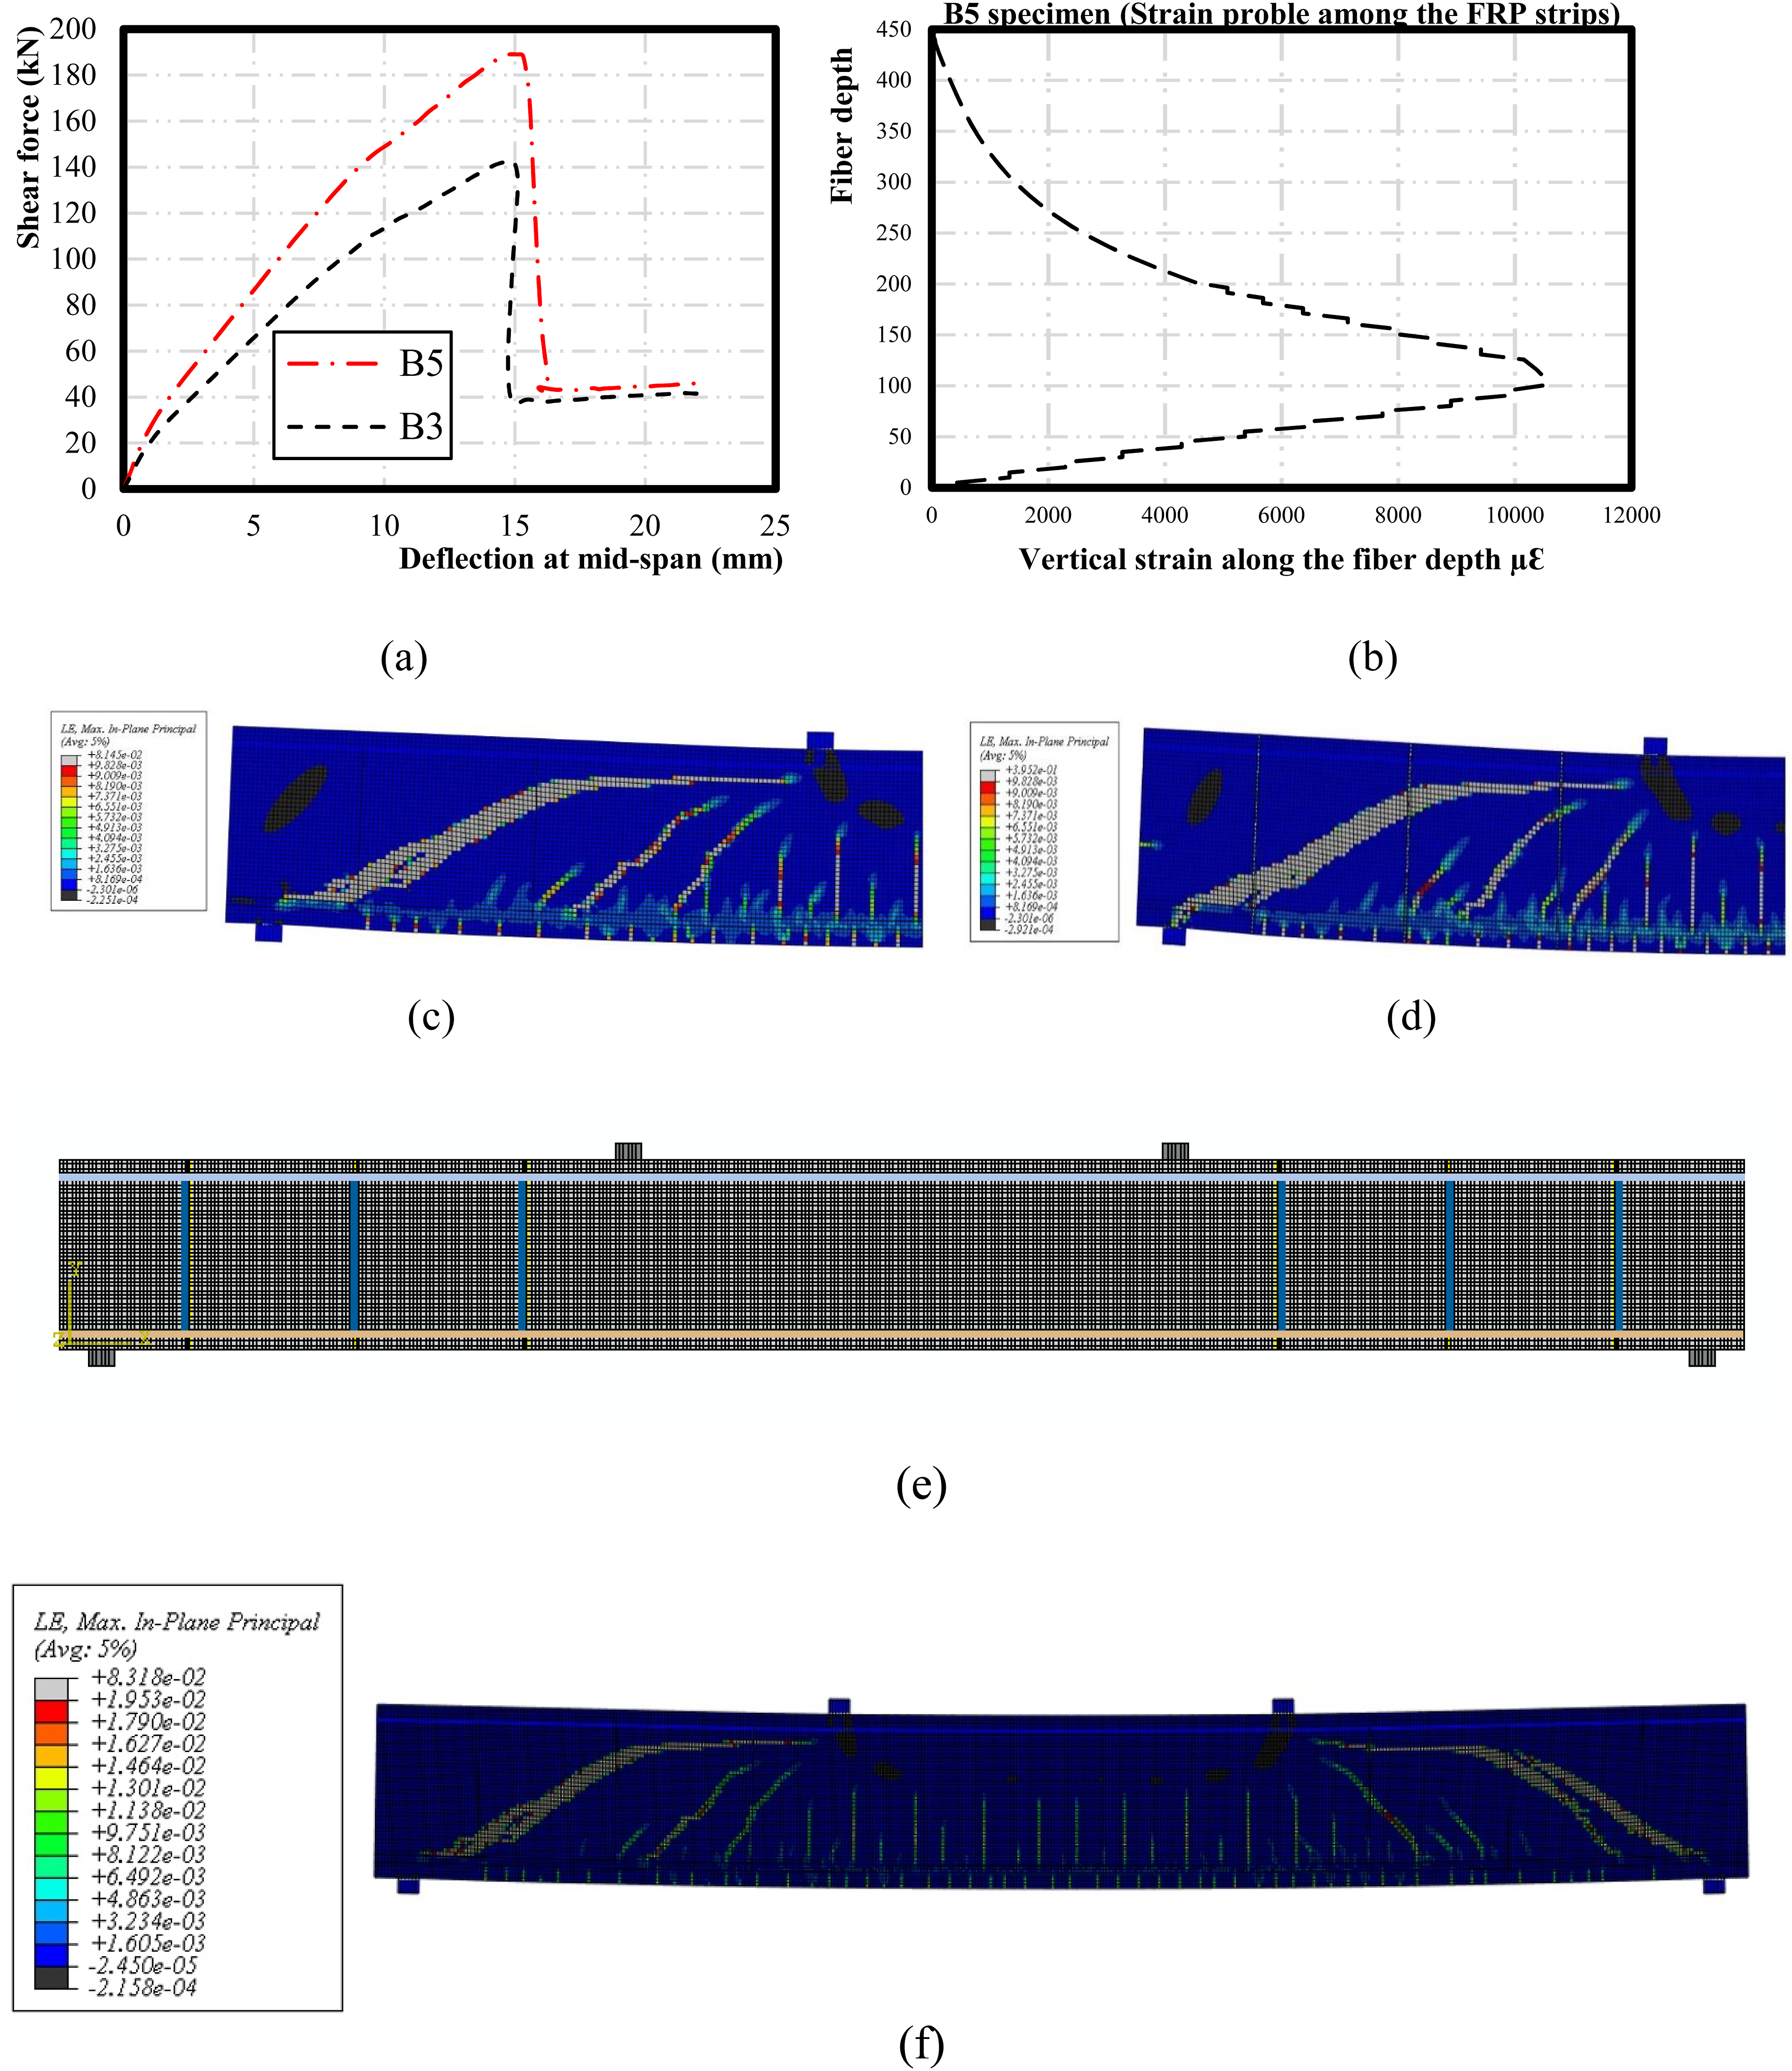
It is important to note that mesh dependency analysis consisted in systematically refining the mesh by decreasing the element size while keeping other parameters constant. The convergence behavior was evaluated by comparing the results obtained from different mesh densities. As the mesh dependency analysis was refined, there was a noticeable trend of convergence in the results. Specifically, critical outputs such as displacements and stresses exhibited a consistent pattern of convergence, indicating that the model was approaching a stable solution. From a certain level of mesh refinement, namely, 10 mm element size, changes in the results become negligible, suggesting that further refinement does not significantly affect the accuracy of the results. Therefore, the mesh element size was taken 10 mm (four-node plane stress element CPS4) that simulated and confirmed the experimental tests with high accuracy. The same mesh element size of 10 mm has been used by Chen et al. 7 that showed high accuracy between numerical and experimental tests. This behavior is indicative of convergence, indicating that the proposed model was able to capture the essential physics of the problem accurately, and demonstrating the robustness and reliability of the FE model in simulating the behavior of the system under study.
Parametric study of the interaction between stirrups and CFRP strips
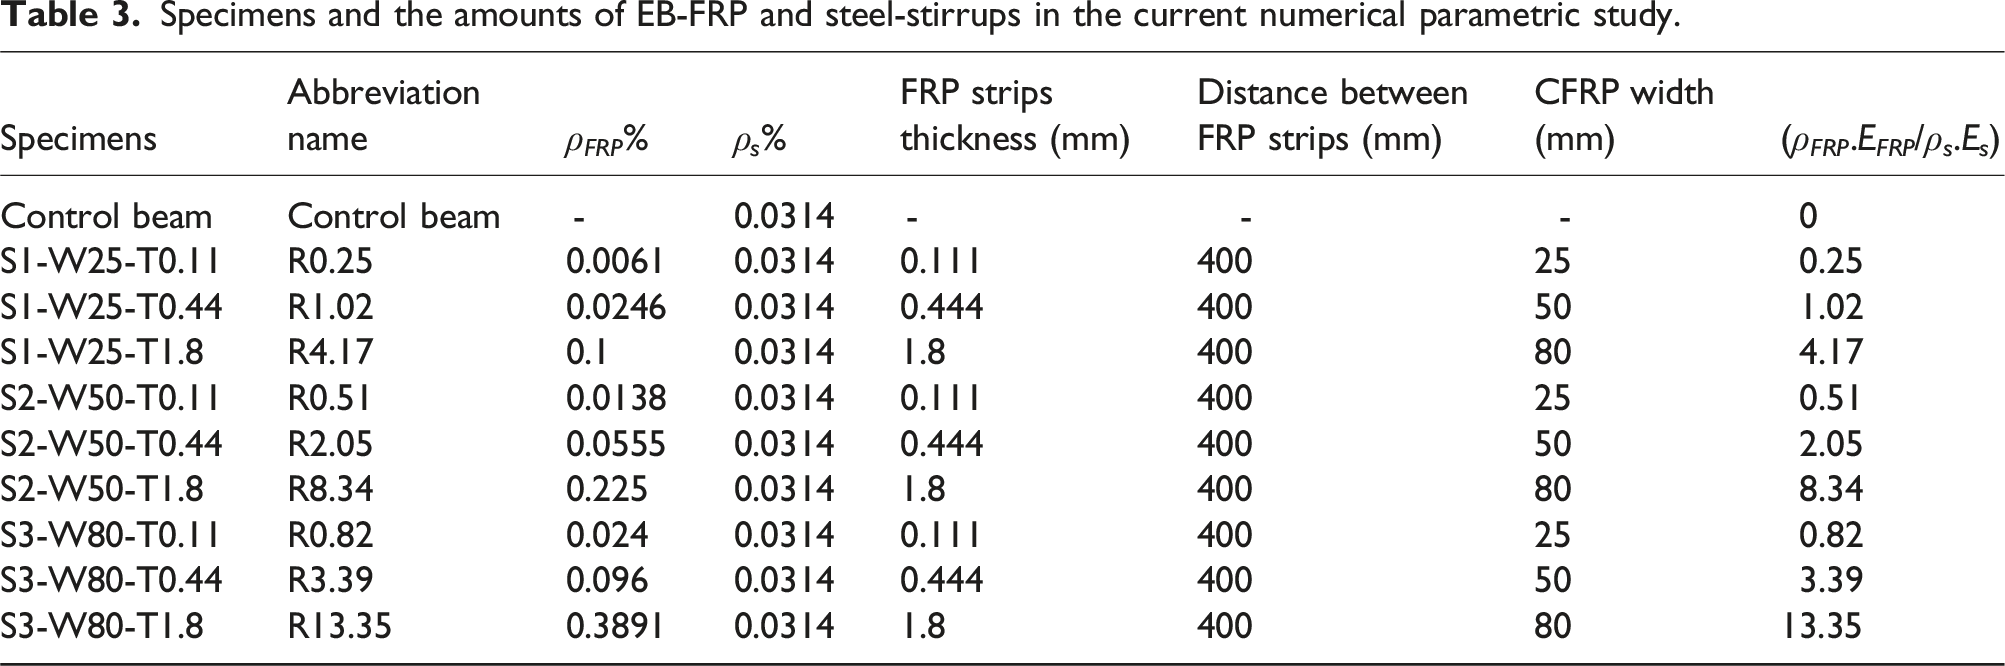
Specimens with different ρ FRP .E FRP /ρ s .E s ratios were simulated to evaluate how both steel-stirrups and EB-FRP contribute to the ultimate shear capacity of strengthened RC beams and what happens if these ratios (henceforth called R) are increased by keeping the ratio of steel-stirrups constant (ρ s = 0.0314%).
Please note that the center of each FRP strip was positioned at the same location as the internal steel-stirrups. To evaluate the effect of the inverse interaction between FRPs and steel-stirrups, the amount of EB-FRP was increased by considering thicker and wider FRP strips (see Table 3).
Distribution and angle of shear cracks
Various parameters affect the pattern and angle of shear cracks, such as the number and arrangement of transverse reinforcements, the amount of fiber reinforcement, the shear span-to-depth ratio, the width of FRP strips and their corresponding spacing, and the size effect. As the shear crack angle increases, the shear crack intercepts fewer FRP strips, and therefore less effective bond length is available to contribute to shear resistance. Moreover, considering a crack angle of 45° is too conservative because this angle changes based on the spacing between steel-stirrups and other parameters. However, in this study, the average shear crack angle varied from 19.23° for specimen (R = 13.35) to 26.5° for specimen (R = 0.25). When the spacing between steel-stirrups was reduced, the shear crack angle was also reduced because the stirrups tend to prevent shear cracks from propagating.4,8 On the other hand, when the ratio of either steel-stirrups or EB-FRPs was increased, the pattern of shear cracks became more distributed, resulting in a reduction of the anchorage length offered by EB-FRPs. It was proved that by increasing the ratio of steel-stirrups and consequently having more distributed cracks, the bond length contributed less effectively to the shear resistance of EB-FRP.2,3,15 It can be concluded therefore that increasing the ratio of steel-stirrups reduces the shear contribution of EB-CFRPs. As was already mentioned, none of the design codes considers the effect of inverse interaction between steel-stirrups and EB-FRP. The results of this numerical study represent the pattern of shear cracks as the ratio of CFRP-to-steel-stirrups increases (R). The shear cracks are more distributed for specimens with a higher ratio (R), (Figure 5), demonstrating that similarly to internal reinforcements, external reinforcements affect crack patterns by producing more marginal shear cracks that reduce the effective bond length. This leads to a reduction in the FRP contribution to ultimate load-carrying capacity. However, it is expected that the greater the cross-section offered by the FRP strips, the greater will be the forecast contribution to the shear load by FRP. It is noteworthy that, unlike the case of a high steel-stirrup ratio (e.g., reducing the spacing between steel-stirrups), a greater number of shear cracks were more widely distributed.
4
Multiple shear cracks developed in specimens with wider strips when the spacing between EB-FRP strips and the fiber thickness remained constant (Figure 5). This may be attributed to the wider strips, which offered a wider bridge to narrow the major shear cracks, and the fact that energy was released by producing marginal and more distributed shear cracks. Therefore, premature debonding happened when the fibers were intercepted by more marginal cracks, resulting in less effective bond length. (a) Load-midspan deflections versus applied shear forces curve for the studied beams, steel-stirrups, and steel-stirrups + EB-CFRPs and (b) proportions of the contributions for all the components resisting in shear forces (concretes, steel-stirrups, and steel-stirrups+ EB-CFRPs).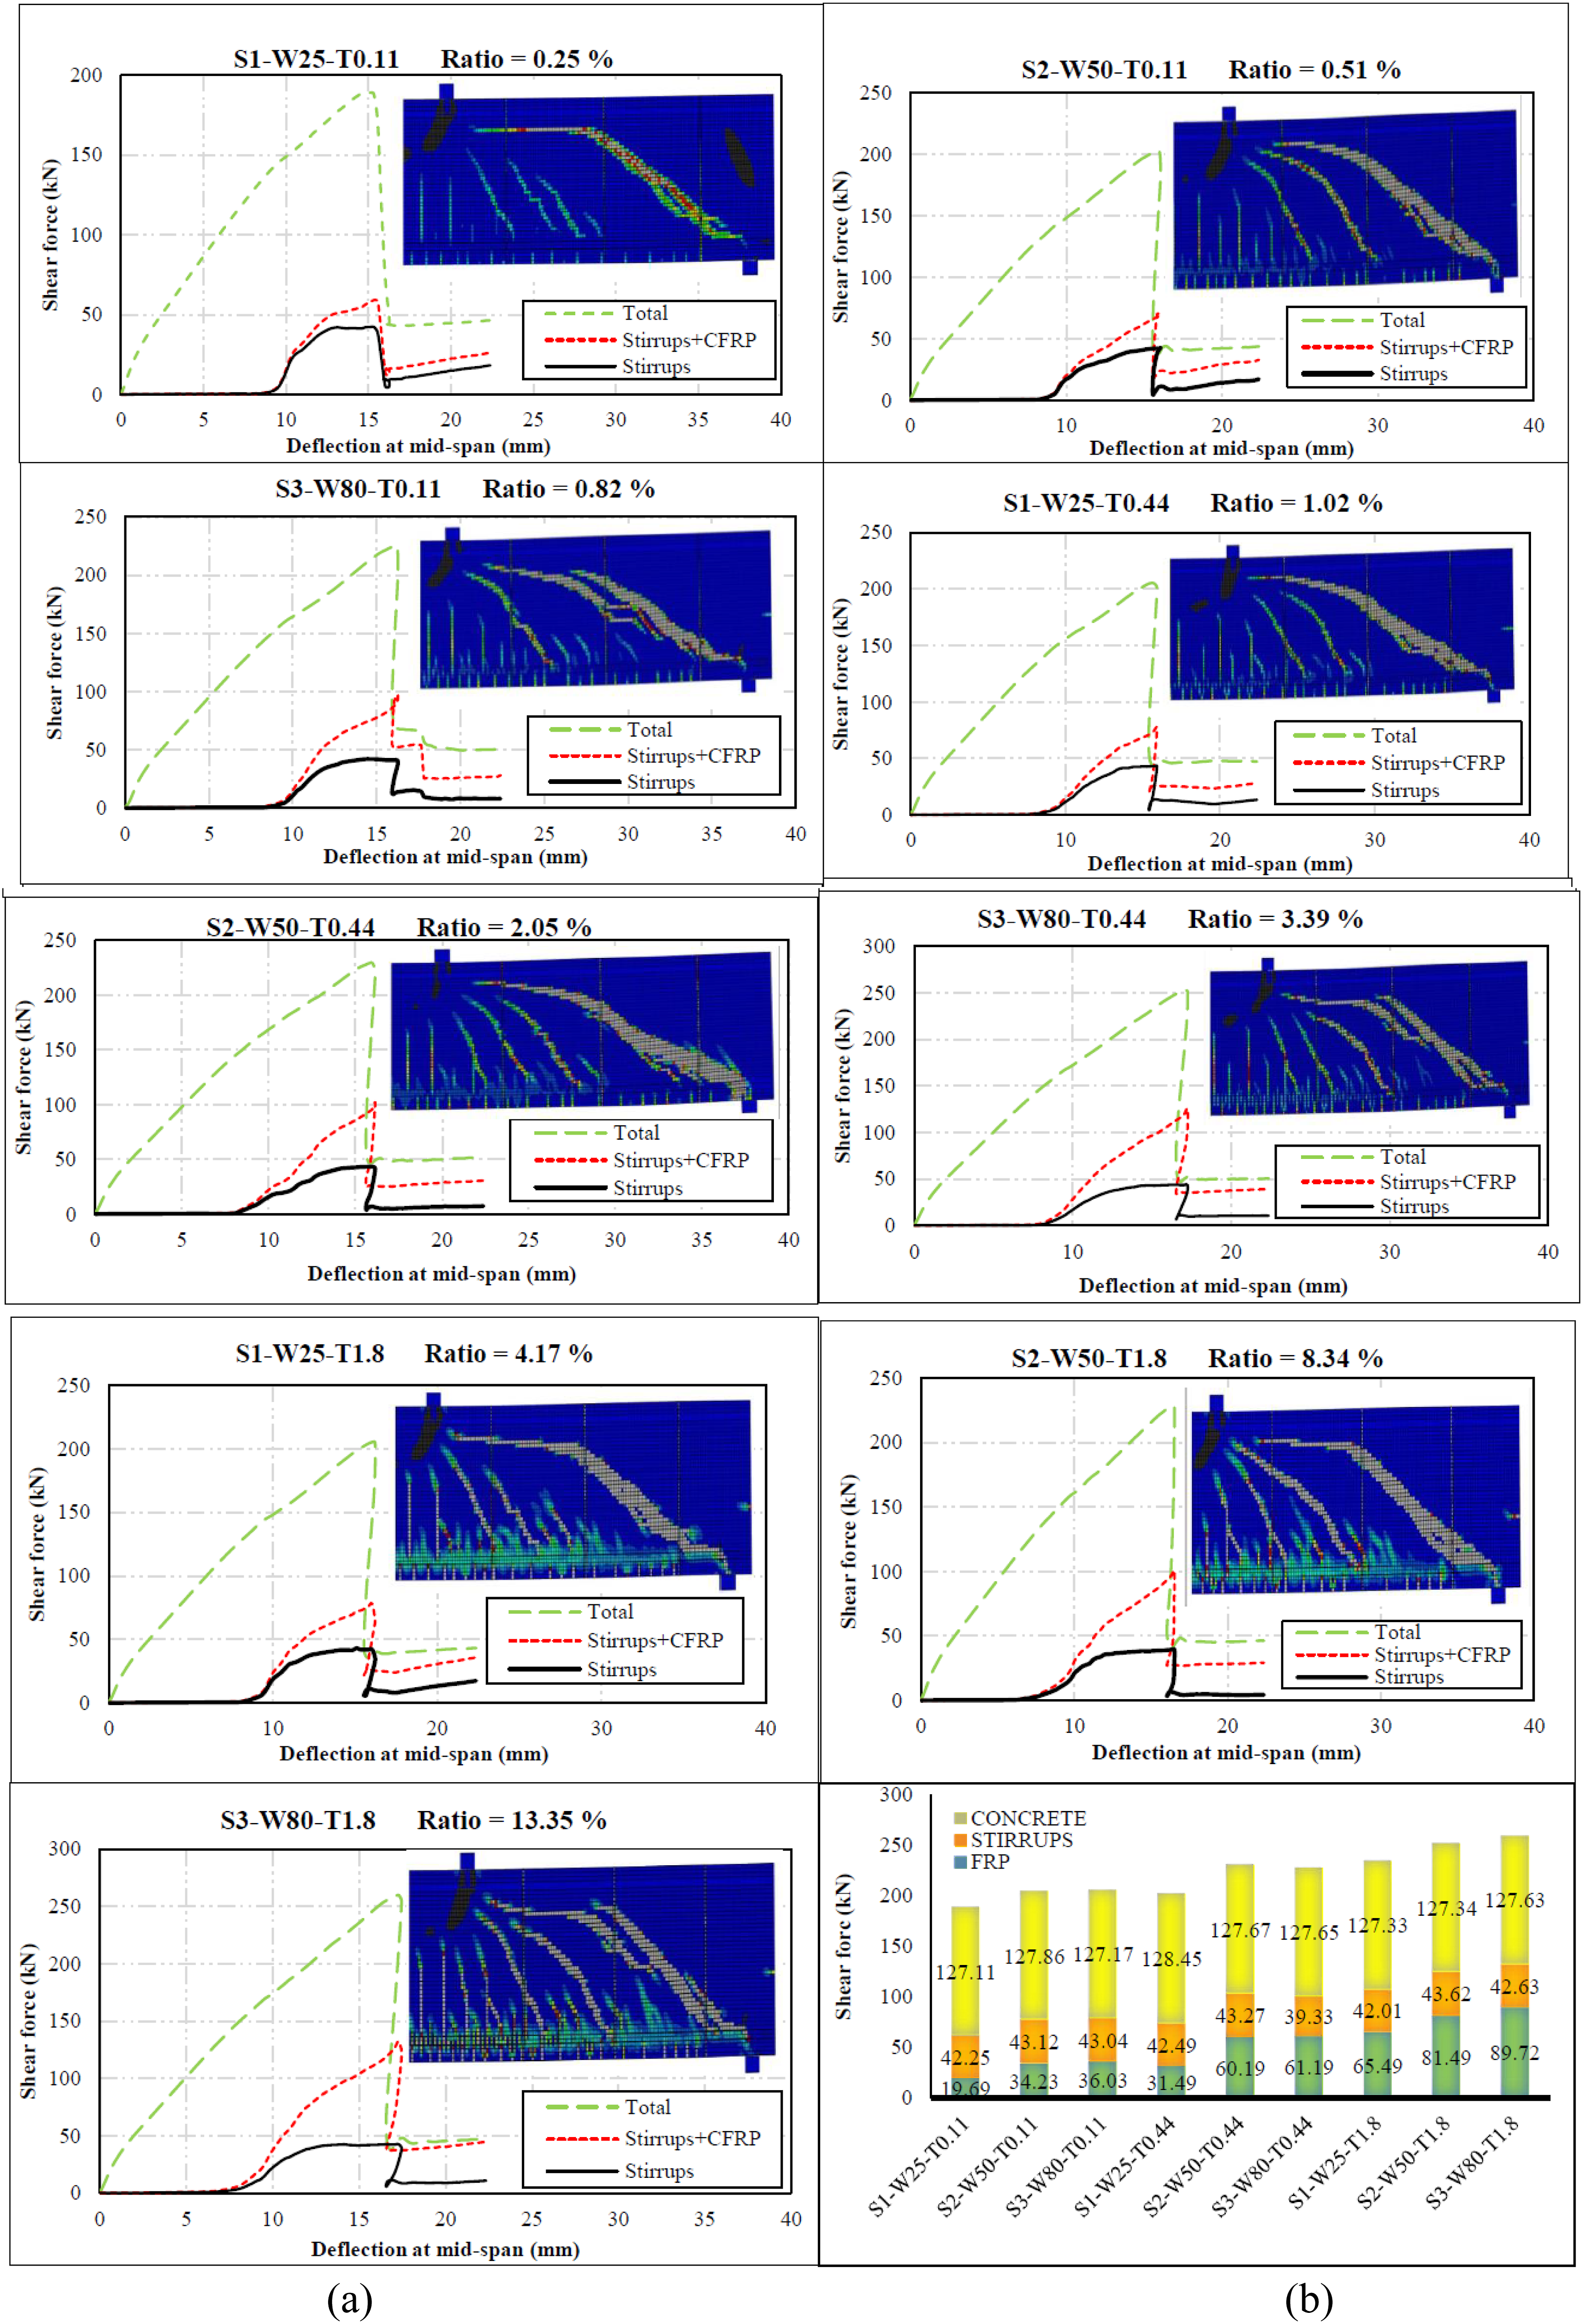
Load-deflection response for all components
The results obtained from the current parametric numerical study were evaluated in two ways. First, the EB-FRP contribution was evaluated by increasing the FRP-to-steel-stirrup ratio as the thickness of EB-FRP was increased from 0.111 mm to 0.444 and then to 1.8 mm. Second, the FRP-to-steel-stirrup ratio was increased by enlarging the width of EB-CFRP strips from 25 mm to 50 mm and then to 80 mm while holding EB-CFRP thickness and spacing constant. As presented in Figure 5, for the specimens with 25-mm strip width, as the thickness increased from 0.111 mm to 0.444 mm and then to 1.8 mm, the FRP shear contribution rose to 73.8% and 83% for specimens R1.02 and R4.17 compared to specimen R0.25. However, for the beams strengthened with 80-mm-wide FRP strips, the same thickness increases in EB-CFRP strips resulted in a 24.4% and 36.9% rise in EB-CFRP shear contributions for specimens R3.39 and R13.35 compared to specimen R0.82 (Figure 5). Therefore, increasing the thickness from 0.11 to 1.8 mm in an 80-mm-wide strip resulted in increasing the shear contribution by 36.9%, compared to 83% and 94.3% for specimens strengthened with 25-mm-wide and 50-mm-wide strips, respectively. It can be concluded that the lowest increasing trend occurred in the specimens strengthened with 80-mm-wide FRP strips. This was associated with the fact that by increasing the FRP-to-steel-stirrup ratio, more marginal shear cracks intercepted CFRP2 and CFRP3 strips, resulting in less effective bonding.
In the second experiments, the thickness of the EB-CFRP strips remained constant while the FRPs-to-steel-stirrup ratio was increased by using wider FRP strips. In the first series, when the strip widths were increased from 25 mm to 50 mm and then to 80 mm while the thickness (0.111 mm) and the spacing between FRP strips (400 mm) were kept constant, the rise in FRP shear contribution was 60% and 232.7% for specimens R0.51 and R0.82 compared to specimen R0.25 (Figure 5). However, in the third series, by increasing the ratio related to specimens R4.17, R8.43, and R13.35 with a constant thickness of 1.8 mm and increasing the widths similarly to series1 and series2, the shear contributions were increased to 36 kN, 61.2 kN, and 89.7 kN, consequently showing 46.6% and 149.1% rises in shear resistance. Therefore, to obtain higher shear contribution from EB-FRP, increasing the FRP width is more effective than increasing the thickness. Wider strips transferred more shear stress through the interface layer and increased the EB-FRP shear contribution.
Shear stress and strain profiles along the first CFRP strips intercepted by major shear cracks
Shear stress profiles along the CFRP1 direction
This section provides a brief explanation of bond-slip behavior by evaluating shear stress and strain profiles along the fibers on CFRP1 strips to evaluate how failure happens when the FRP-to-steel-stirrup ratio is increased. The first CFRP strips were located on the widest parts of major shear cracks (crack ends), and the first CFRPs experienced the highest strain (after shear failure of the specimens). Figure 6 shows shear stress profiles and strain distributions along the fiber depth in five midspan deflection steps related to five states: (1) initiation of critical shear cracks in the lower part of the web; (2) development of major shear cracks when all cohesive layers experience shear stress as the shear cracks widen, but before they reach maximum stress at the interface; (3) complete formation of shear cracks and imposition of maximum strain on fibers; (4) initiation of debonding at the cohesive layers (reducing the anchorage lengths as cracks widen); and (5) just before complete failure of the cohesive layers (almost all fibers lose their contribution to shear resistance). Moreover, the areas under the shear stress profiles along the fibers were measured to evaluate the energies transferred through the interface layers by increasing the FRP-to-steel-stirrup ratio, as presented in Figure 6. It is noteworthy that the shear stresses at the interface layers become zero whenever the strain responses reach any local pick point or become even. The first series, with the lowest FRP-to-steel-stirrup ratio, experienced 2.62 (N/mm), 2.73 (N/mm), and 2.09 (N/mm) higher energies, corresponding to the R0.25, R0.51, and R0.82 specimens where all the specimens were 0.111 mm thick. The second series, with thicker EB-FRP (0.444 mm), was exposed to 1.52 (N/mm), 1.82 (N/mm), and 1.14 (N/mm) lower energies corresponding to the R1.02, R2.05, and R3.39 specimens, representing reductions of 42%, 33.5%, and 45.7%, respectively. The lowest energy increases, 1.44 (N/mm), 1.14 (N/mm), and 0.78 (N/mm), were associated with the thickest specimens, R4.17, R8.34, and R13.35 and represented reductions of 44.8%, 58.3%, and 62.9%, respectively (Figure 6). The areas under the shear stresses among the cohesive layer distances demonstrate that the higher the energy, the more benefits were removed from the full potential of the cohesive layer, and the greater was the number of mobilized zones in comparison to the immobilized zones.
9
Therefore, this phenomenon can be attributed to the fact that specimens with higher ratios (R) (by increasing FRP thickness) failed by premature debonding. It also proves that when R is increased by making the CFRP thicker, the shear stresses do not distribute properly all over the cohesive layer and do not benefit from the maximum potential shear stress in the interface layers. (a) Strain profiles and interfacial shear stresses along fibers and interface layers intercepted by maximum crack on CFRPs1 and cohesive layer 1 and (b) areas under shear stress profiles along the first fibers.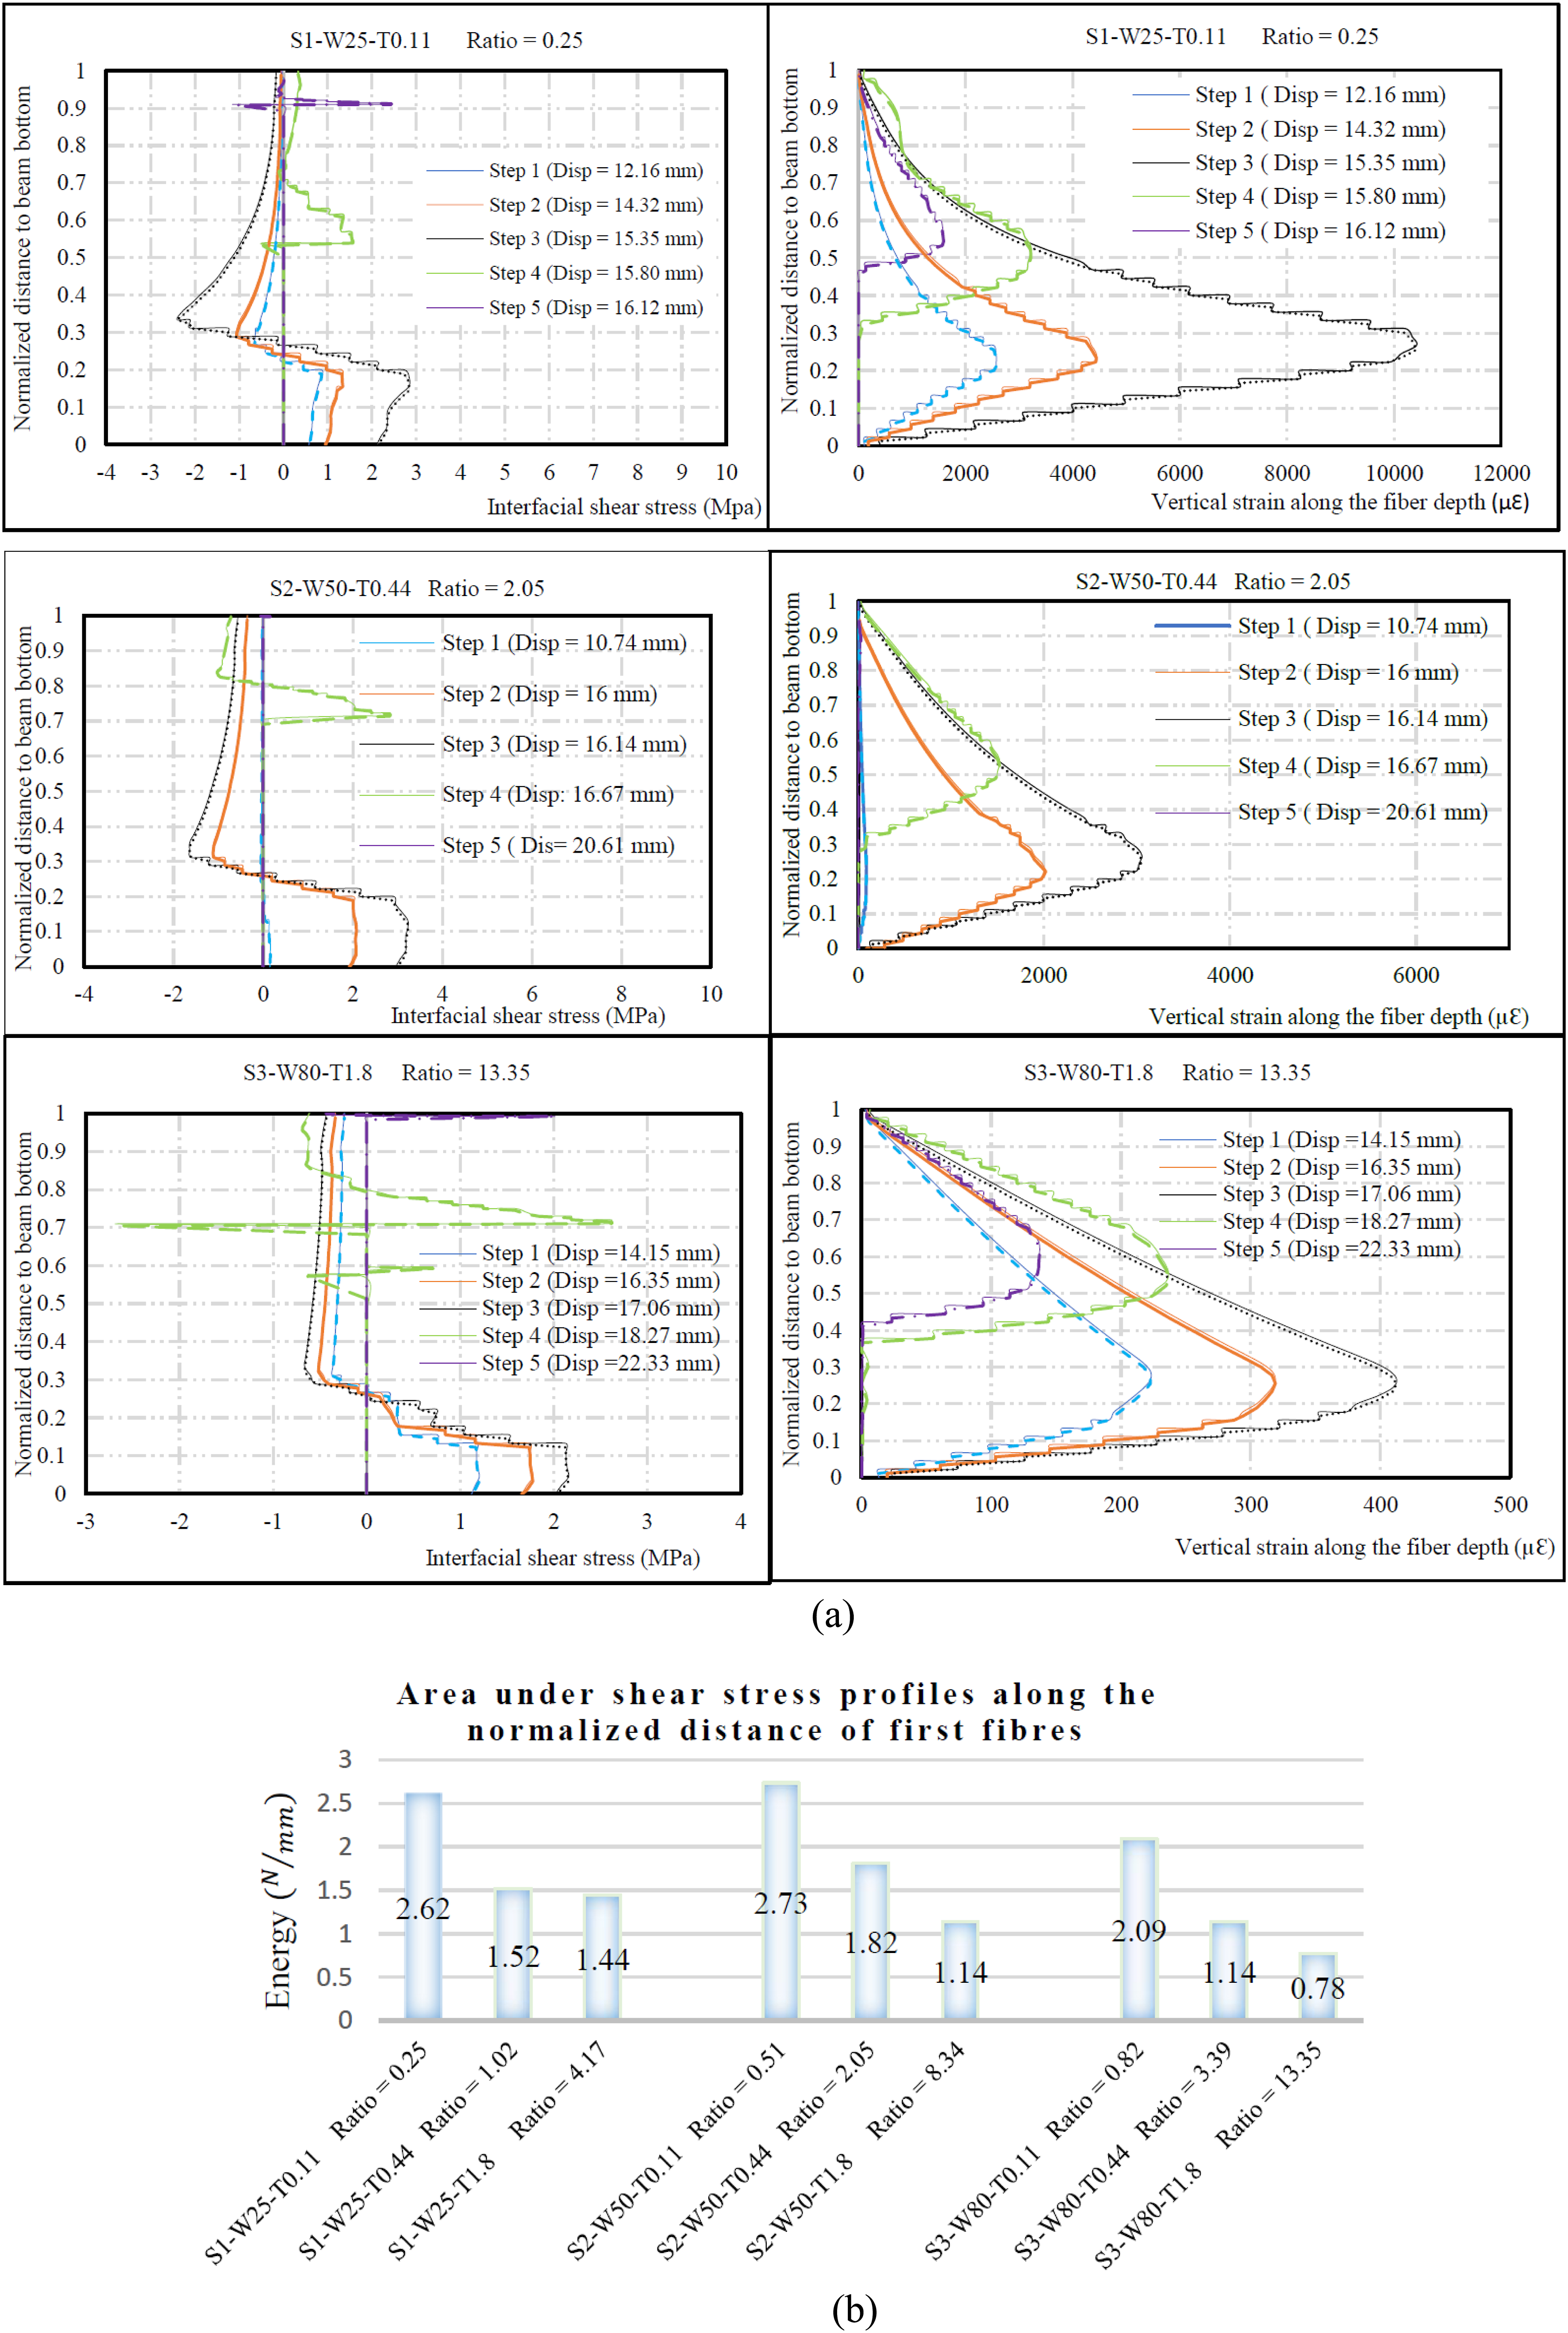
The premature debonding observed in specimens with a higher concentration of EB-CFRP compared to steel-stirrups indicates that an increase in the ratio of EB-FRP-to-steel-stirrups (i.e., increasing the FRP thickness) leads to suboptimal utilization of the interface layer between concrete and FRP. Therefore, a decrease in CFRP strain occurs with an increase in the FRP-to-steel-stirrups ratio (R), as shown in Figure 6. Indeed, increasing the ratio (R) results in the concentration of shear stresses around the ends of major shear cracks, with a tendency for stress concentration beneath critical shear cracks. The numerical analysis indicates that as the thickness of FRP strips increases with the ratio (R), while maintaining constant FRP widths, shear stresses fail to be distributed uniformly across the cohesive layer. As a result, they do not fully exploit the maximum potential shear stresses present in the interface layers, leading to delamination. In addition, the presence of distributed marginal shear cracks, as the ratio of EB-FRP-to-steel-stirrup increases, results in a further decrease in the shear contribution of EB-FRP to load-carrying capacity. The same reduction in the amount of strain experienced by CFRPs1 strips can be observed as an increase in the FRP-to-steel-stirrup ratio (Figure 6), as explained in the next section.
Maximum strain profiles along the direction of CFRPs
The FEA results show that the shear contribution of the first FRP strips (not intercepted by marginal shear cracks) was reduced as the EB-FRP-to-steel-stirrup ratio increased (Figure 7). The maximum strain on CFRPs1 was recorded for the first series of specimens, where the lowest R ratios were 10,478 µԐ, 11,219 µԐ, and 10,140 µԐ for specimens R0.25, R0.51, and R0.82, respectively (Figure 7). However, the strain for the 50-mm-wide and 80-mm wide specimens was drastically reduced as the thickness increased from 0.111 mm to 0.44 mm and then to 1.8 mm. Maximum strains profiles among the fibers on CFRP1, CFRP2, and CFRP3 for the studied specimens.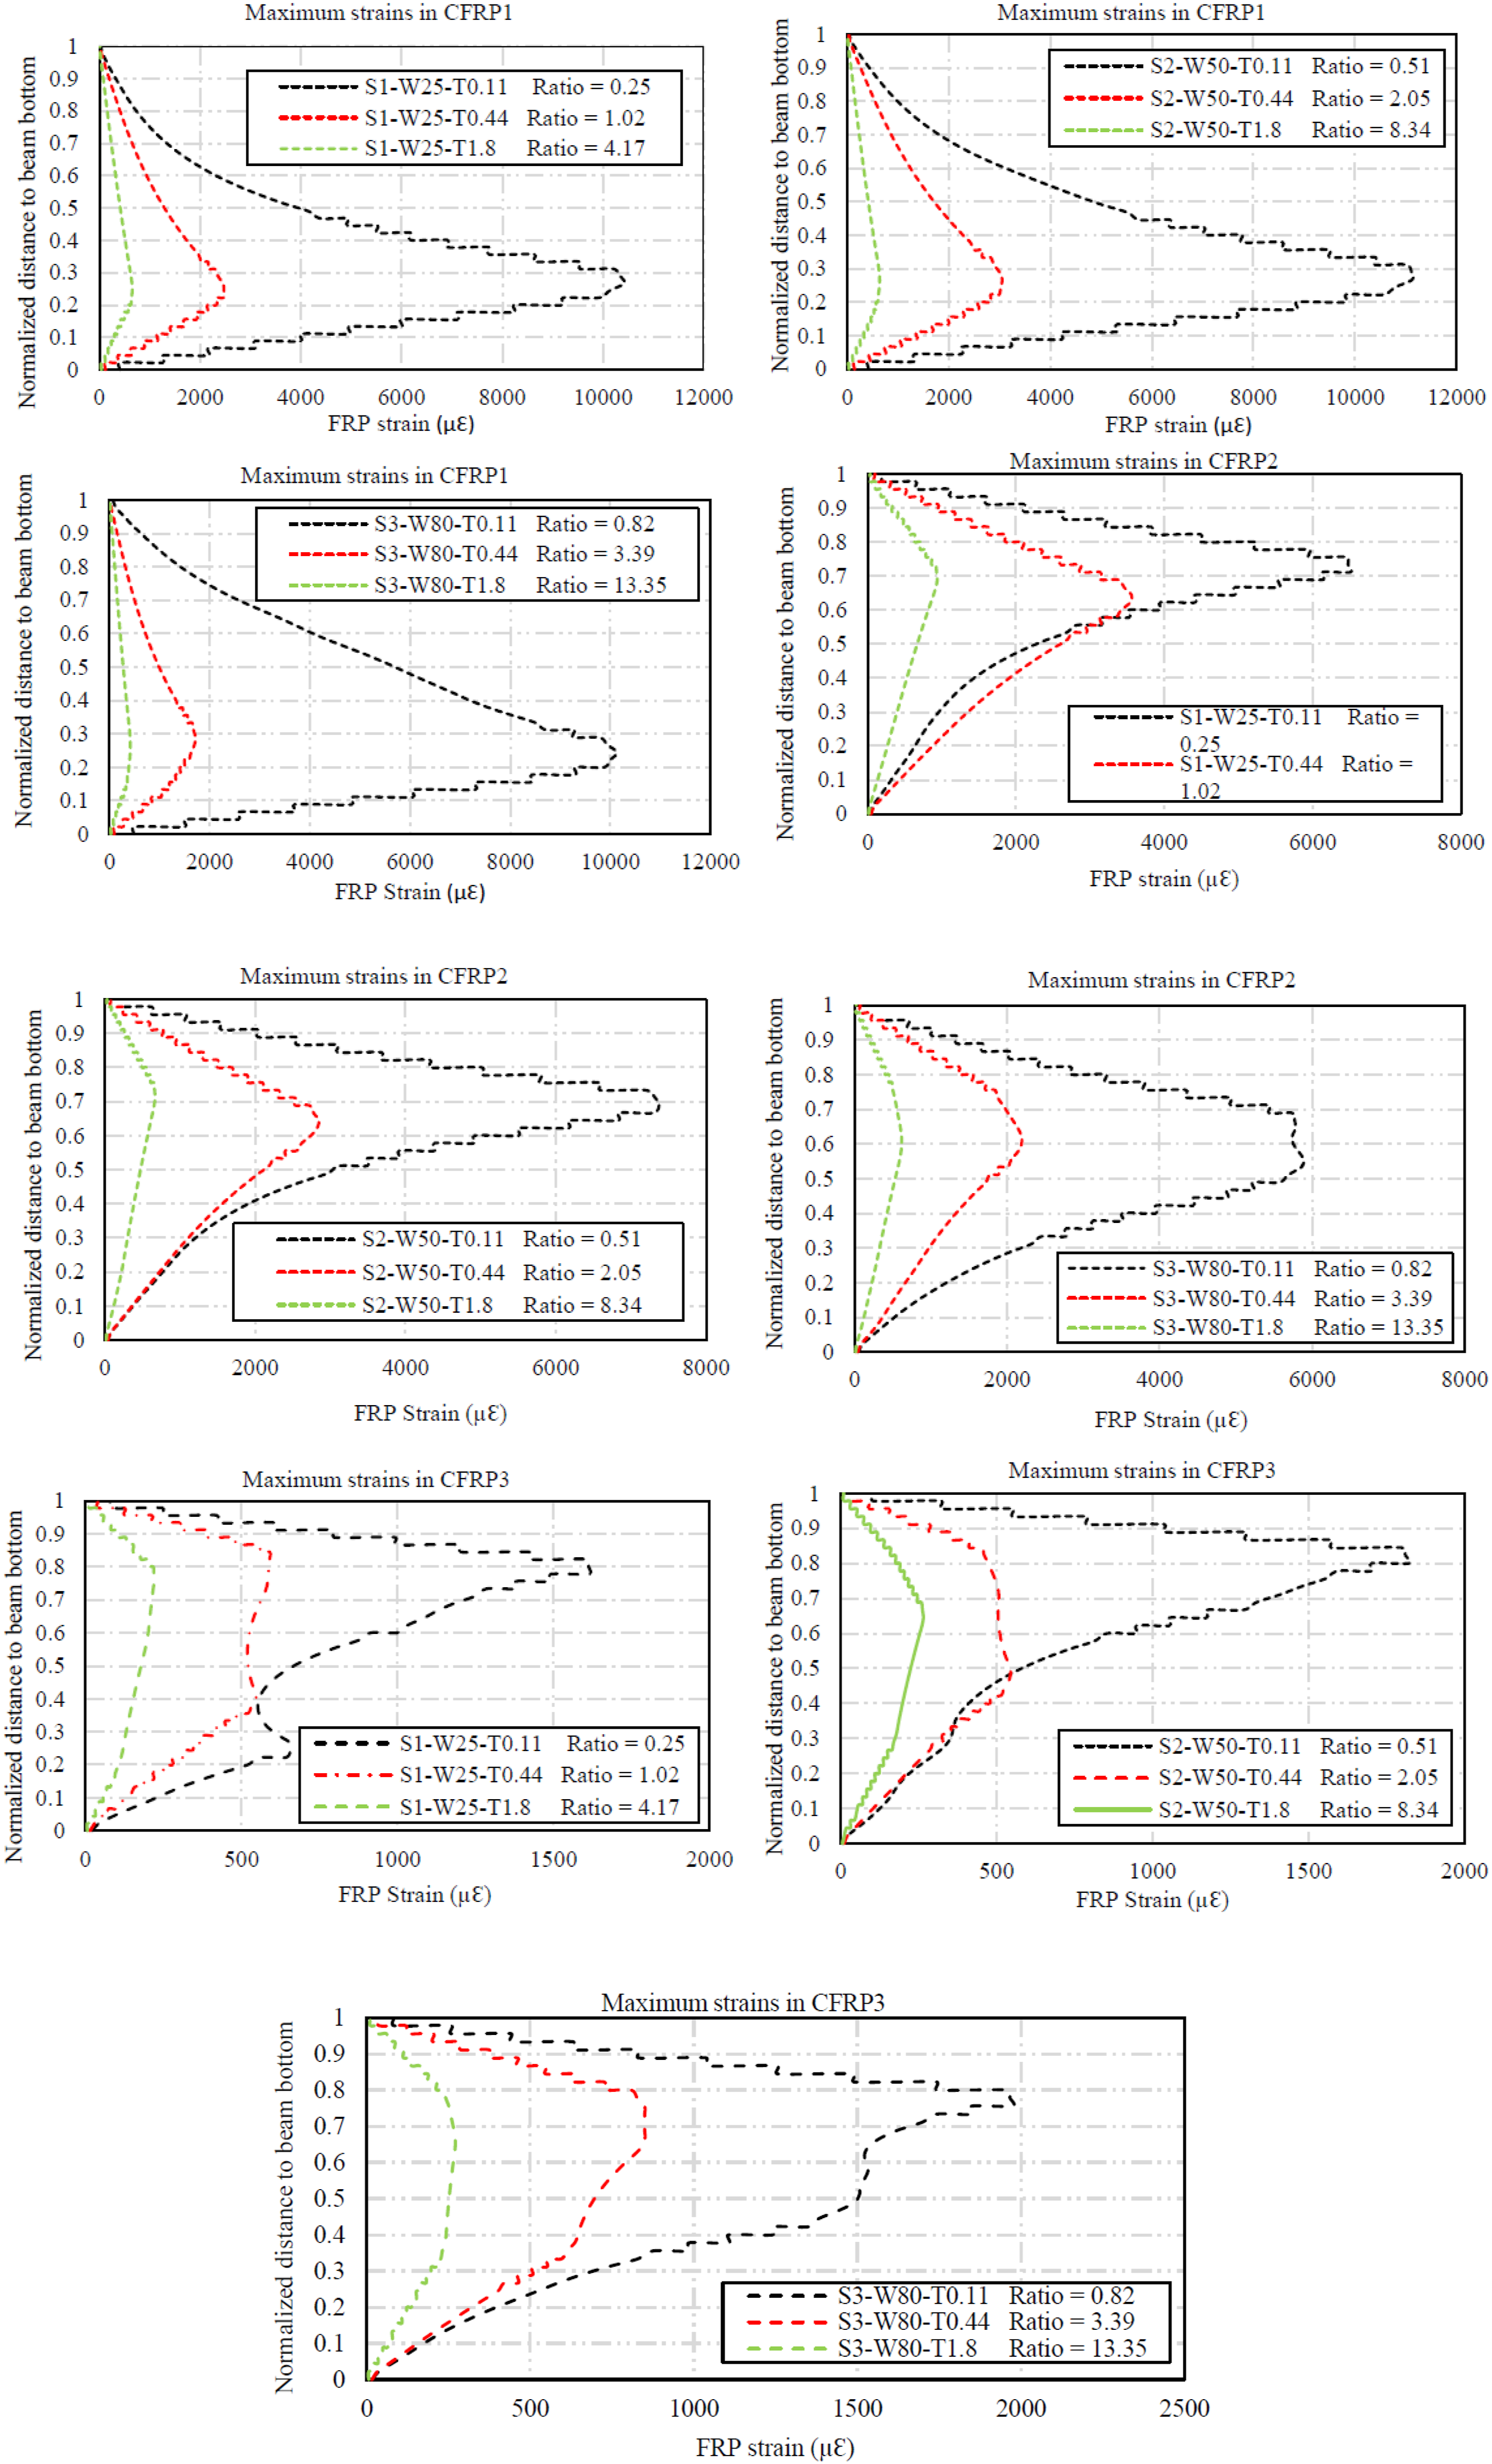
For the second series, the maximum recorded strains before ultimate shear failure in specimens R1.02, R2.05, and R3.39 were 2487 µԐ, 3059 µԐ, and 1909 µԐ, respectively. For the third series, the maximum strains experienced by the first fibers were 655 µԐ, 639 µԐ, and 539 µԐ, associated with specimens R4.17, R8.34, and R13.35 (Figure 7). The first reason for these results might be the larger cross-sections offered by the second and third series. The second reason might be premature debonding at the interface layers. Because of high stress concentrations around the major shear cracks, the shear stresses do not transfer proportionally along the whole of the cohesive layers. This results in not using the maximum potential of the interface layer in the upper parts of the shear cracks (Figure 7).
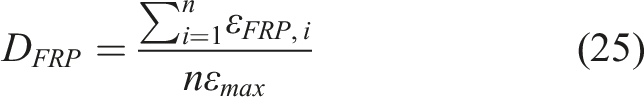
Effective strain
Vertical strains along the fiber depth
The maximum distributions of strain before the ultimate load-carrying capacities of specimens with increasing EB-FRP-to-steel-stirrup ratio give a good indication of their contributions to shear resistance. However, to obtain the effective strain, all the fibers intercepted by the principal shear crack must be evaluated to reach the limits of effective strain in all specimens. As presented in Figure 7, FRP responses at their ultimate state crossed by the main shear cracks are illustrated for CFRP1 strips in series1, which were subjected to higher strains where the maximum widths of cracks are located, compared to series2 and series3. It is noteworthy that there is only one pick point on the strain profile graphs for each CFRP1 in series1, indicating that these strips are not intercepted by minor shear cracks. However, because of marginal shear cracking, there is more than one pick point in CFRPs2 and CFRPs3 for series2 and series3 at the maximum strain states (Figure 7).
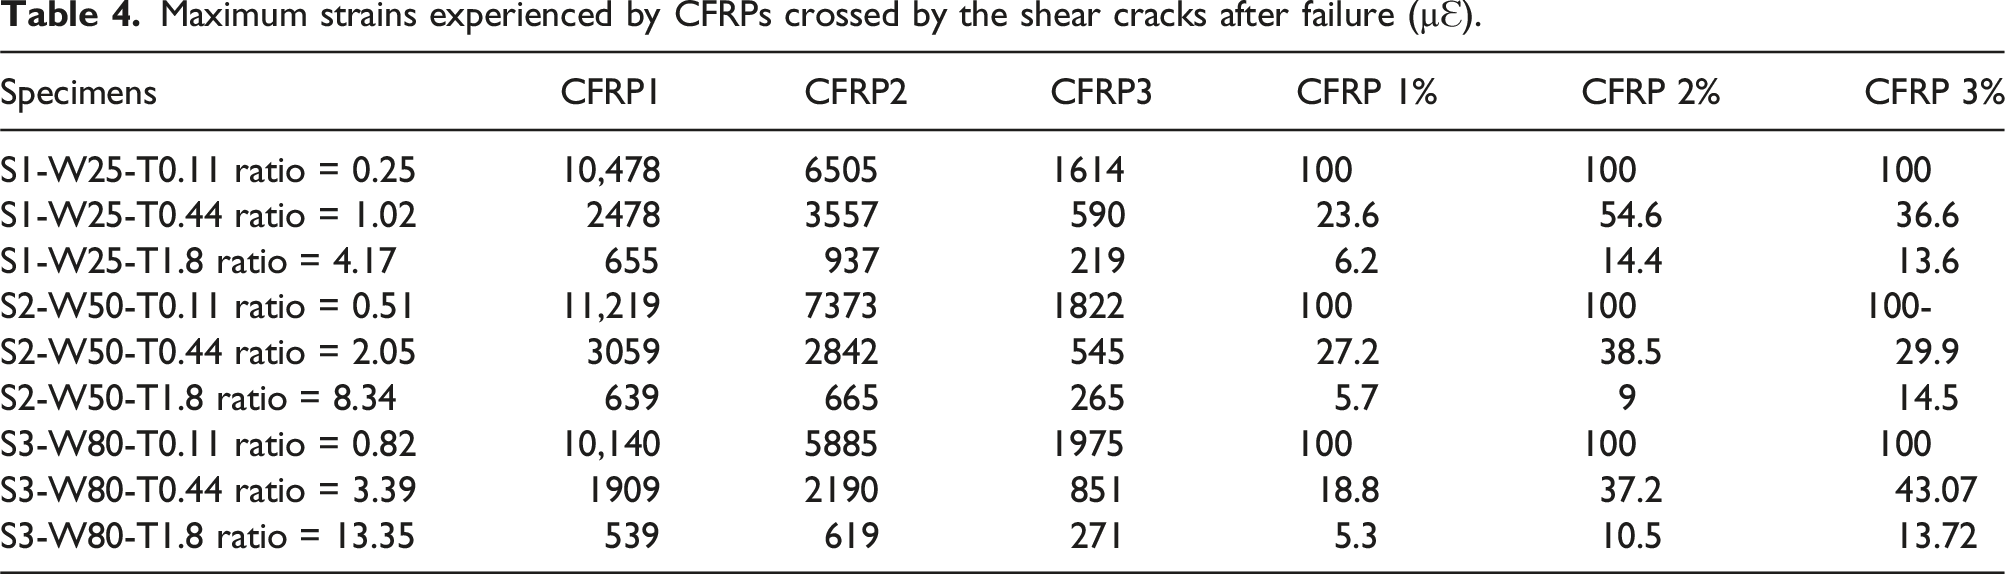
Maximum strain in CFRPs1 specimens
Maximum strains experienced by CFRPs crossed by the shear cracks after failure (µԐ).
Maximum strain in CFRPs2 specimens
Evaluation of the maximum strain on the CFRPs2 strips, which were intercepted by more marginal shear cracks, showed less effective bonding than CFRP1 strips as the CFRP2 strip-to steel-stirrup ratio increased. By increasing the ratio (R) for specimens with 25-mm-wide strips, as the thickness increased from 0.11 mm to 0.44 mm and then to 1.8 mm, the maximum strains experienced by specimens R0.25, R1.02, and R4.17 were 6505 µԐ, 3557 µԐ, and 937 µԐ, respectively. In other words, they were exposed to 54.6% and 14.4% (for specimens R1.02 and R4.17) of the maximum strain in specimen R0.25.
With regard to the specimens strengthened by 80-mm-wide strips (R0.82, R3.39, and R13.35), by increasing the thickness (and consequently the ratio) from 0.111 mm to 0.444 mm and then to 1.8 mm, the maximum strains experienced by the CFRP2 strips were 5885 µԐ, 2190 µԐ, and 619 µԐ. These strains indicate that specimens R3.39 and R13.35 were subjected to 37% and 10% of the maximum strain in specimen R0.82, as shown in Table 4 and Figure 7.
Maximum strain in CFRP3 specimens
CFRP3 strips were located on the tips of major shear cracks, where crack width is at a minimum. Therefore, it is expected that most failures of CFRP3 strips occur because of premature debonding because they have the shortest effective length and are not subjected to the maximum strains experienced by the two previous sets of CFRP strips (Figure 7). Regarding the specimens strengthened with 80-mm-wide strips, by increasing the thickness for specimens R0.82, R3.39, and R13.35, the maximum strains reached were 1975 µԐ, 851 µԐ, and 271 µԐ, respectively, which shows that the maximum amounts of strain in R3.39 and R13.35 were 29.9% and 14.5% of that in specimen R0.82 because of increasing ratio (R) (Table 4 and Figure 7). It can be concluded that the reduction in strain on CFRP3 can be attributed to the minor shear cracks that intercept the CFRP3 strips. Table 4 and Figure 7 show that increasing the ratio of CFRP strips results in more distributed shear cracks. Furthermore, as presented in Figure 7, CFRP2 and CFRP3 strips had more than one pick point on the maximum recorded strain profiles, which indicates that they were intercepted by marginal shear cracks.
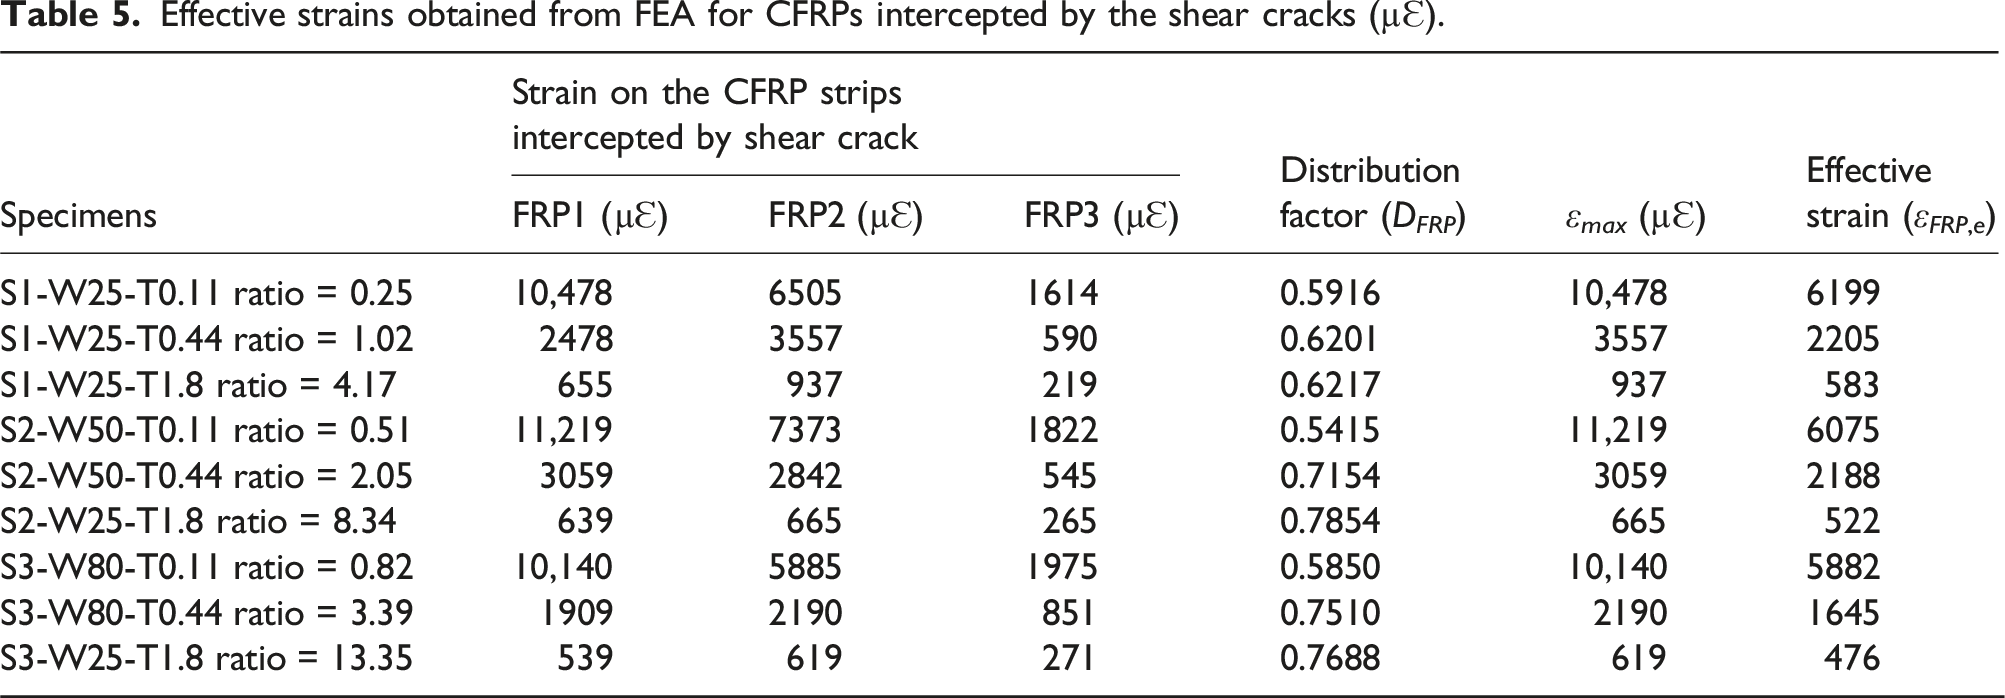
Calculating and comparing the effective strains with other guidelines
Effective strains obtained from FEA for CFRPs intercepted by the shear cracks (µԐ).
Compassion between the effective strains versus ratio of EB-CFRPs-to-steel-stirrups for the proposed models and the other guidelines.
The model proposed by Chen and Teng
35
for the shear contribution of EB-FRP is: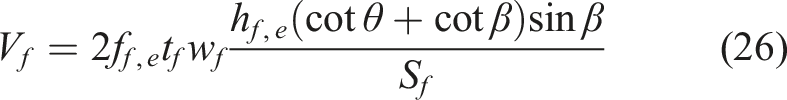

Comparison between the effective strains obtained from FEA versus the existing guidelines (µԐ).
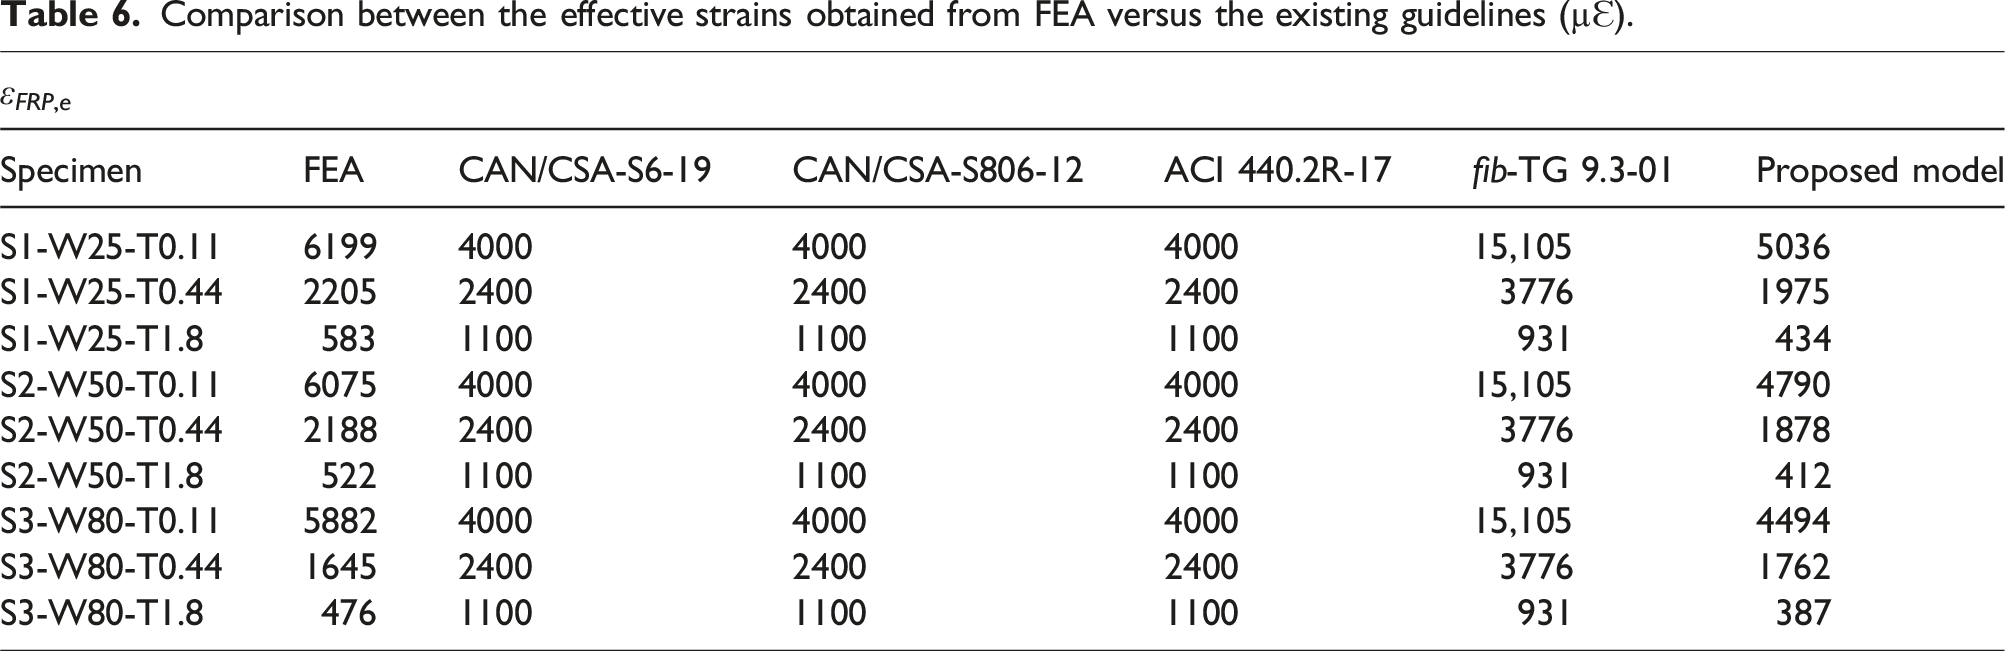
As presented in Table 6, the effective strains calculated by the proposed analytical model compared to the codes and design guidelines19–22 show higher accuracies for the effective strains obtained from numerical results, proving that the proposed model can be applied to obtain effective strains with high FRP-to-steel-stirrup ratio. The maximum strain experienced by EB-CFRP increased slightly just after complete shear failure of the specimens, which was captured by FEA (Figure 9). This might be attributed to the immobilized zones experiencing the strains released from the debonded areas. a) Maximum strains experienced by steel strirrups1, 2, 3 and CFRP1, 2, 3 strips at the maximum shear forces for the studied specimens (interactions between steel-stirrups and EB-CFRPs) and b) maximum strains experienced by CFRP1, 2, 3 strips during the whole process of the loading (after complete failure of the specimens) for the studied specimens.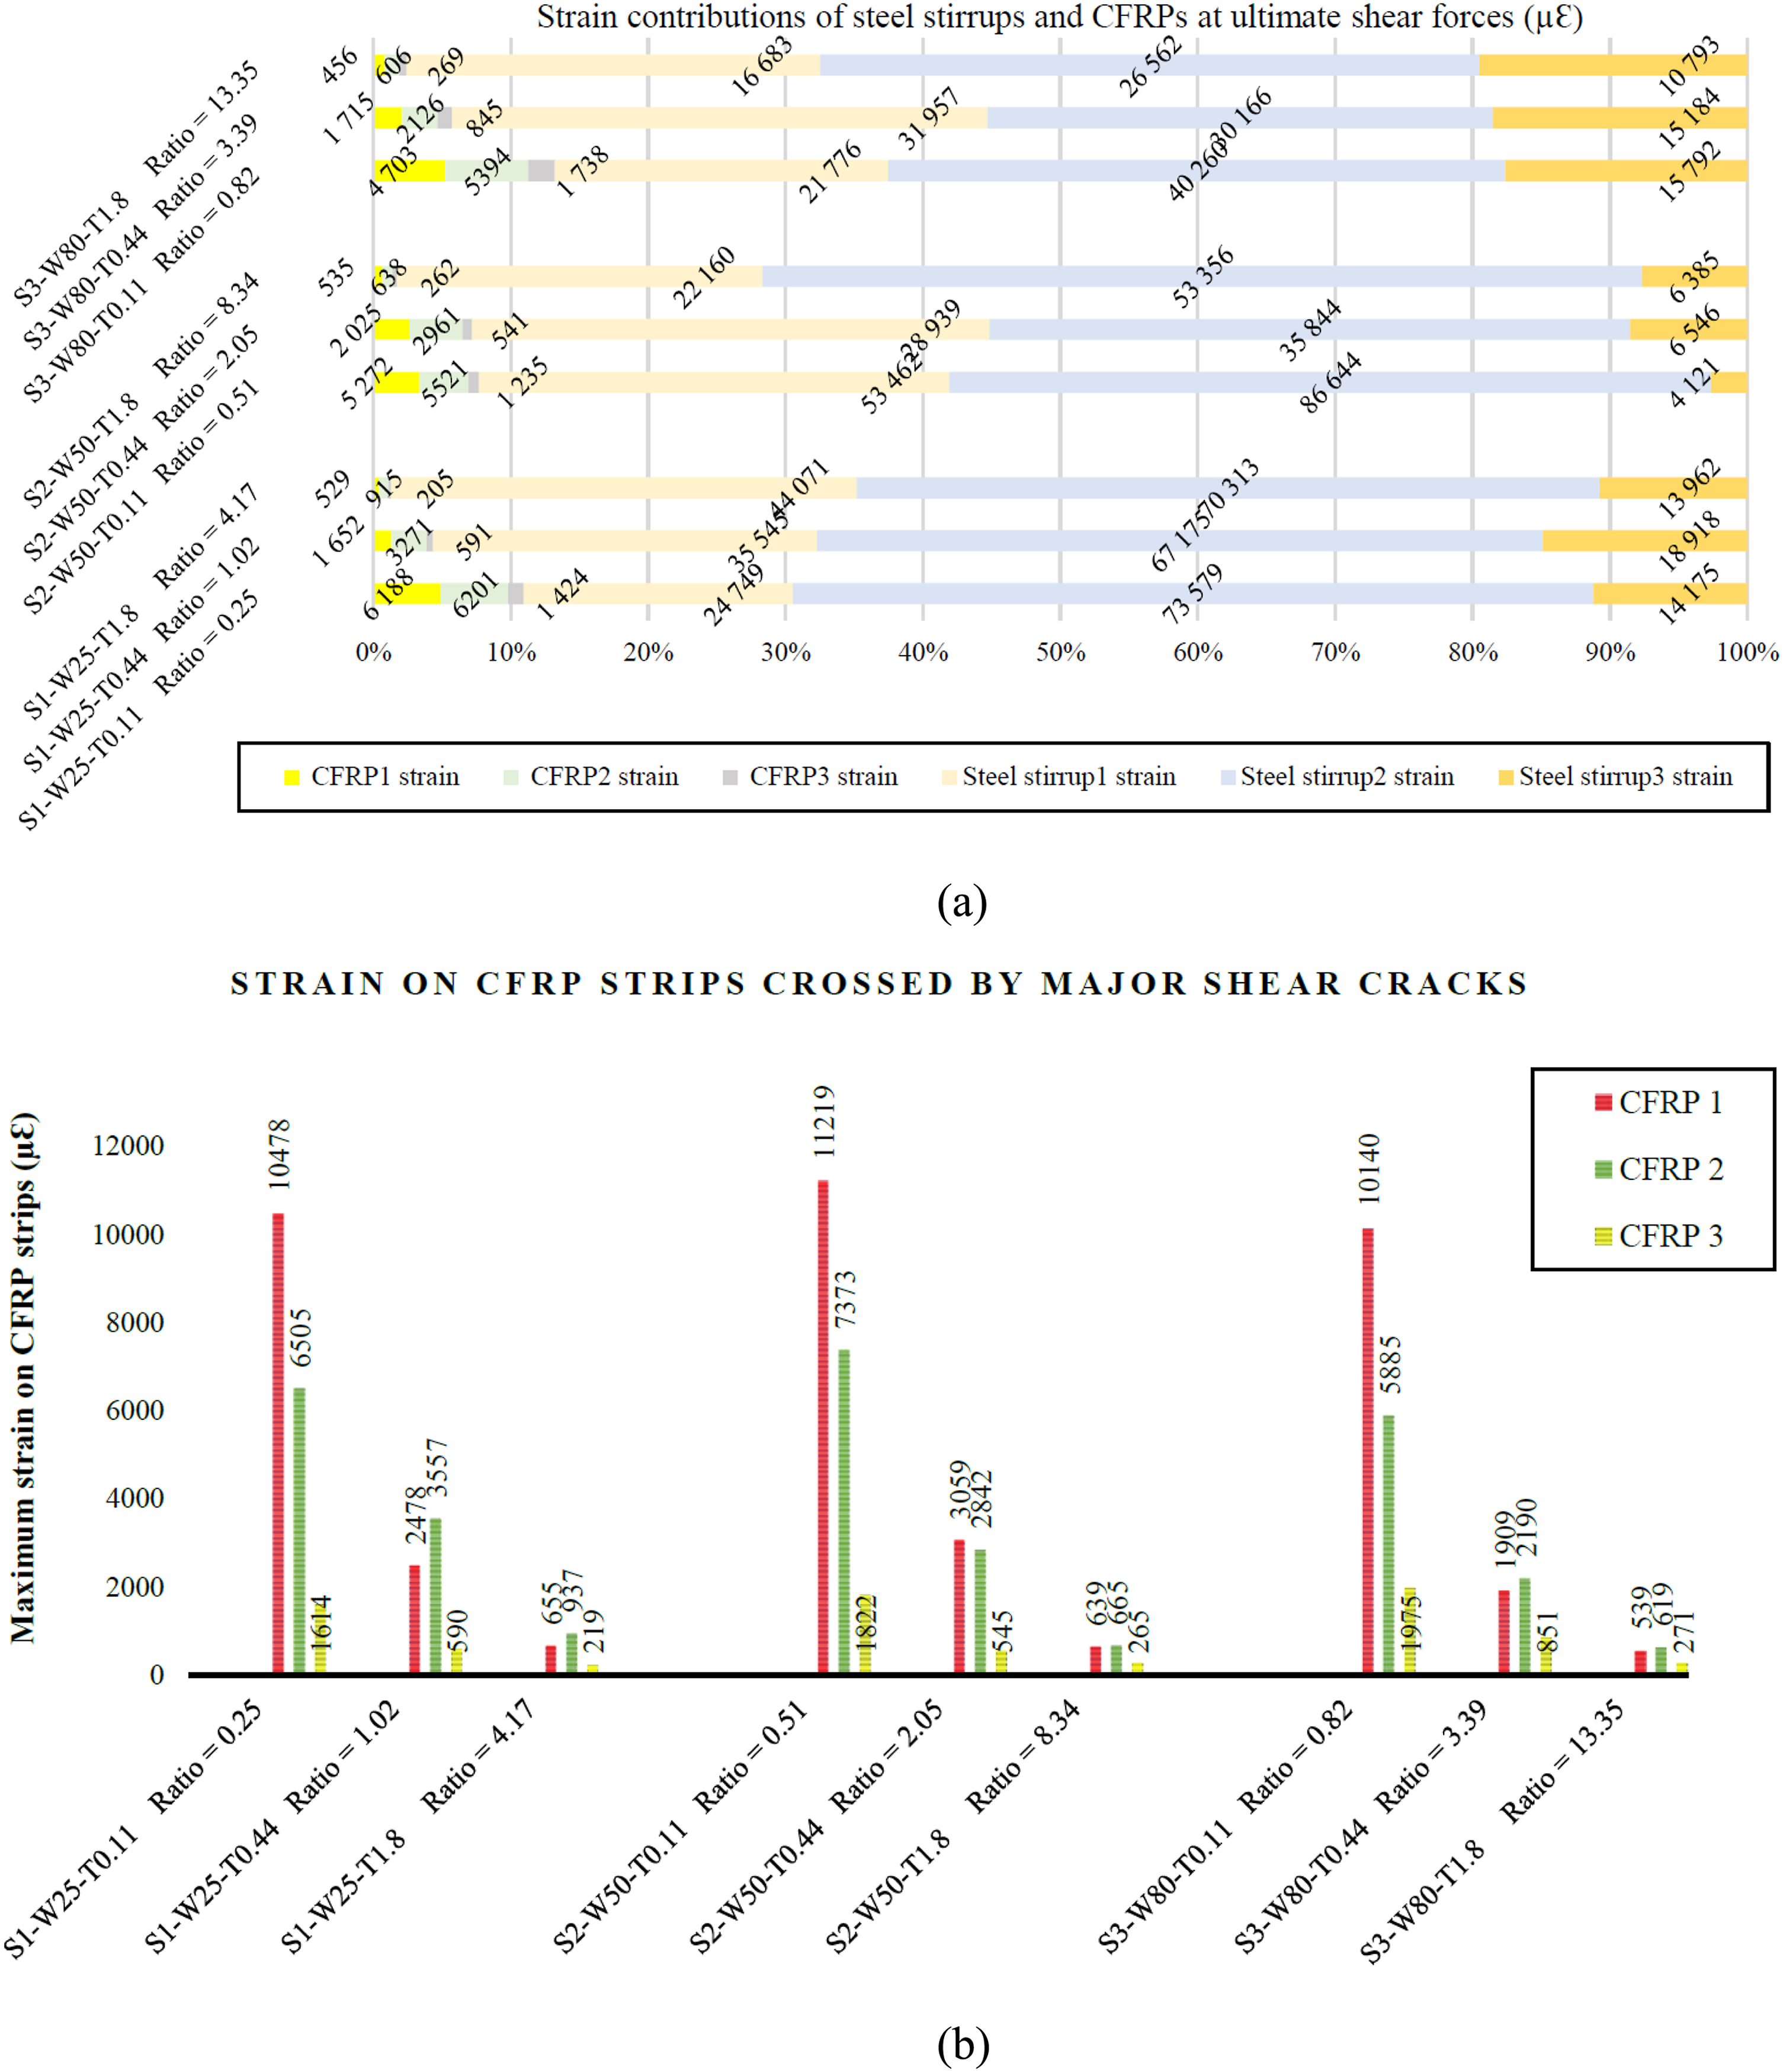
Inverse interaction between EB-CFRP and steel-stirrups
The aim of the work described in this section was to develop an analytical model for North American guidelines19–21 based on the results obtained from numerical analysis, which takes into account the inverse interaction between EB-FRP and steel-stirrups as their ratio increases. The interaction for each CFRP strip and the corresponding steel-stirrup was evaluated, and the new effective strain was proposed to replace the existing effective strain in the guidelines. The new effective strain is a function of the ratio of the maximum strain on EB-FRP to that on steel-stirrups, the ratio of maximum shear stresses between concrete and steel-stirrups and to that between concrete and EB-CFRP, and the EB-FRP-to-steel-stirrup ratio to develop analytical models by considering the inverse interaction between steel strips and concrete.
Interaction between CFRP1 and steel-stirrups1
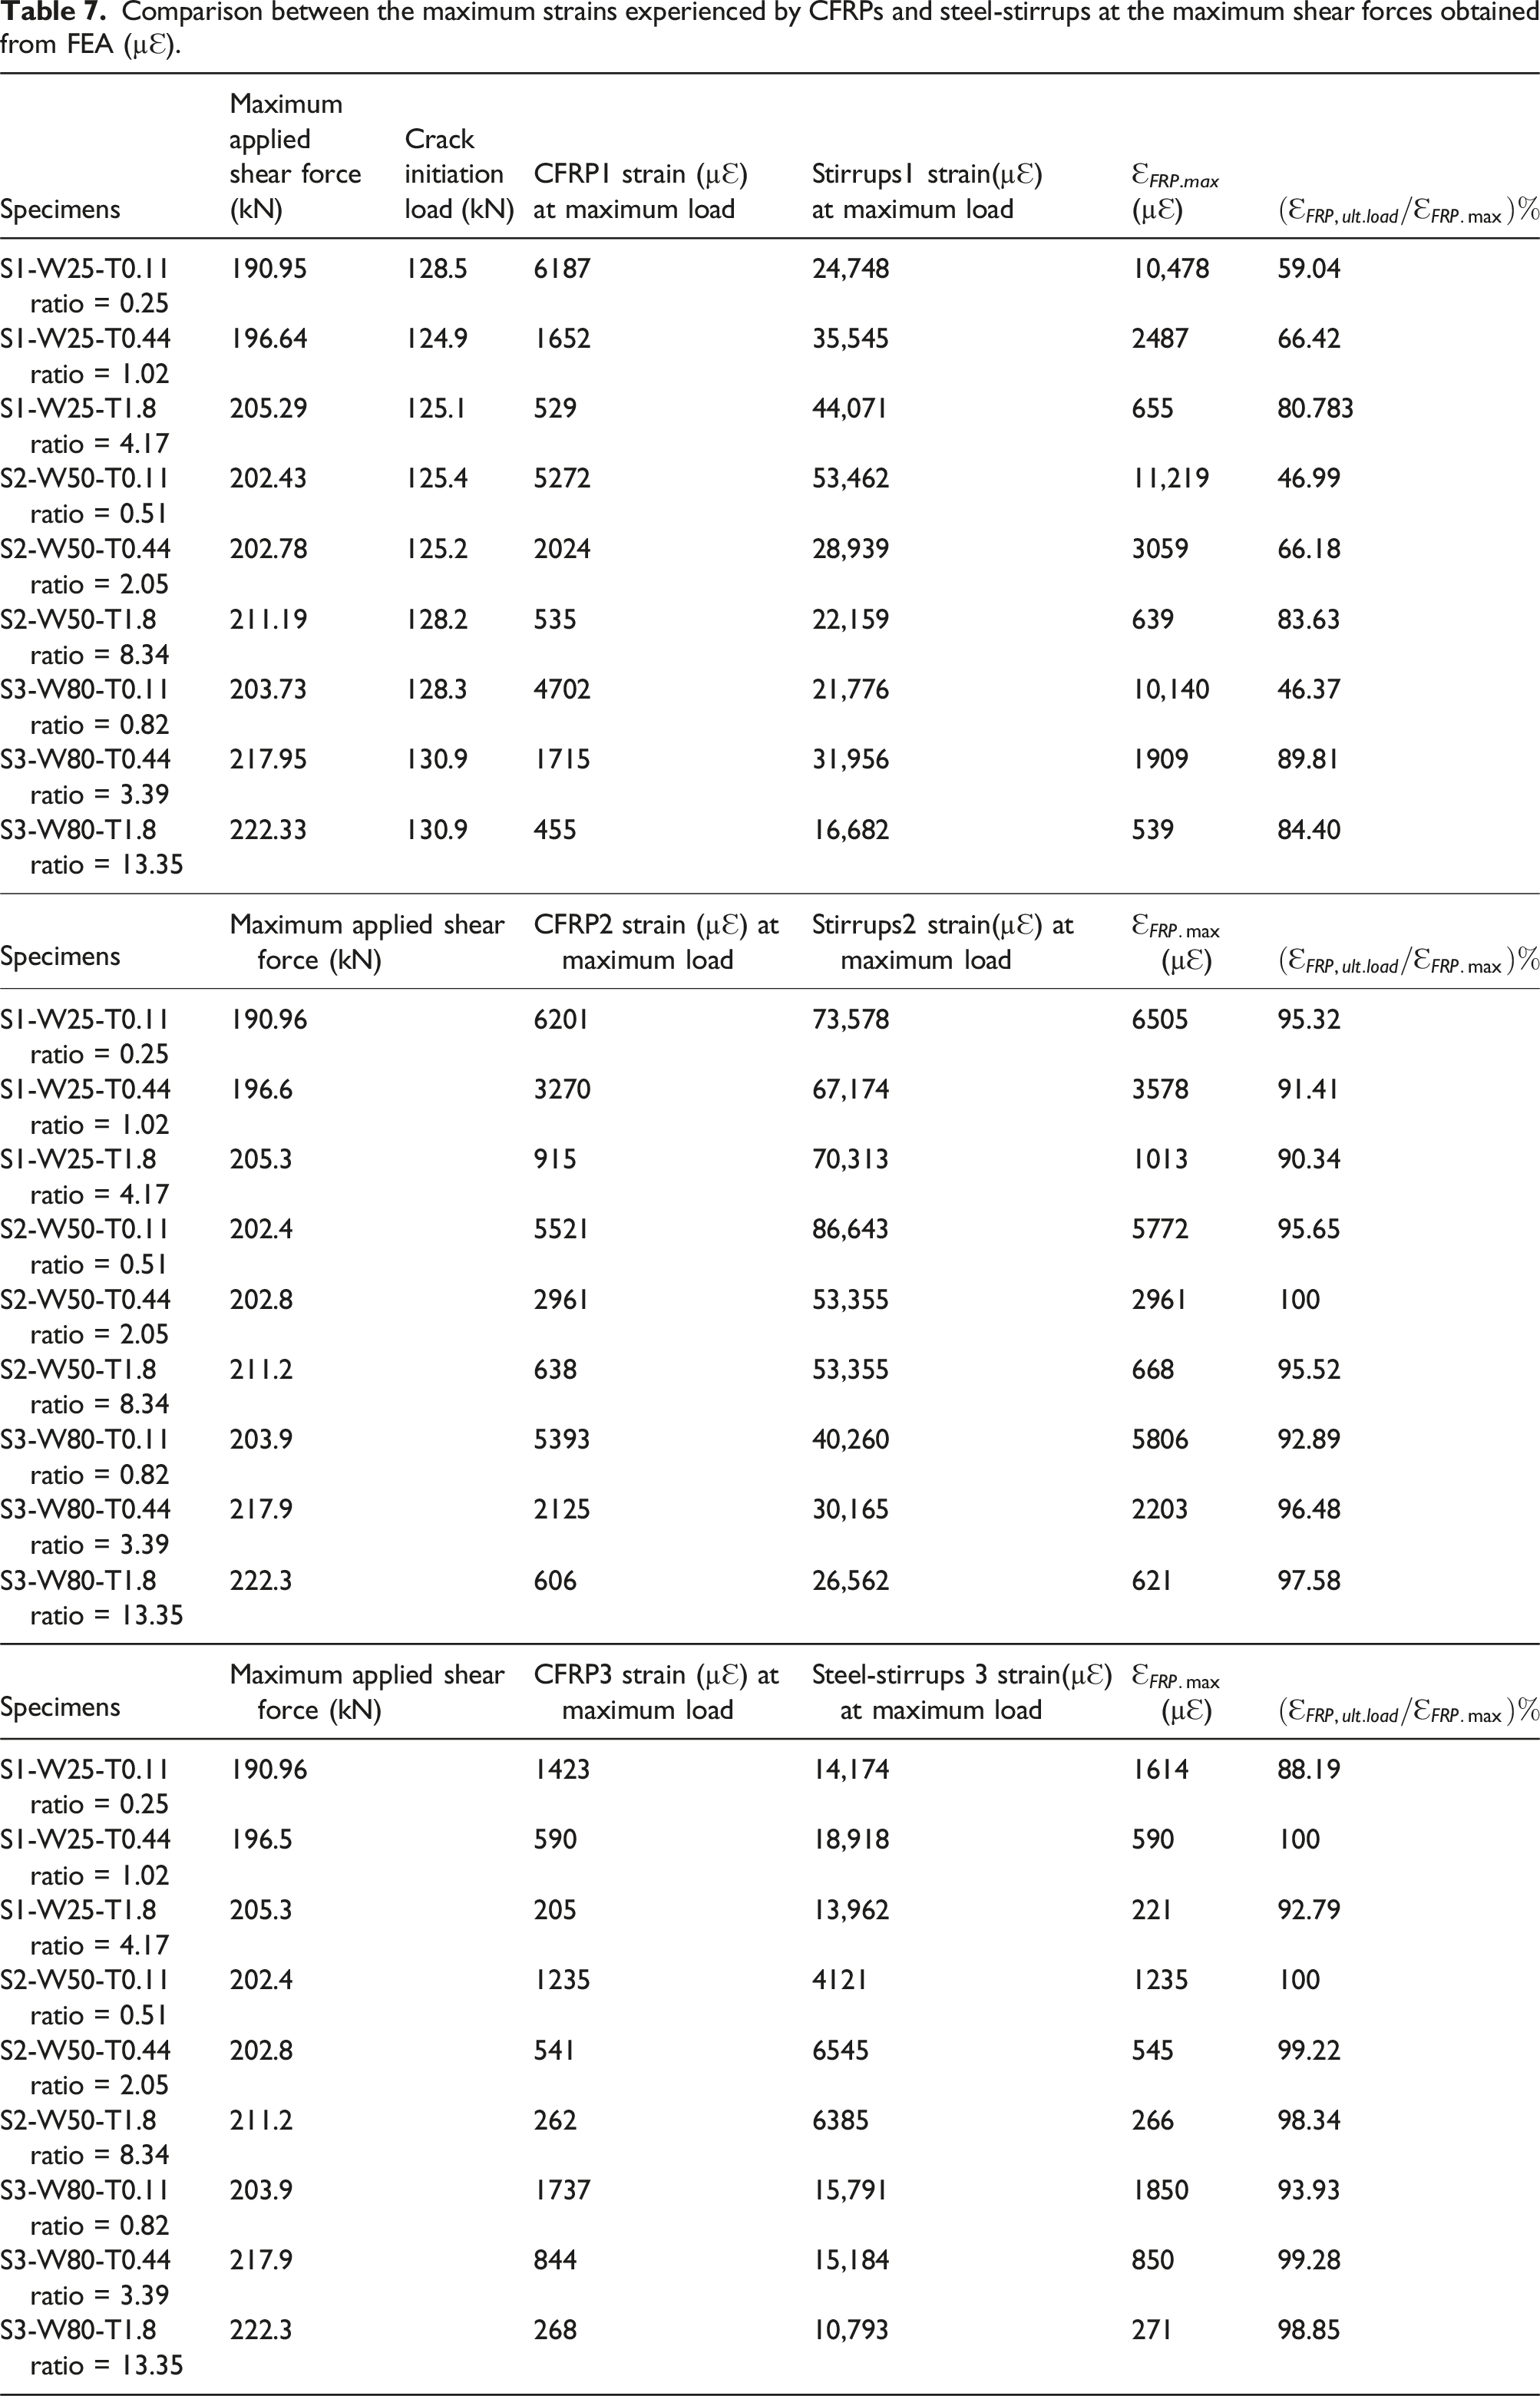
Comparison between the maximum strains experienced by CFRPs and steel-stirrups at the maximum shear forces obtained from FEA (µԐ).
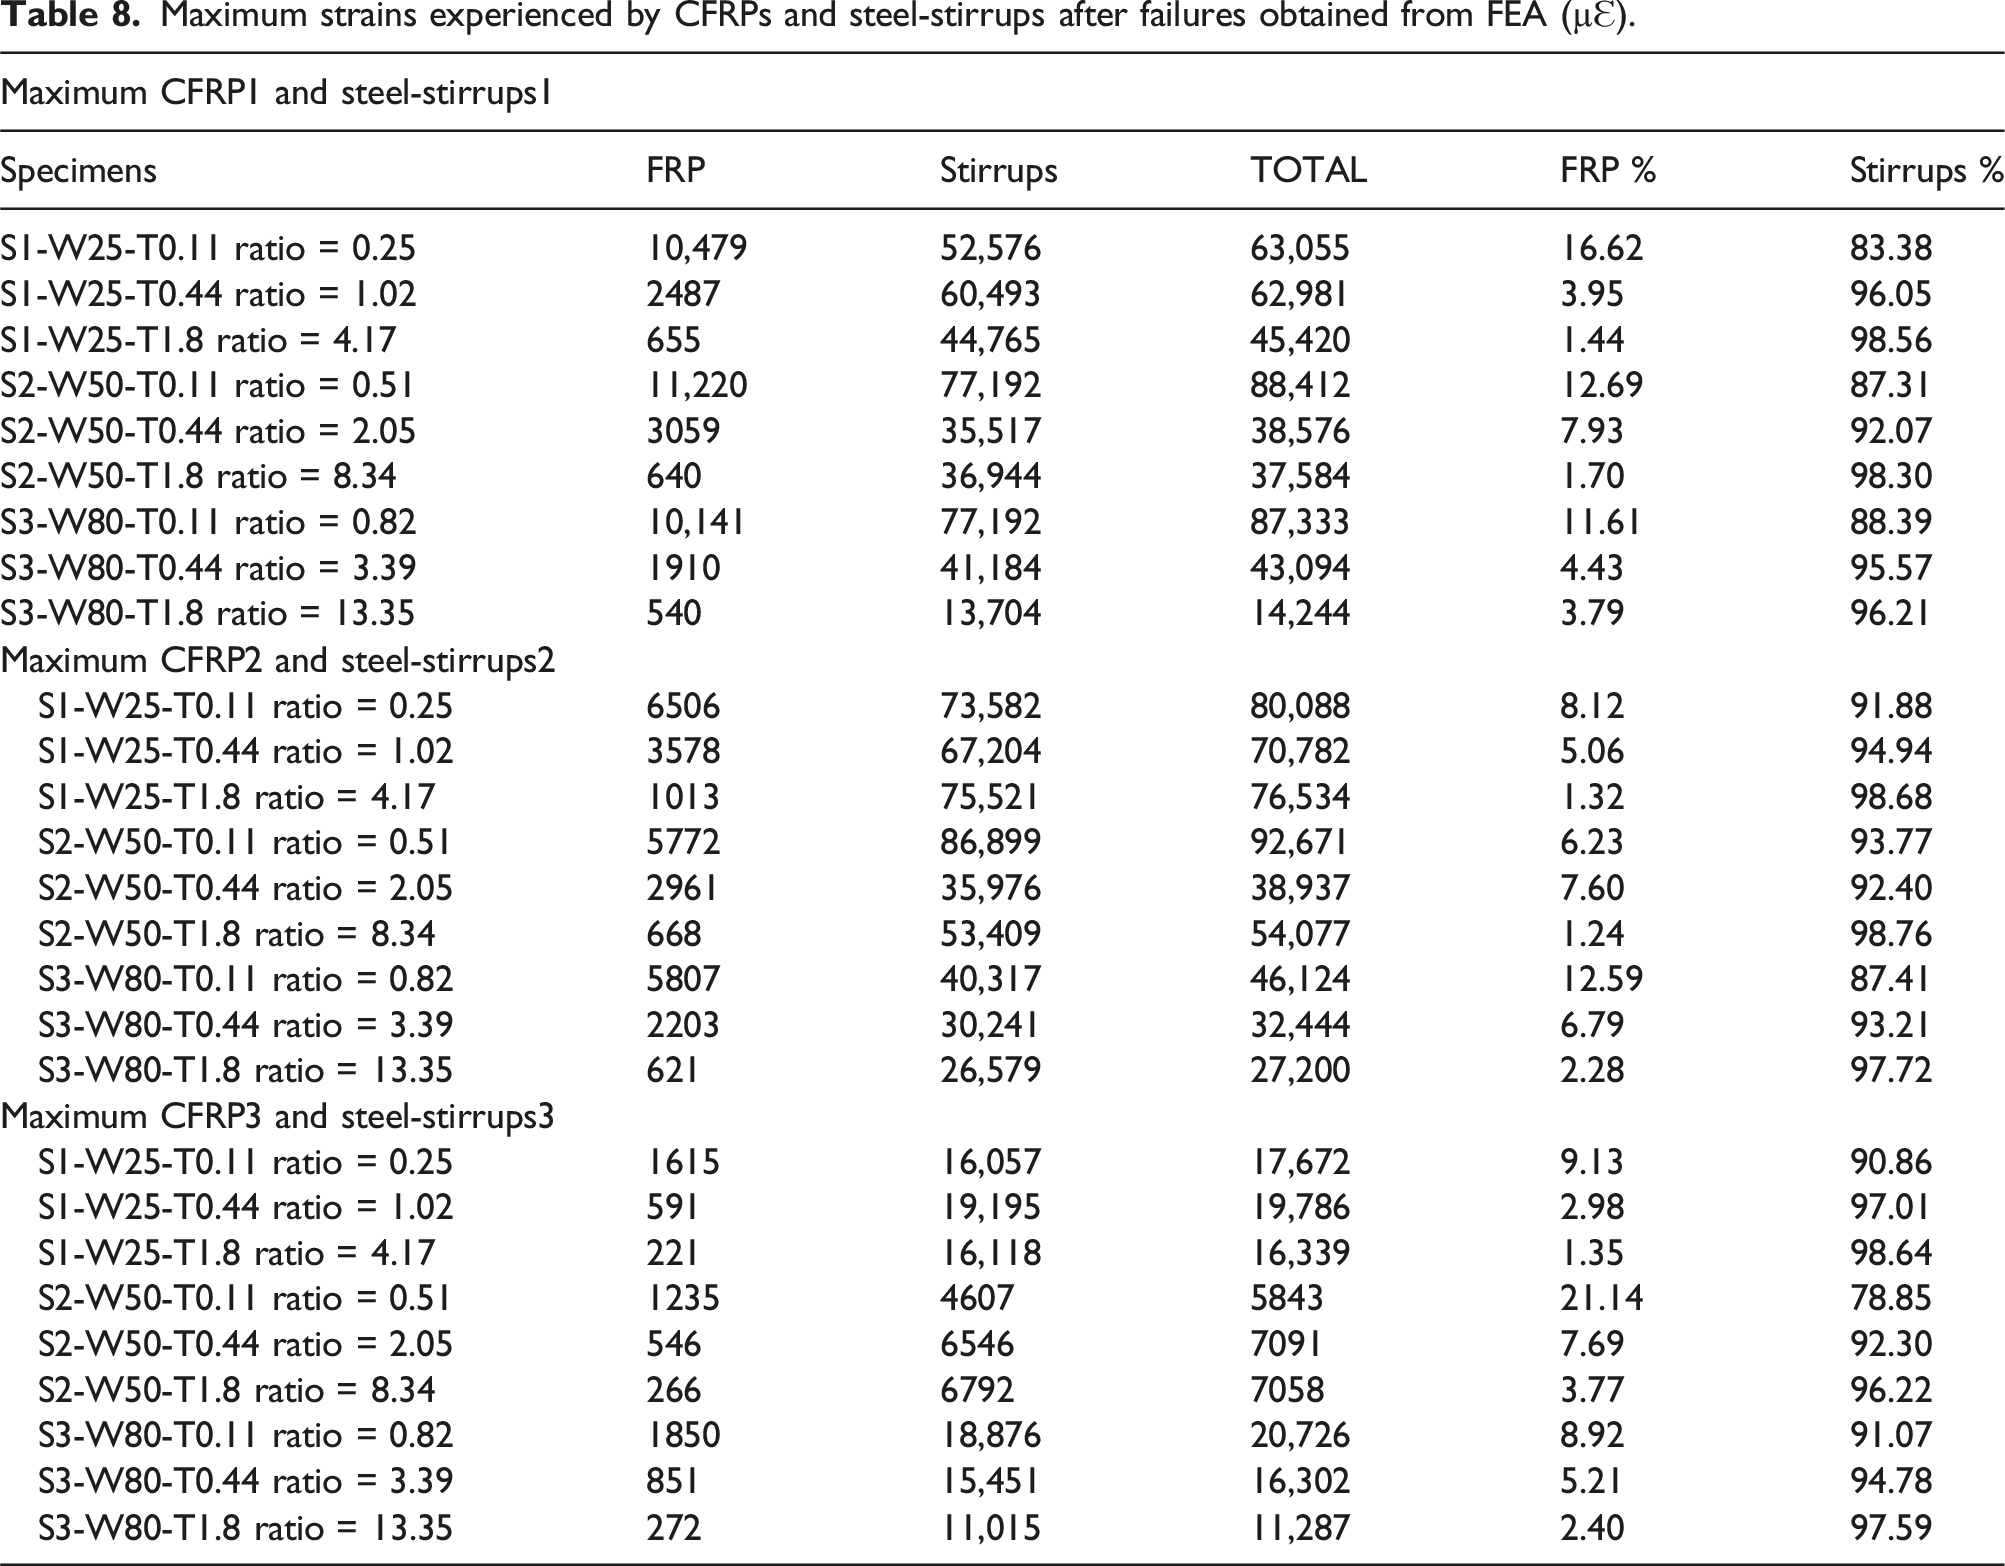
Maximum strains experienced by CFRPs and steel-stirrups after failures obtained from FEA (µԐ).
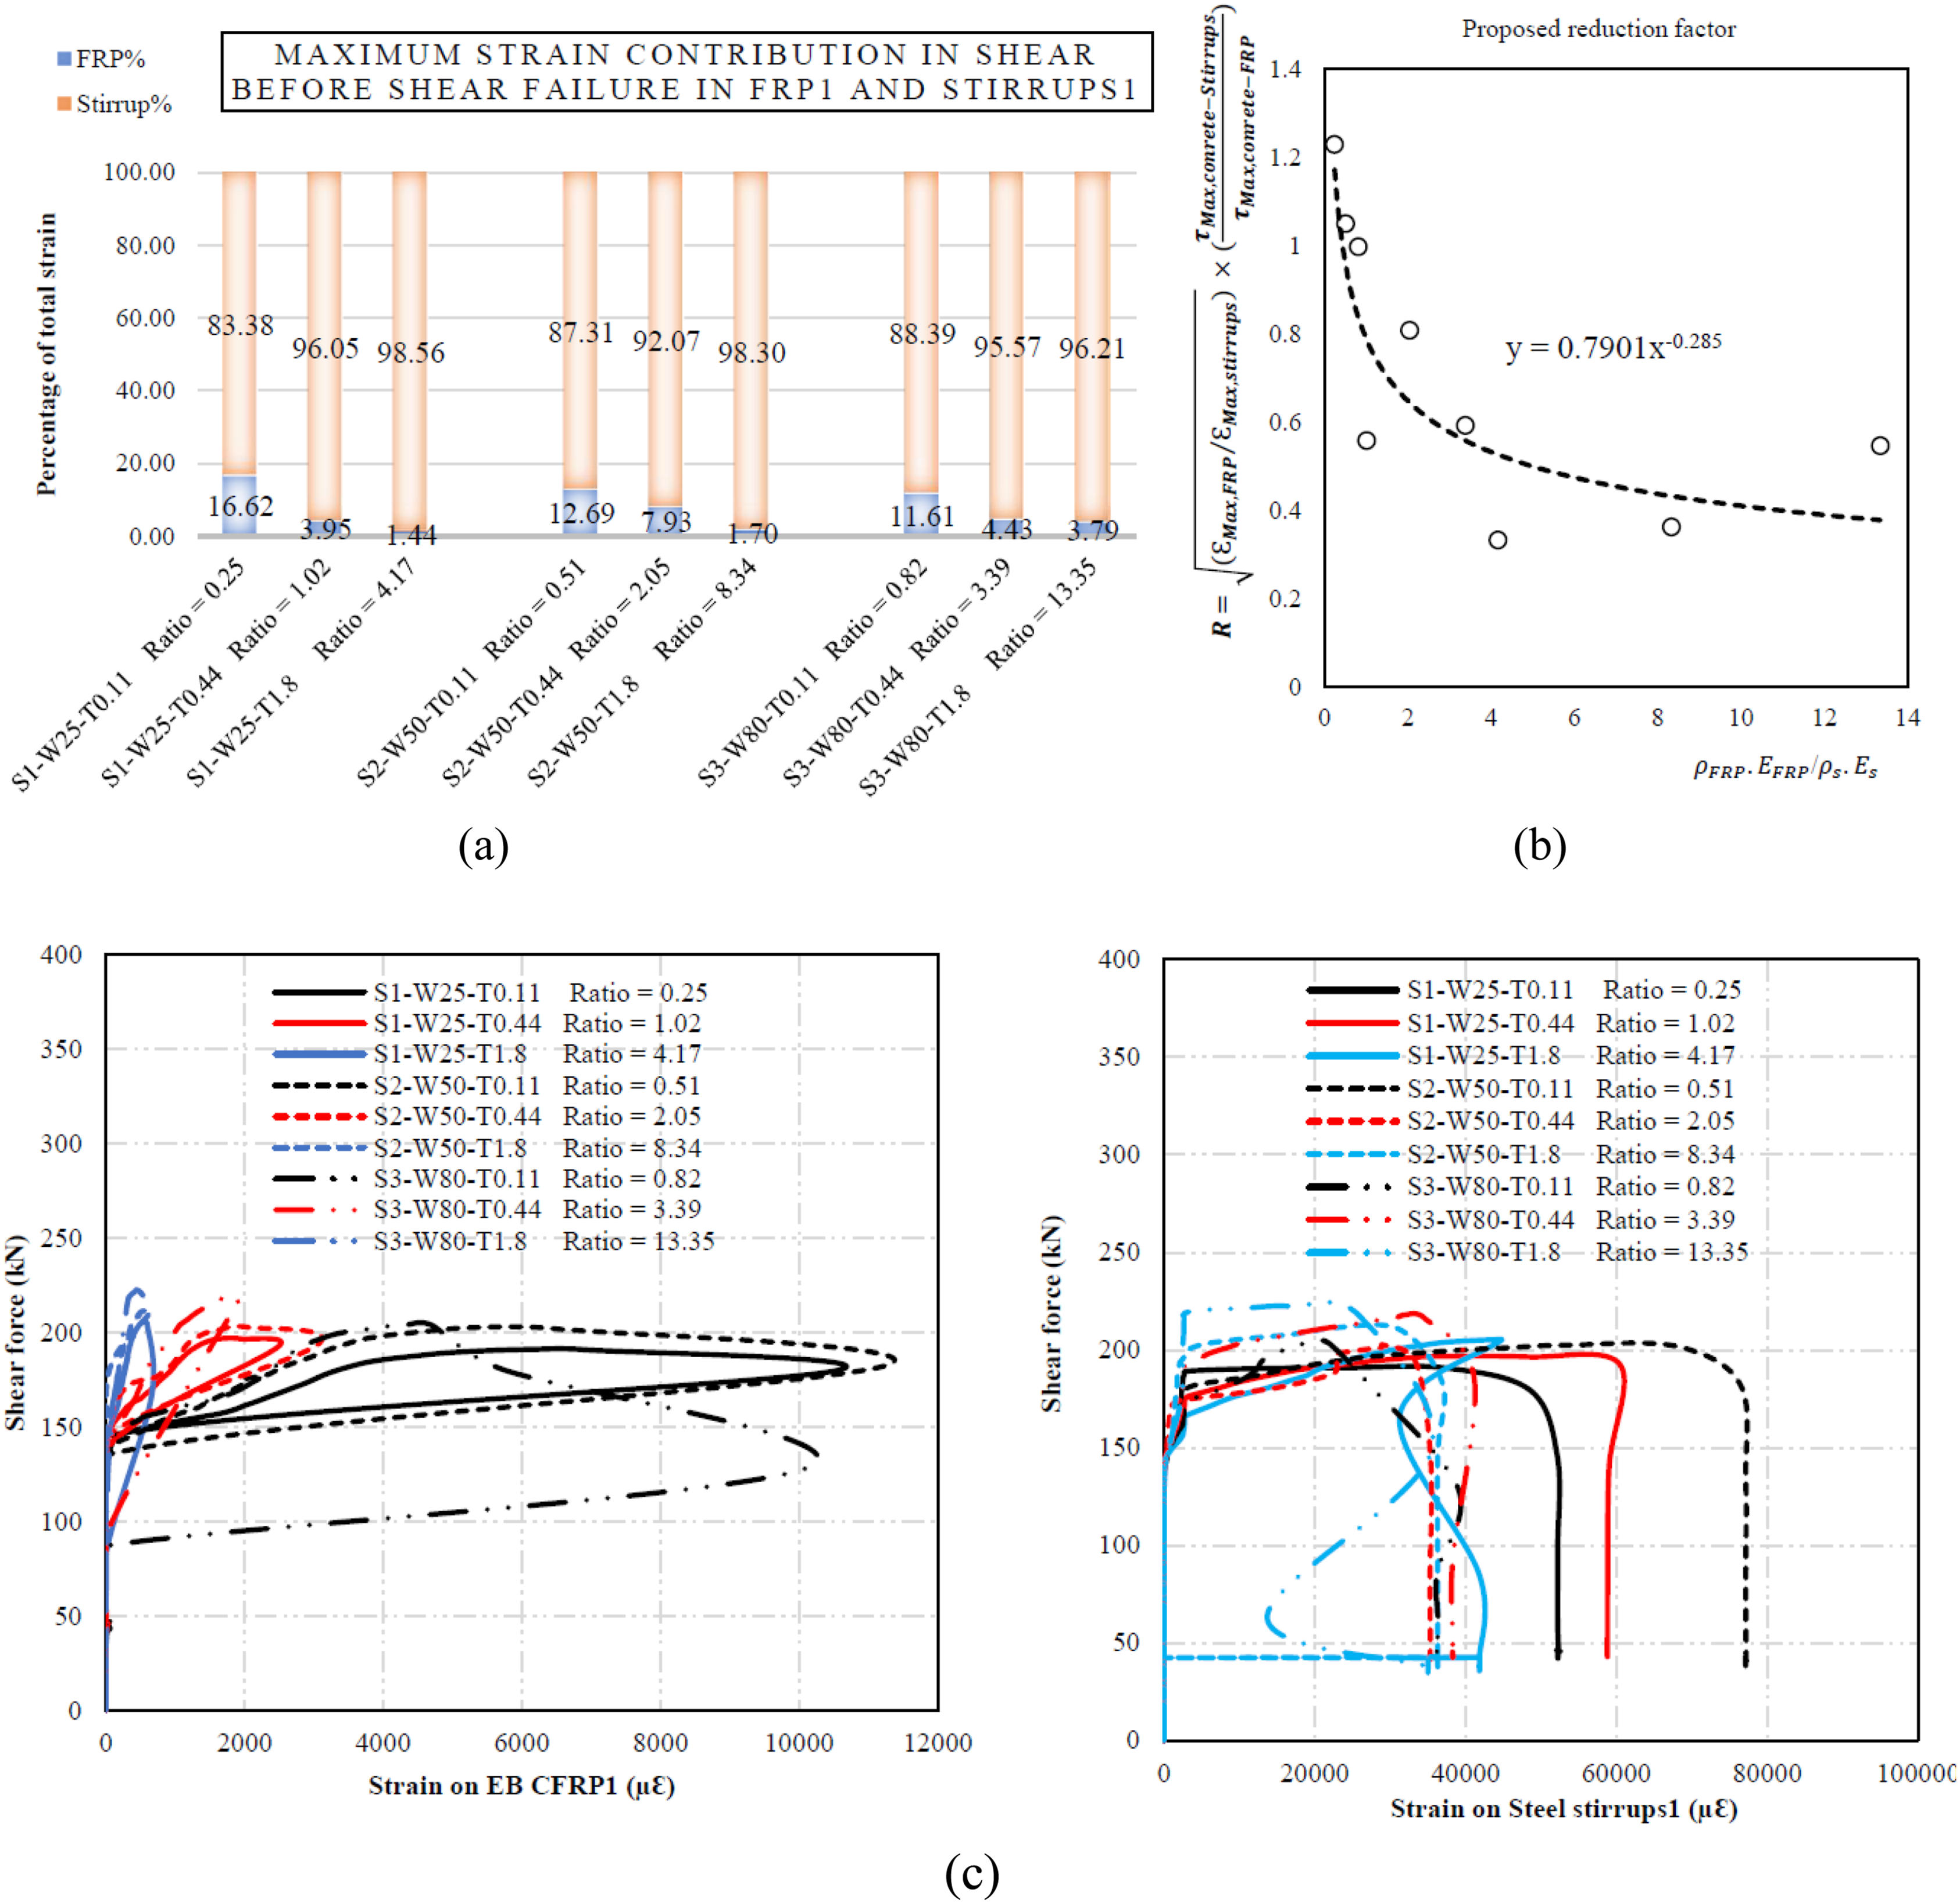
(a) Interactions between strirrups1 and CFRP1 based on the maximum strain experience by fibers during the loading process, (b) proposed reduction factor versus the ratio of EB-CFRPs1-to-steel-stirrups1, and (c) applied shear forces versus strains experienced by steel strirrups1 and CFRP1 for the studied specimens.
Regarding the specimens strengthened with 80-mm-wide strips, by increasing the thickness (from 0.11 to 0.44 and then to 1.8 mm), the strains on the CFRPs1 at the ultimate load-carrying capacities of the beams were 4703 µԐ, 1715 µԐ, and 456 µԐ for specimens R0.82, R3.39, and R13.35. These strains were 46%, 89%, and 84% of the maximum fiber strains experienced just after complete shear failure. The corresponding maximum stirrup strains were 21,776 µԐ, 31,957 µԐ, and 16,683 µԐ, which were less than the yielding point strain (51,000 µԐ) (Table 7, Table 8, Figure 9, and Figure 10). In the CFRPs1, none of the steel-stirrups reached the yielding point expected for specimen R0.51 (53,462 µԐ).
Interaction between CFRP2 and steel-stirrups2
Compared to the CFRPs1 and the steel-stirrups1 specimens, the contribution of steel-stirrups was greater in specimens strengthened with 25-mm-wide and 50-mm-wide CFRP strips before shear loss. This was the case because marginal shear cracks crossed a greater number of narrower strips, resulting in less effective bond length. However, unlike the CFRPs1 and steel-stirrups1 specimens, most of the steel-stirrups reached their ultimate strain (51,000 µԐ). This was due to major shear cracks that crossed the CFRPs2 and the steel-stirrups2, intercepted the CFRPs1 and the steel-stirrups1 (except for the specimens strengthened with 80-mm-wide strips), and then propagated towards the supports. Another reason may be that the second CFRPs were crossed by marginal shear cracks, which in turn reduced the bond length between concrete and CFRPs, leading to premature debonding and loss of concrete shear resistance because of more distributed shear cracks. Therefore, the greatest contributions to shear resistance were offered by steel-stirrups until their yielding points. For specimens strengthened by 25-mm-wide strips, the maximum strains were 6201 µԐ, 3270 µԐ, and 915 µԐ. For specimens R0.25, R1.02, and R4.17, this occurred at an ultimate shear force of 190.9 kN, 196.6 kN, and 205.3 kN, respectively. These strains were 95%, 91%, and 90% of the maximum strains on fibers experienced just after shear failure. The corresponding maximum strains recorded on steel-stirrups were 73,579 µԐ, 67,175 µԐ, and 70,313 µԐ, respectively, indicating that all the steel-stirrups had already yielded (Table 7, Table 8, Figure 9, and Figure 11). (a) Interactions between strirrups2 and CFRs2 based on the maximum strain experience by fibers during the loading process, (b) proposed reduction factor versus the ratio of EB-CFRPs2-to-steel-stirrups2, and (c) applied shear forces versus strains experienced by steel strirrups2 and CFRP2 for the studied specimens.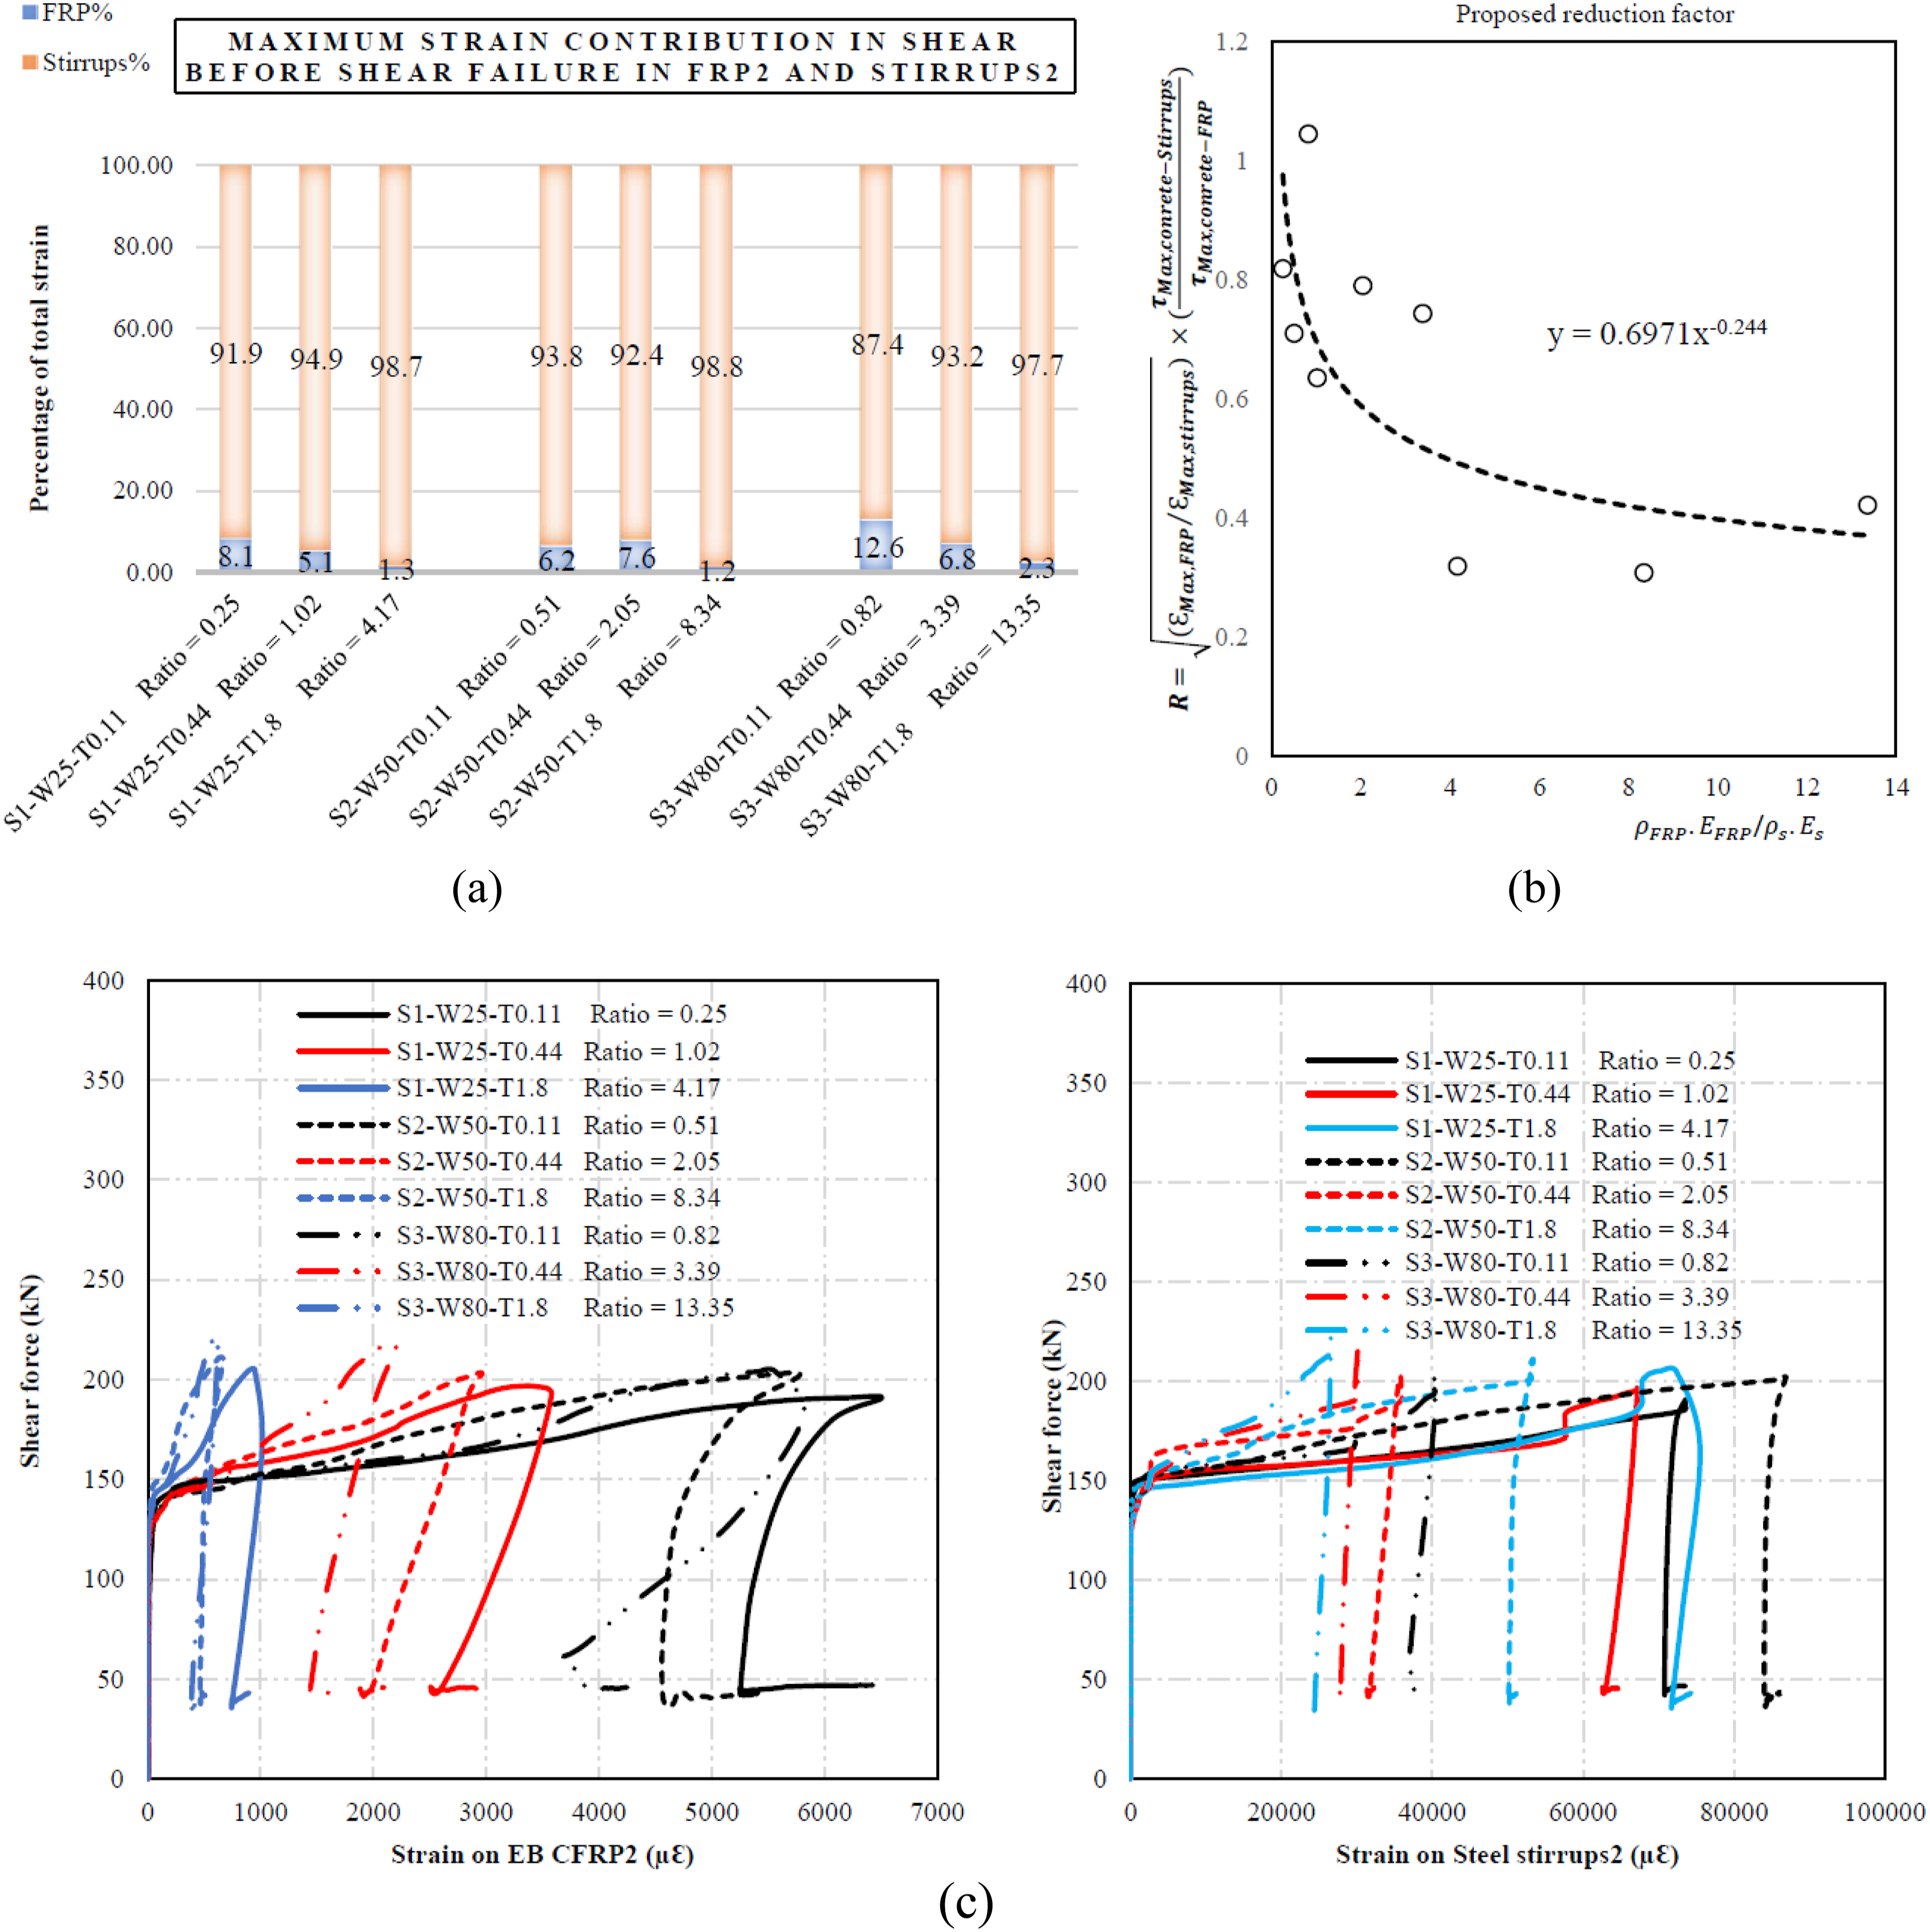
Interaction between CFRP3 and steel-stirrups3
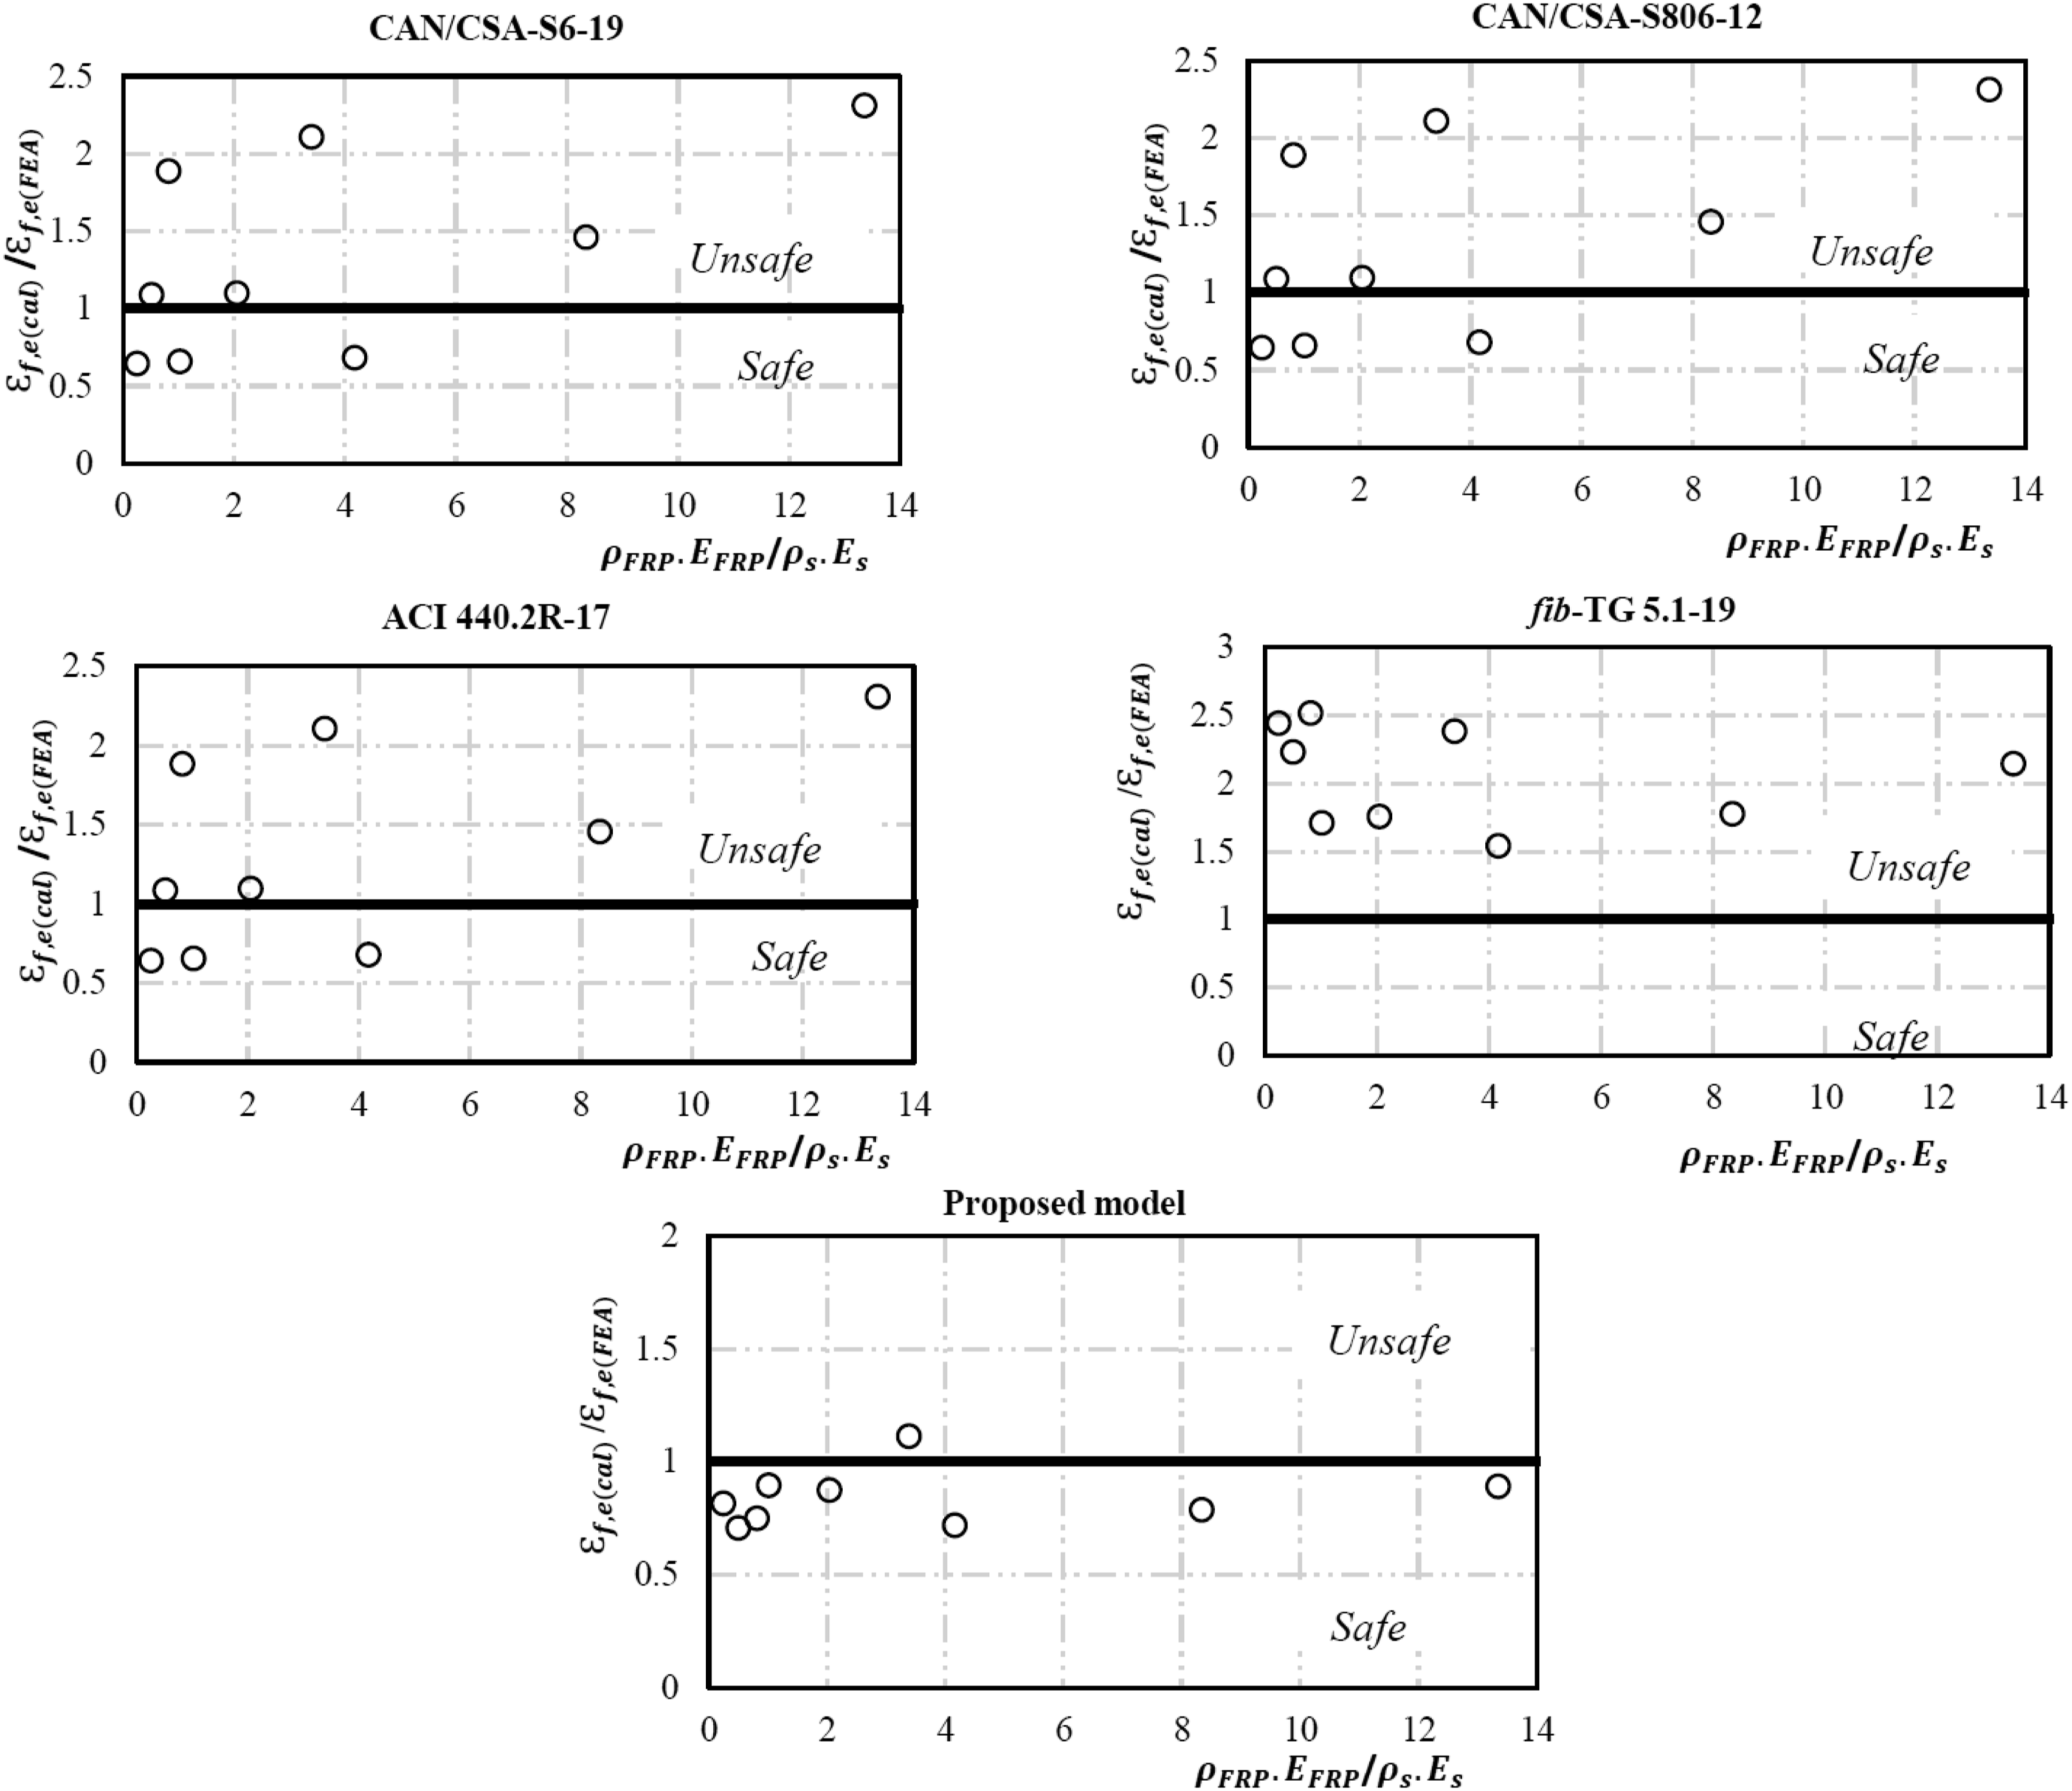
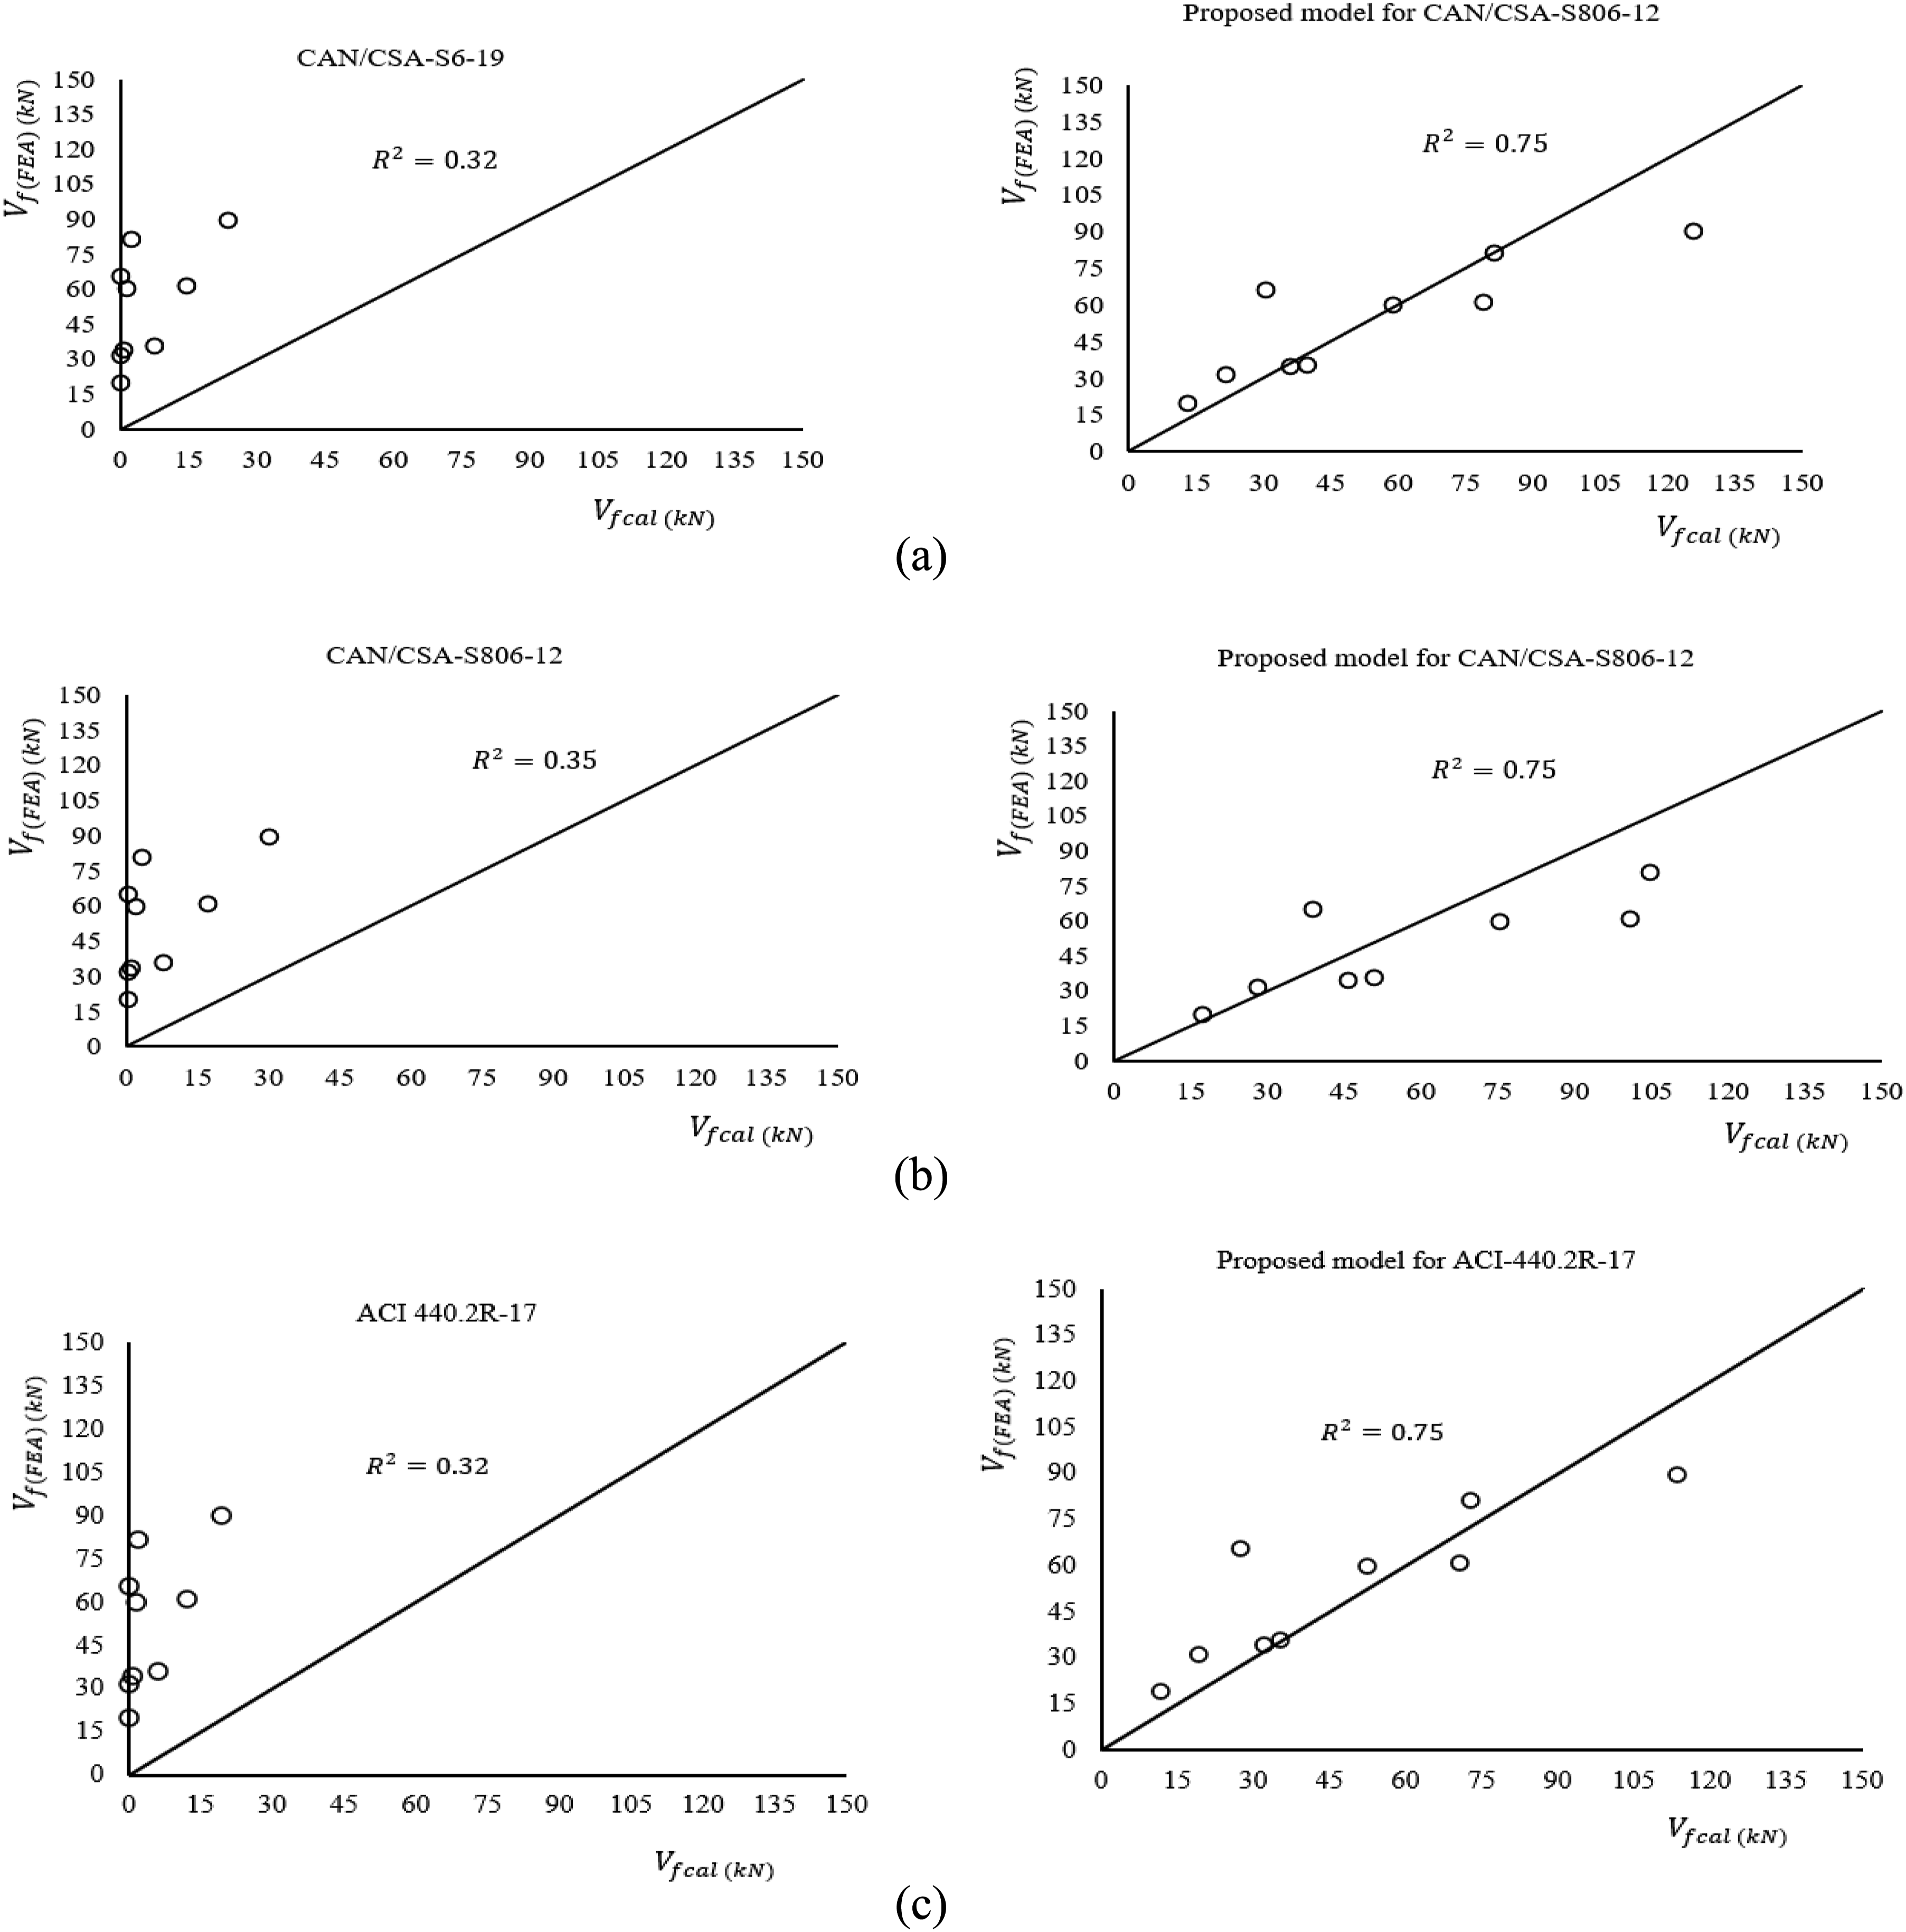
Even though CFRPs3 and stirrups3, like CFRPs2 and stirrups2, were intercepted by the greatest number of marginal shear cracks with a high R ratio, they experienced less maximum strain than the first and second CFRPs and stirrups (Table 7, Table 8, Figure 9, Figure 13). (a) Interactions between strirrups3 and CFRs3 based on the maximum strain experience by fibers during the loading process, (b) proposed reduction factor versus the ratio of EB-CFRPs3-to-steel-stirrups3, and (c) applied shear forces versus strains experienced by steel strirrups3 and CFRPs3 for the studied specimens. Comparison between calculated versus the proposed effective strains obtained from numerical results based on interactions between steel-stirrups and CFRPs on the studied specimens for (a) CAN/CSA-S6-19, (b) CAN/CSA-S806-12, and (c) ACI 440.2R-17.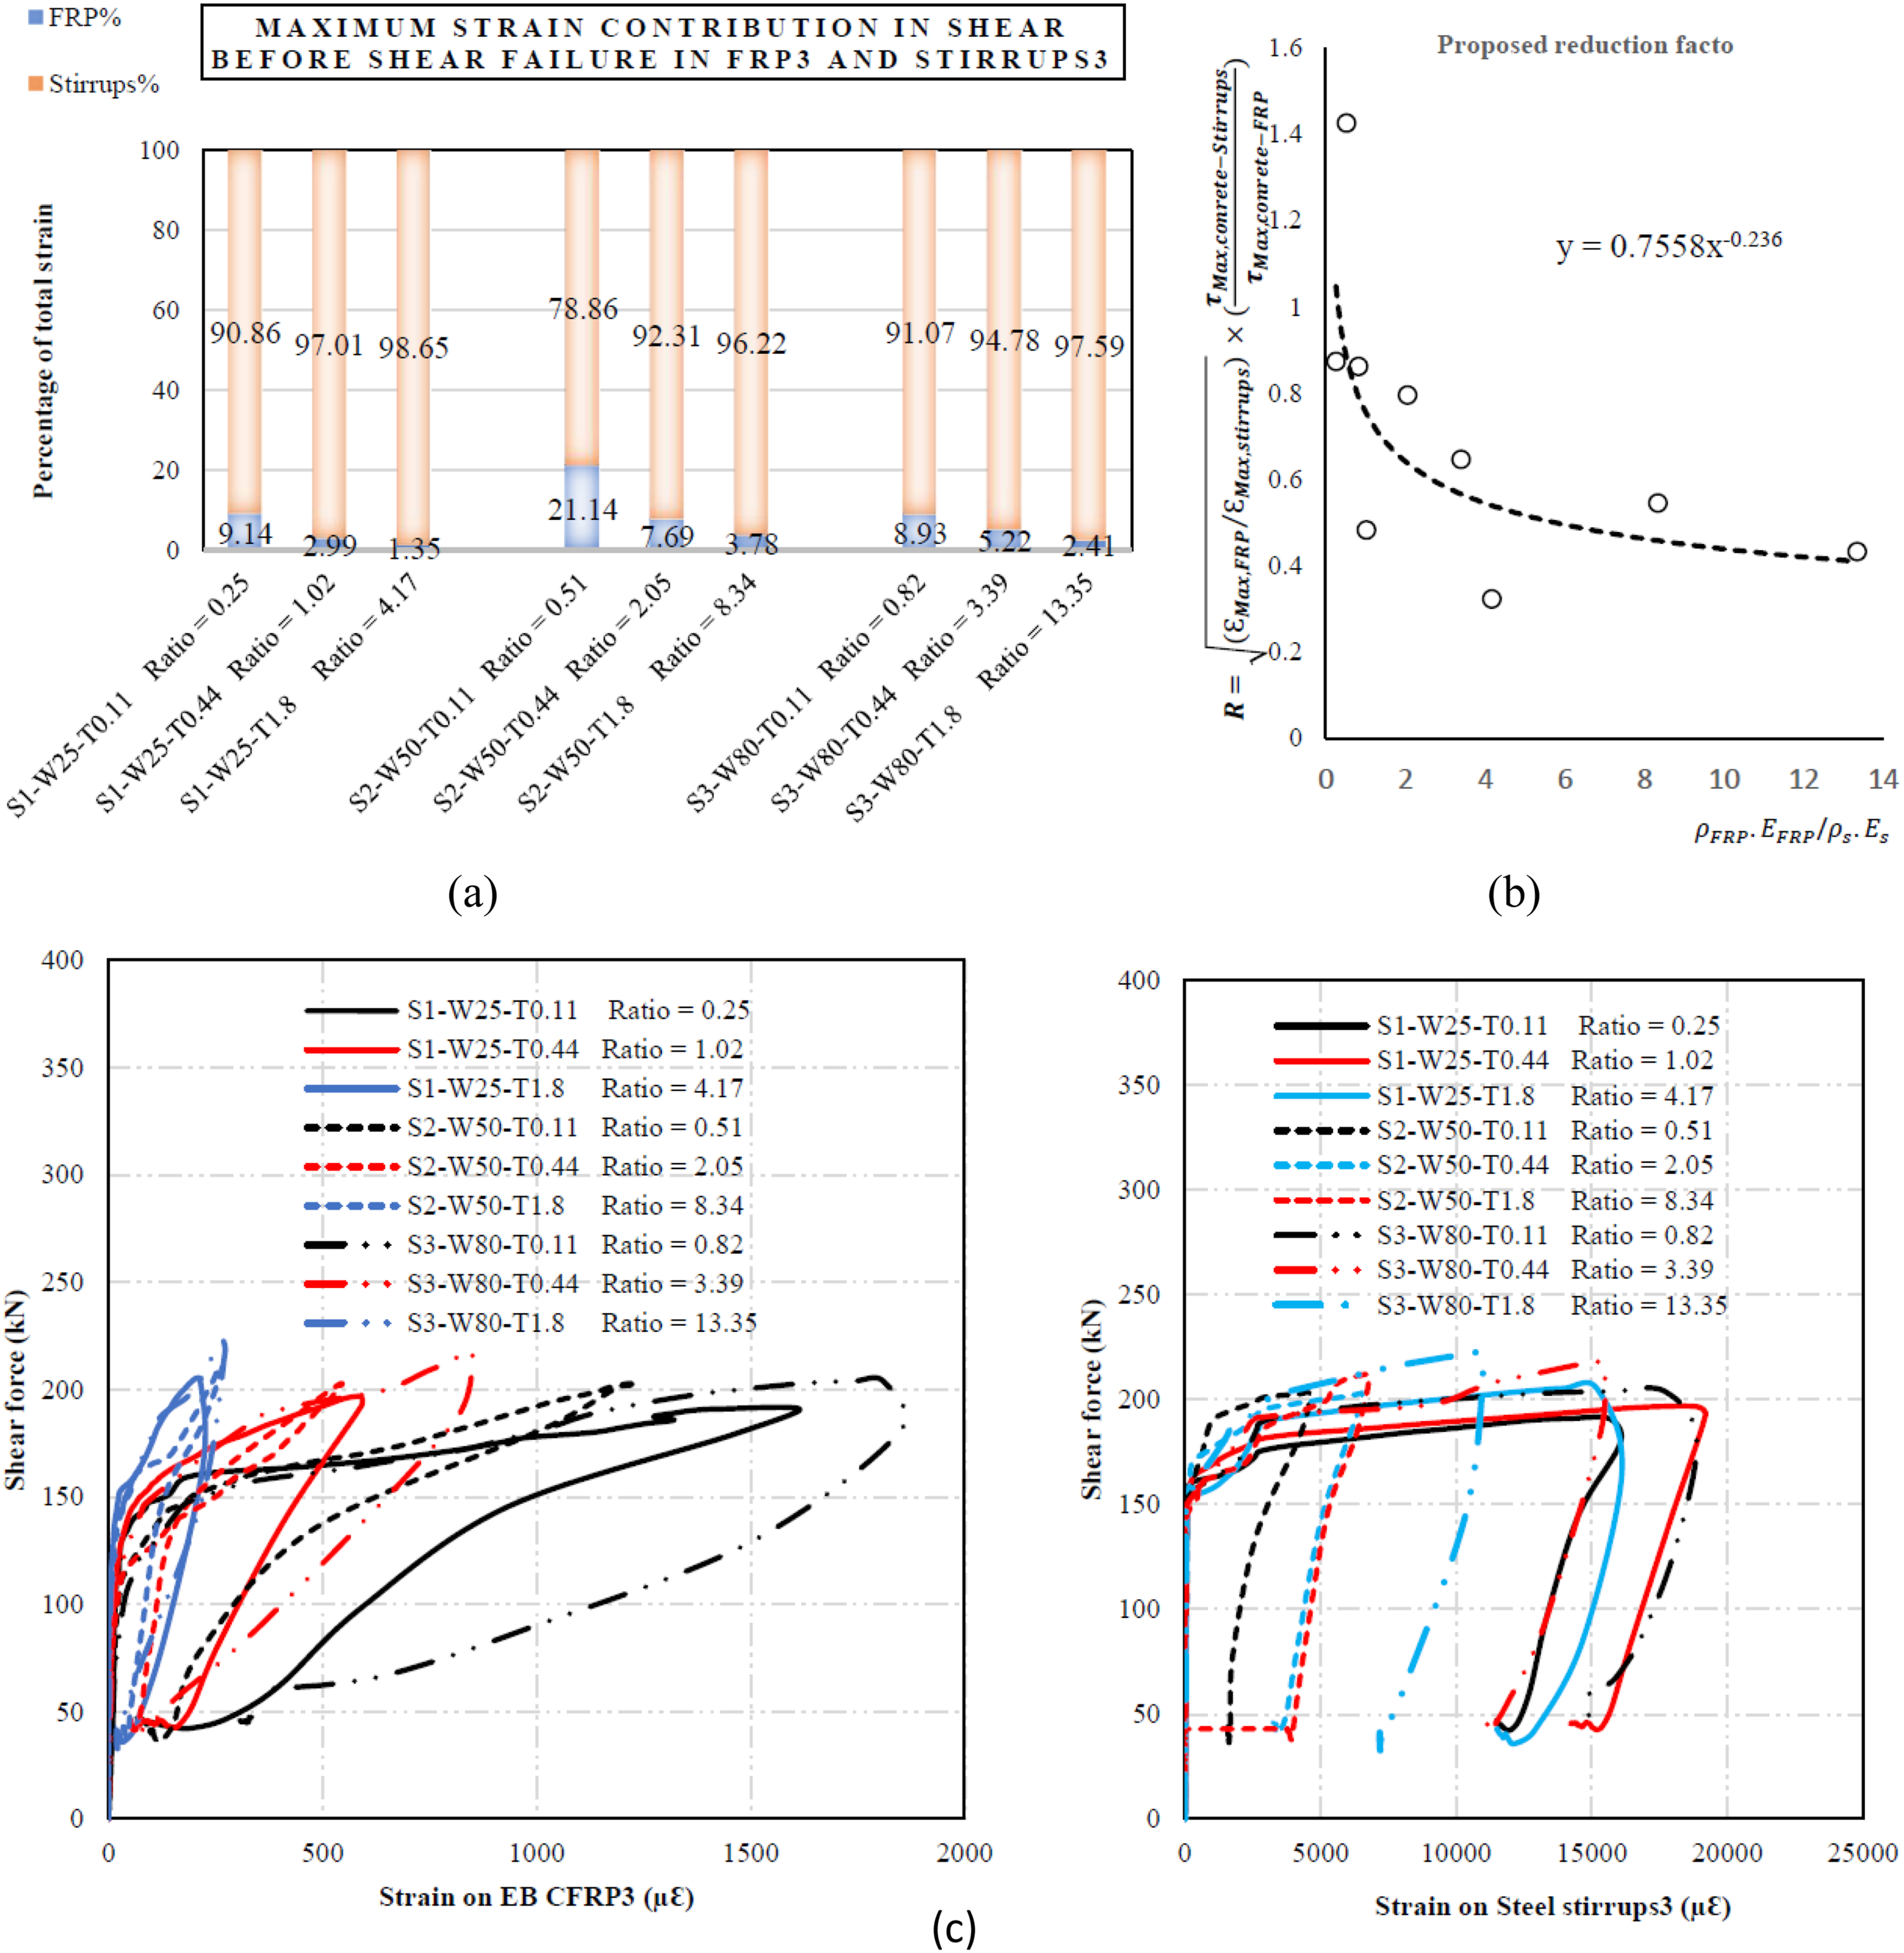
Regarding the specimens with 80-mm-wide strips (R0.82, R3.39, and R13.35), the maximum strains on the CFRP strips were 1738 µԐ, 845 µԐ, and 269 µԐ, and the corresponding strains on the stirrups were 15,792 µԐ, 15,184 µԐ, and 10,793 µԐ, respectively. The associated shear forces for these specimens were 203.8 kN, 217.9 kN, and 222.3 kN, respectively. The maximum strains on CFRP3 strips and stirrups3 increased just after shear loss. For example, for the CFRP3 strips, the strains continued to increase until 1975 µԐ, 851 µԐ, and 271 µԐ for specimens R0.82, R3.39, and R13.35, respectively (Table 7, Table 8, Figure 9, Figure 12).
Discussion and evaluation of numerical results
It is obvious that steel-stirrups are subjected to the highest strains in specimens with lower FRP-to-steel-stirrup ratios. However, this depends on the strip-width-to-strip spacing ratio, specifically for stirrups2 and stirrups1. As the ratio (R) increased, the stirrups experienced lower strains. For instance, for specimen R0.51, steel-stirrups2 and steel-stirrups1 experienced 86,644 µԐ and 53,462 µԐ, respectively, but for the same steel-stirrups in specimen R13.35, these figures were reduced to 26,562 µԐ and 16,683 µԐ, representing a reduction of 70% and 69%, respectively. The same response occurred with EB-CFRPs, which means that when the R ratio was increased, their contributions to shear resistance had a reductive trend such that CFRPs2 and CFRPs1 experienced higher recorded strains. For example, consider specimens R0.51 and R13.35, where the amounts of strain for CFRPs2 and CFRPs1 were reduced from 5521 µԐ and 5272 µԐ to 606 µԐ and 456 µԐ, respectively, representing reductions of 90% and 92% (Figure 9). By increasing the FRP-to-steel-stirrup ratio, their performance was reduced compared to the lowest ratio (R), proving that an inverse interaction exists between EB-FRPs and steel-stirrups. This inverse interaction should be included when calculating effective strain, as proposed in the next section.
Proposed effective strain
In this part of the paper, a new model is proposed for calculating effective strain for the North American guidelines. This model is a function of maximum shear stress in the bonds between concrete and steel-stirrups and between concrete and EB-CFRP, the ratio of maximum strain on EB-CFRPs to that on steel-stirrups, the EB-CFRP-to-steel-stirrup ratio, and the ultimate strain on EB-CFRPs. The results of the proposed model are compared to the design guidelines19–21 and demonstrate better predictions of the shear contributions of EB-CFRP. As presented in Figures 10, 11, and 12, the reduction factors based on interactions between internal and external reinforcements were obtained from the parametric numerical results based on increasing the EB-CFRP-to-steel-stirrup ratio for U-shaped configuration specimens as follows: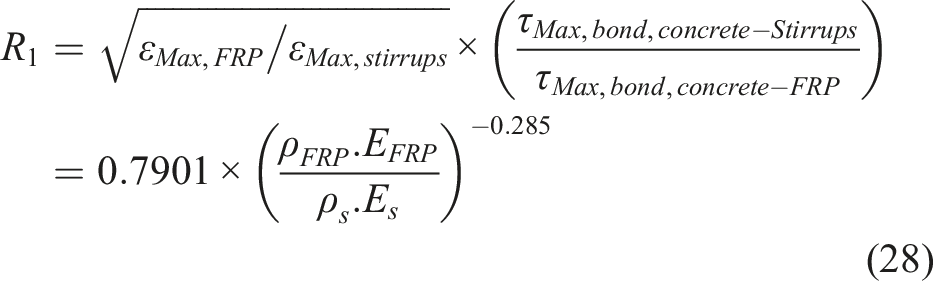

Therefore, to obtain the effective strain, equation (27) should be multiplied by equation (28), which results in: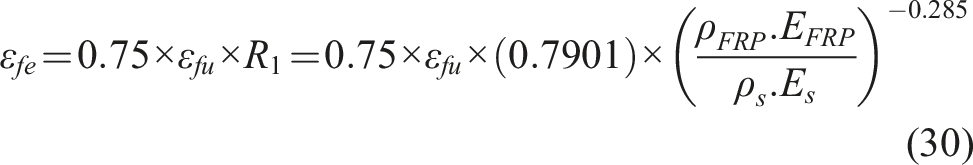
However, the maximum ratio (R), 
As presented in Figure 13, after replacing the proposed effective strains for nine studied beams with different R ratios, R2 for the North American codes was enhanced from 0.32, 0.32, and 0.35 to 0.75, 0.75, and 0.75 for all nine specimens, respectively.
Comparison between proposed model and Mofidi and Chaallal’s (2012) model.
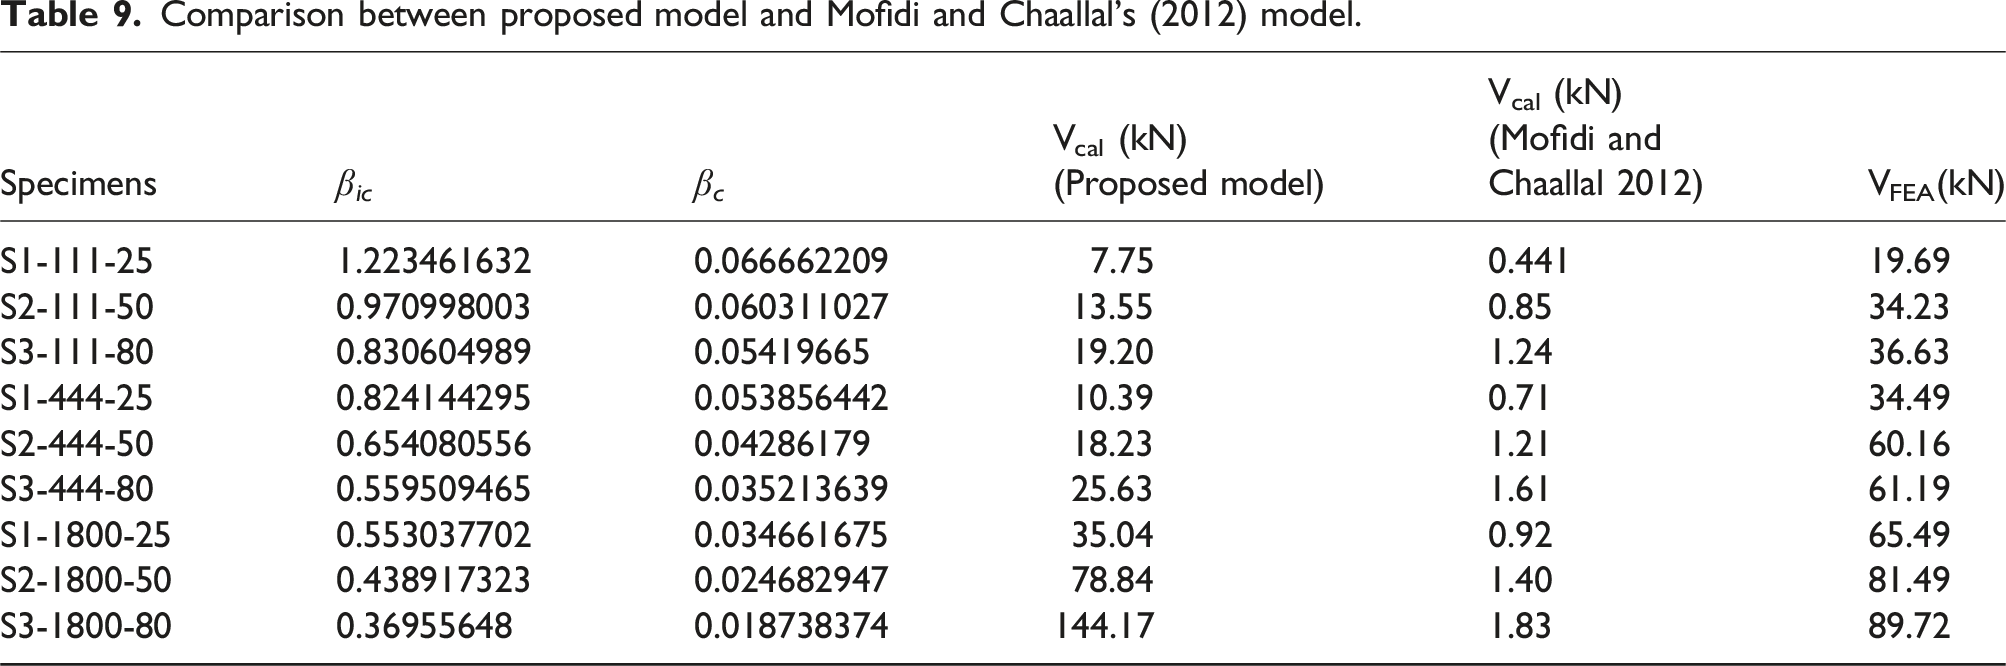
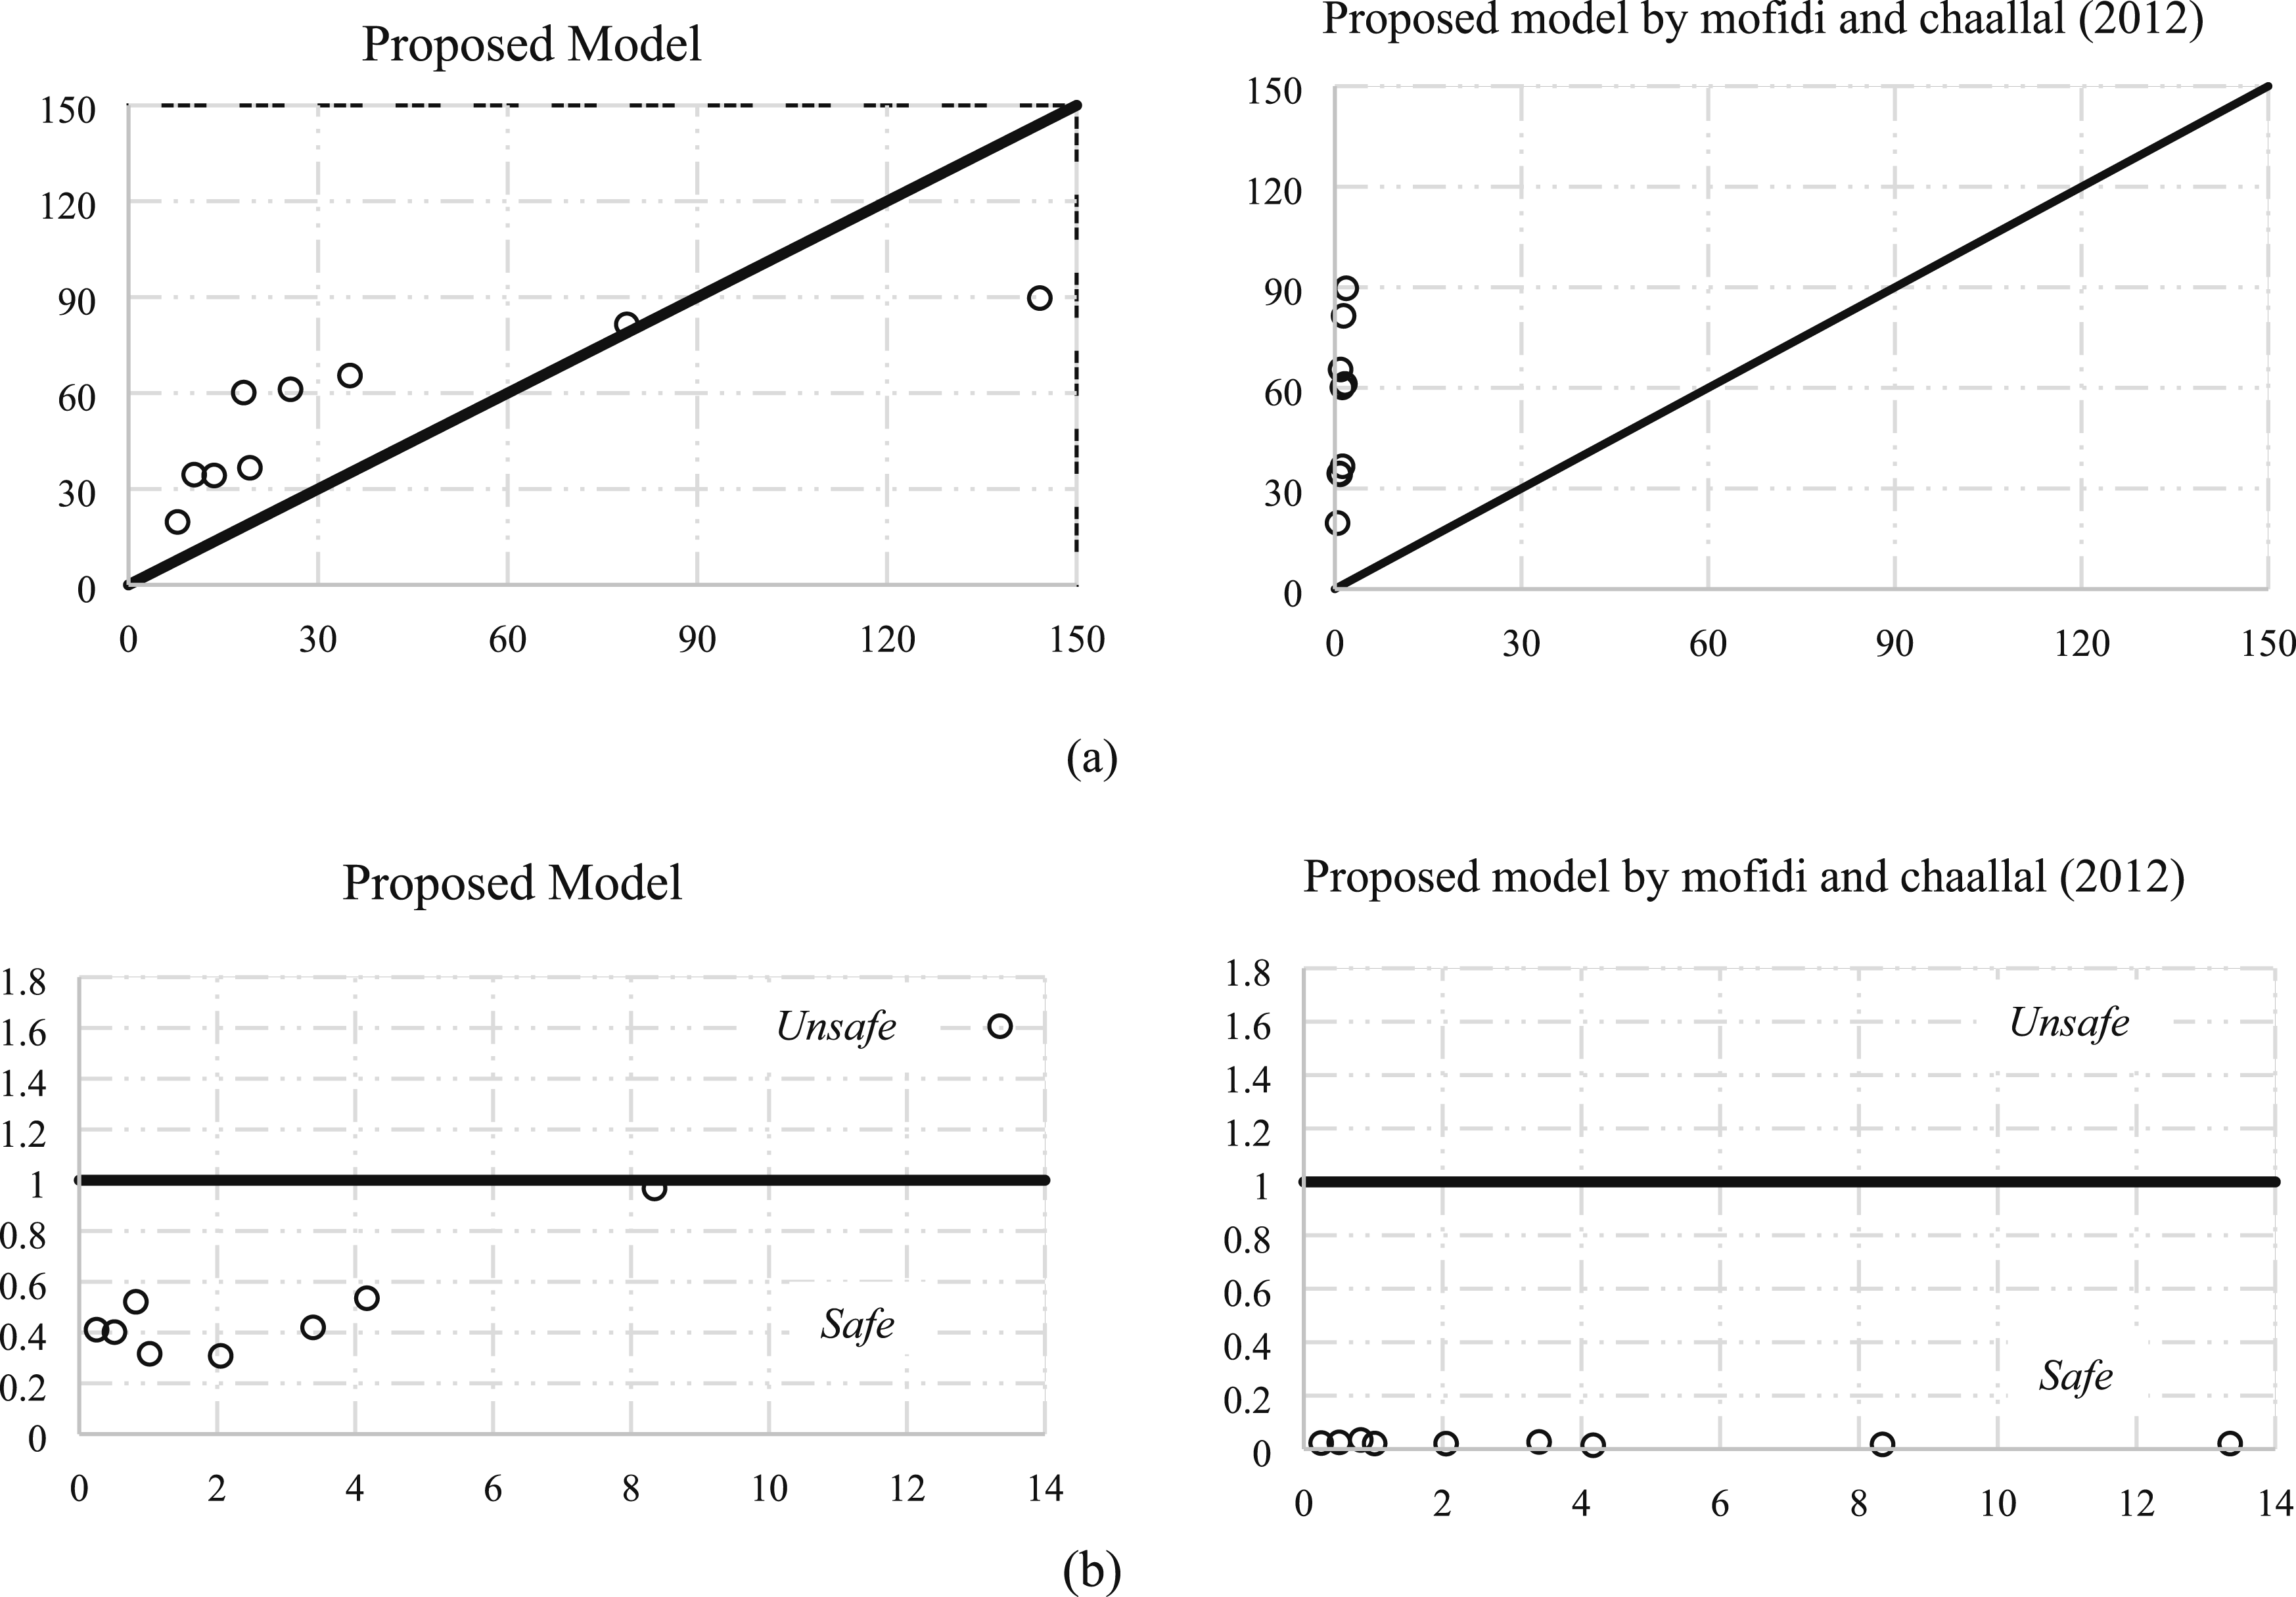
Coefficient of interaction between steel-stirrups and EB-FRP (βic) in the proposed model versus coefficient of summation of the internal and external reinforcement (βc) in Mofidi and Chaallal (2010) model for (a) shear contribution in FEA versus proposed model, and (b) shear contribution ratio versus EB-CFRPs-to-steel-stirrups ratio.
Conclusions
This research dealt with the inverse interaction of EB-FRP and steel-stirrups for RC beams strengthened in shear with U-shaped configurations. The most applicable guidelines were evaluated and compared with experimental and FE numerical results. Analytical and numerical parametric studies were conducted to evaluate this inverse interaction. Some of the parameters that could not be assessed from experimental studies were then evaluated: the contributions of concrete, steel-stirrups, and EB-CFRPs to shear resistance; the behavior of interface layers and the strain responses along the fiber direction as obtained from FEA; and the inverse interaction between internal and external reinforcements by increasing the EB-CFRP-to-steel-stirrup ratio. The following conclusions can be drawn from the current study: • A new analytical model is proposed that considers the effect of the inverse interaction between EB-CFRPs and steel-stirrups, showing higher accuracy compared to guidelines as the EB-CFRP-to-steel-stirrup ratio increases. • Increasing the ratio of EB-CFRP results in more distributed marginal shear cracks (similarly to increasing the ratio of steel-stirrup). • The areas under the shear stresses versus the distance along the interface layers are larger in specimens with lower EB-FRP-to-steel-stirrup ratios. When these ratios are lower, more shear stress can be transferred through the interface layers and obtain more benefit from the potential of the cohesive layers. By increasing the EB-CFRP-to-steel-stirrup ratio, shear stresses at the interface layers in the top parts of the main shear cracks do not increase as midspan deflections increase. • The effect of the inverse interaction becomes greater as the EB-CFRP-to-steel-stirrup ratio increases, resulting in a smaller strain contribution offered by the steel-stirrups and EB-CFRPs. • Based on the parametric numerical results and the interaction between EB-CFRPs and steel-stirrups, a reduction factor and an effective strain are proposed and compared with North American guidelines, demonstrating higher accuracy than the conservative effective strains proposed by the guidelines. • An upper limit is proposed (0.002) for strains with higher EB-CFRP-to-steel-stirrup ratios (R ≥ 3.4). Further investigations are needed based on more extensive data to enhance the effective strain based on the inverse interaction between EB-CFRPs and steel-stirrups. • The reduction factor proposed for the inverse interaction of steel-stirrups and EB-FRP in the model introduced by Mofidi and Chaallal (2012) (R = B
ic
) can be implemented instead of the concrete cracking coefficient based on transverse steel and FRP rigidity values (B
ic
), showing higher accuracy. • The proposed model fulfills safety criteria and is closer to the experimental tests. However, the previous model introduced by Mofidi and Chaallal (2012) is more conservative.
Footnotes
Acknowledgments
The financial support of the Natural Sciences and Engineering Research Council of Canada (NSERC) and the Fonds de Recherche du Québec – Nature et Technologie (FRQnt) through operating grants is gratefully acknowledged.
Declaration of conflicting interests
The author(s) declared no potential conflicts of interest with respect to the research, authorship, and/or publication of this article.
Funding
The author(s) disclosed receipt of the following financial support for the research, authorship, and/or publication of this article: This work was supported by the Natural Sciences and Engineering Research Council of Canada (NSERC) (Grant number: RGPIN-2022-03592) and the Fonds de Recherche du Québec – Nature et Technologie (FRQnt) (Grant number: 204650).
Data Availability Statement
All data, models, and code generated or used during the study appear in the submitted article.