
Abstract
While composite structures absorb energy well during crash events, crush-induced failure mechanisms and their effects on energy absorption characteristics are still unclear. Due to the complexity of the process, Finite Element (FE) models applied to estimate energy absorption capability of composite structures require a considerable amount of computational time. This study presents a novel numerical approach for the crushing process of AS4/8852 flat coupon plates in which computational cost is decreased by reducing the number of interfaces between plies and modifying the relevant properties. Experimental and numerical studies are conducted for cross-ply specimens [0/90]ns in order to understand and discuss the failure mechanisms occurring during the crushing process in detail and the influence of plate thickness on Specific Energy Absorption (SEA). Moreover, to demonstrate the validity of novel FE model for different stacking sequences, same approach is applied to the [0/45/0/−45]s plate geometry. By this method, run time is decreased by more than 50%.
Introduction
Composites are being increasingly used in the industry because of their benefits over metallic materials including superior performance related to energy absorption during crash events. However, the energy absorbed by a composite structure is not easily predicted due to the complexity of the crush-induced failure mechanisms that involve not only intralaminar, but also interlaminar damage modes. From 1980s to present, there is a comprehensive literature about the of energy absorption capability of composite materials.1–6 The view commonly shared in literature is that there are several different failure modes occurring simultaneously during crushing of composite materials, each of which provides a different capability for energy absorption, but it can be argued that a general agreement does not exist about the parameters that has the highest influence these modes, and how their influence takes effect. Therefore, it is still essential to develop a better understanding of crashworthiness of composite materials.
In recent years, the interest in flat composite coupon tests is increasing since they have great advantage of predicting the specific energy absorption (SEA) due to being easily manufactured that leads repeatable processes and test results with low margin of error and cost.7–12 Considering the numerous studies carried out on complex geometries (tubes, cones and beams),13–15 the results from different studies are not suitable for comparison of material or lay-up performances since geometry has also significant influence on the energy absorption capability of composite structures. Flat shaped composites, on the other hand, may provide a standardization so that the SEA can be easily obtained and compared for composite plates with different lay-ups and different mechanical characteristics. Moreover, these plates can also be a reference point for the estimation of energy absorption of complex structures.
However, the issue about the procedure for flat plates is that a specialized supporting fixture is required to prevent potential buckling and ensuing catastrophic failure so that the crush failure modes can be clearly seen. Feraboli et al. 7 and Babaei et al. 16 applied an experimental study for CFRP plates with a supporting mechanism designed to provide complete crushing of the specimen. As the upper rigid wall moves down, the specimen can slide between the knife edges and keep crushing. This fixture is convenient to achieve complete crush of whole specimen but has a drawback of creating extra friction between the specimen and knife edges which may lead to calculate the energy absorption capability inaccurately. Same problem is valid for the studies of Lausch et al.11,17 in which full lateral support is used that constrained flat plate specimens in each edge except upper side. Since the specimen is fully constrained during the deformation, in addition to expected failure modes, extensive ruptures occurred around the vertical support which changes the levels of absorbed energy dramatically. Although a technique is applied to identify and isolate the undesirable loads, the presented approach can mislead the failure mechanisms and prevents understanding of their relationship with energy absorption levels. In order to prevent the problems caused by design complexities, a simple fixture can be more suitable for flat coupon tests. Bru et al. 8 and Israr et al. 9 designed a simple support fixture restraining the specimen with a short unsupported length which decreases during the crushing process. Since the load required for the crush process stabilizes around a mean value after the peak load, the specified crushing distance is sufficient to predict the SEA.
Most of the studies conducted for flat plates have included experimental studies and aimed to understand the influence of design parameters such as material choice, trigger mechanism and fibre orientation on the SEA. Experimental methods, however, are time consuming and expensive. That is why researchers are getting more interested in FE Models18–22 in recent years. Advances in commercial finite element analysis (FEA) software have enabled researchers to realistically simulate the performance of composite structures; however, computational cost is an issue to overcome. To reduce the run times, some regulations are applied to the FE models such as applying mass scaling and modelling half or quarter of the geometry with symmetry conditions.23–25 Turon et al. 26 focuses on mesh size increase to decrease run time for which interlaminar properties are adjusted to eliminate instabilities and obtain accurate results. Although this is a successful and beneficial attempt, it should be noted that the increasing mesh size alone is not enough to provide meaningful gains in terms of computational costs, especially for the complex geometry models. Lately, some researchers performed studies applying CZone add-on module for Abaqus, in which crush stress parameters obtained from experimental coupon tests are used as an input.27,28 CZone leads run time efficiency but the extra material data is required which might be unavailable. All in all, enhanced and accurate modelling methods leading feasible computational (CPU) costs are still required.
This study presents a novel numerical approach for the crushing process of AS4/8852 flat coupon plates in which computational cost is decreased by reducing the number of interfaces between plies and modifying the interlaminar and lamina properties. Due to the simplicity in its nature, the utilization of composite flat plates in numerical analysis provides less complex modelling and great opportunity to improve FE models having lower run times. Both experimental and numerical studies are conducted for cross-ply specimens [0/90]ns with different total number of plies (8, 12 and 16) in order to understand and discuss the failure mechanisms occurring during the crushing process in detail and the influence of plate thickness on SEA. Moreover, to demonstrate the validity of novel FE model for different stacking sequences, same procedure is applied to the [0/45/0/−45]s plate geometry.
Experimental
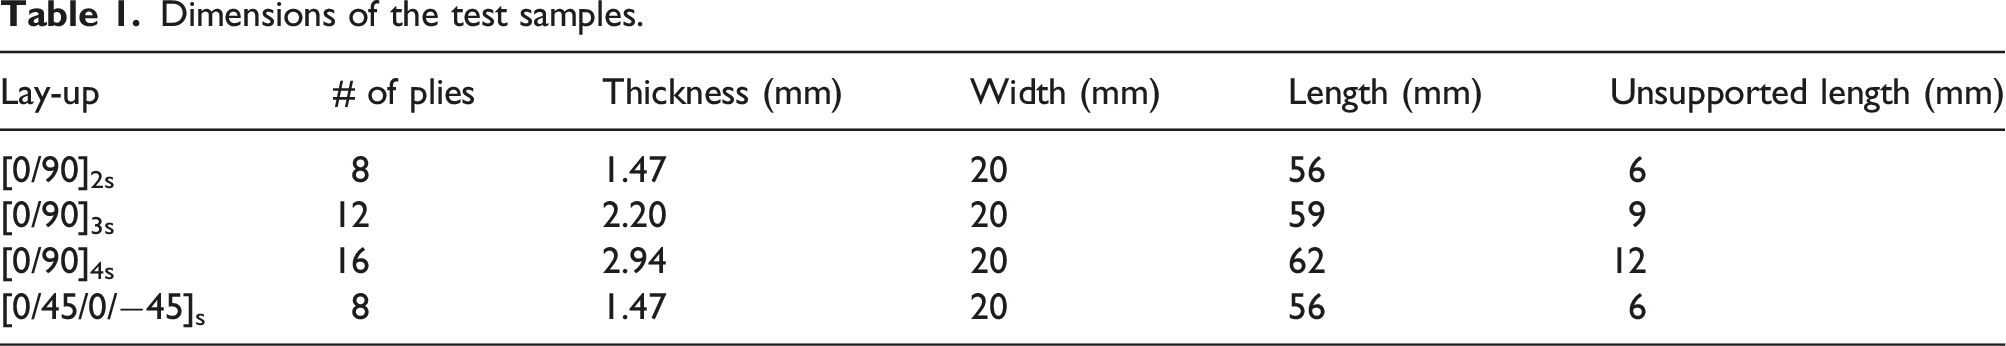
Dimensions of the test samples.
A simple fixture with 50 mm length is designed to avoid buckling and provide a supporting system. The illustration of the fixture, the specimen with chamfered edge and the test setup are presented in Figure 1. The determination of the unsupported length is significant as it may cause buckling if the dimension is higher than a certain value.
30
According to some researchers,8,30 the unsupported length to thickness ratio should vary between approximately 2 and 4. To ensure the stabilization around a mean value in load–displacement curve after peak load, the ratio is specified to be approximately 4. The unsupported length and the specimen lengths are defined according to this specified ratio (see Table 1). The illustration of the specimen and the supporting fixture (left), test setup (right).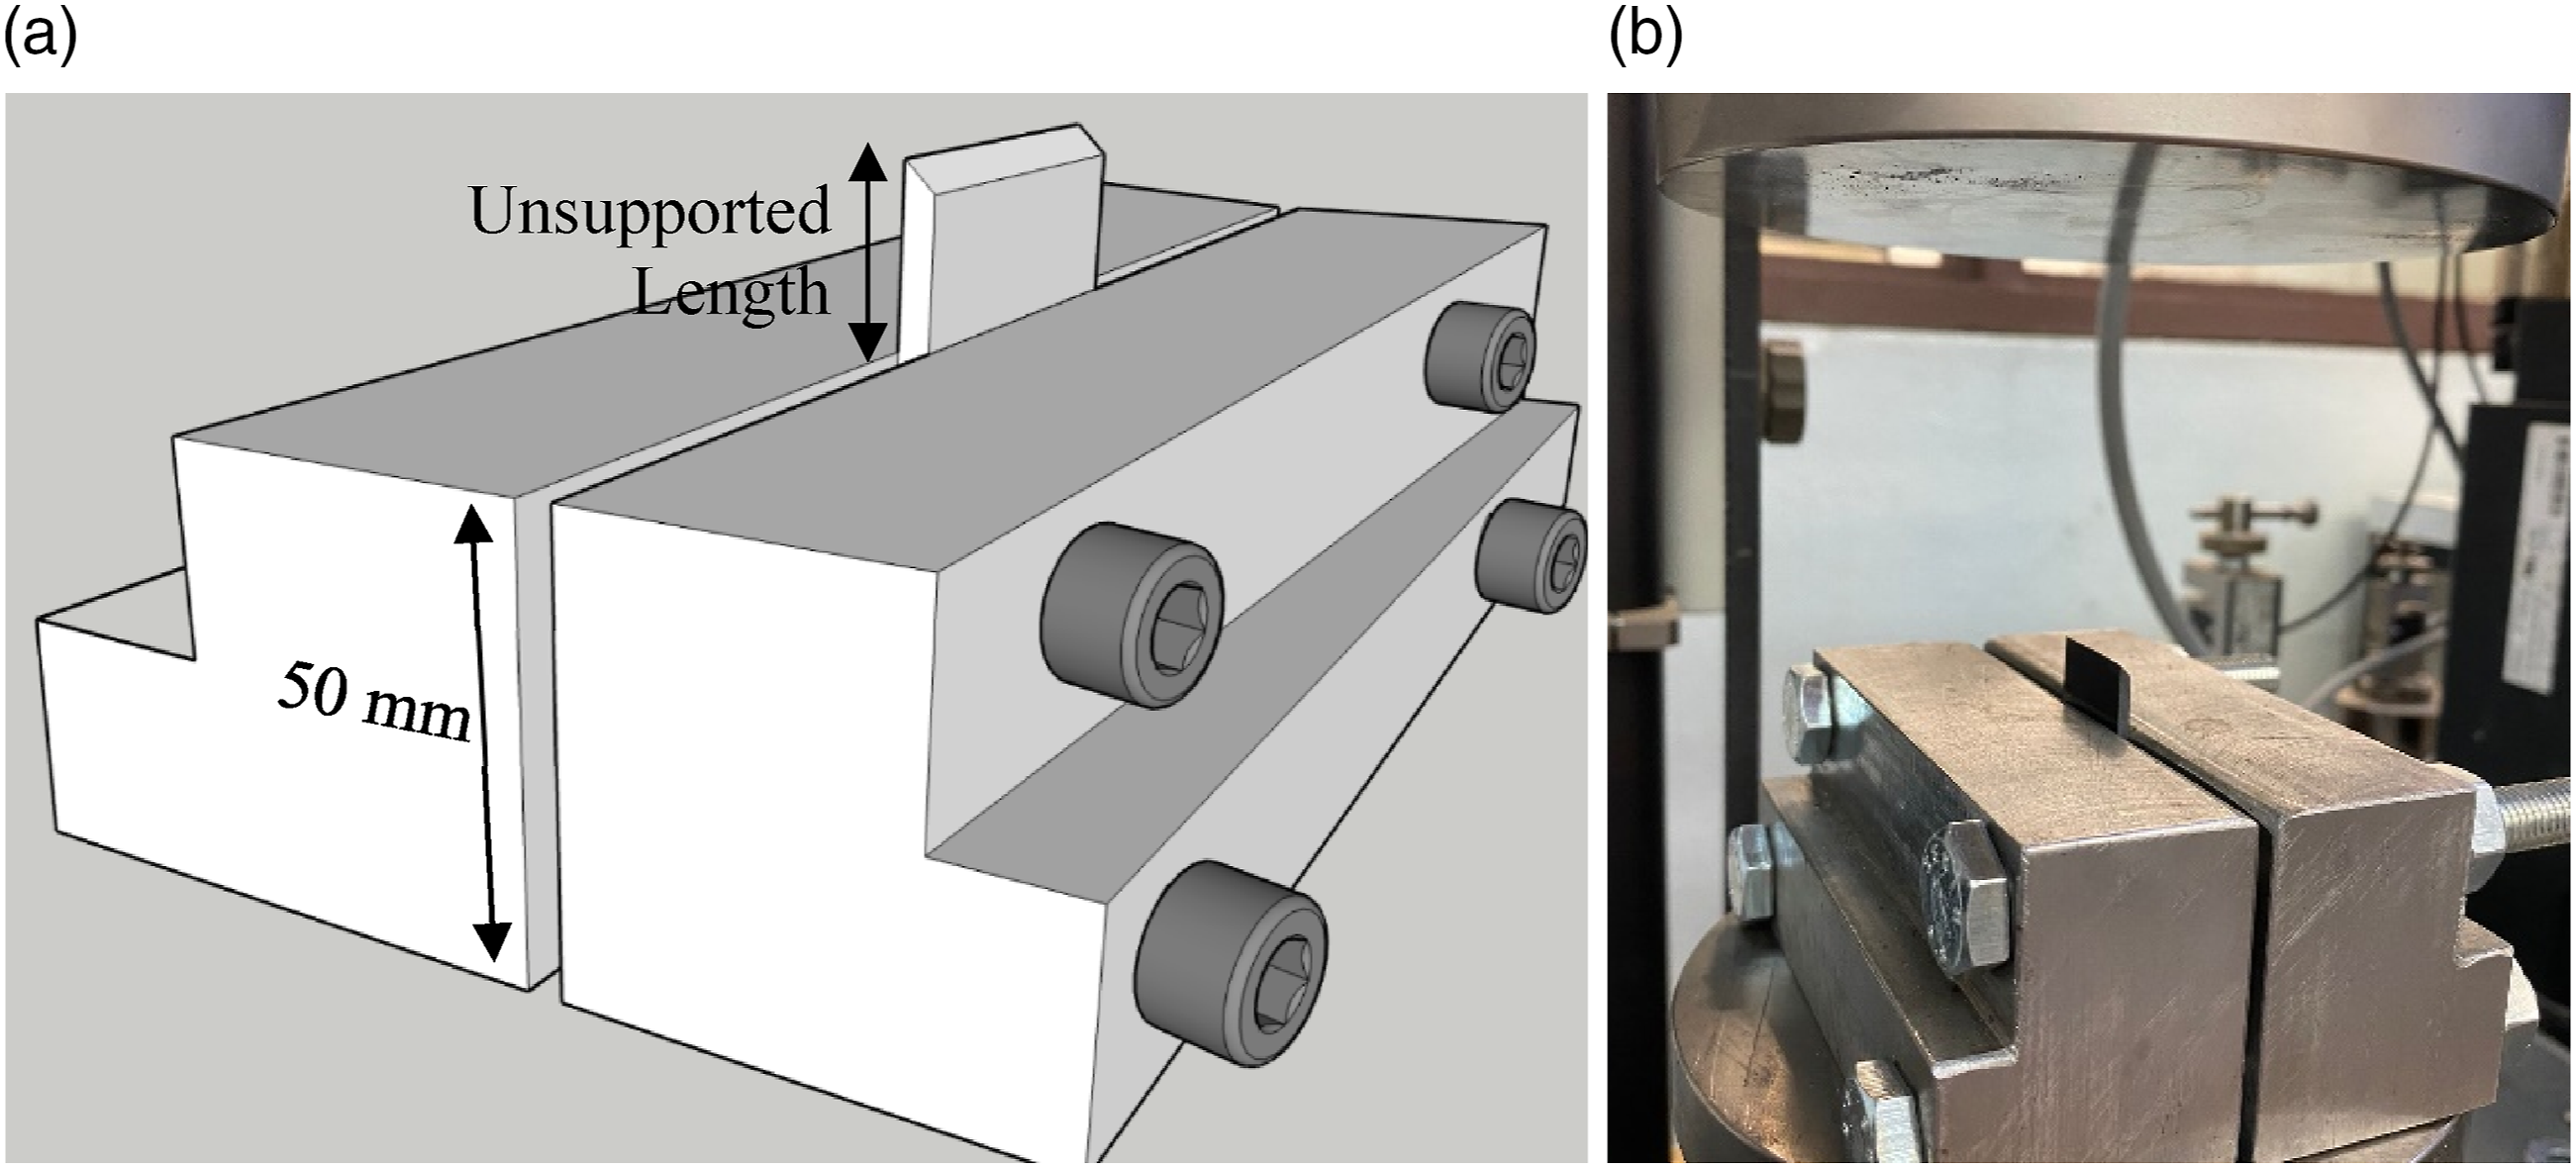
As can be seen from the Figure 1, the end of the specimen is in contact with the base plate in order to avoid problems related to slip of the specimen inside the fixture. Bolts are tightened with a light hand tightening in order to avoid excessive compressive stresses in the grip region. The function of the fixture is just to provide support for buckling without applying extra clamping forces.
Specimens are tested in the Zwick Z100 testing machine with quasi-static speed of 0.5 mm/min as applied in the study of Bru et al. 8 The tests are ended manually before crushing plate compresses the specimen fixture. Load and displacement data is measured from the load cell and the crossheads of the testing machine.
Numerical model
General modelling
For the numerical analysis to simulate crushing of AS4/8552 carbon fibre/epoxy flat coupons, a progressive failure model is developed by using ABAQUS/Explicit software consisting of both intralaminar (in-plane) and interlaminar (delamination) damage mechanisms. For [0/90]ns specimens, generalized plane strain conditions are applied to the model and only one element is generated throughout the unit thickness of 1 mm. On the other hand, full FE model without plain strain or symmetry conditions is constructed for [0/45/0/−45]s flat coupons in order to allow rotation of 45° plies to get realistic and accurate results.
In all models, each ply is individually meshed with continuum shell elements (SC8R). Continuum shell elements in ABAQUS have the geometry of a three-dimensional solid element but their kinematic and constitutive behaviour are similar to those of conventional shell elements. Boundary conditions are applied to be coherent with experimental procedure as can be seen from Figure 2. Abaqus/CAE model of the composite flat plates with rigid side walls.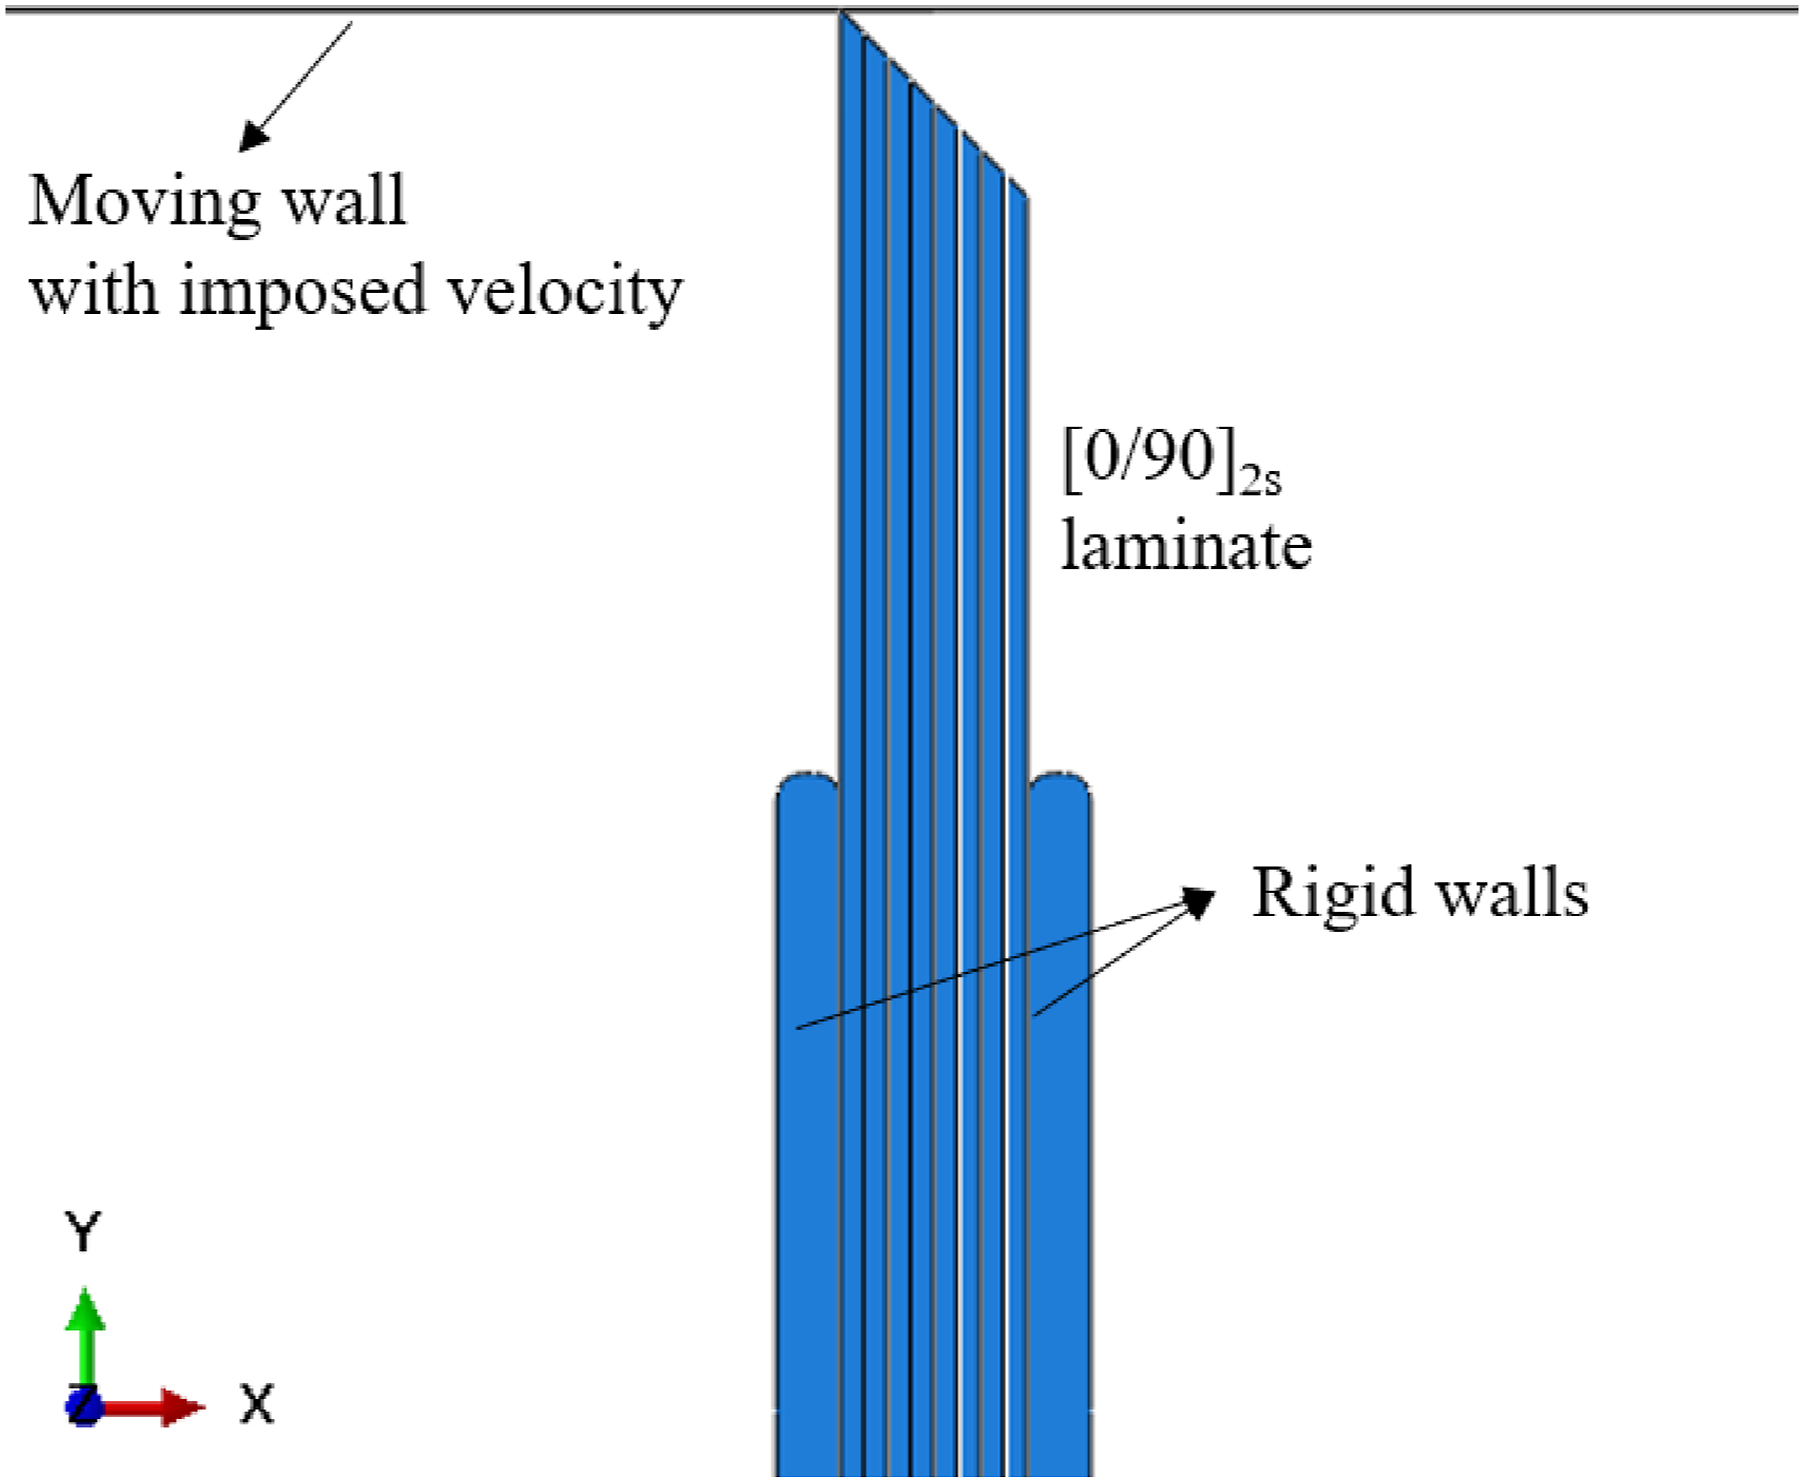
In-plane response of the composite plies is modelled according to the Hashin damage criteria 31 as a homogeneous orthotropic material, which is capable of sustaining progressive stiffness degradation due to fibre/matrix cracking. Failure initiation criteria 31 can be demonstrated as:
Tensile fibre failure for 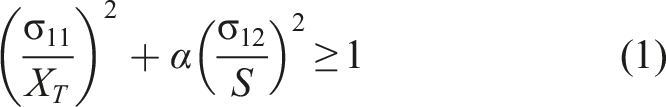
Compressive fibre failure for 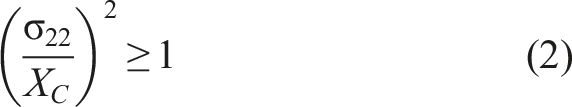
Tensile matrix failure for 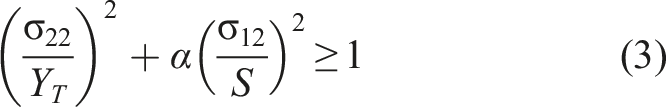
Compressive matrix failure for 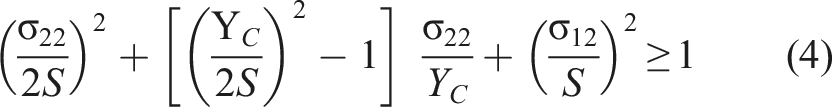

The velocity of rigid upper wall is defined as 200 mm/s. The friction between the composite specimen and the rigid upper wall plays a significant role in FEA. The friction coefficient is taken to be 0.3 as suggested in Sokolinsky et al. 23 Moreover, to achieve reasonable run times, mass scaling with the factor of 102 is applied. Mass scaling is a technique of artificial mass increase of the structure to obtain a larger time step that leads lower run times. 37
Novel numerical approach to decrease computational cost
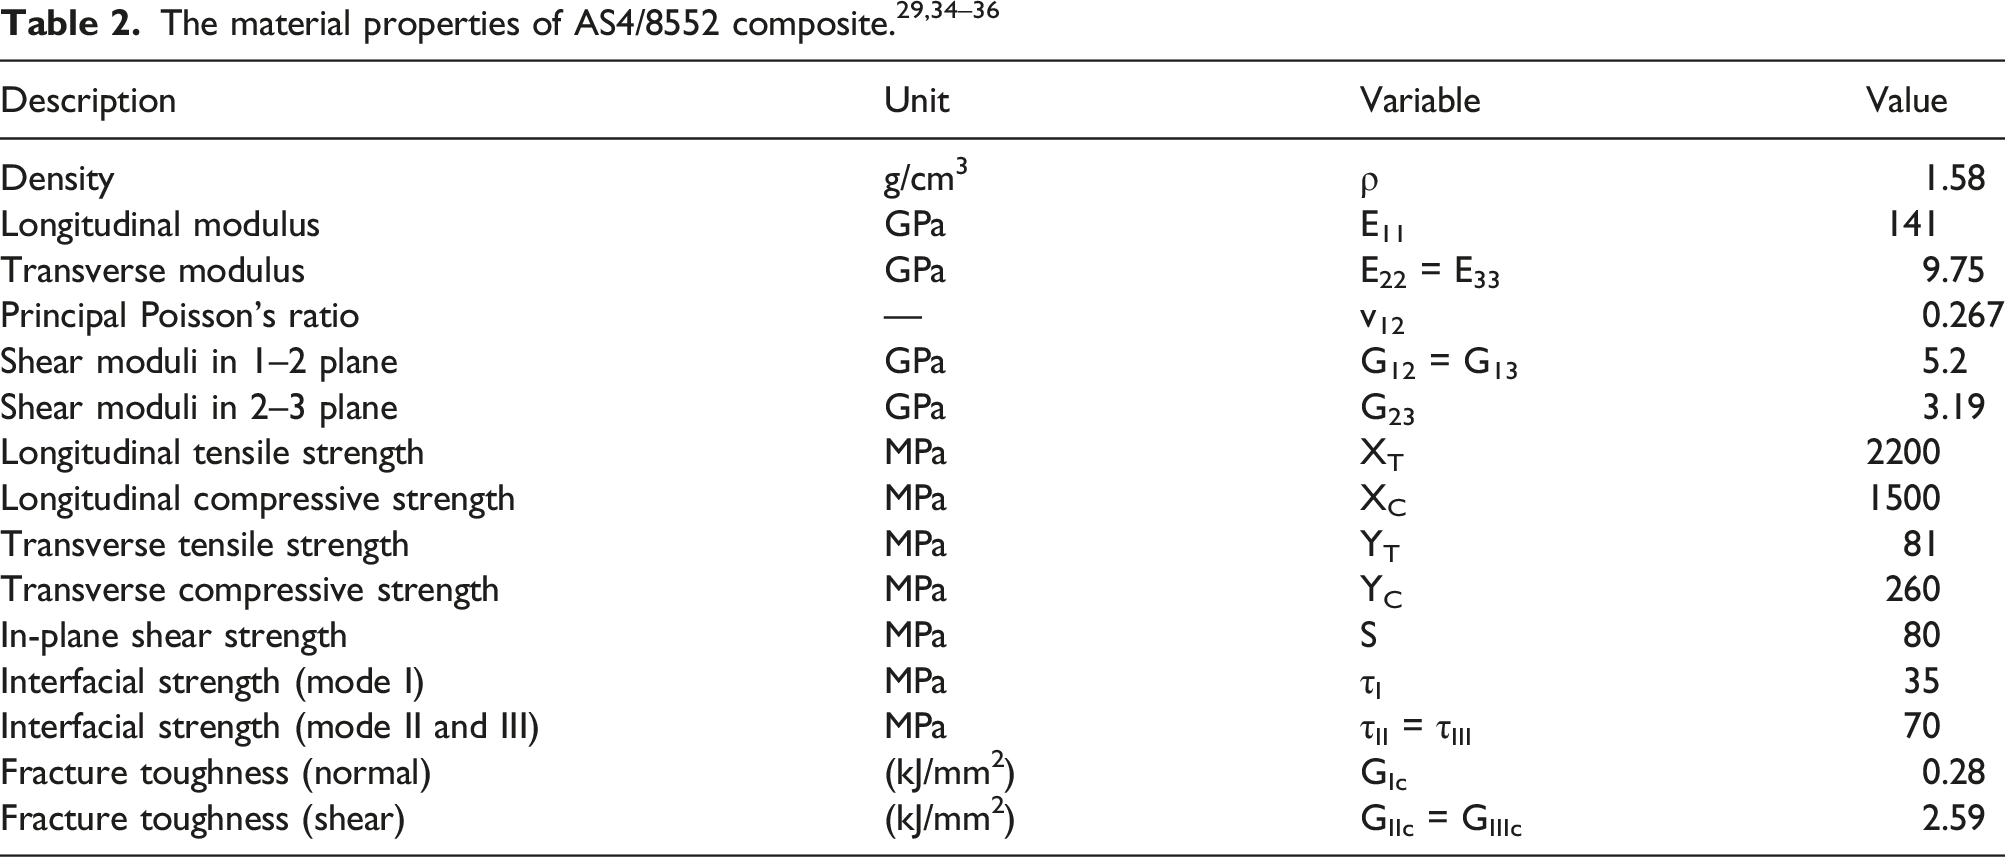
Decreasing run times for the numerical models with some parametric regulations such as increasing mesh sizes or mass scaling are still inadequate. Radical solutions are required since run times for more complex structures can be tedious. In this study, a novel modelling approach that leads reasonable run times is developed. The method proposes to model only one interface between every two plies with cohesive elements instead of one interface between each ply of the structure. Thus, original model for n-ply structure requires Modelling idea for novel numerical approach.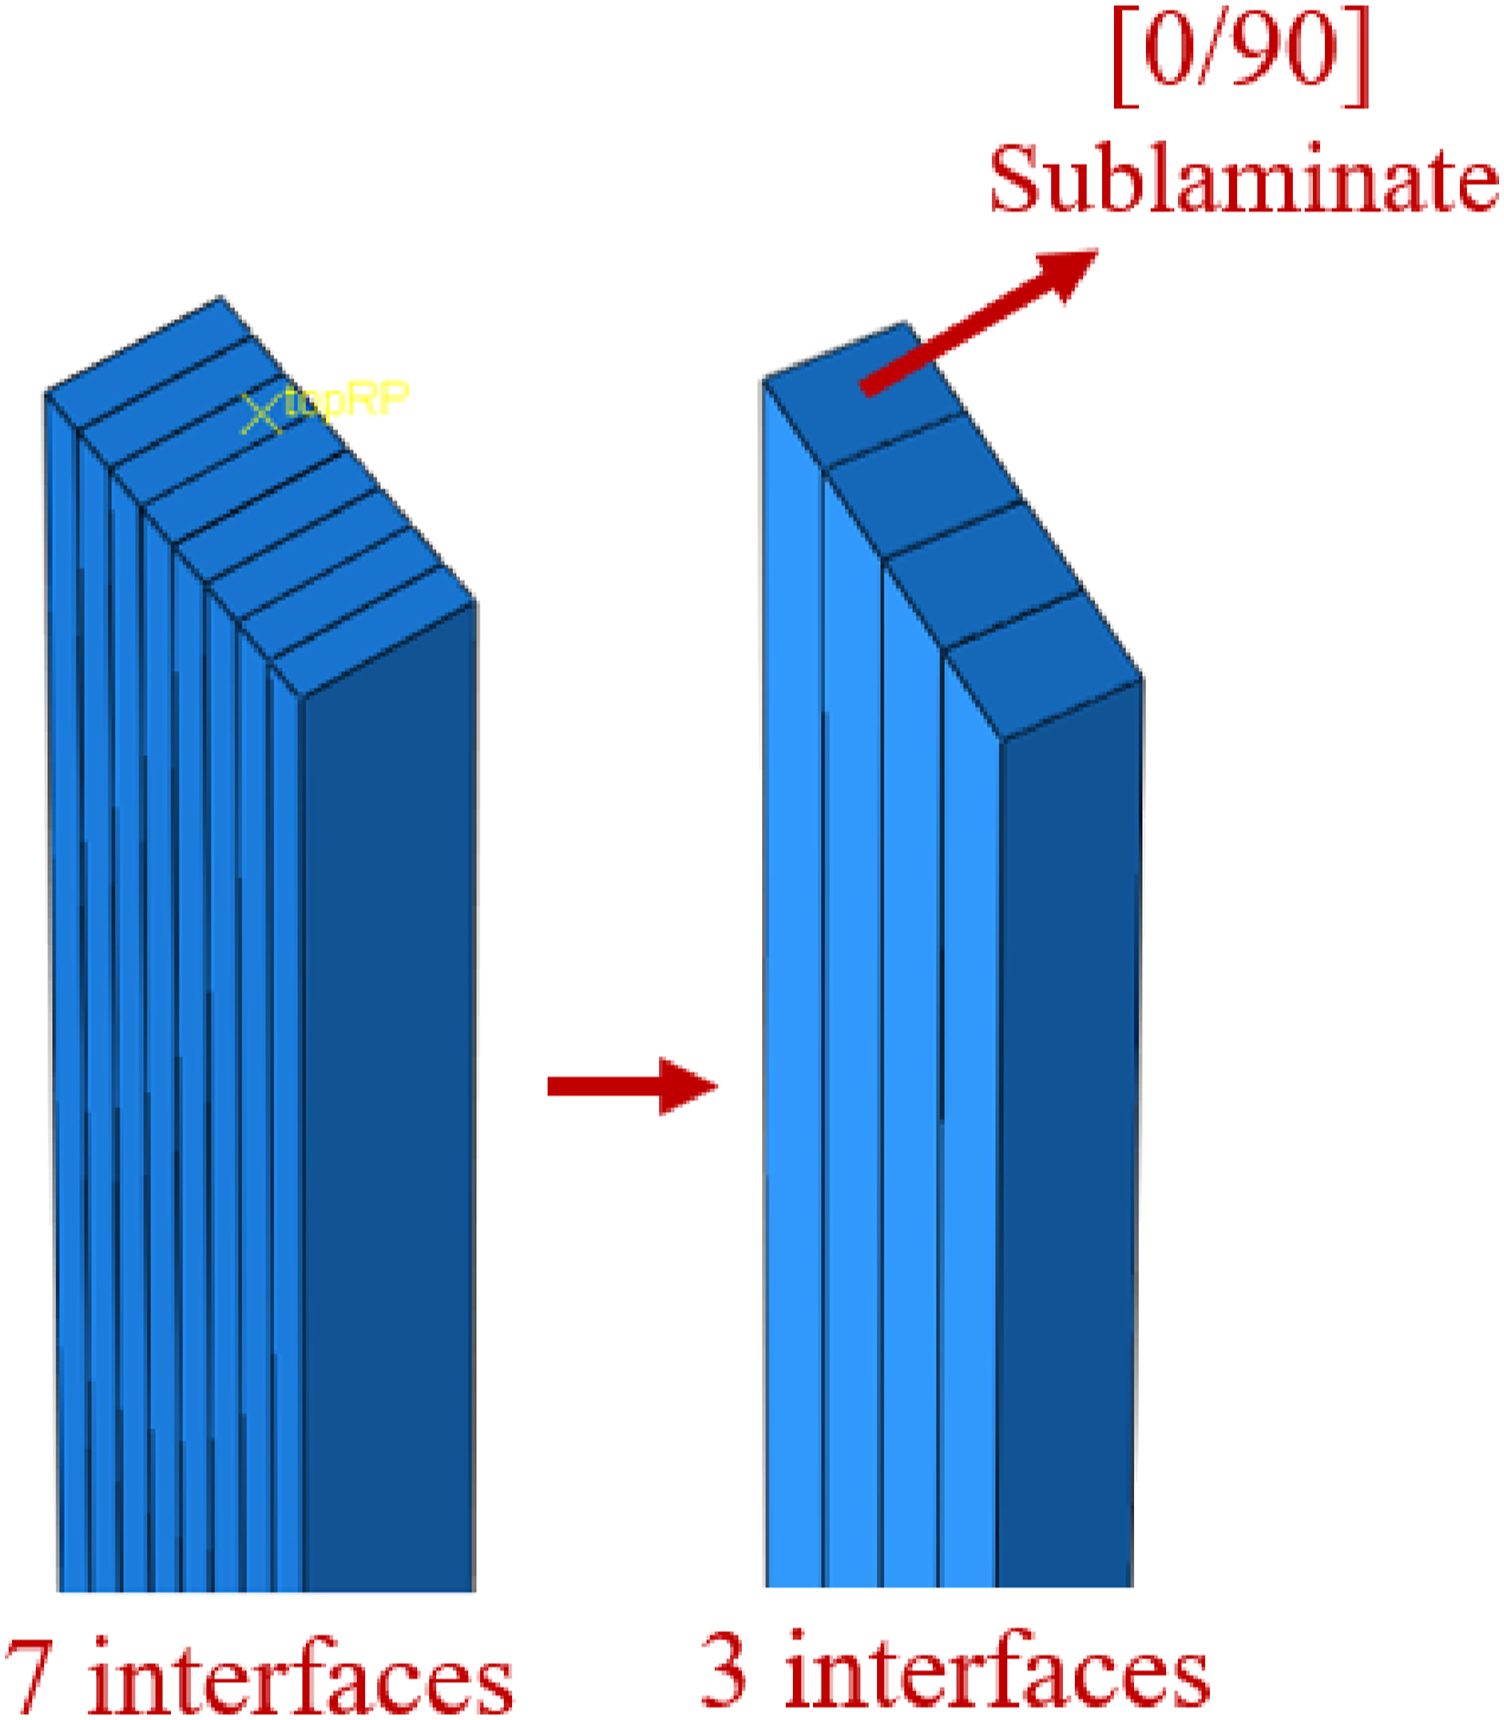
At that point, it is quite important to understand how and why some parametric adjustments are required in terms of failure mechanisms and nature of the crash event. As adapted from the study of Israr et al.,
9
Figure 4 gives the repartition of energy during the crushing of cross-ply composite plates. Repartition of energy (%) in the crushing process of flat plates (adapted from Israr et al.).
9
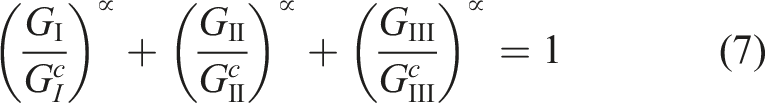
With regard to the share of various mechanisms in energy distribution, it can be said that %15 of total energy is absorbed due to the delamination and this value decreases when the number of delaminating interfaces are reduced. The interlaminar properties should be increased to compensate energy for the reduced interfaces. The first response may be doubling the fracture toughness values (G); however, adjusting only G values will lead instability in numerical results since the cohesive zone length change. Cohesive zone length, formulized by Turon et al.,
26
is given in equation (8).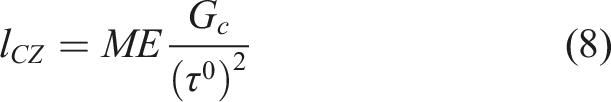
Besides delamination, as can be seen again from Figure 4, most of the energy is absorbed by the in-plane failure. Since the stacking sequence is kept the same, there will be no change in the energy absorbed by fibre and matrix failures. However, one should also consider the splaying mode, which is an important mode of failure especially in composite structures made of unidirectional plies stacked at various angles. During the splaying of plies, bending [0/90] sub-laminate absorbs more energy than bending two individual thin plies. Therefore, to balance the energy absorption, in-plane parameters should be reduced. To prove this idea, 3-point bending test models are simulated for 0°, 90° plies and [0/90] sub-laminate as shown in Figure 5, which also shows the resultant load–displacement curves until failure. The absorbed energy values are calculated from the area under the load–displacement curves and the results are given in Table 3. Same procedure is applied to the 45° ply and [0/45] sub-laminate and the energy results are demonstrated in Table 4. 3-point bending test model and simulated load–displacement results. Energy absorption of 0°, 90° plies and [0/90] sub-laminate during 3-point bending tests. Energy absorption of 0°, 45° plies and [0/45] sub-laminate during 3-point bending tests.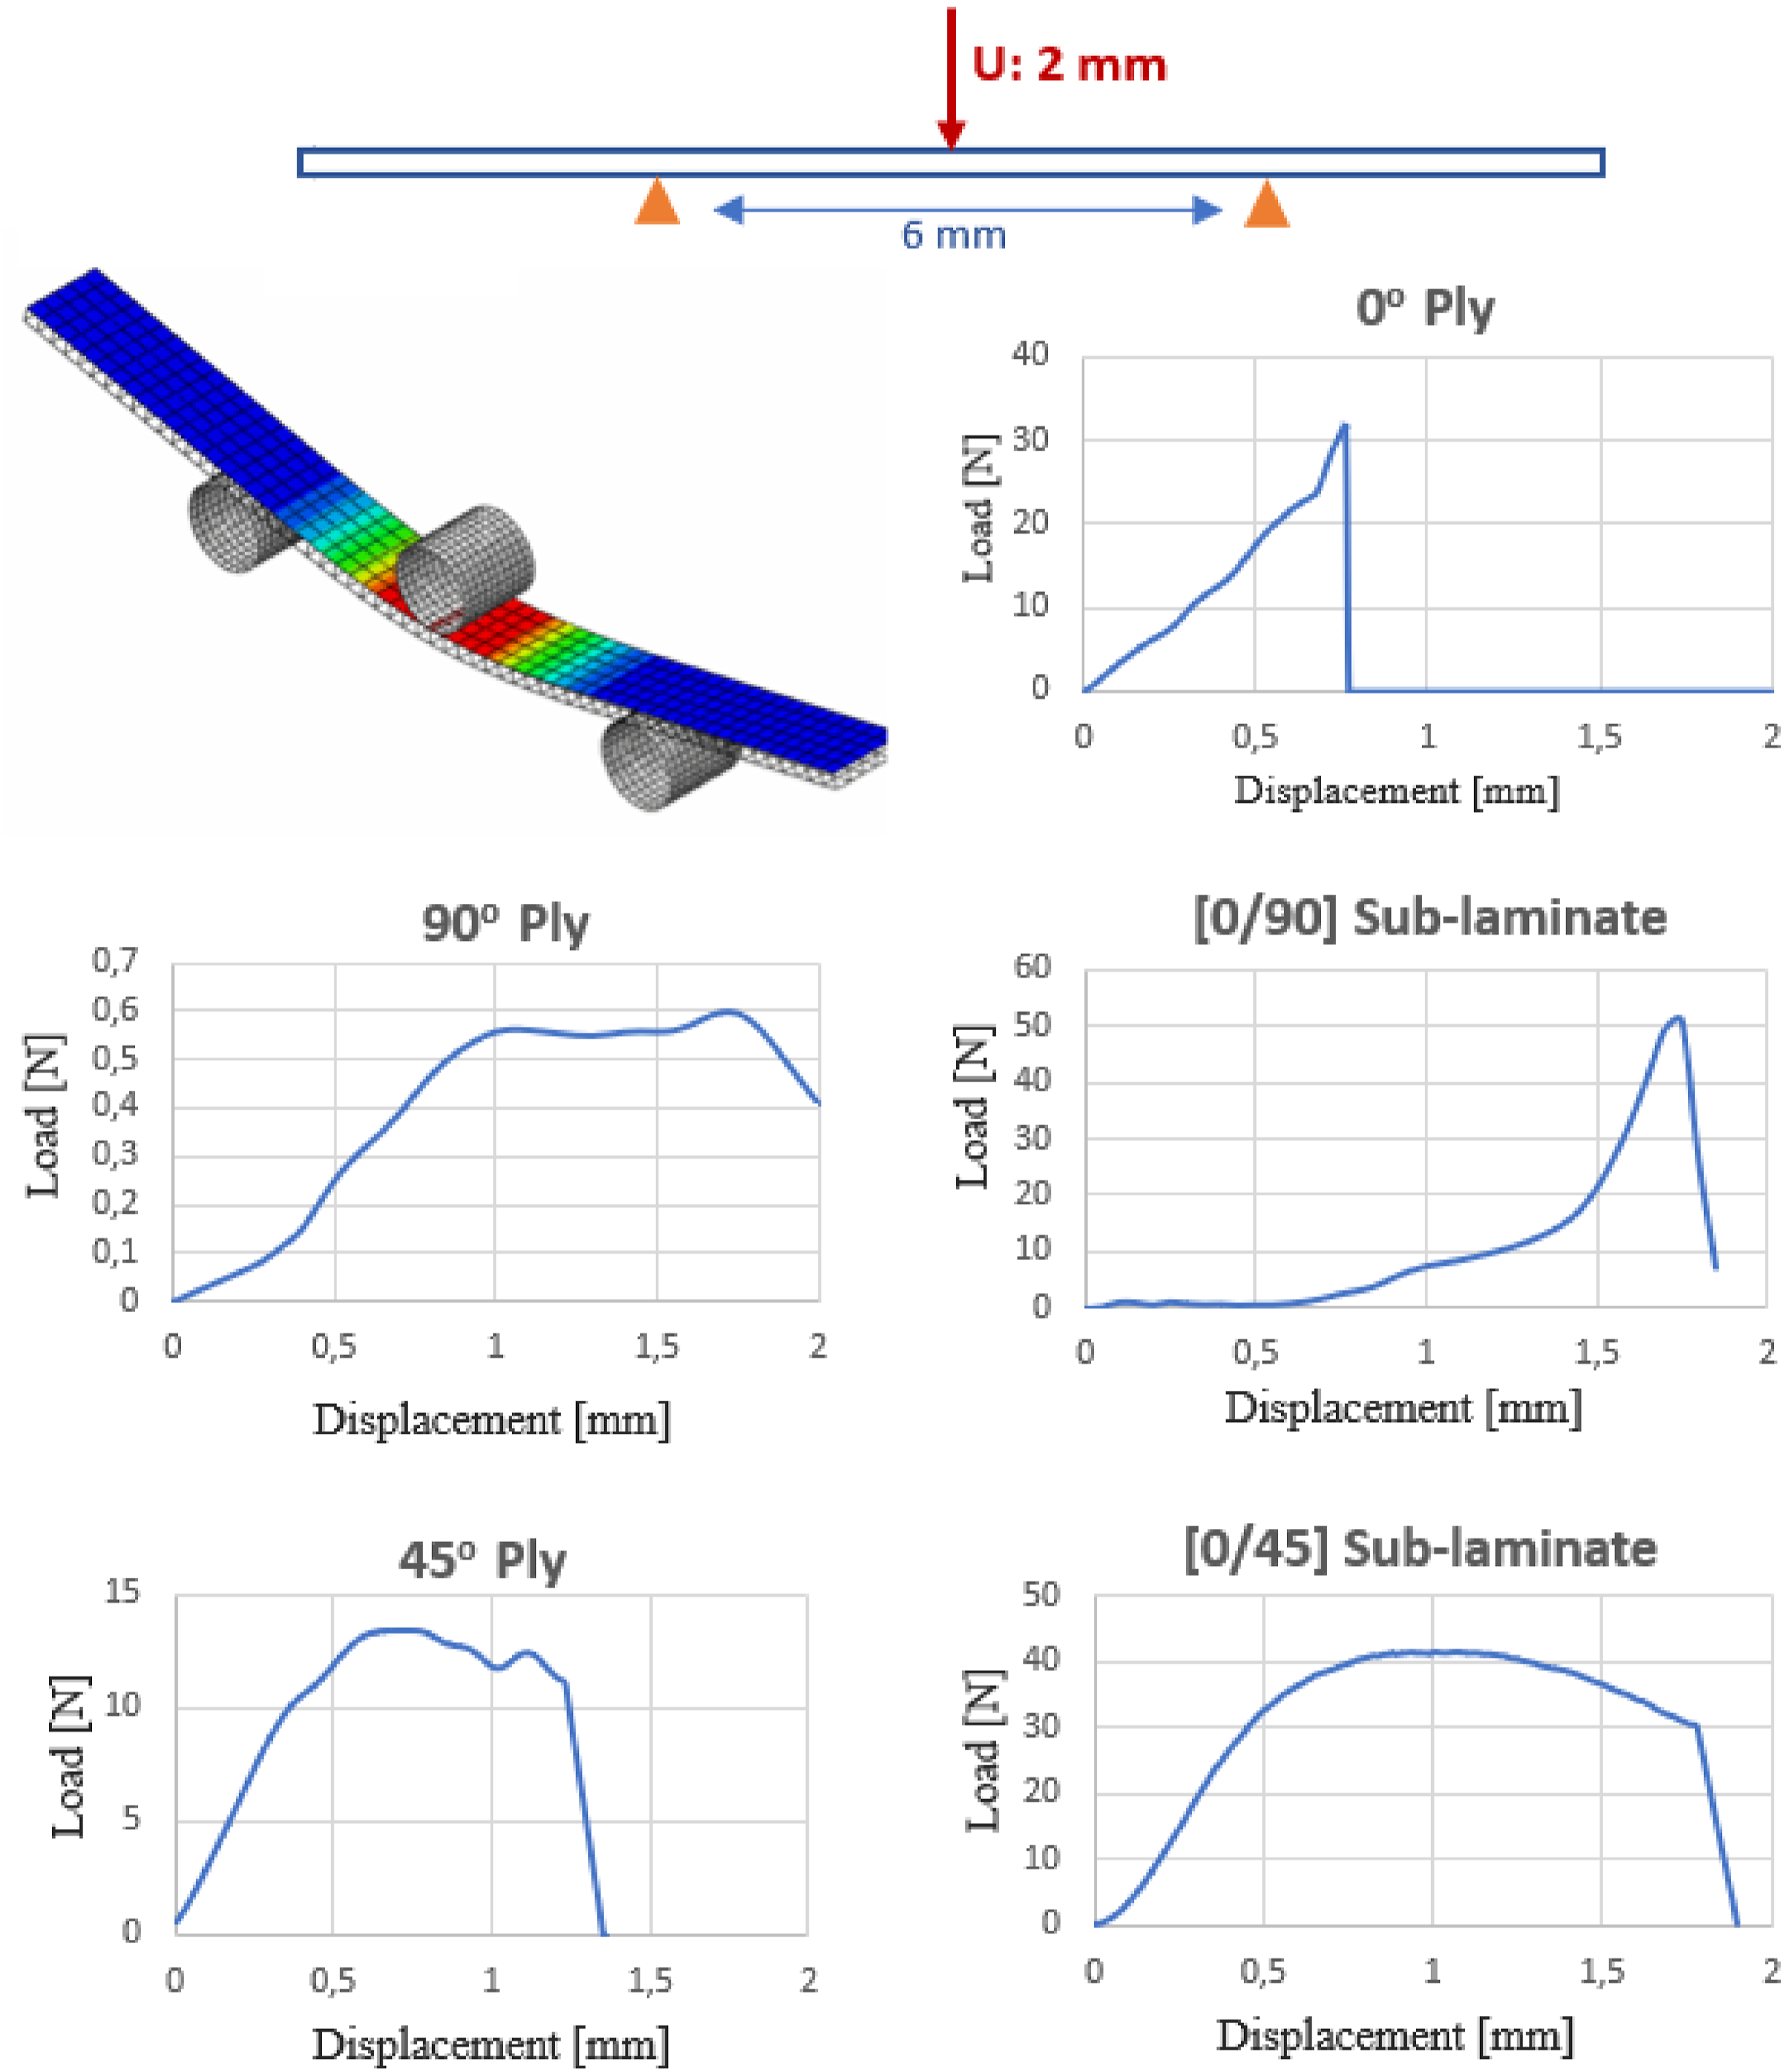
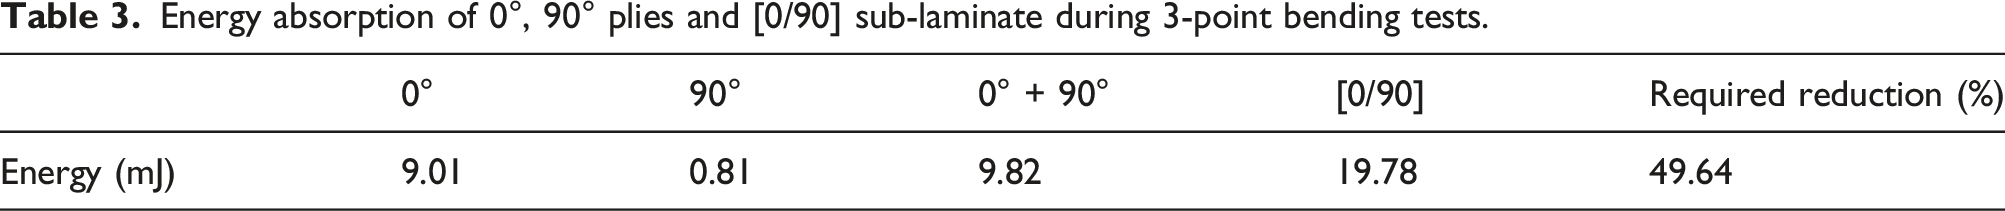
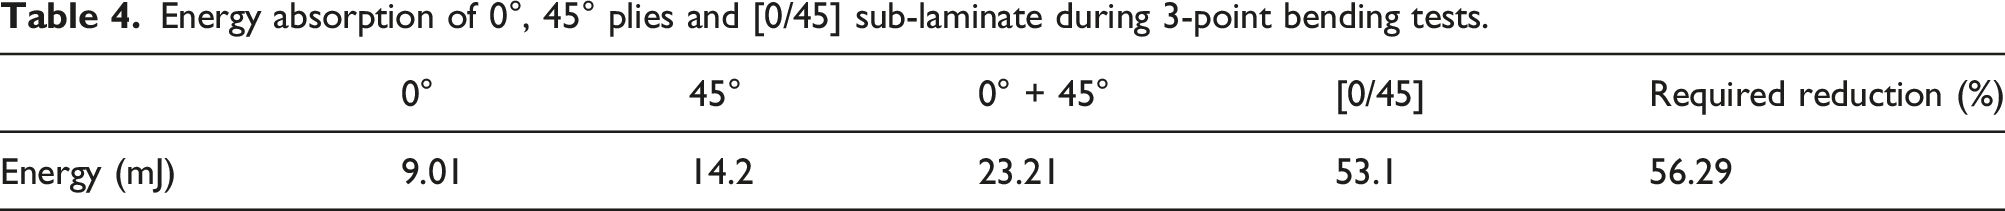
According to these results, the energy absorbed by [0/90] plate is approximately two times higher than the sum of energies absorbed by individual 0 and 90-degree plies. Therefore, to reach the accurate outcomes from the novel numerical approach, in-plane parameters are decreased by 50% since it is observed that [0/90] sub-laminates do not remain intact during crushing. According to the results given in Table 4, for the novel numerical model of [0/45/0/−45]s plate, in-plane parameters are decreased by 55%.
Besides parametric adjustments, in the numerical analysis applied in ABAQUS/Explicit, the imposed velocity, boundary conditions and element types are kept the same with the original models. With the new numerical approach, energy absorption capability of the [0/90]2s composite flat plate can be estimated accurately and the computational time is decreased considerably. The results are examined in the following section.
Results and discussion
Test results
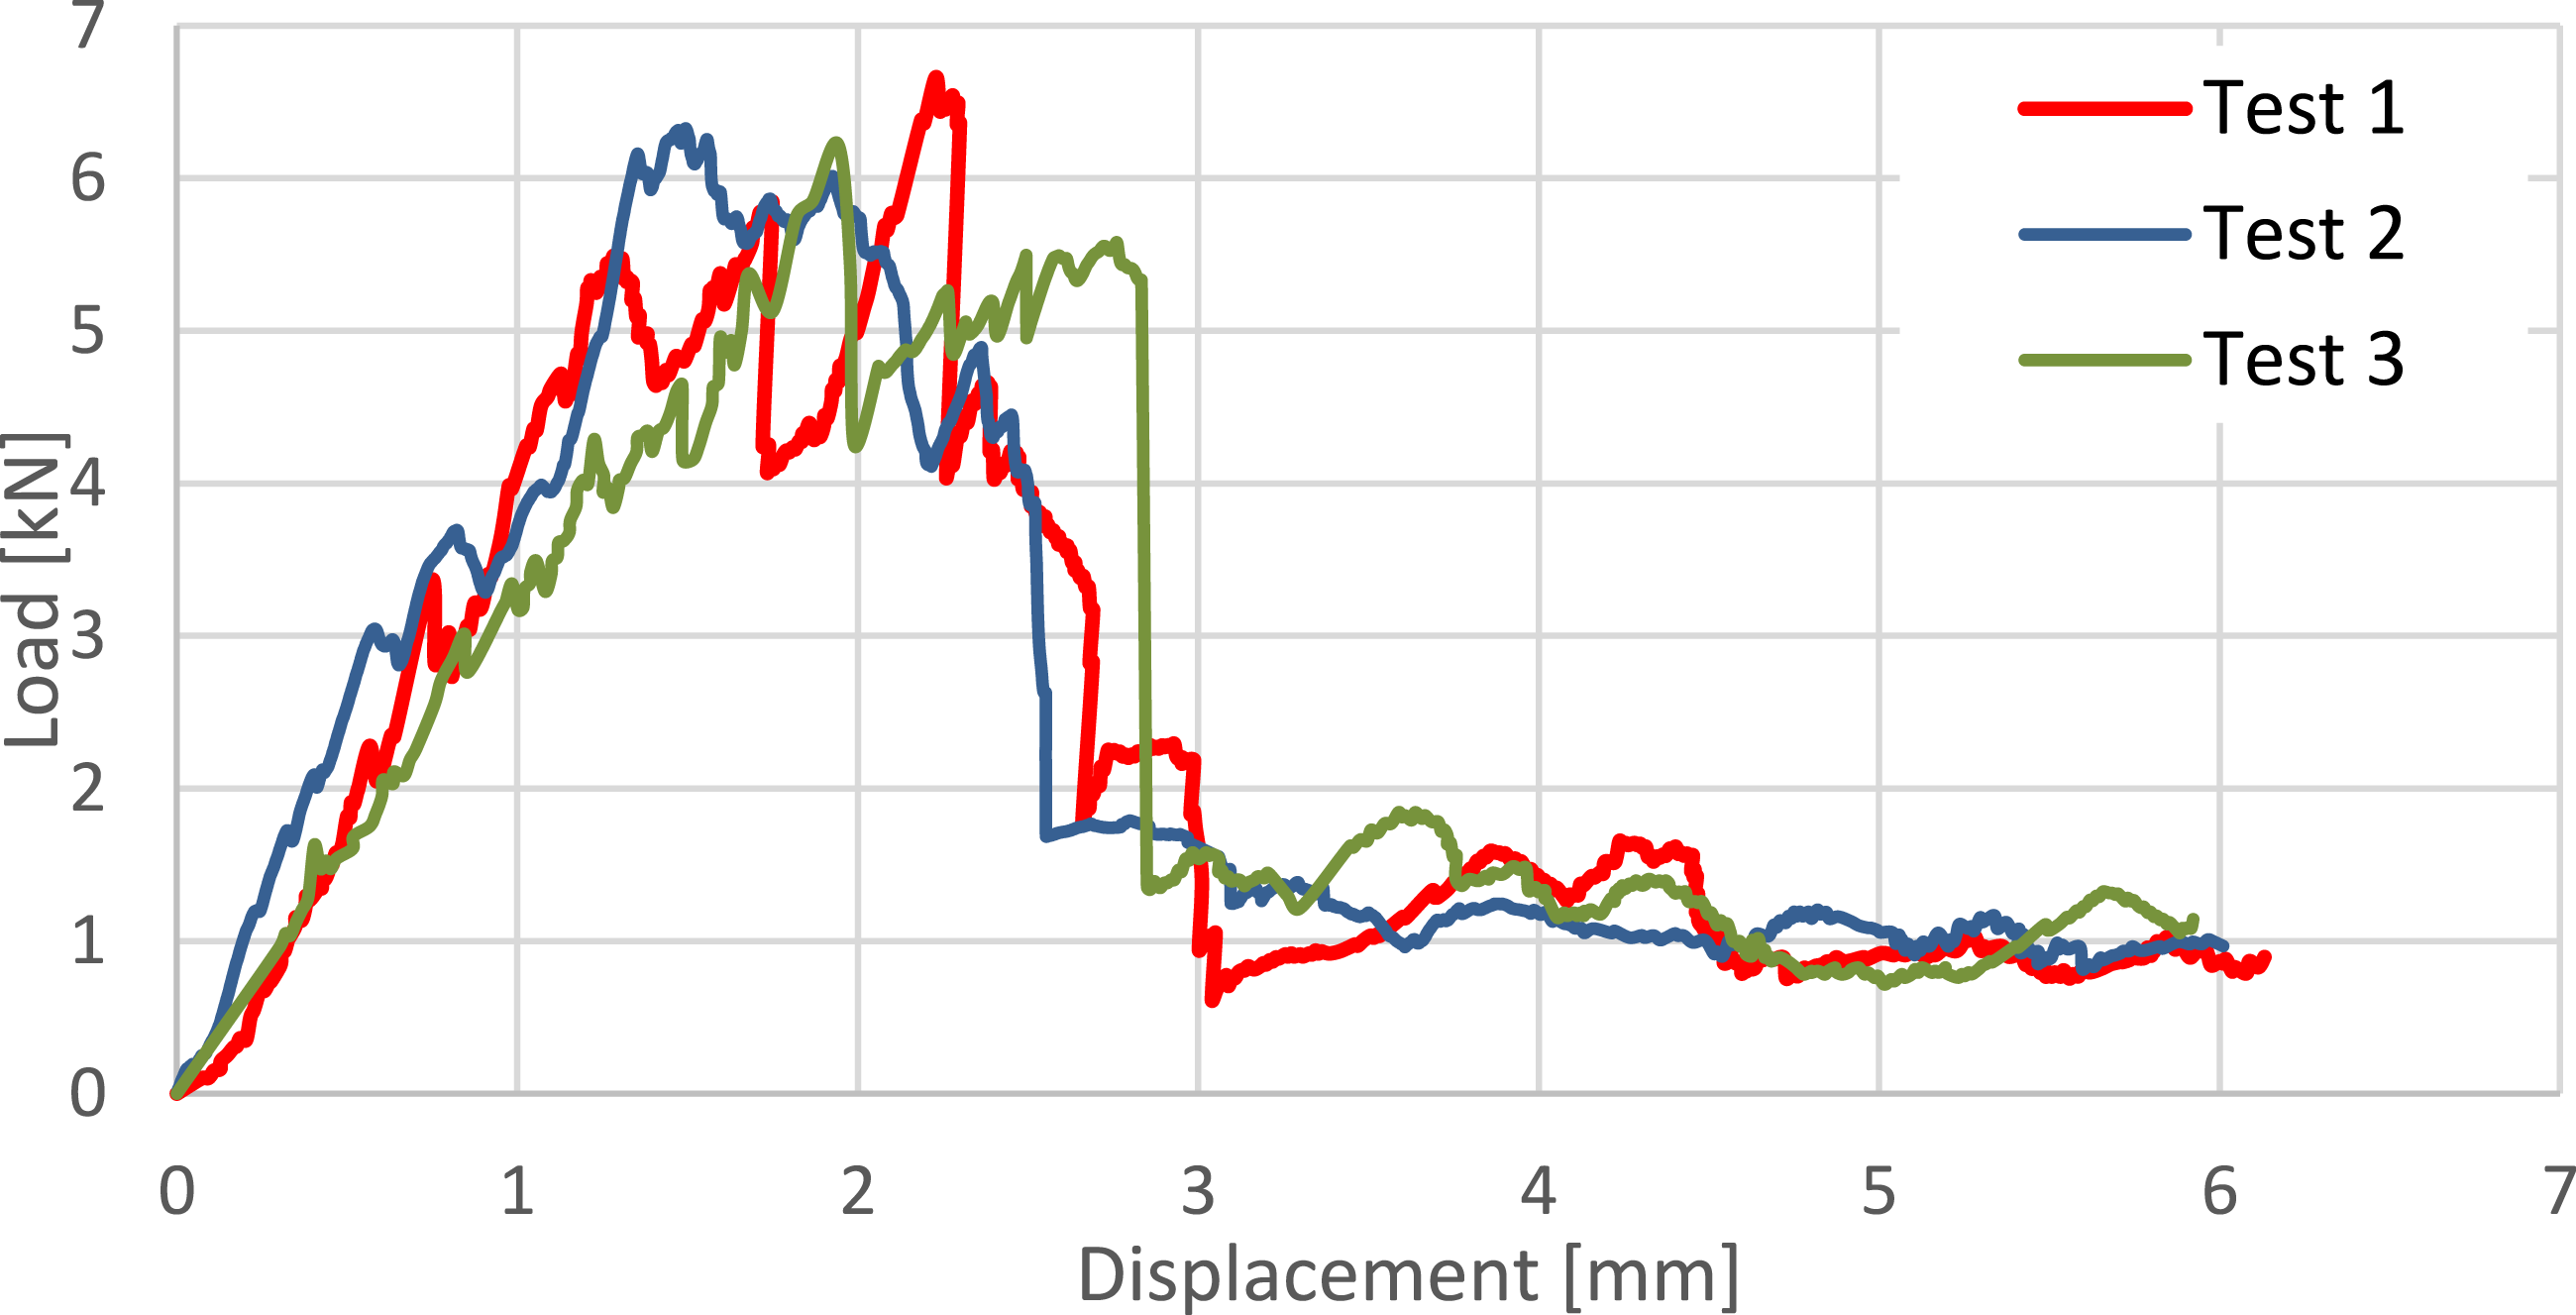
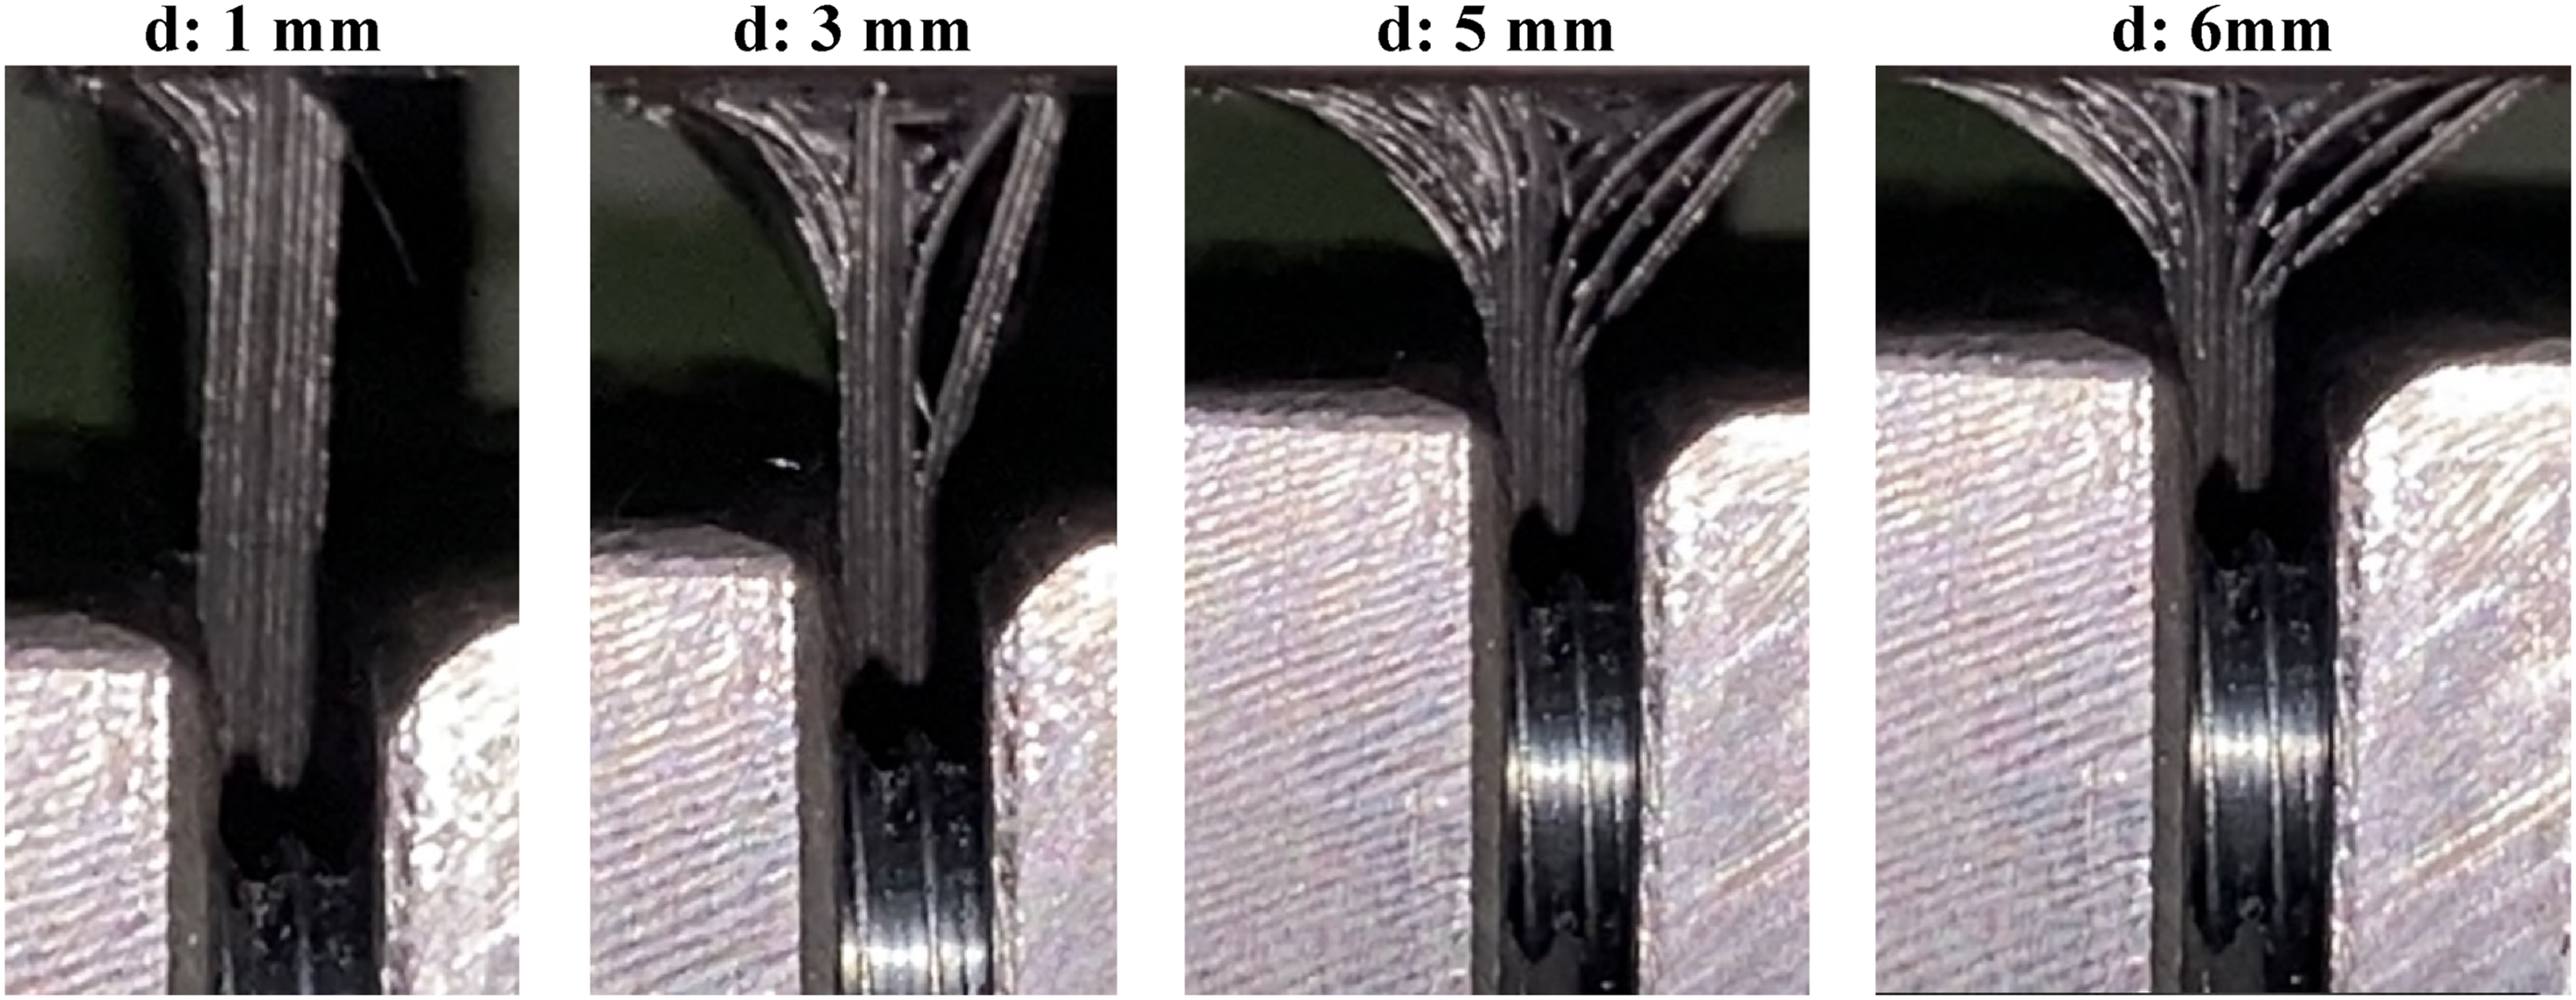
One of the purposes of this study is to understand failure mechanisms that create crushing morphology and the load–displacement trend. Figure 6 presents the load–displacement curves of cross-ply [0/90]2s flat plates with 8 plies obtained from the quasi-static crush tests. Some snapshots of gradual crushing of one of the specimens is given in Figure 7. The load–displacement curve of the [0/90]2s flat specimen with 8 plies. The crushing process of [0/90]2s flat plate specimen with 8 plies from test #1.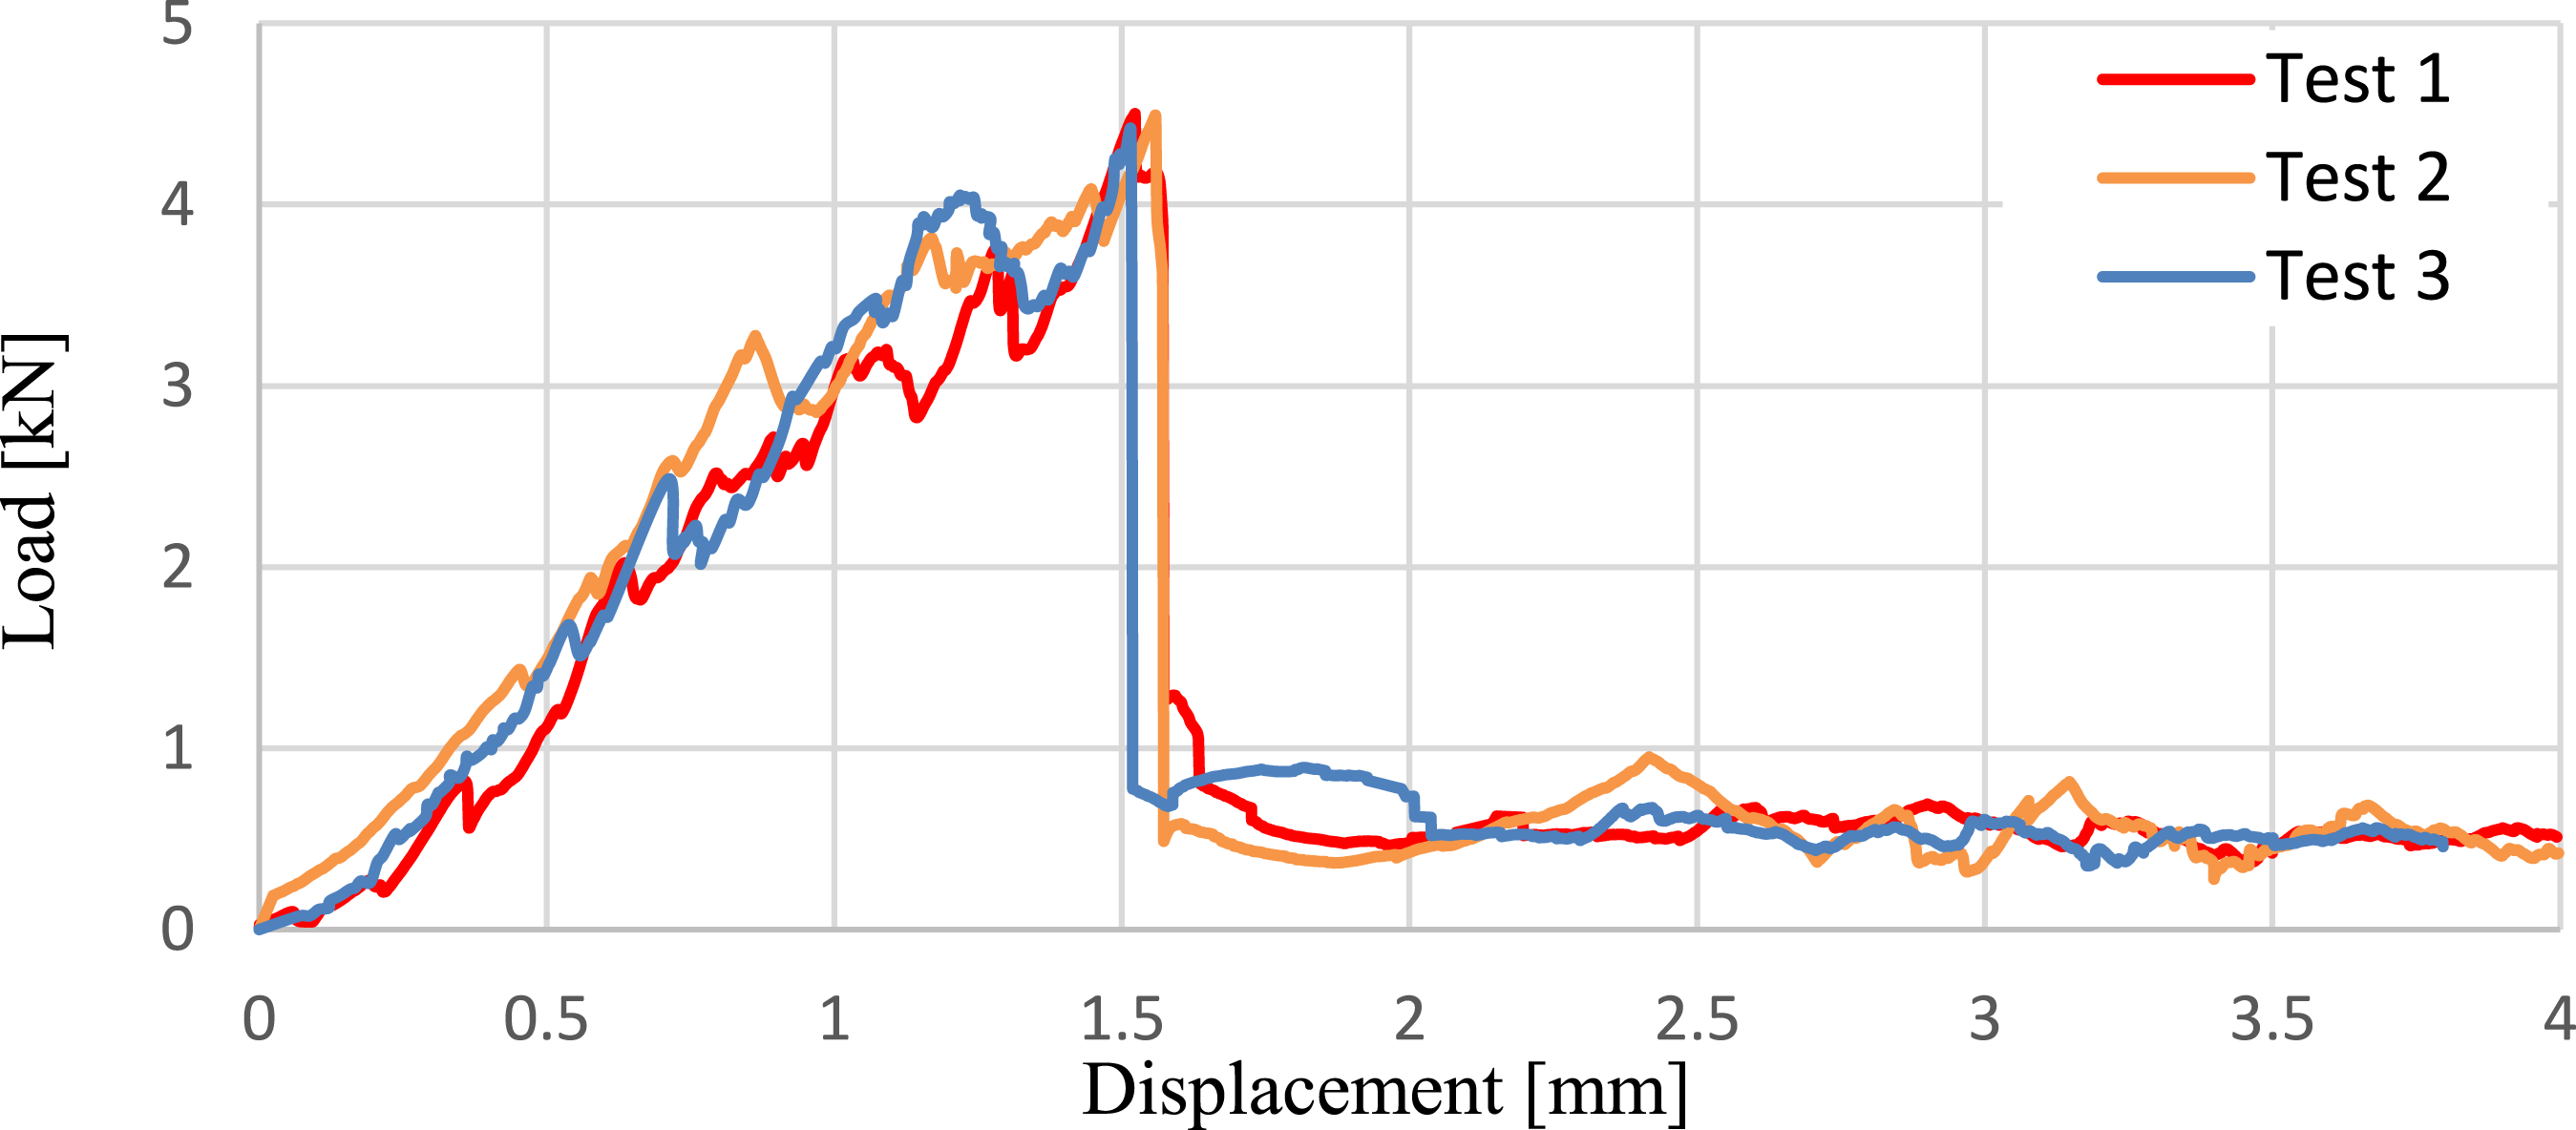
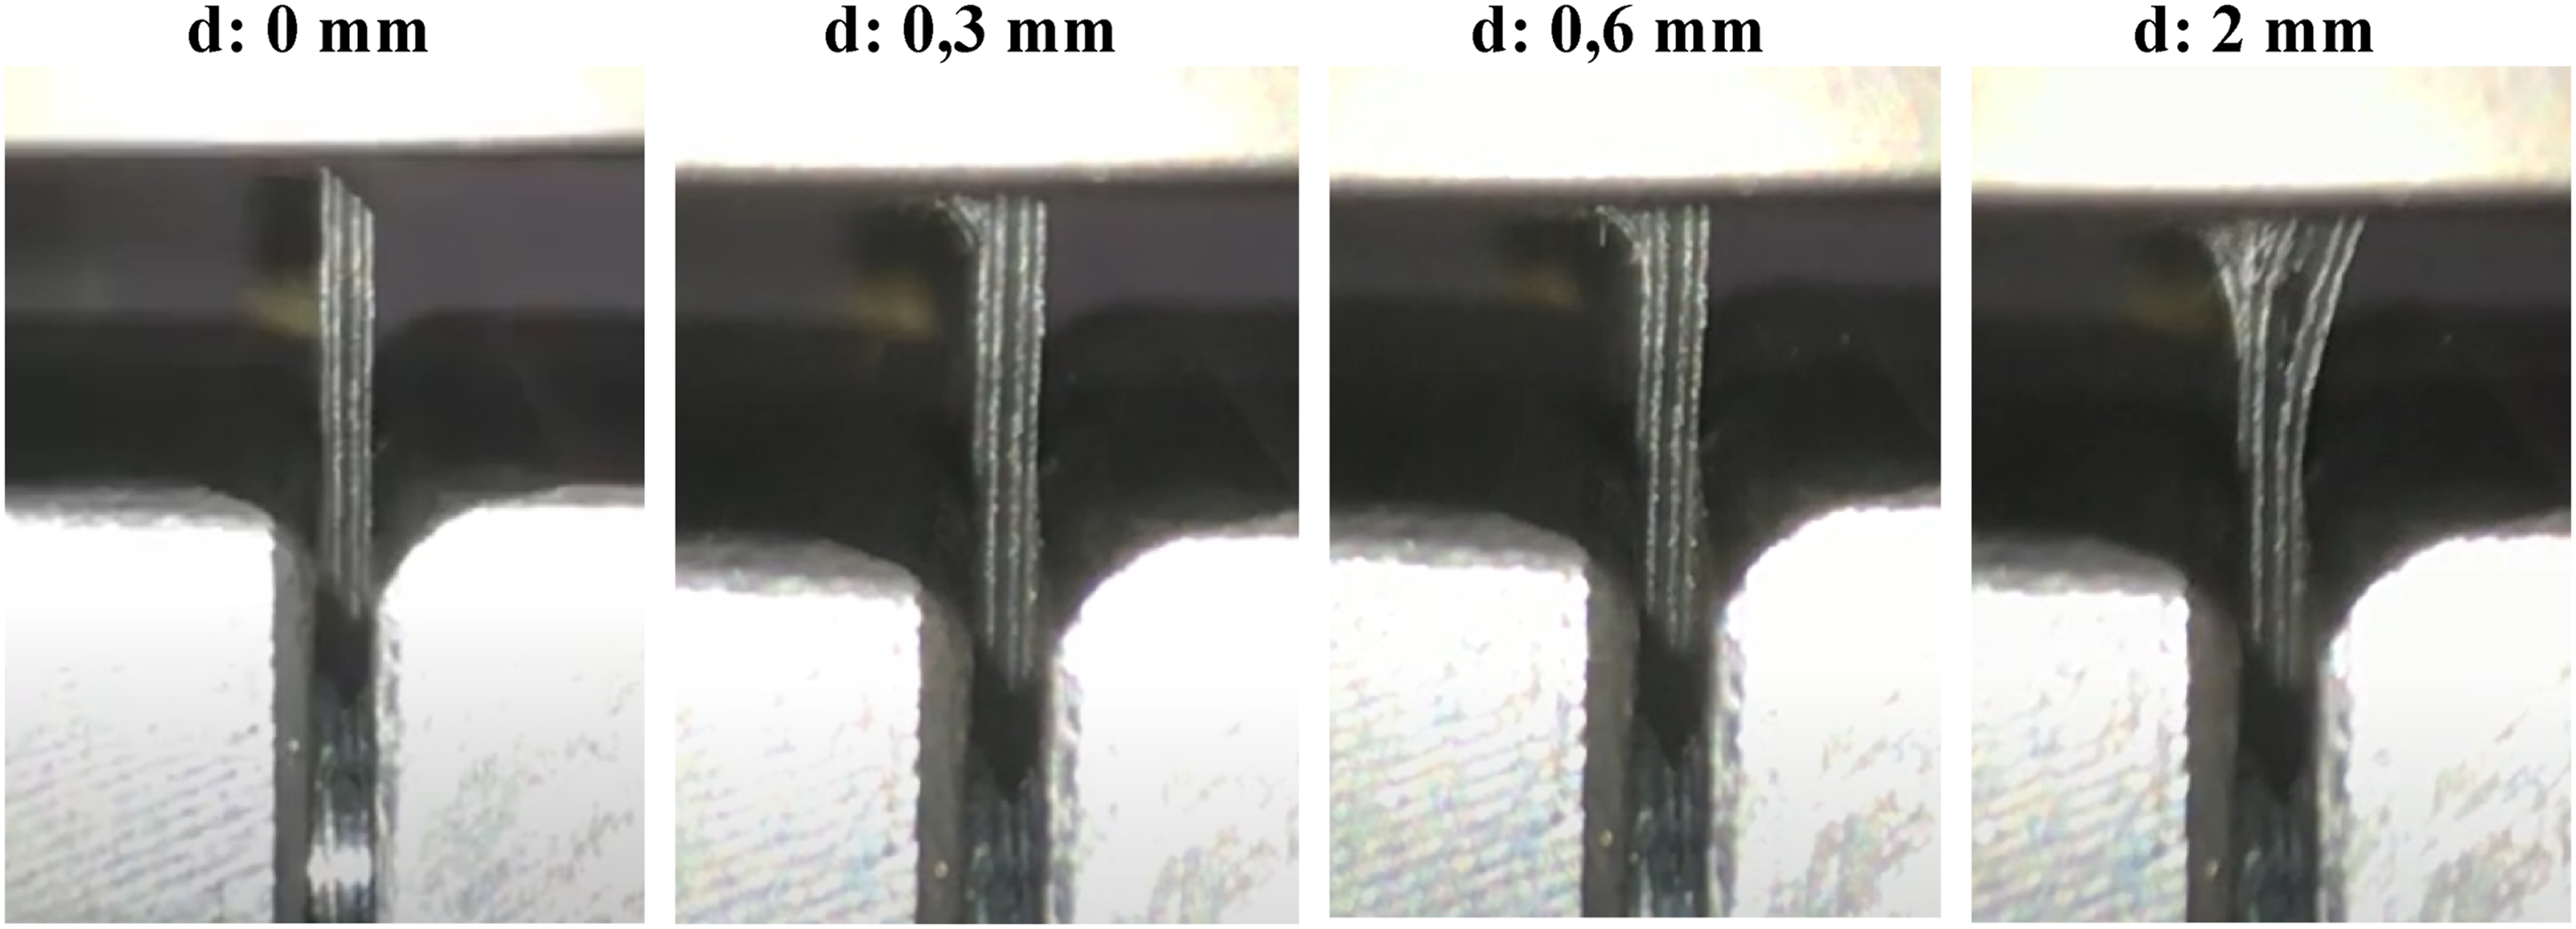
According to the observations made from the crushing morphology, at the beginning of the crushing process of flat coupon plates, delamination starts at the interface between first and second plies due to the high stress levels at the tip of the chamfer. After that point, the first ply, subjected to axial load by moving rigid wall, starts to bend and that creates splaying mode. The length of the bent ply depends on the length of the interlaminar crack that occurs at the interface. Since the length of the interlaminar cracks is variable throughout the thickness, one can see different levels of splaying mode during the crash event. In a cross-ply specimen, generally 0-degree plies have higher tendency to bend; therefore, fibre tensile failures can be seen due to the bending mode.
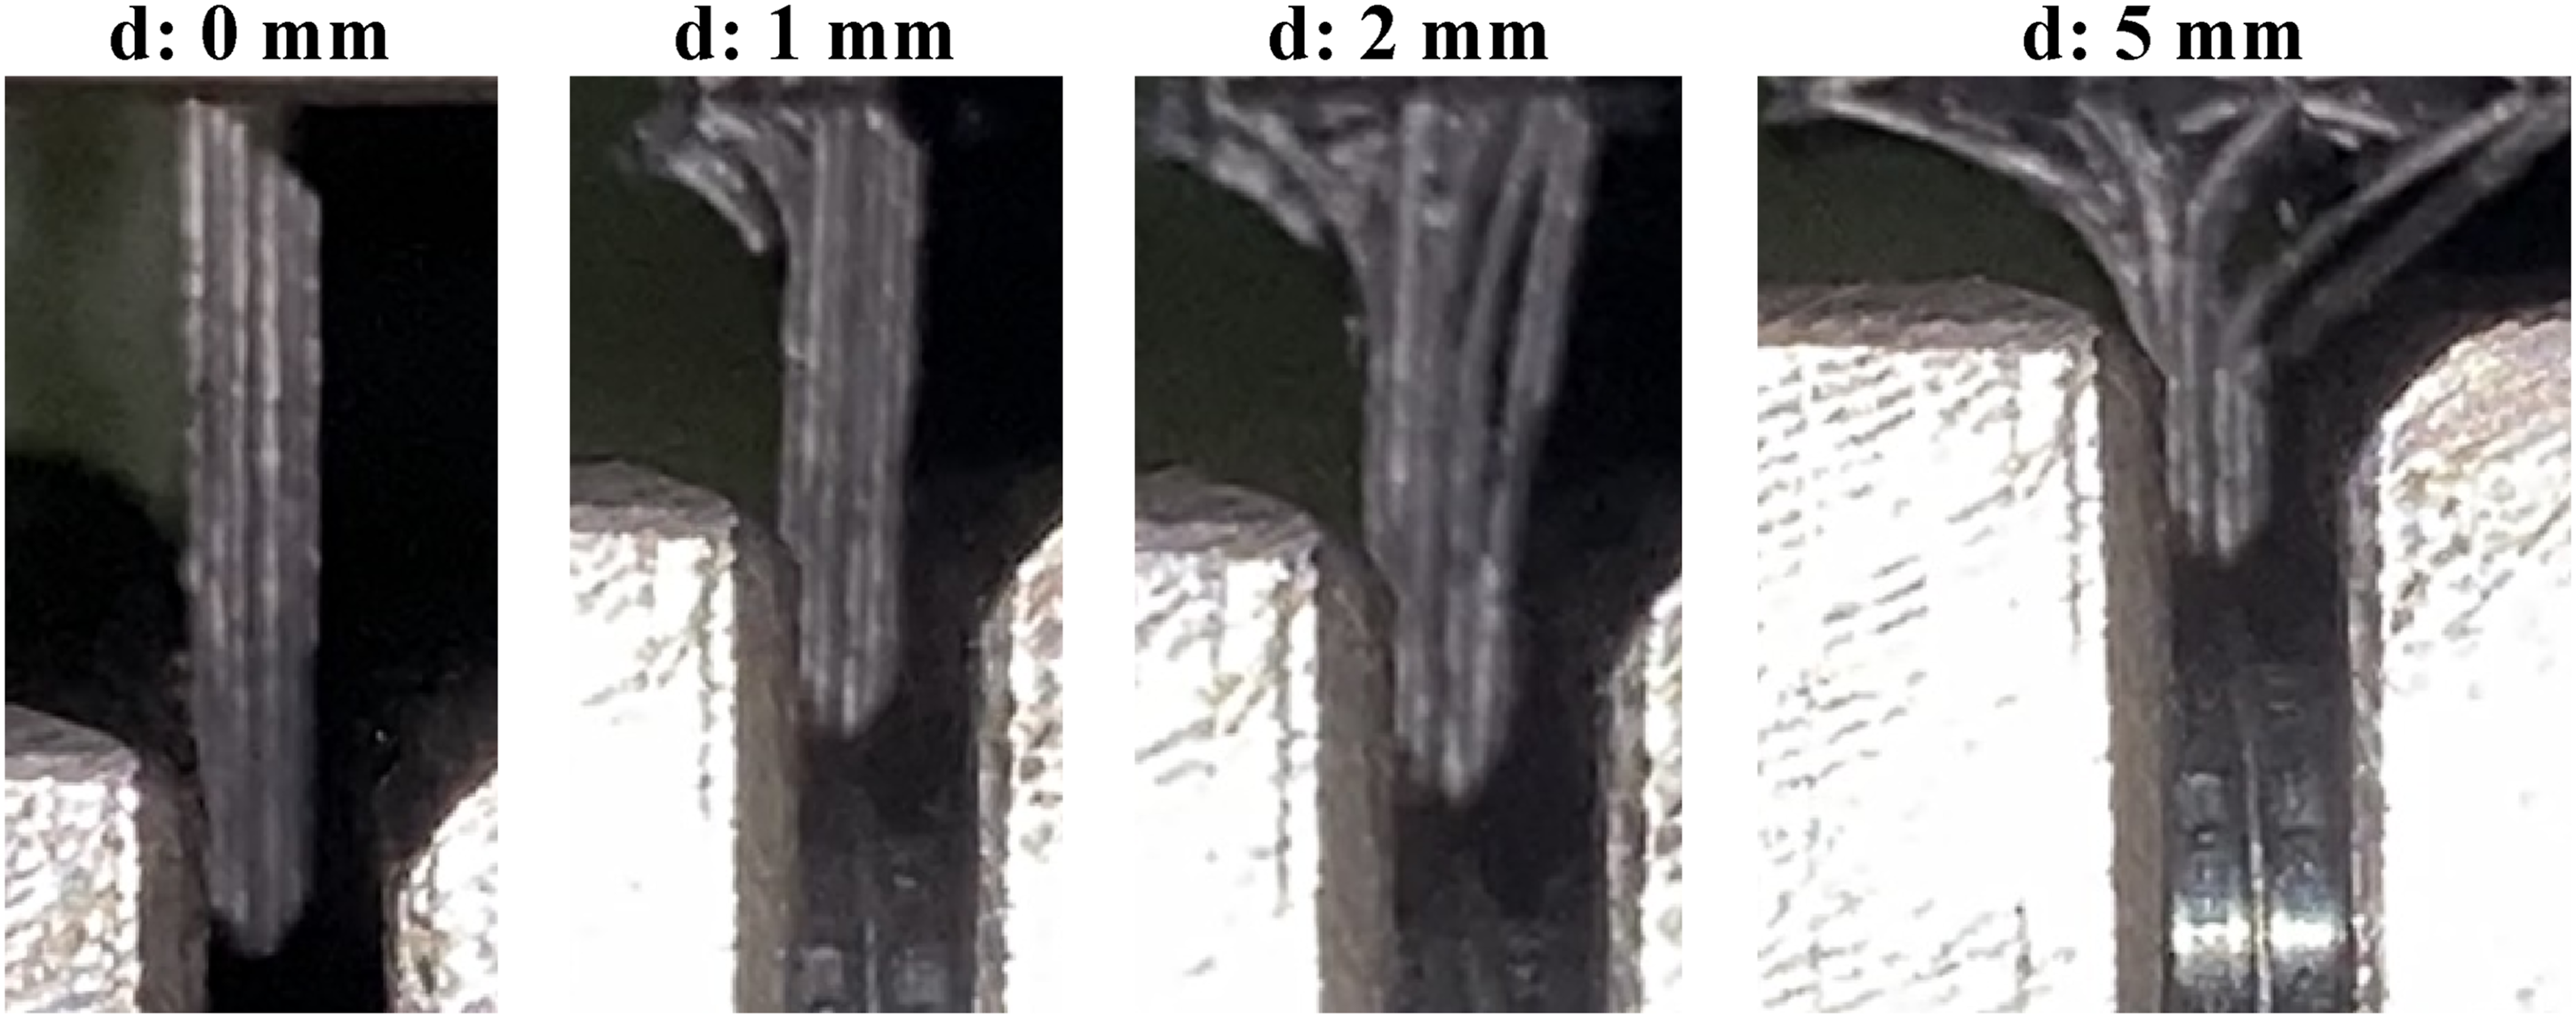
After splaying of some plies, fragmentation occurs at the plies that do not bend or splay. The fragmentation mode is characterised by two types of failure. The first type is matrix cracks that occur in the 90-degree plies due to shear. Debris is formed by these accumulated fragments. The second type is fibre failure in the 0-degree plies, located in the centre, due to micro-buckling of the fibres at the tip or fibre breakage as a result of a combination of compression and bending. Usually, the fragmentation mode starts first with 45-degree cracks in 90-degree plies. If the transverse force is high enough (causing larger cracks), splaying mode can be initiated in other 0-degree plies. If this is not the case, adjacent 0-degree plies are also subjected to local fragmentation. After delamination has initiated at all seven interfaces, the load reaches its peak level and then stable zone starts after about 1.5 mm crush where the load fluctuates around a mean load and the main failure modes are micro-fragmentation and splaying. Cross-ply specimens with 12 and 16 plies are also tested using the same experimental procedure and the load–displacement curves and failure mechanisms can be seen in Figures 8–11. The load–displacement curve of the [0/90]3s flat specimen with 12 plies. The crushing morphology of the [0/90]3s flat specimen with 12 plies from test #1. The load–displacement curves of [0/90]4s flat specimens with 16 plies. The crushing morphology of the [0/90]4s flat specimen with 16 plies from test #1.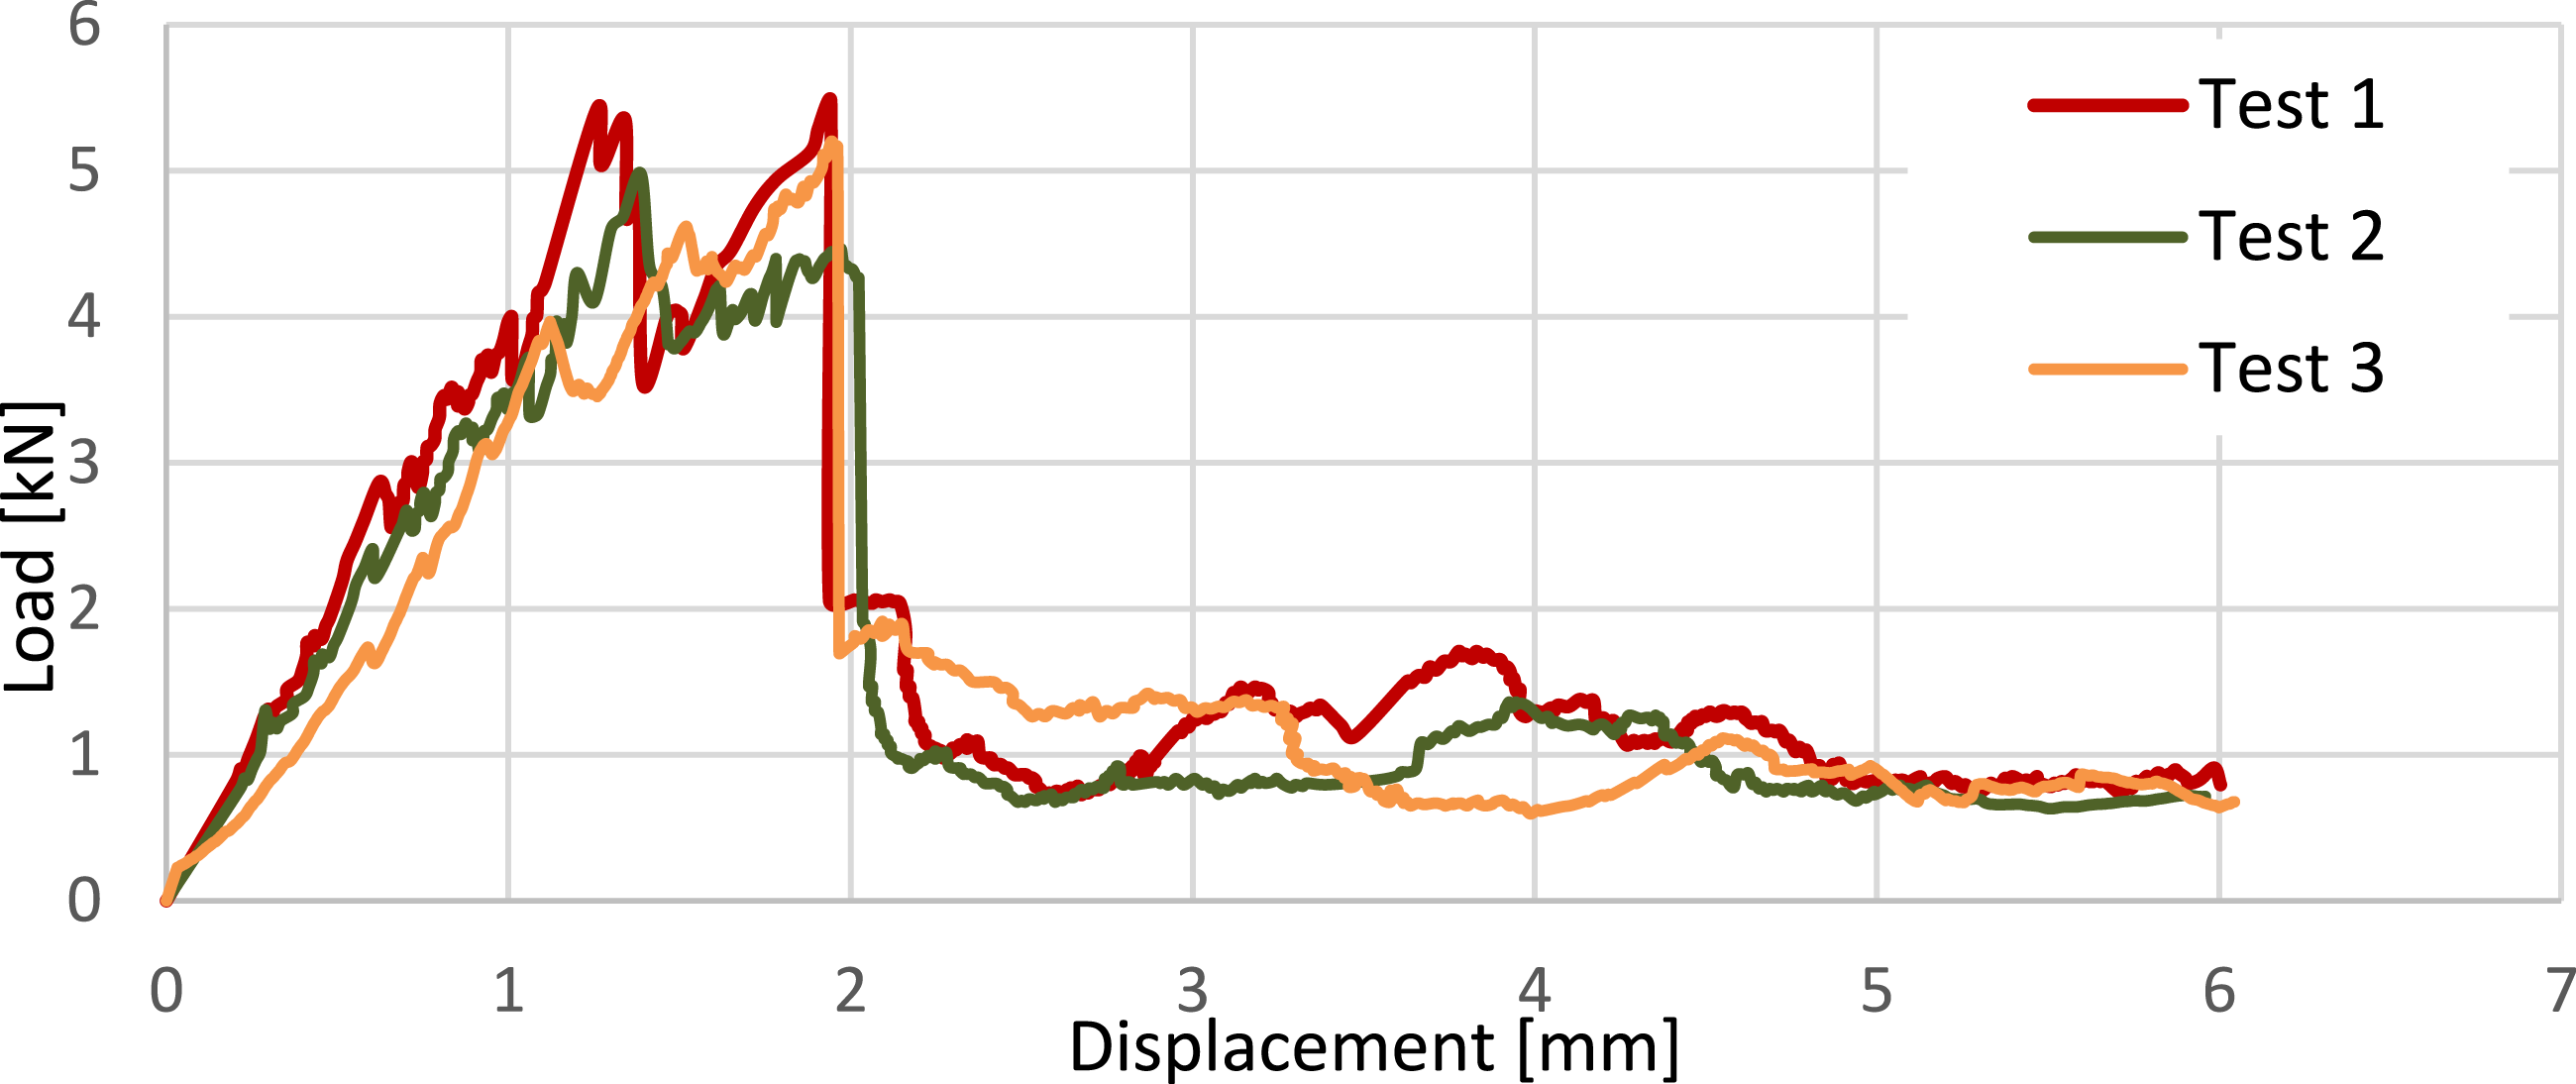
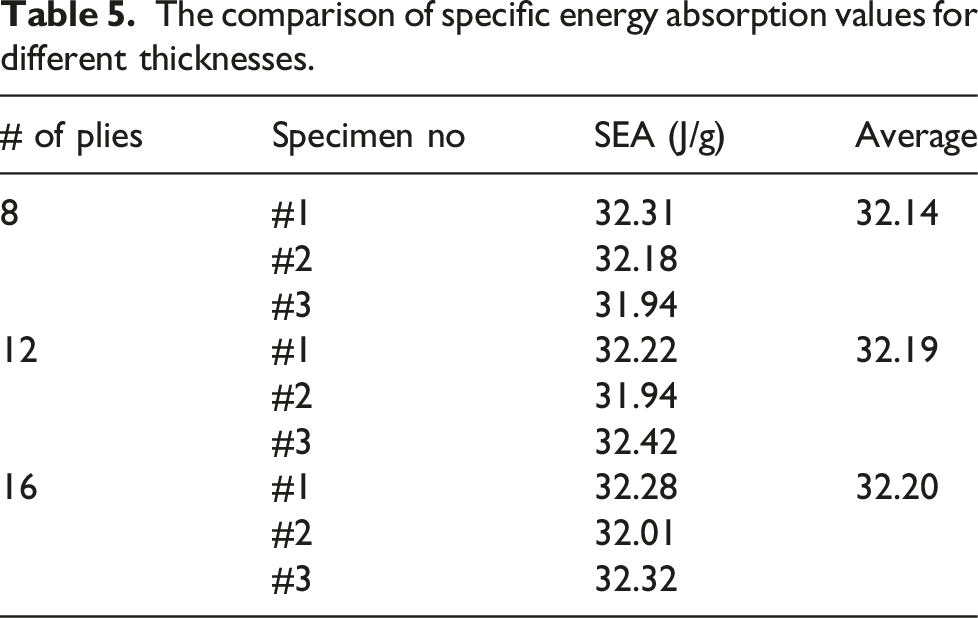
The comparison of specific energy absorption values for different thicknesses.
The load–displacement curves and the snapshot of [0/45/0/−45]s plate taken at the end of the test is demonstrated in Figure 12. Experimental results of [0/45/0/−45]s flat specimens: Load–displacement curve (left), crushed morphology (right).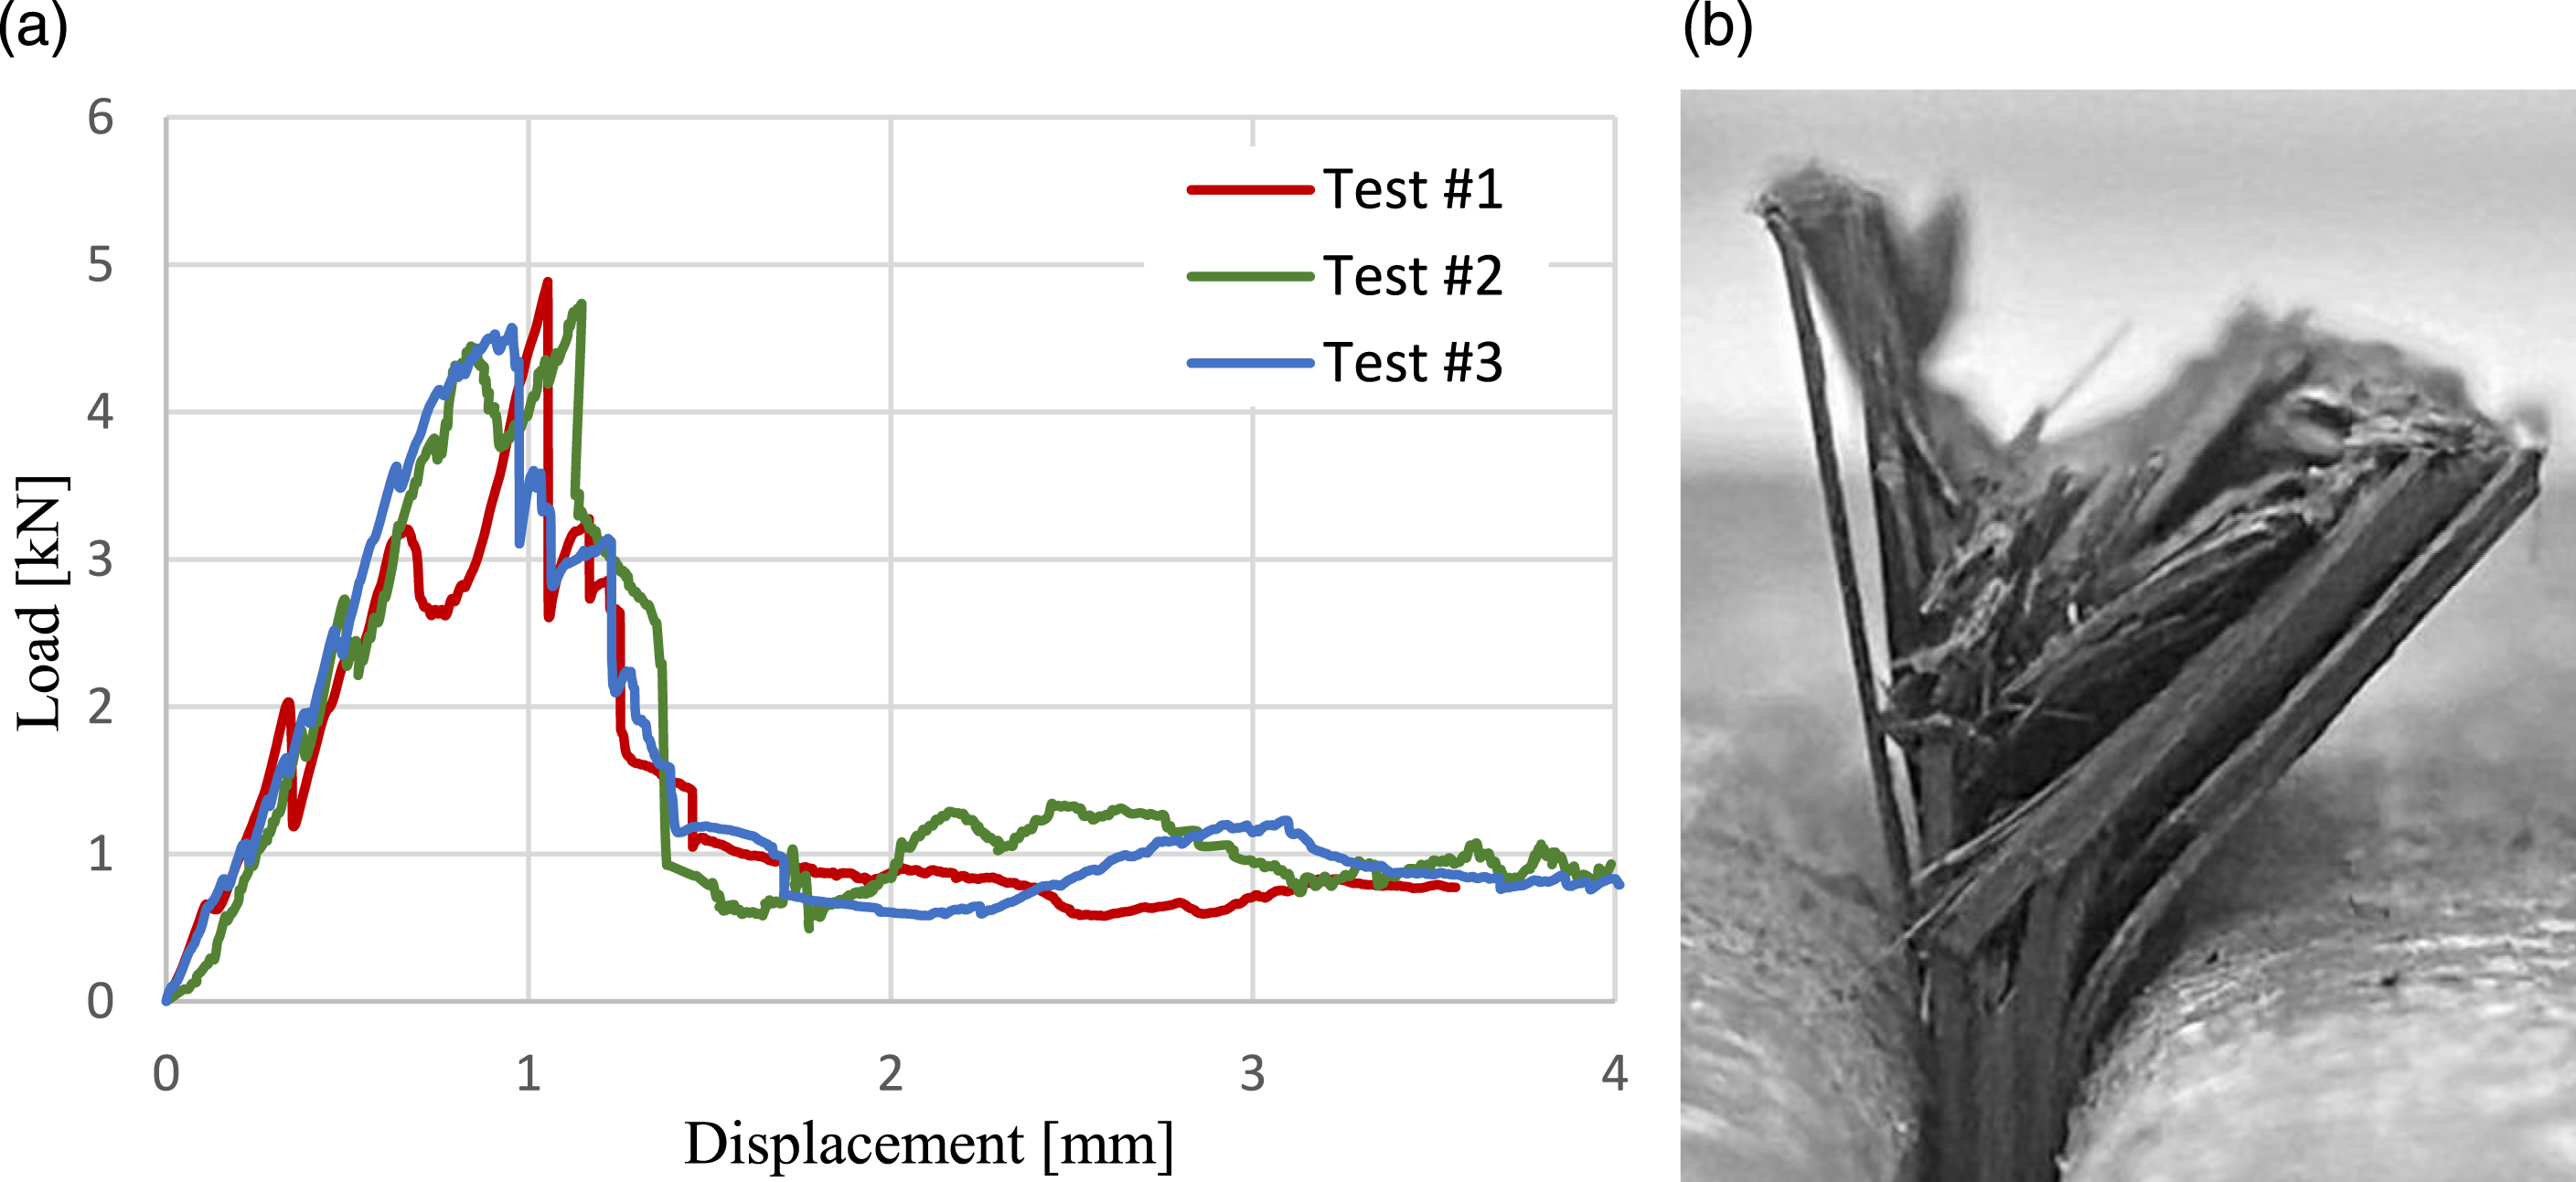
For three [0/45/0/−45]s plates, the mean value of the load at the stabilized region is higher than the loads obtained from [0/90]2s plates which means that they can absorb more energy than cross-ply specimens. According to the observations made from the crushing morphology during the quasi-static compression tests, the reason behind that increase in the energy absorption capability can be explained with the increase in the number of fragmentated fibres. When compared to 90-degree plies, where matrix cracks leading to splaying is the dominant mechanism, in 45-degree plies, more fibre breakage is observed which is the mode that absorbs highest energy among all in-plane failure modes.
Results of numerical analyses
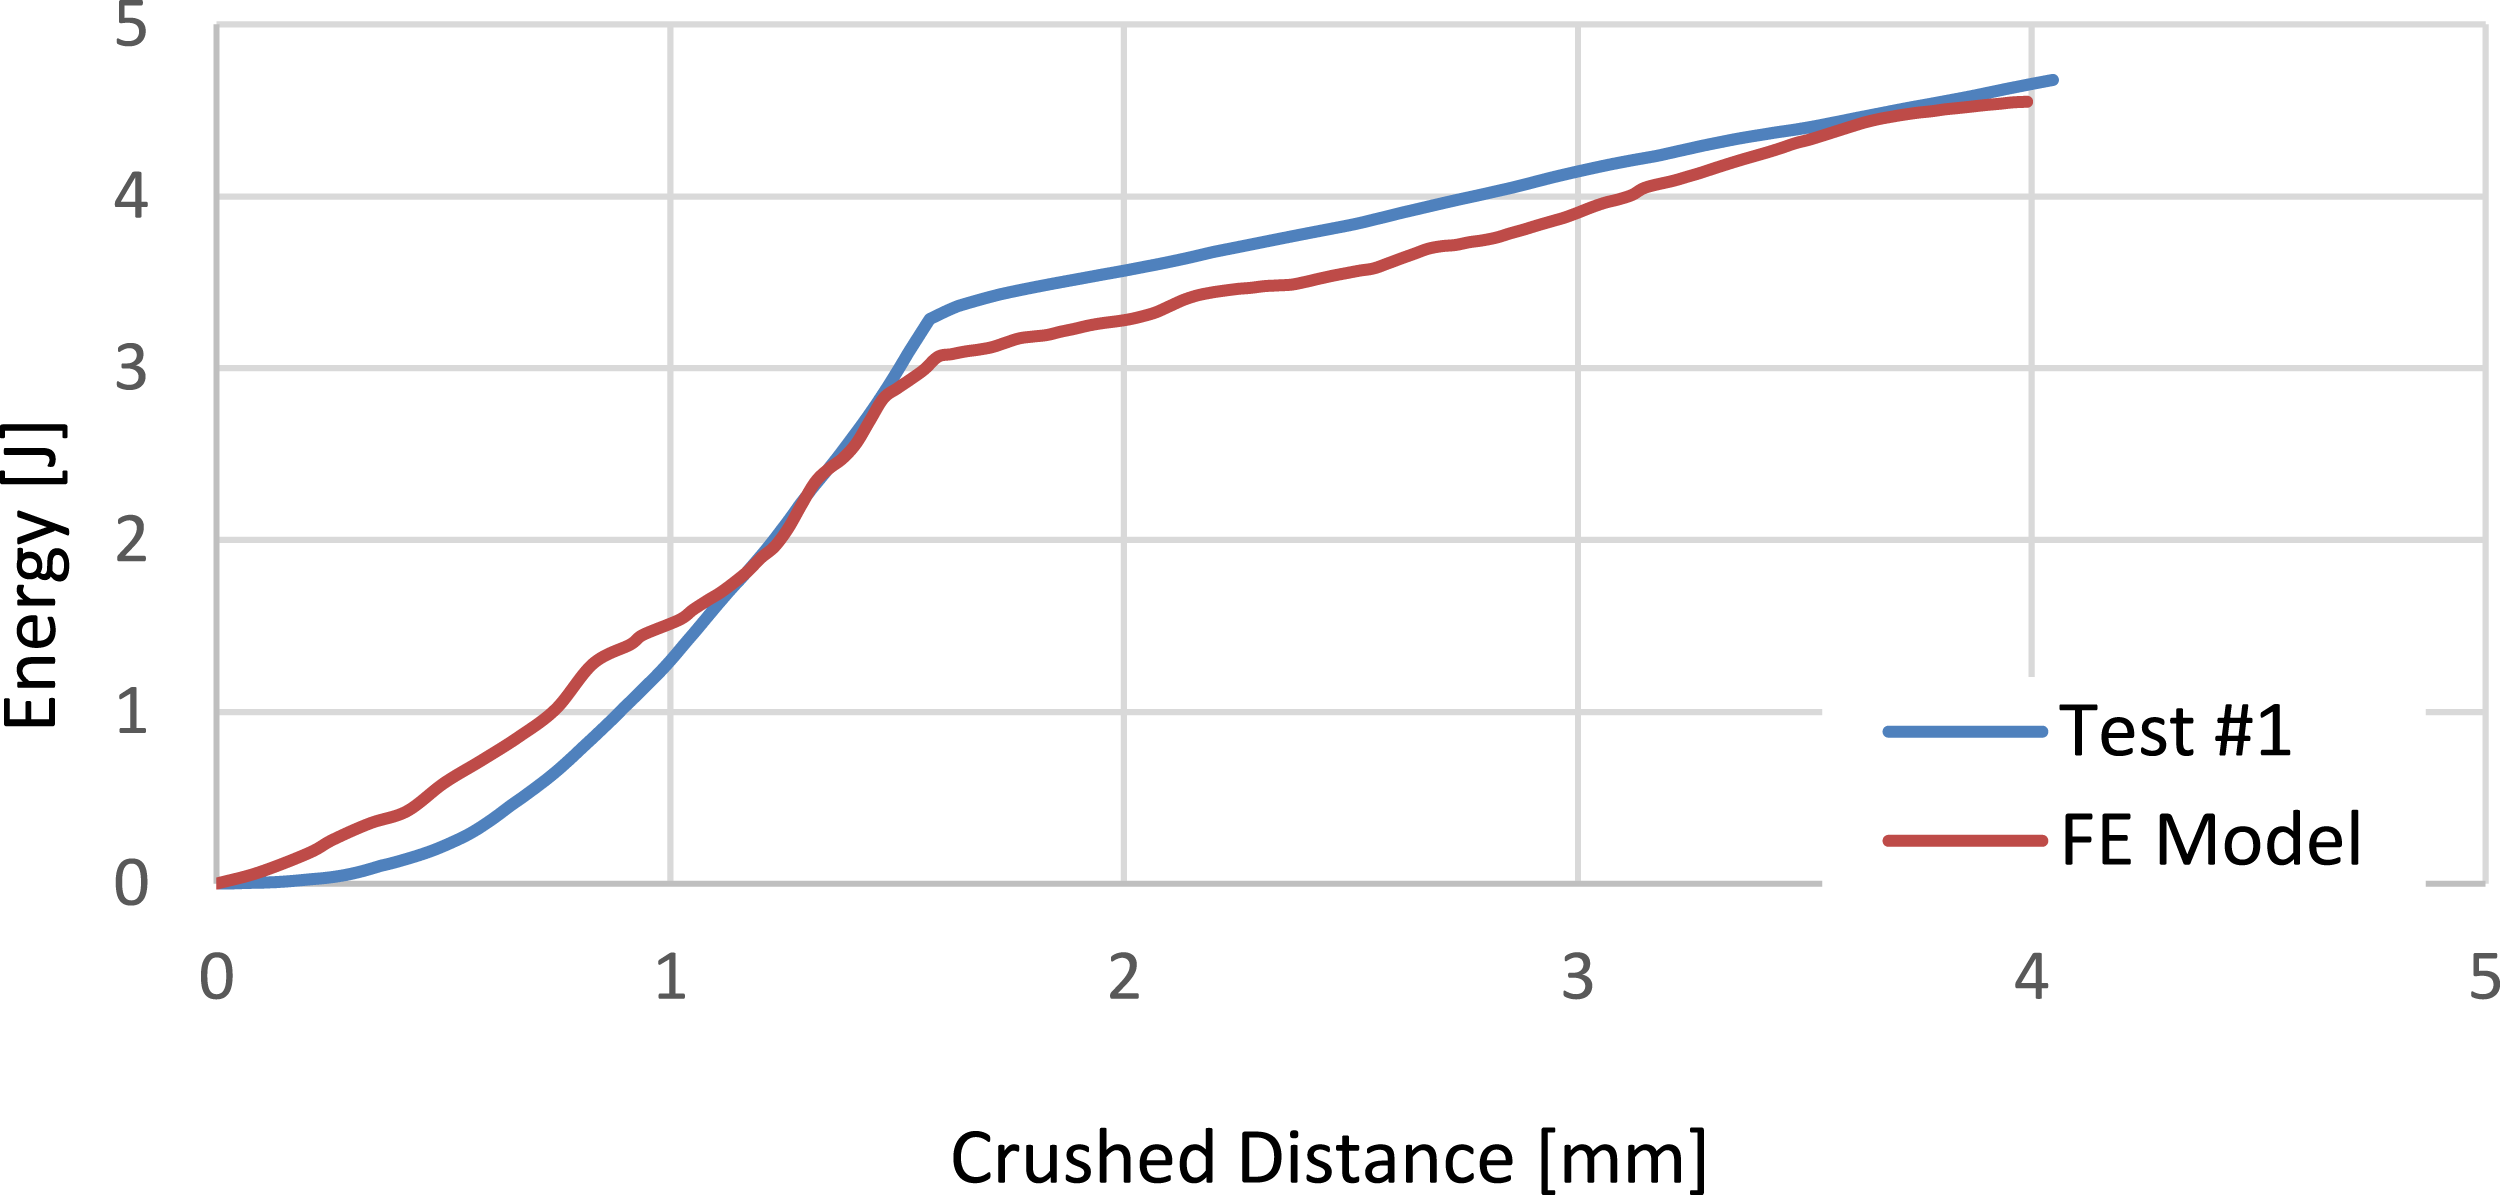
The comparison between the load–displacement curves of the experimental and numerical studies is presented in Figure 13. In this figure, numerical results are obtained using the model with cohesive elements in every interface between each ply. Although there are some fluctuations in the load–displacement curve obtained by numerical study, the overall trend is similar to the experimental data and more importantly, the model can predict the amount of energy absorbed during the crushing process accurately (see Figure 14). Here the kink in the energy-displacement curve corresponds to the point where crush zone reaches to the end of the chamfer, after which the energy absorption is uniformly increases as crush zone proceeds. Comparison between the load–displacement curves of the experimental test and FE analysis for [0/90]2s flat plate specimen. Comparison between absorbed energy values of [0/90]2s flat plate during the experimental test and finite element analysis.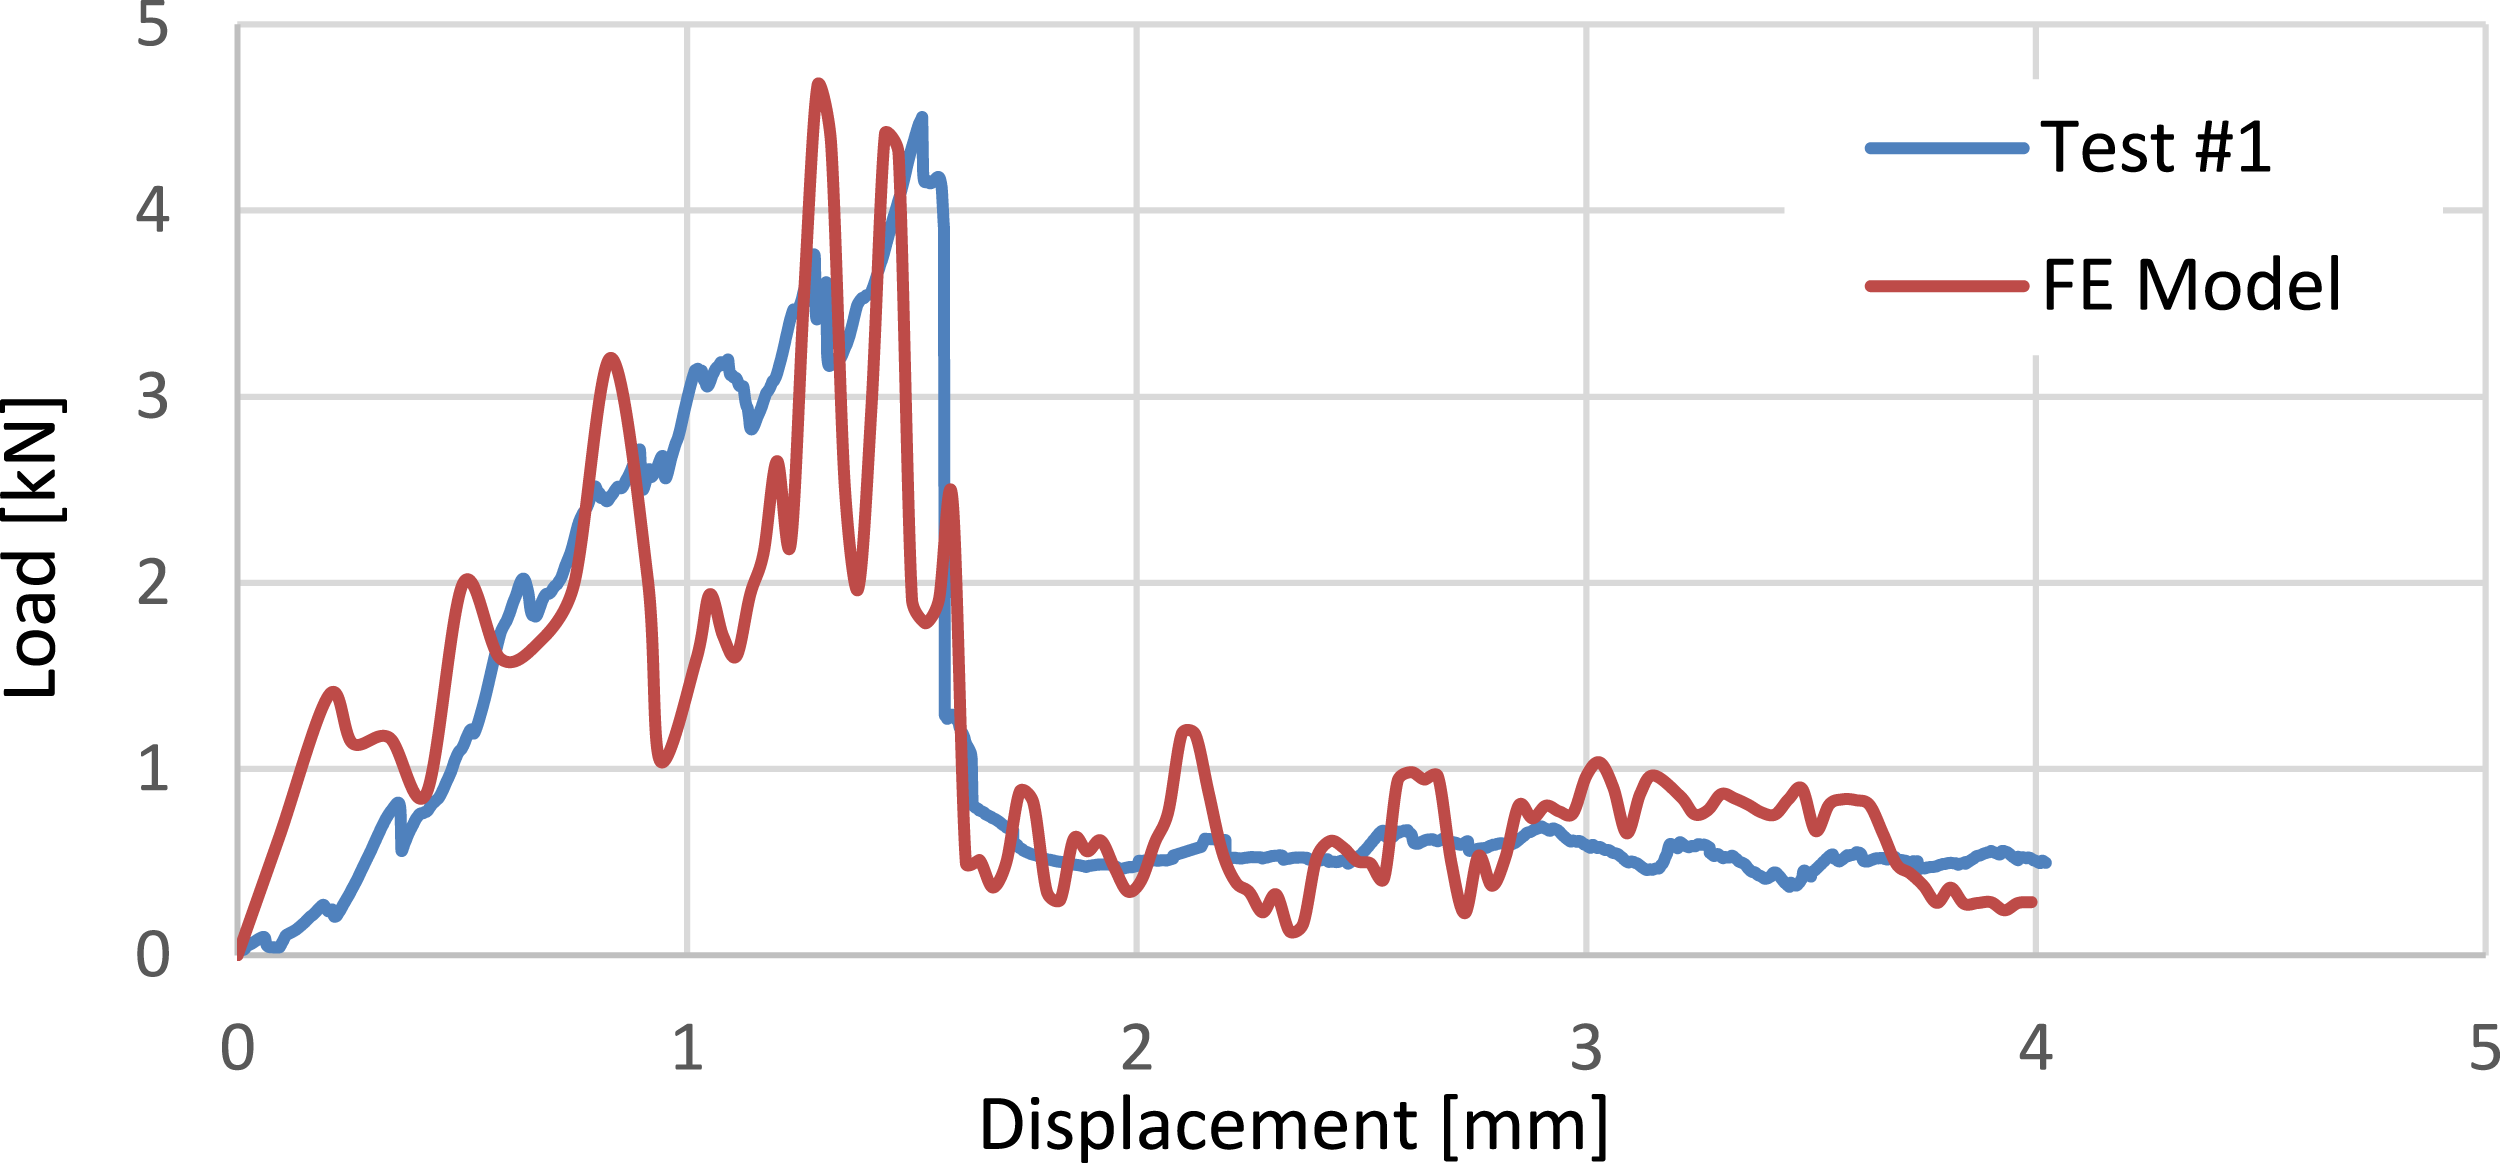
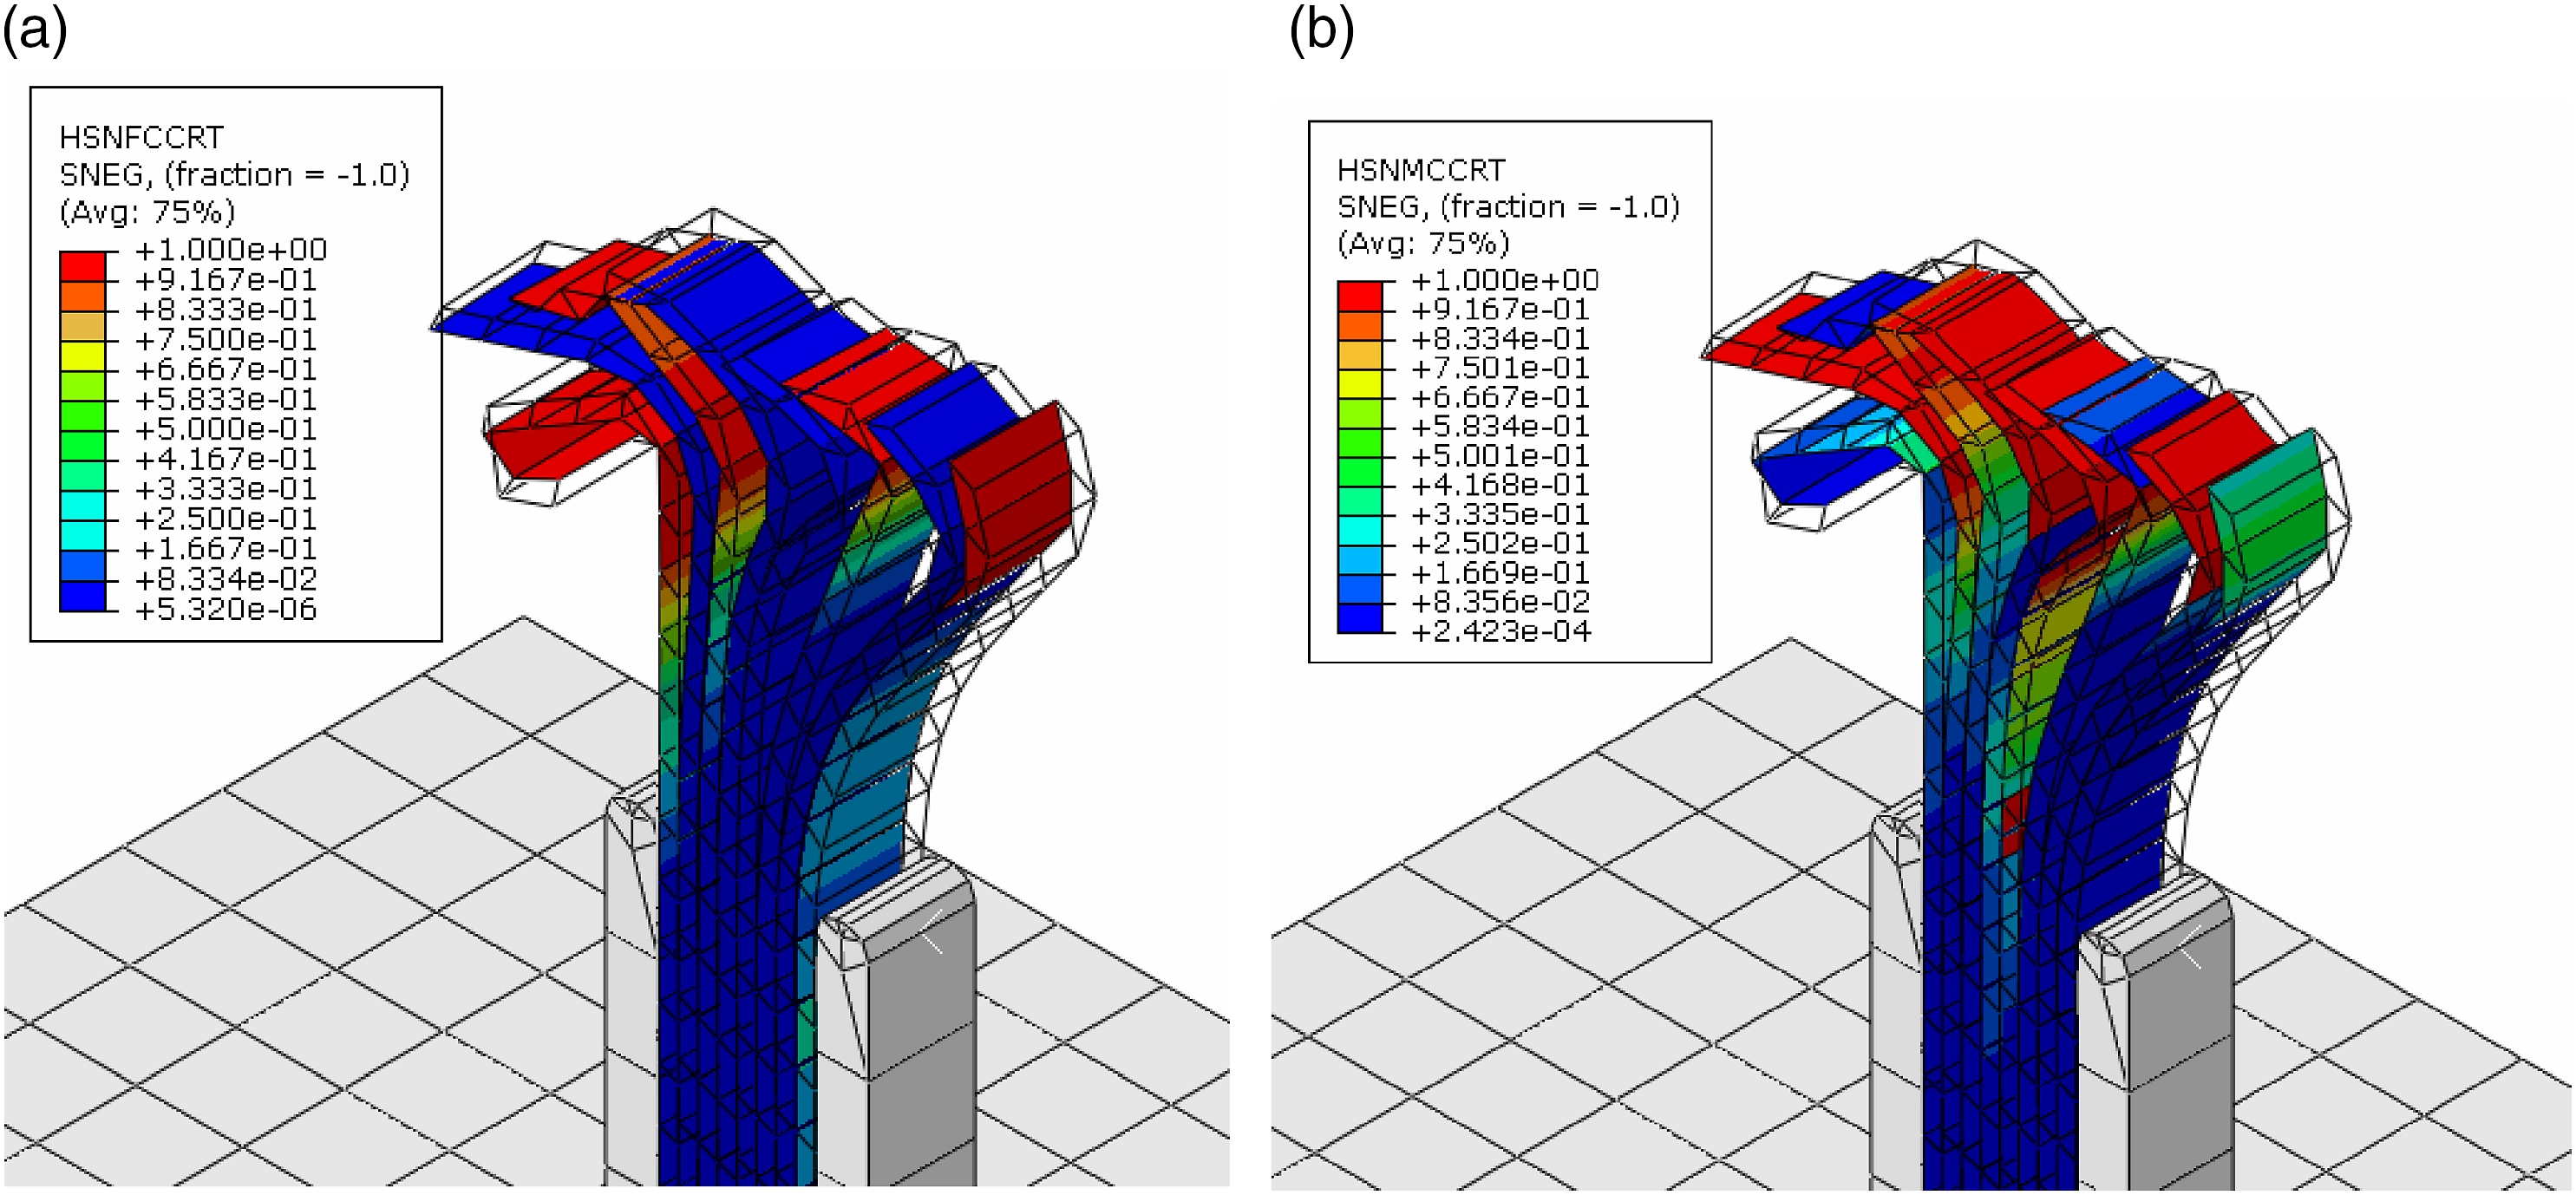
The model is also successful to demonstrate the failure mechanisms accurately when compared with the actual tests (see Figure 15). The numerical model can predict the specimen behaviour consistently during the crushing process. In third row of the Figure 15, delamination growth is also presented step by step which is also consistent with the actual propagation. The in-plane damages occurred inside the flat plate specimen at the end of the crushing process are given in the Figure 16. Model shows the fiber failure in 0-degree plies while matrix failure is formed in 90-degree plies. Comparison of experimental and numerical analysis of progressive damage of [0/90]2s plates: Test photos (top), front view of propagation of crush (middle), isometric view of numerical model and delamination growth (bottom). In-plane failures in [0/90]2s flat plate after 2 mm crash: Fibre failure (left), matrix failure (right).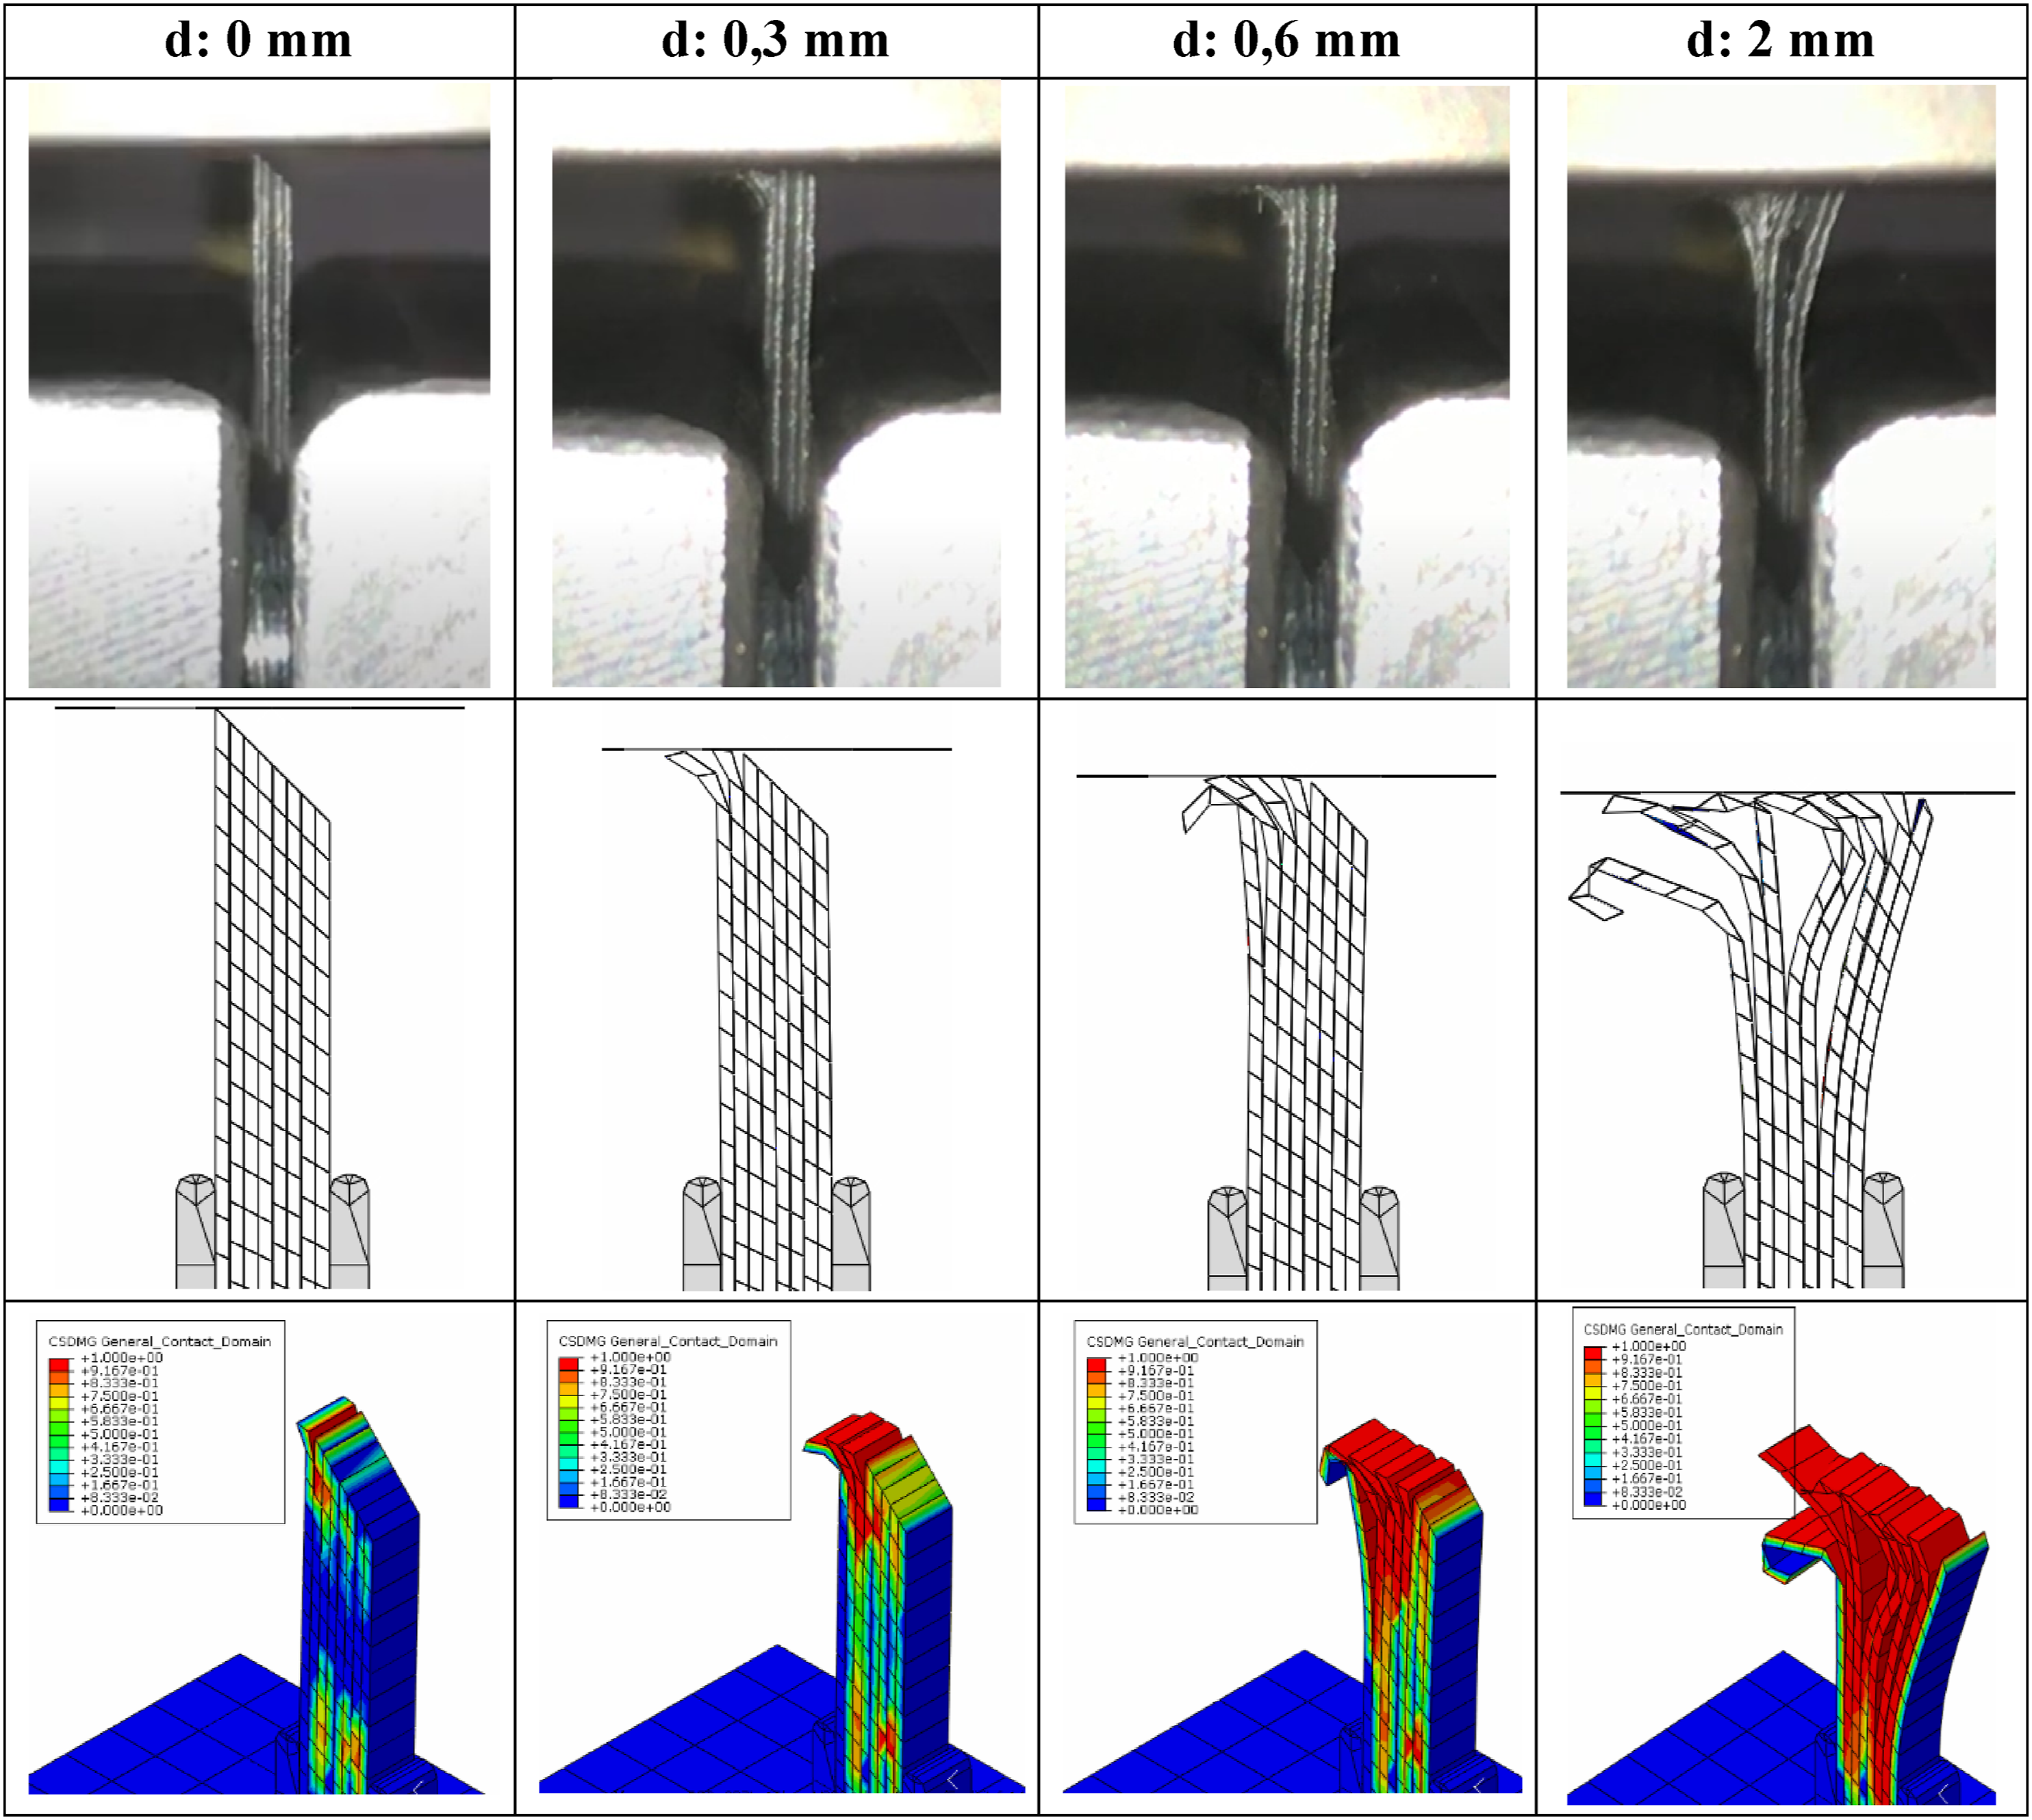
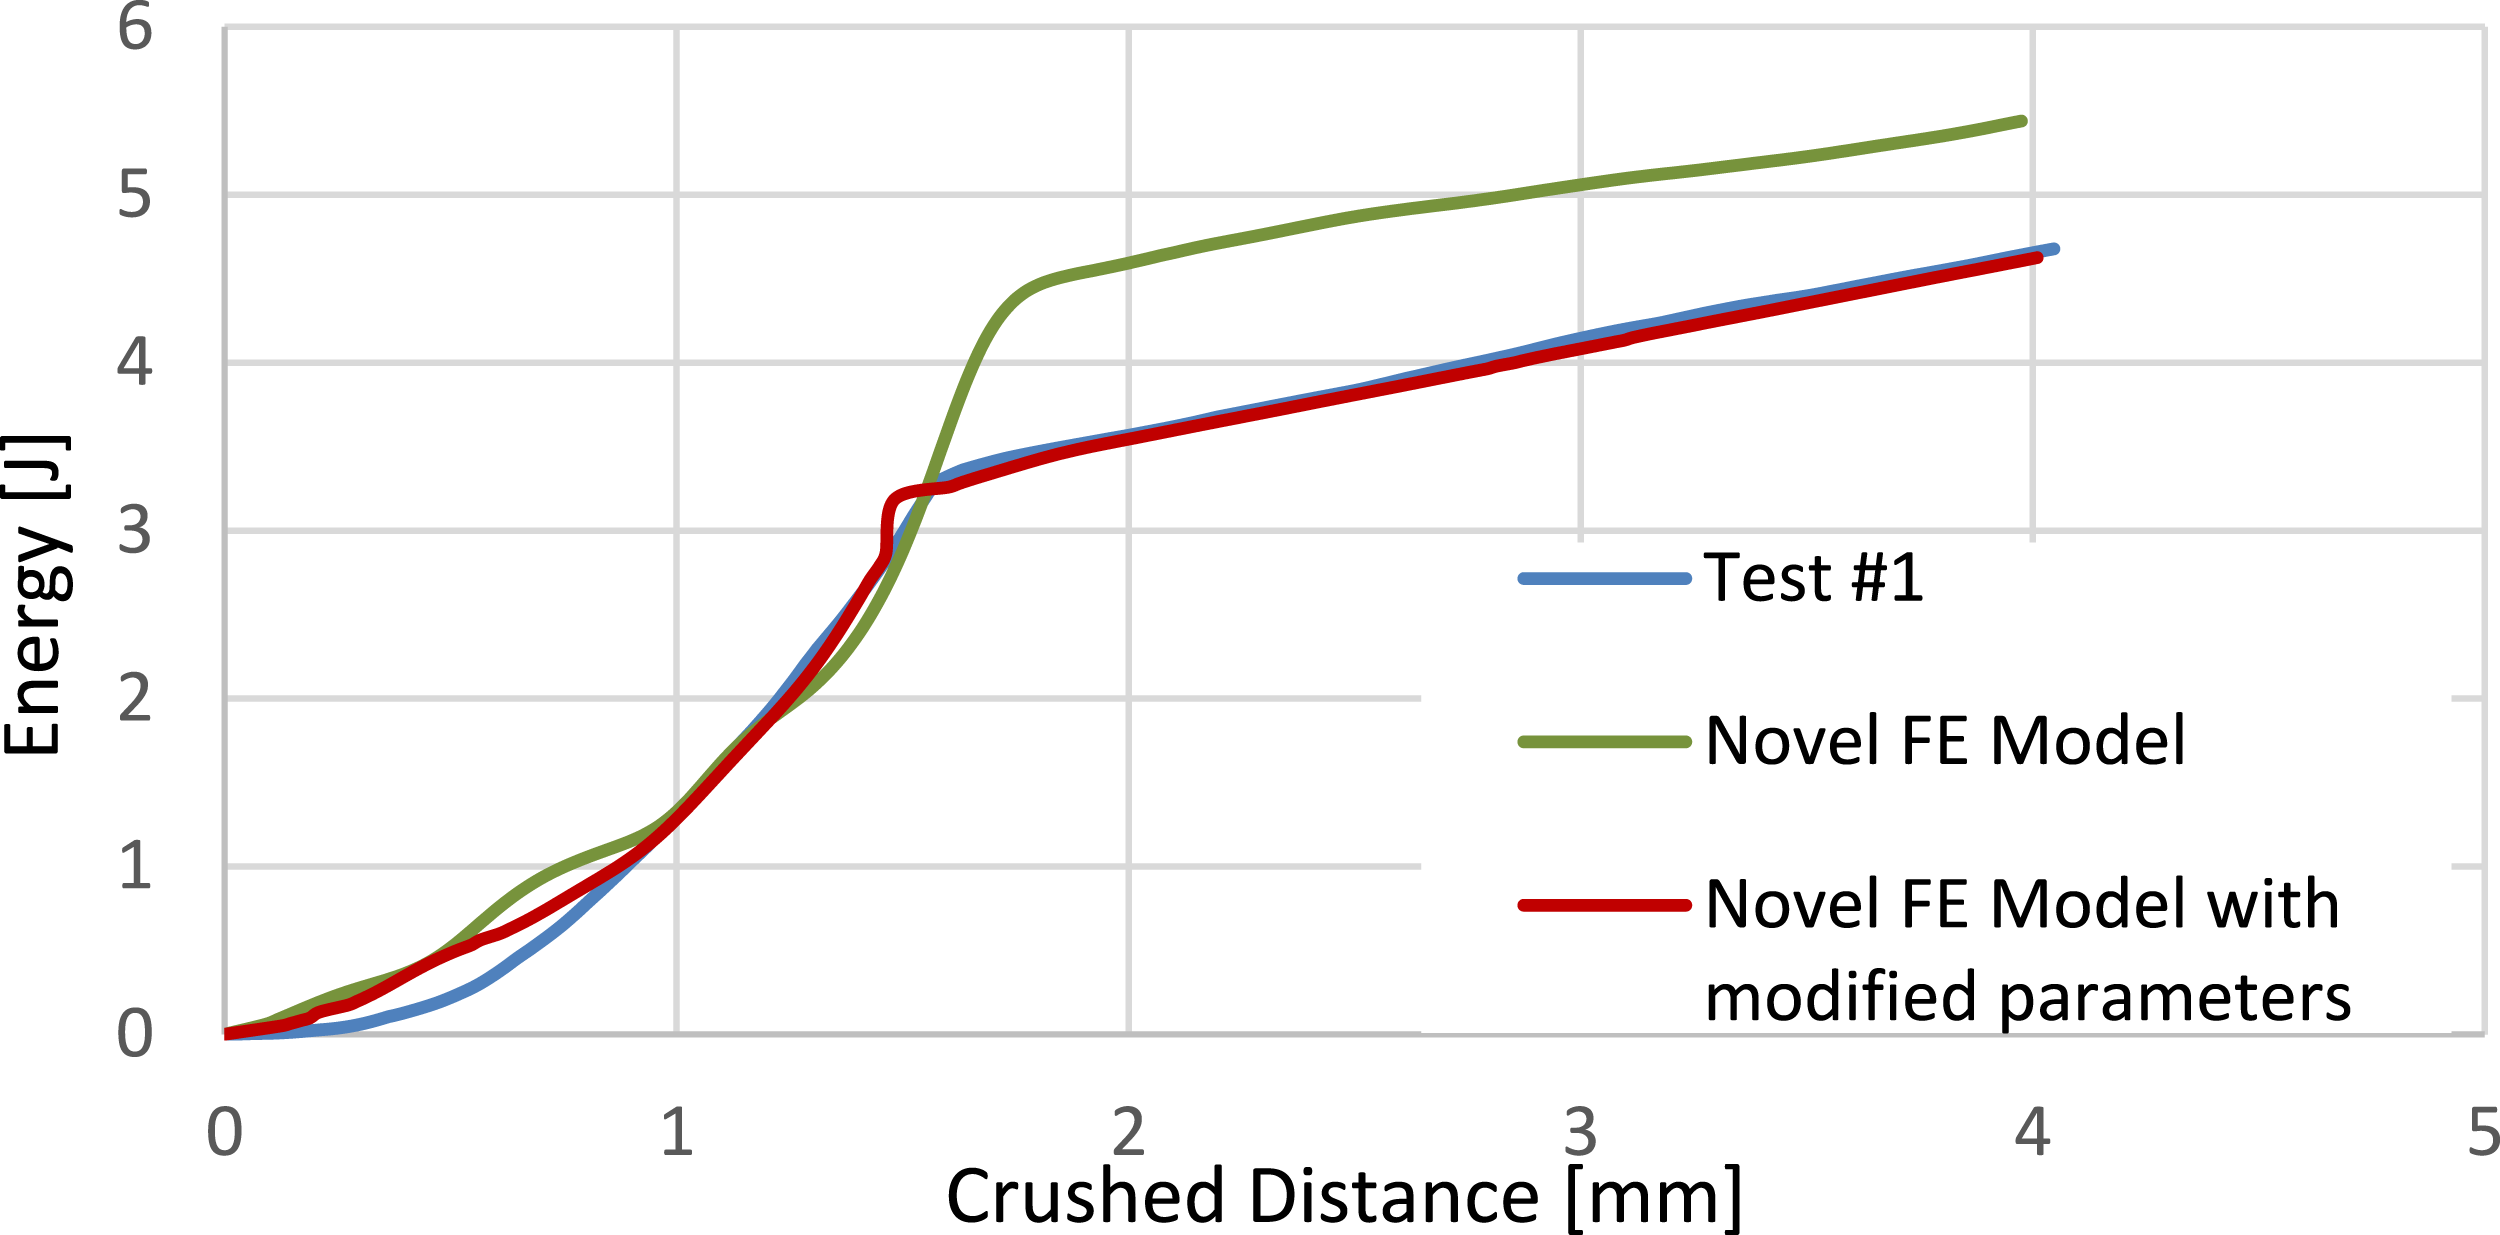
The results obtained from the novel numerical model applied to the 8-ply specimen are demonstrated in Figure 17. As can be seen from the figure, experimental data are compared with the results of two novel FE models (with and without parametric adjustments). It should be noted that, for a clear comparison, SAE filter with 180 Hz frequency cut-off is applied to the numerical results of the novel approach which reduces the numerical noise occurred due to the explicit analysis.
37
Without any parametric adjustments, FEA model with 3 interfaces shows no consistency with the test curve and the value of absorbed energy at the end of the crushing process is much higher than the test data as can be seen from Figure 18. After adjusting the parameters (increasing interlaminar properties and decreasing in-plane properties), a good agreement in terms of load–displacement curves and the energy values between the model and test is achieved. Load–displacement curves of the novel approach and comparison with the test data for [0/90]2s specimen. Energy results of the novel approach and comparison with the test data for [0/90]2s specimen.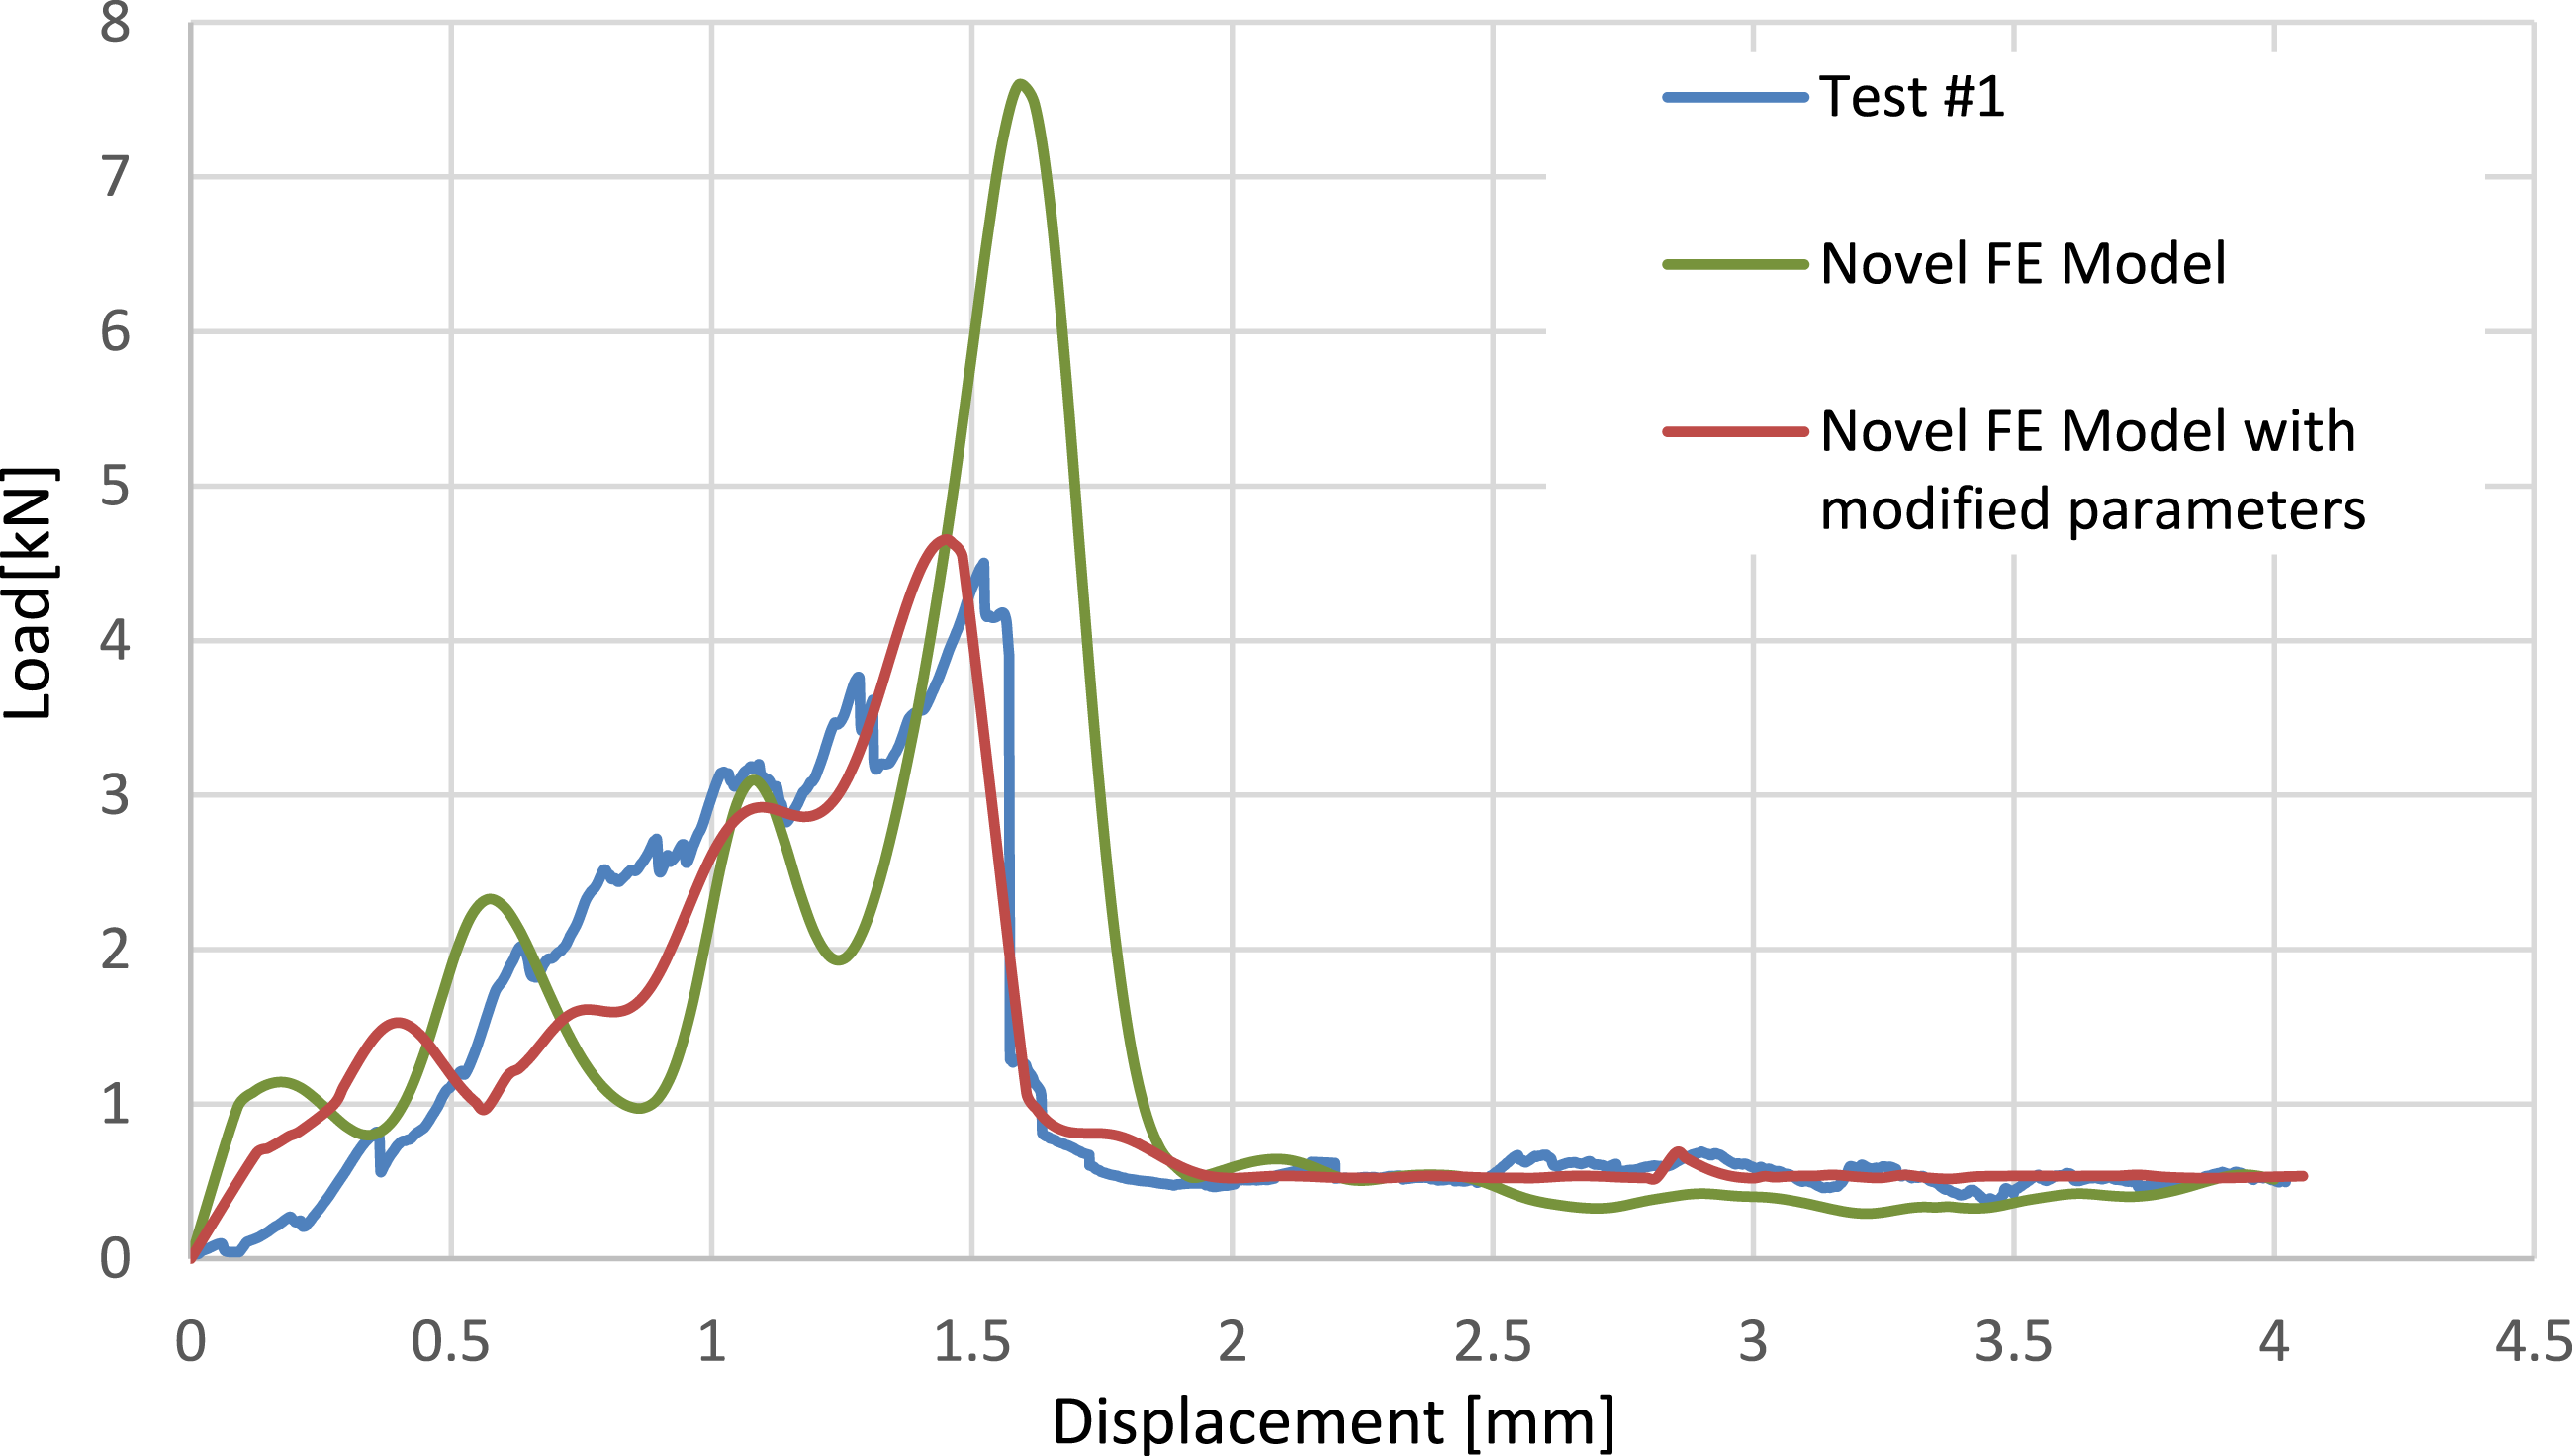
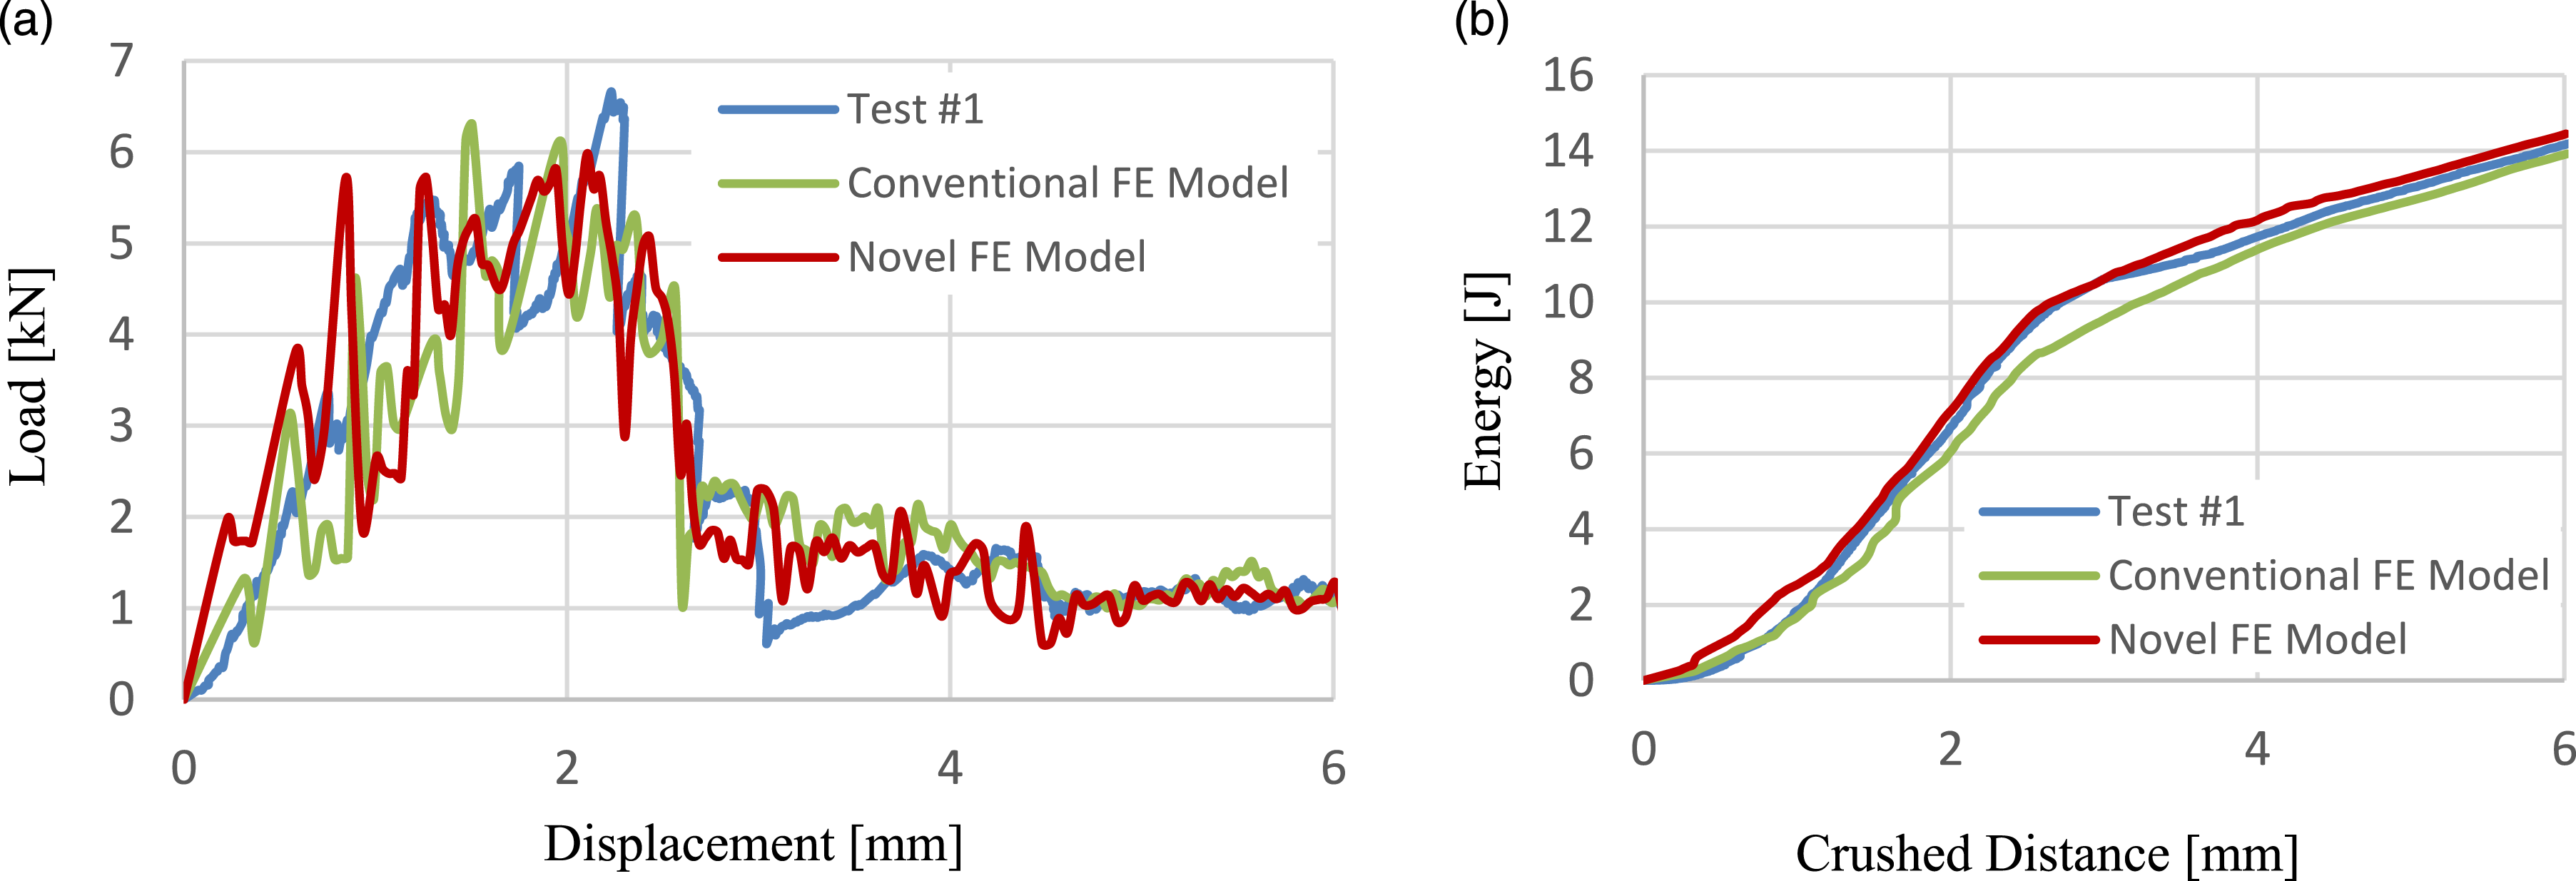
To test the applicability of the novel numerical approach to thicker specimens, same process is applied for specimens with 12 and 16 plies. Same parametric adjustments are applied, and it can be said from the Figure 19, the numerical results for 12-ply specimen also show good agreement with the test data in terms of both load and energy trends. Figure 20 compares load–displacement and energy curves of 16-ply specimen obtained from numerical analyses with the experimental data. The overall trends of novel numerical approach can be accepted as consistent with conventional model and the test data. Comparison of 12-ply [0/90]3s plate model results with experimental tests in terms of load–displacement (left) and absorbed energy curves (right). Comparison of 16-ply [0/90]4s plate model results with experimental tests in terms of load–displacement (left) and absorbed energy curves (right).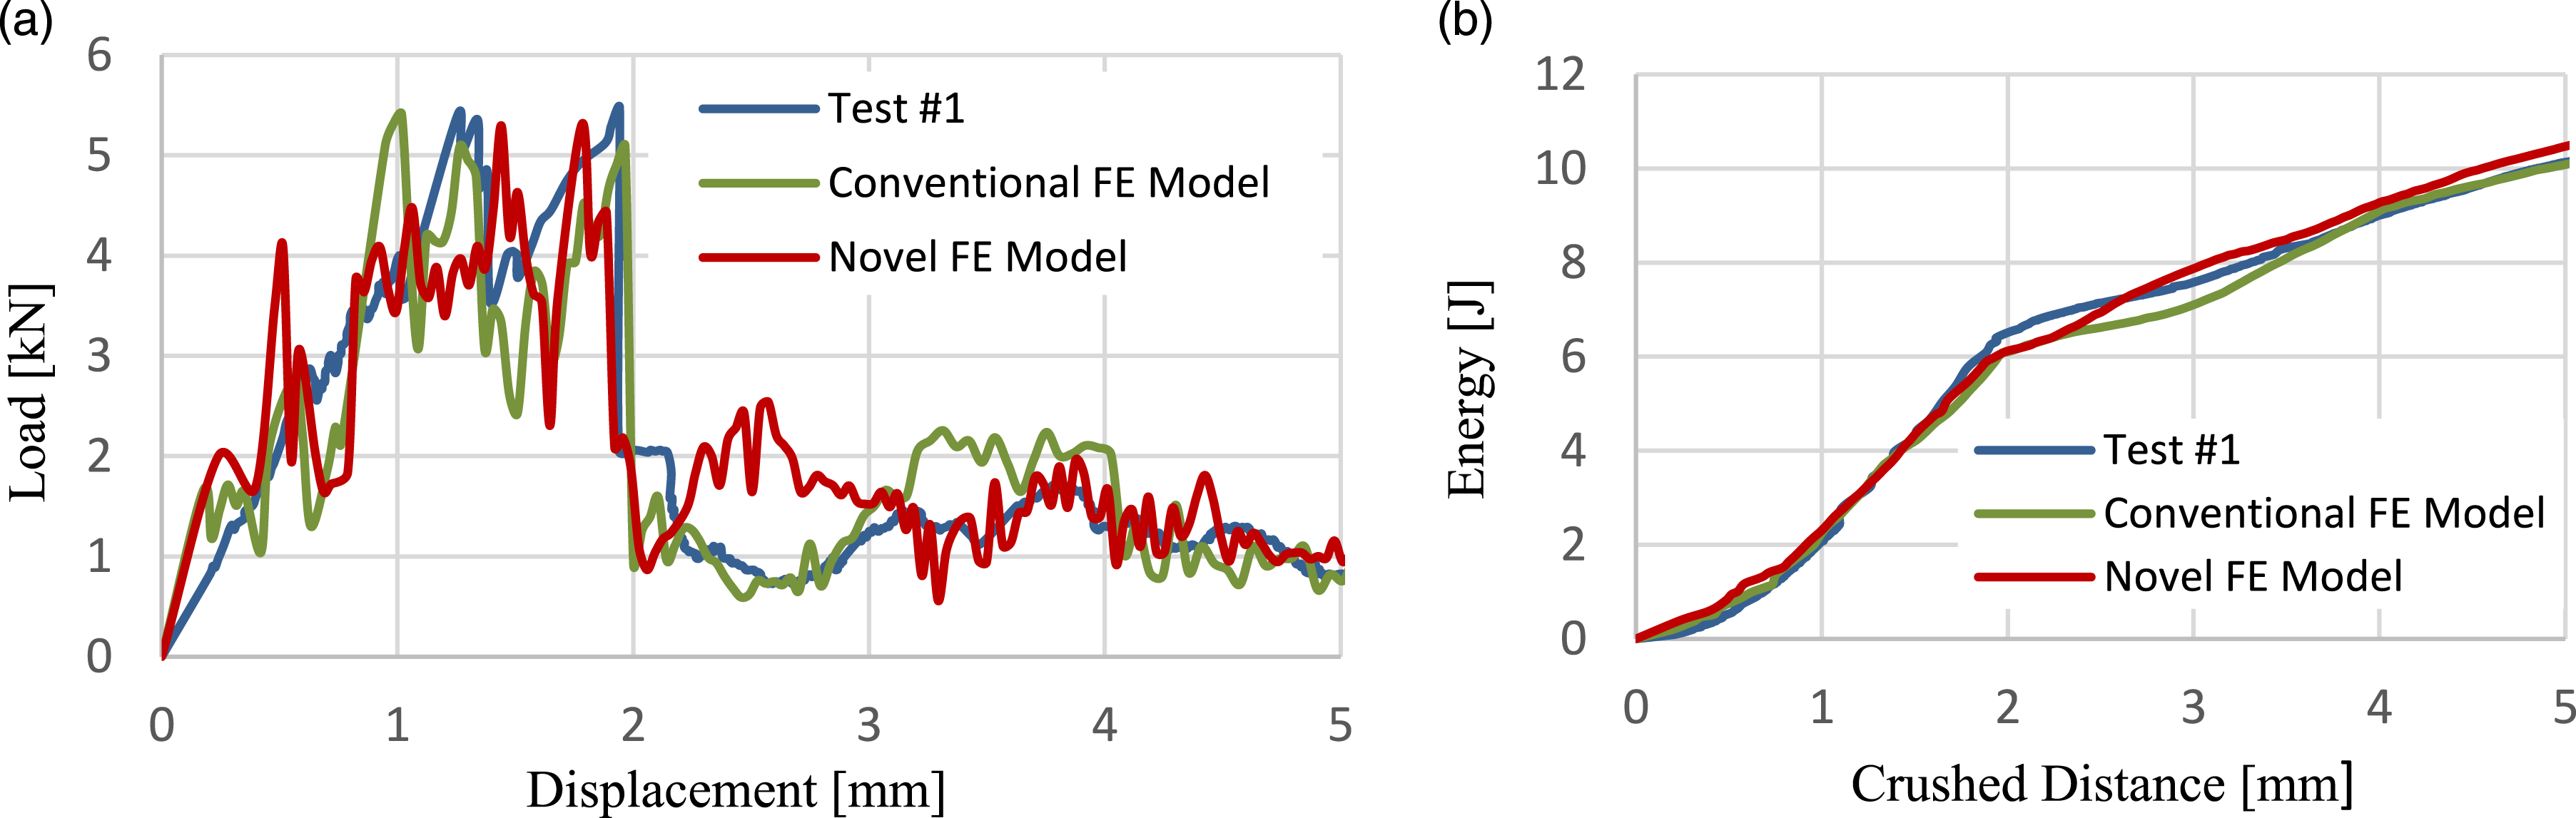
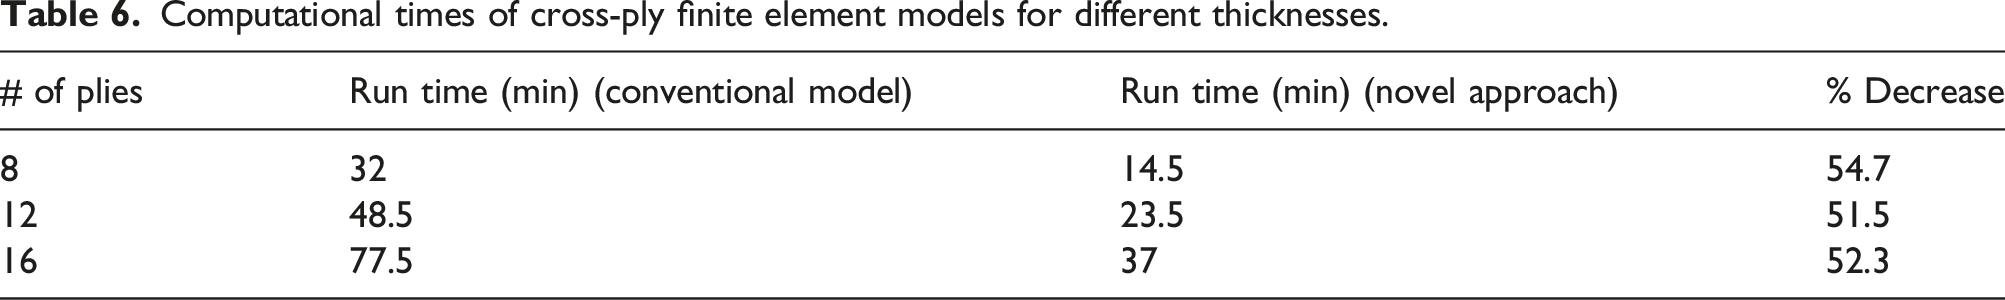
Computational times of cross-ply finite element models for different thicknesses.
The novel numerical approach is validated by applying the same procedure to the [0/45/0/−45]s flat coupon plates which is significant to understand the applicability of the model to composite plates having various stacking sequences. Figure 21 presents the comparison of load–displacement and energy curves of [0/45/0/−45]s specimen among experimental data, conventional FE model and novel FE model results. Results clearly show that, for the model with 3-interface, doubling interlaminar properties and decreasing in-plane parameters according to the bending energy results can estimate SEA values consistently in shorter amount of time when compared to conventional 7-interface FE models. Comparison of [0/45/0/−45]s plate model results with experimental tests in terms of load–displacement (left) and absorbed energy curves (right).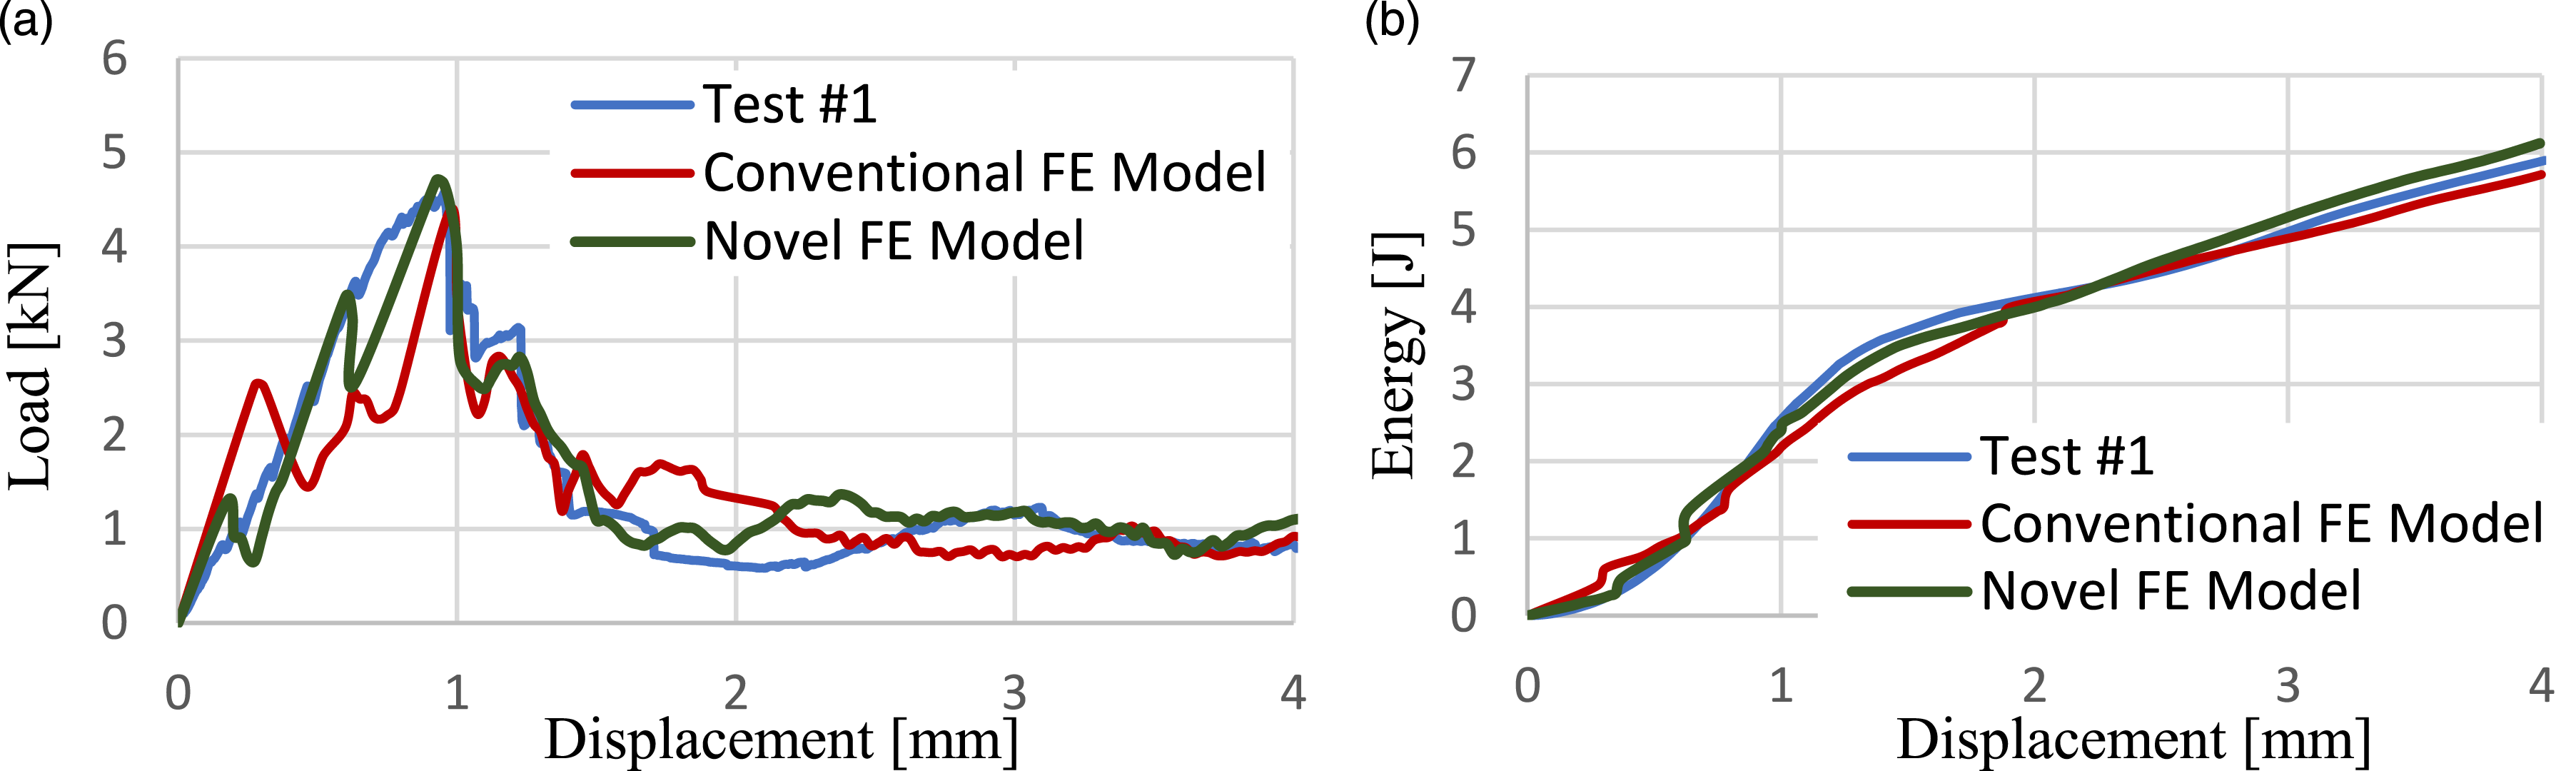
Conclusion
This paper presents the both experimental and numerical investigations for the crushing process of AS4/8552 flat coupon plates with lay-ups of [0/90]2s, [0/90]3s, [0/90]4s, [0/45/0/−45]s. A comprehensive understanding of the failure mechanisms taking place during the crush event is achieved. The overall understanding compiled from experimental study is that the length of the interlaminar crack indicates the failure mode that can be either splaying or fragmentation. In a cross-ply specimen, while outer 0-degree plies have higher tendency to bend which creates splaying mode, fragmentation mode is observed mostly due to the matrix cracks in 90-degree plies. For [0/45/0/−45]s plate, more fibre breakages in 45-degree plies observed and this increases the energy absorption capability.
The main objective of this study was to develop a numerical approach by which energy absorption capabilities can be estimated in shorter run times. With the novel modelling idea of creating sub-laminates, this objective is accomplished, and the computational time is decreased by more than 50% for flat plate models. Moreover, by applying same approach to the [0/45/0/−45]s plates, validity of the model for different stacking sequences is also demonstrated.
Footnotes
Declaration of conflicting interests
The author(s) declared no potential conflicts of interest with respect to the research, authorship, and/or publication of this article.
Funding
The author(s) disclosed receipt of the following financial support for the research, authorship, and/or publication of this article: This study is supported by Boğaziçi University Research Fund (BAP Project no: 17621D).