
Abstract
Automated Fiber Placement (AFP) is a widely used production process for the manufacturing of large scale CFRP parts. However, the occurrence of manufacturing defects such as gaps or overlaps is still a common problem in today’s AFP production environments. This study investigates the effect of different defect configurations on the mechanical performance (i.e., tensile strength, flexural strength, and shear strength) of AFP laminates. The results are then linked to the data generated “inline” by a ply inspection system. We use the Pearson correlation in order to relate the measured defect volume to the strength of samples containing different types of defects. A clear knockdown in tensile strength was found for specimens with gaps or overlaps that caused a high amount of fiber undulations in the laminate. The sensor data analysis showed a similar trend. Specimens with a high defect volume had significantly lower values for the tensile strength. A correlation coefficient of −0.98 between these two values was calculated. The obtained results are a promising step towards automated quality inspection for the AFP process.
Introduction
Automated manufacturing processes allow for the efficient and reliable production of CFRP parts in highly demanding aerospace applications. One of the most common technologies is Automated Fiber Placement (AFP). In this process, a laminate is being manufactured by a placement head that lays down narrow tapes of unidirectional prepreg material onto a mold surface with the desired part geometry. Each tape can be cut individually which allows for a lay-up close to the desired ply contour leading to only very little material scrap. 1 Automated fiber placement is a fully established process that is widely used for the industrial serial production of aerospace parts. However, the occurrence of manufacturing defects still presents a significant problem in today’s part production. 2 The probability of a certain defect to arise depends on a variety of conditions such as material and process parameters, the complexity of the manufactured part or steered fibers. Furthermore, defects can result from factors like tolerances in the fiber placement head movement or variation of the tow width.3,4 For this reason, it is the current industry standard to manually inspect every ply after deposition.5,6 This manual inspection step is time consuming and prone to human error. In order to increase efficiency during production the industry is currently developing automated solutions to replace the manual inspection step. 2
A variety of inspection systems using different measuring principles has been presented over the past years. However, most of the systems that are available on the market today employ the laser line triangulation principle for capturing the part surface. 7 Such systems are offered directly by AFP machine manufacturers but also by third party developers either for upgrading an existing machine or as stand-alone solution.2,8–10 Another approach for the online determination of part quality in AFP is the detection of temperature differences on the laminate surface due to the presence of defects. A monitoring system that detects defects by measuring the temperature distribution of the tapes directly after placement has been demonstrated by Denkena, Schmidt et al.11,12 However, the use of laser profilometers, that is, laser line triangulation, offers certain advantages over thermal imaging. Via laser line triangulation a very precise image of the surface topography of the part can be generated. Possible defects like gaps or overlaps can be exactly localized on the part. In addition, the width, length, and depth of a defect can be determined within a range of a few micrometers, which is not possible with thermal imaging. This precision enables the exact detection, quantification, and documentation of defects that arose during production. The effect of those imperfections on the laminate quality and consequently on the mechanical performance of a part has been investigated by several authors in the past.
Sawicki and Minguet 13 examined the effects of defects on the compressive strength of laminates. Three different laminate designs were used. All stacking sequences contained a combined gap and overlap defect in each of its 90° plies. Strength reductions of 5–27% were observed in laminates containing at least one overlap or gap of 0.03 inch width. They also observed that wider defects did not lead to further reductions of strength. Finite element analysis and follow-up experiments determined that failure was most likely driven by interaction of in-plane compression and interlaminar shear stresses in the wavy 0° plies.
Croft et al. investigated the influence of gaps, overlaps, twisted tows and half gaps/overlaps on the mechanical performance of specimens under different types of loading. 14 Tests were carried out to examine the behavior at lamina level (tension, compression, in-plane shear) and at laminate level (open hole tension, open hole compression). Defects have been placed in the middle layers of a symmetric and balanced laminate. The results of the tension and compression tests showed that the ultimate strength hardly decreased by the defects. Overlaps in fiber direction even led to an increase of compressive strength. The in-plane shear tests showed that specimens embedded with an overlap orthogonal to the load direction had a 12% lower performance than the reference specimens. Samples with gaps yielded a higher shear strength than the pristine ones. The results obtained during the OHT test demonstrated an almost negligible effect of defects at laminate level. In contrast the OHC showed a strong dependency of the ultimate strength on the defect orientation. While laminates with defects orthogonal to the load direction yielded a decrease of the compression strength, laminates with defects parallel to the load direction showed an increase.
In the study by Lan et al. 15 the influence of isolated gaps and overlaps on the tensile, compressive and in-plane shear properties of a laminate were examined. In addition, the use of a caul plate during autoclave curing has been investigated. The study showed that different type and sizes of defects can have very diverging de- and increasing effects on the mechanical properties of a laminate. For instance, the presence of gaps led to a knockdown in compressive strength of up to 12%. However, Lan et al. also found that the superposition of plies with the same orientation allow partial healing of gaps and overlaps during curing. Furthermore, it was shown that the usage of a caul plate mostly reduces the defects influences significantly and in some cases even completely.
Elsherbini et al. investigated the effect of gaps normal to fibers on tension-tension fatigue behavior. 3 Therefore, laminates with a gap of ⅛ inch along the length and ¼ inch across the width were used for fatigue tests. In addition to the experimental work a fatigue progressive damage model was developed. It showed good agreement with the experimental results in predicting both damage evolution and fatigue life at different applied maximum stresses. The authors found that the effect of gaps depends on the maximum applied stress during fatigue. As the maximum applied stress in the fatigue cycles increases, the effect of gap becomes more severe. However, at lower stresses, this effect diminishes.
In the work by Guin et al. the effects of tow-to-tow gaps were examined. Laminates with gaps in each ply were compared to samples with gaps only in the 90° plies and pristine samples. 16 The strength of the specimens with gaps in each ply decreased for all tests that have been carried out (tension, compression, open hole compression). The laminates with defects in the 90° plies did not show a decline in strength. Guin et al. explain this with the existence of defect free plies with the consequence that the fiber waviness induced by a gap can be confined by the adjacent tows. The authors conclude that in cases were declines of mechanical performances are observed, fiber waviness seems to be the main cause.
Woigk et al. 17 focused on the relation between the failure mode and level of ply waviness caused by a defect. For tension and compression tests defects were introduced in the ±45° and the 90° plies in order to cause out-of-plane wrinkling. It can be seen that neither the isolated gaps or overlaps nor the staggered gaps configuration led to a significant knockdown in tensile or compressive strength. Specimens with an embedded overlap yielded an increase of tension and compression strength. In contrast, the combination of gaps and overlaps led to a strong decrease in mechanical performance. Woigk et al. assume that it is the severity of fiber misalignment that has a stronger influence on the mechanical properties than the actual number of defects.
Zenker et al. focused on thermoplastic material and investigated the effects of triangle gaps and overlaps on laminate quality and mechanical performance for different consolidation processes. It can be seen that gaps lead to a reduction of strength in tensile and compressive testing for variothermal press and autoclave consolidation. Specimen containing overlaps generally show a better performance in terms of ultimate strength compared to those containing gaps. 18
In addition to the experimental studies described above, other studies have been presented in the last years that have focused on the modeling and simulation of AFP induced defects.19–21
The general conclusion that can be drawn from literature is that the mechanical knockdown of an AFP laminate results mainly from the induced fiber waviness. The amount of defects by itself is therefore not sufficient to anticipate the possible reduction of mechanical performance. This phenomenon was also described for structures other than AFP laminates. Mierzwa et al. investigated the impact of yarn gaps on the mechanical performance of braided samples. They observed a knockdown of mechanical performance mainly for defect configurations that lead to undulations of the load bearing yarns. 22
In this study we show how defects in the production of AFP laminates, namely gaps and overlaps, affect the tensile strength, flexural strength and shear strength of AFP laminates. Furthermore, we present a new approach to capture the defects during production by a ply inspection system. For this purpose, we manufactured samples with intentionally introduced defects and used a laser sensor system to measure the defects. Mechanical testing and micrographs enabled us to determine the effect of these defect configurations on the fiber waviness and the mechanical performance of the final laminate. Finally, a correlation between the defect measurements generated with the laser sensor system and the tensile strength was established.
Experimental method
Specimen design
We used HexPly 8552 unidirectional prepreg slit tapes with IM7 carbon fibers to manufacture the samples for this study. The slit tapes had a width of 1/8 inch. With a fiber areal weight of 134 g/m2 and a resin content of 33 wt%, a cured ply thickness of 125 μm is obtained.
Two different stacking sequences for the samples were defined. Specimens that were used for tension and 3-point-bending tests had a [+452/-452/02/902]S quasi-isotropic lay-up. With this laminate design two plies of the same fiber orientation act as one ply with doubled thickness. This stacking sequence was chosen in order to achieve delamination dominated failure, since the ply thickness has a substantial influence on the failure mode of the material.17,23 We investigated several defect configurations with this laminate. Gaps and overlaps were introduced into the 90° plies in order to achieve out-of-plane undulations of the neighboring 0° plies. The defects always had a width one slit tape, that is, 1/8 inch, and were positioned on top of each other. That means that entire slit tapes were either removed or added to the laminate in the respective plies. Staggering of the defects between the plies was not investigated. The laminates contained either two or four overlaps or gaps that were distributed symmetrical to the symmetry plane of the lay-up. In addition, pristine laminates were manufactured as baseline. Figure 1 shows the complete stacking of the laminates and the positioning of the defects for the different configurations. Stacking sequence and defect positions of the laminates for tension and bending tests.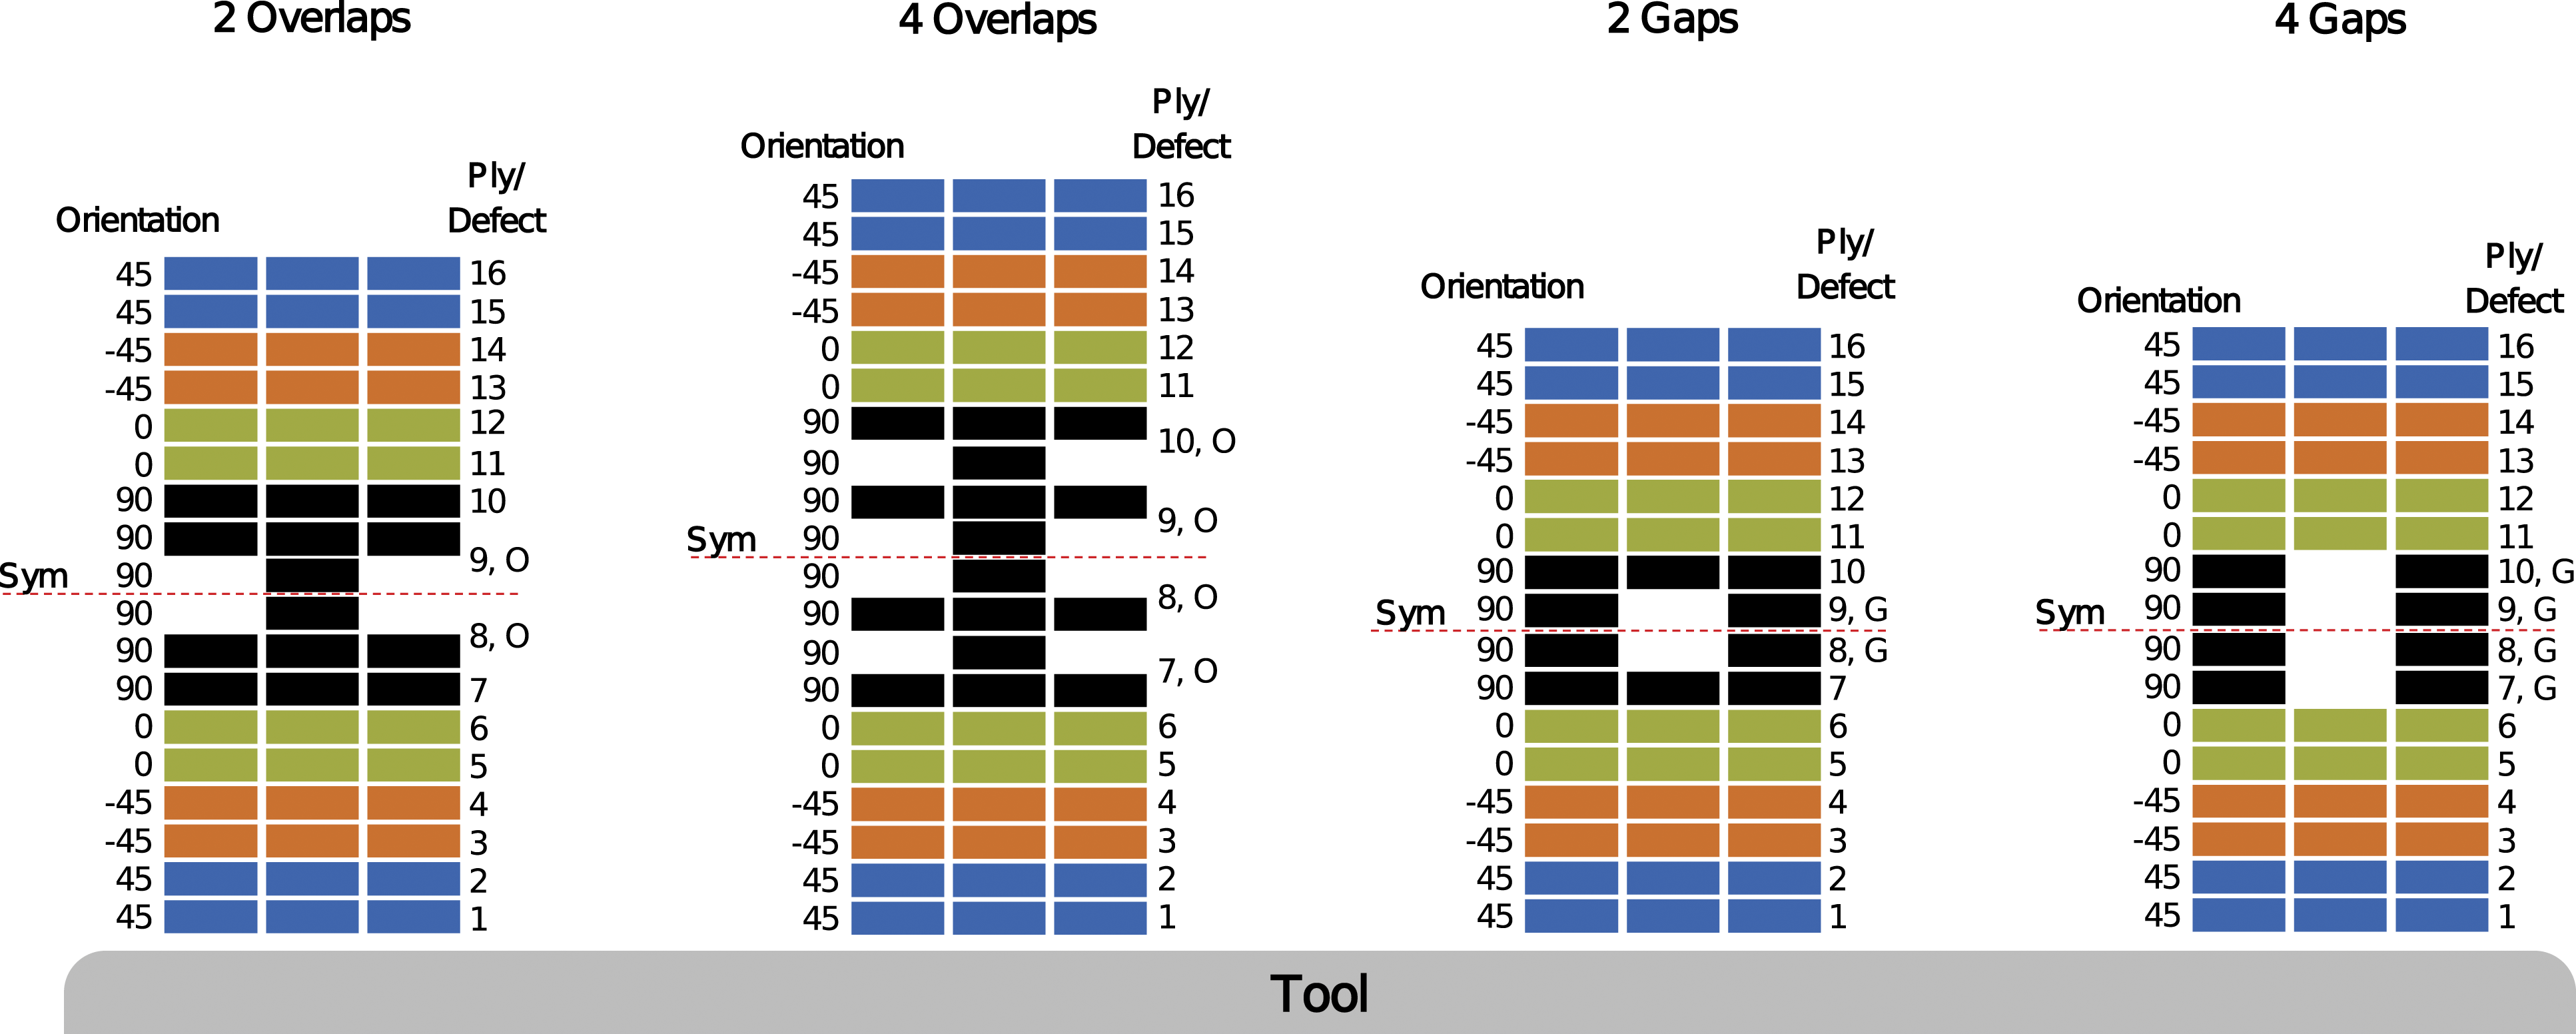
Furthermore, samples for conducting in-plane shear tests were made. Even though the in-plane shear performance is mainly dominated by properties on the ply level, we also expected to see an influence of the defects on the full laminate. Caused by the defects, the plies can be interrupted or deflected which weakens the entire laminate. Such effects of defects on the in-plane shear strength of laminates can also be seen in literature.14,15
For the determination of the in-plane shear properties we used the ±45° tension test method according to DIN EN ISO 14129. To obtain specimens with a thickness of 2 mm in accordance with the test standard, a stacking sequence of [+45/-45]4S was chosen. Four gaps or four overlaps were introduced in the −45° plies closest to the symmetry plane of the laminate. Again, we manufactured pristine samples as reference. The lay-ups with the two defect configurations can be seen in Figure 2. Stacking sequence and defect positions of the laminates for in-plane shear tests.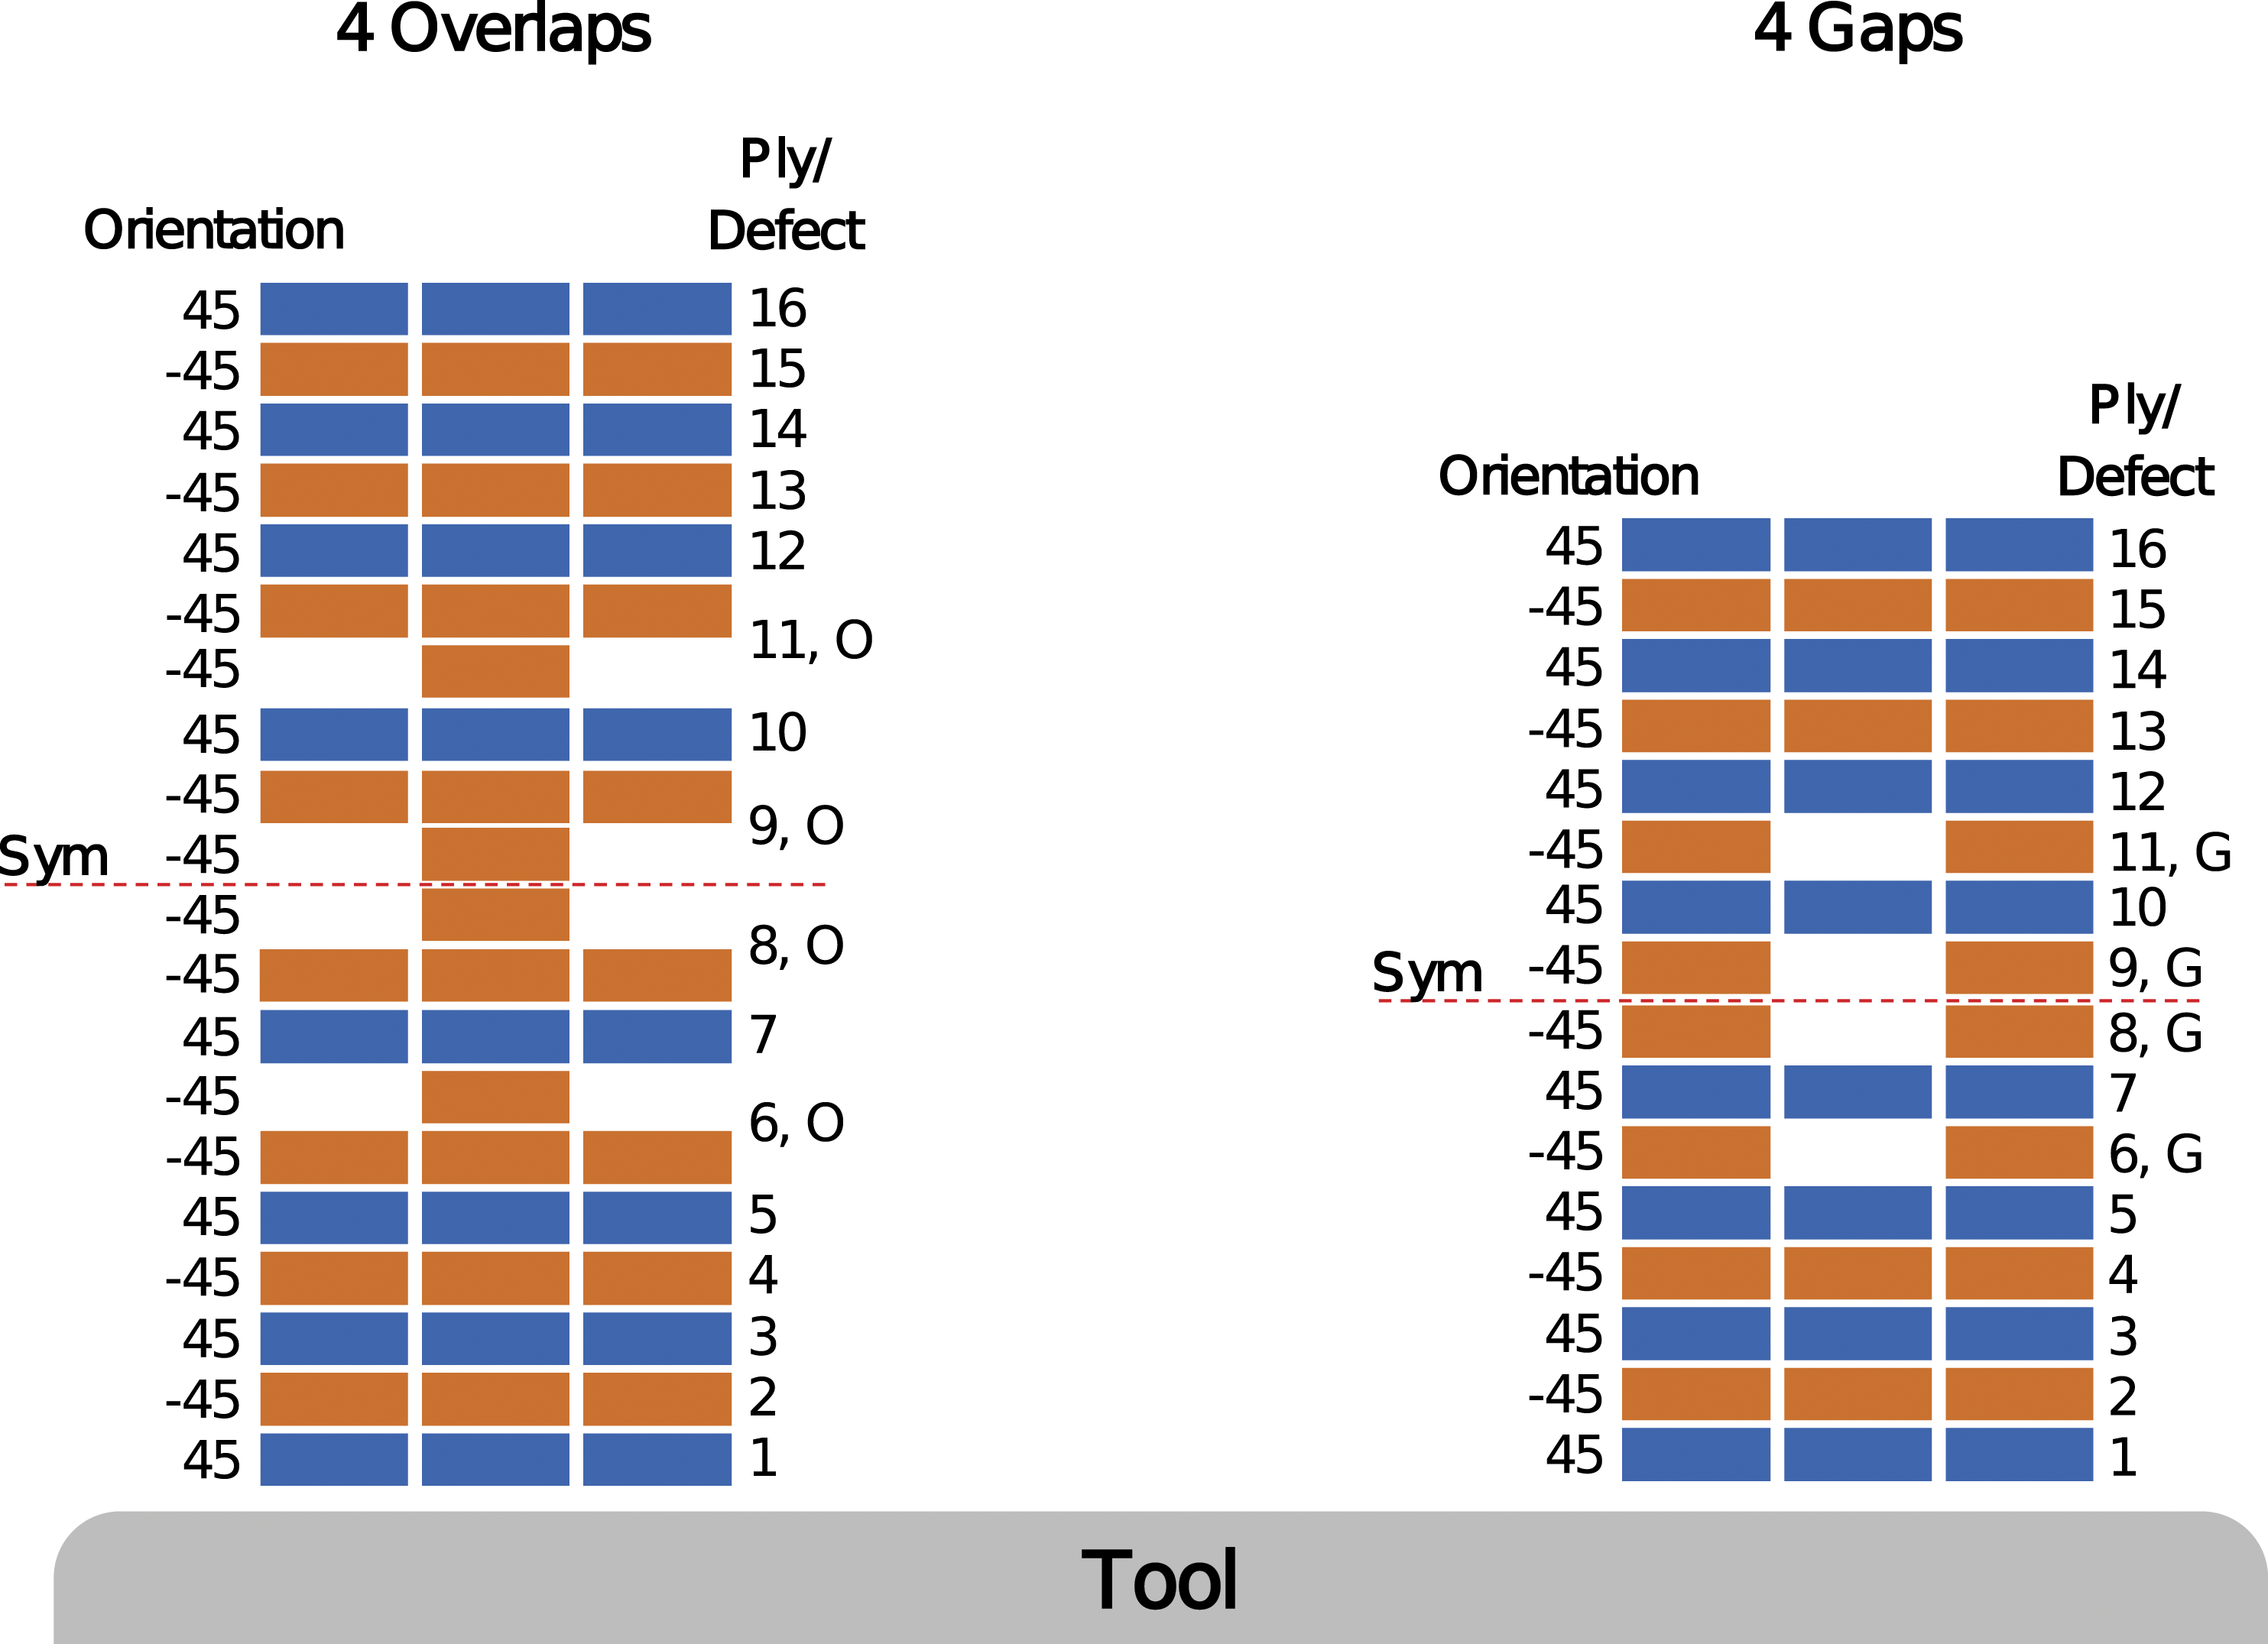
The defects described above are clearly more pronounced than typical defects due to positioning errors that are commonly found in the serial production of parts via AFP. However, in certain lay-up scenarios large defects with the size of one tape width or more can occur, for example, so-called “Triangle Gaps” at the contours where two sectors with different fiber orientations meet. 24 Furthermore, previous studies have shown that smaller defects might not lead to a significant difference in strength of the laminate.14,17 As the aim of this work is not only to determine the mechanical knockdown caused by the defects but also to link them to the laser sensor data, we chose to introduce comparatively large defects.
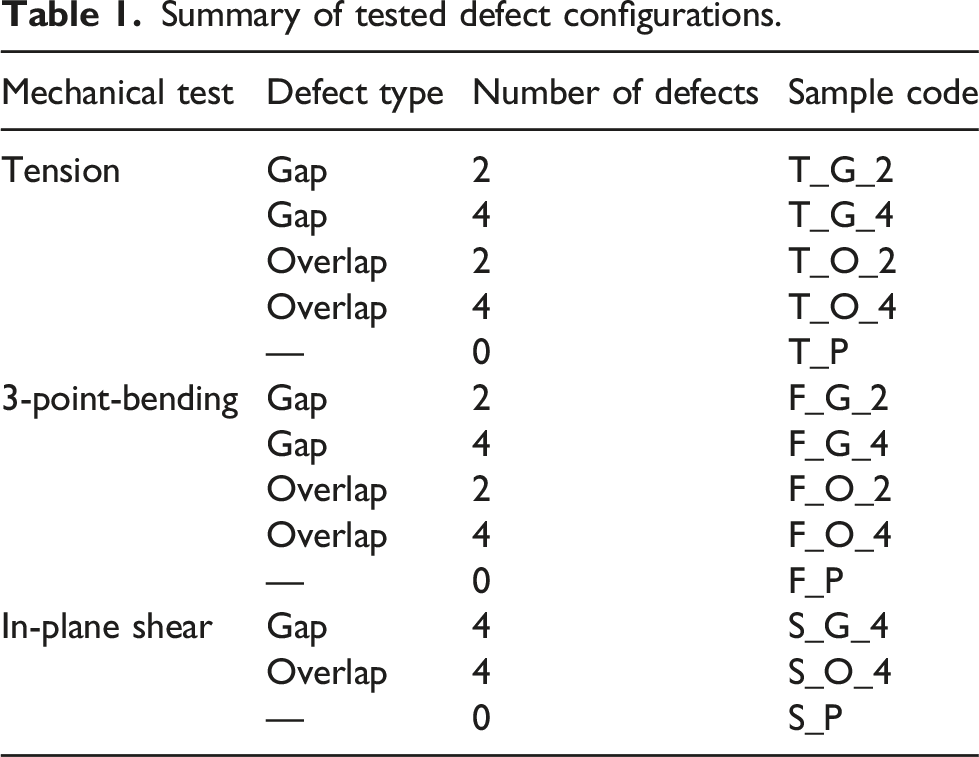
Summary of tested defect configurations.
Manufacturing procedure
We used an industrial AFP machine by Coriolis SAS to manufacture the samples for this study. The machine is capable of processing up to 8 individual tapes with a width of 1/8 inch. An infrared lamp with a maximum power of 430 W is used as heat source. During manufacturing, the compaction force was set to a constant value of 250 N. The specimens were laid-up on a flat aluminum tool that was mounted on a rotatable tool positioner. We manufactured individual laminates for each defect configuration. In the case of a laminate with gaps, the machine was programmed to leave out individual tapes in the desired location in the respective plies. In the case of an overlap configuration, we finished manufacturing the ply containing the defect. Subsequently, the machine placed an additional tape at the desired location in order to create the overlap. The compaction force was maintained at 250 N when placing the additional tape. No deformation of the tape during lay-up could be observed. A complete laminate containing overlaps after lay-up is shown in Figure 3. For the curing process vacuum bagging was applied and the laminates were cured in an industrial autoclave. No caul plate was used for curing. A curing cycle for monolithic components according to the product data sheet was used.
25
Complete laminate for specimens with defect configuration F_O_2 before curing.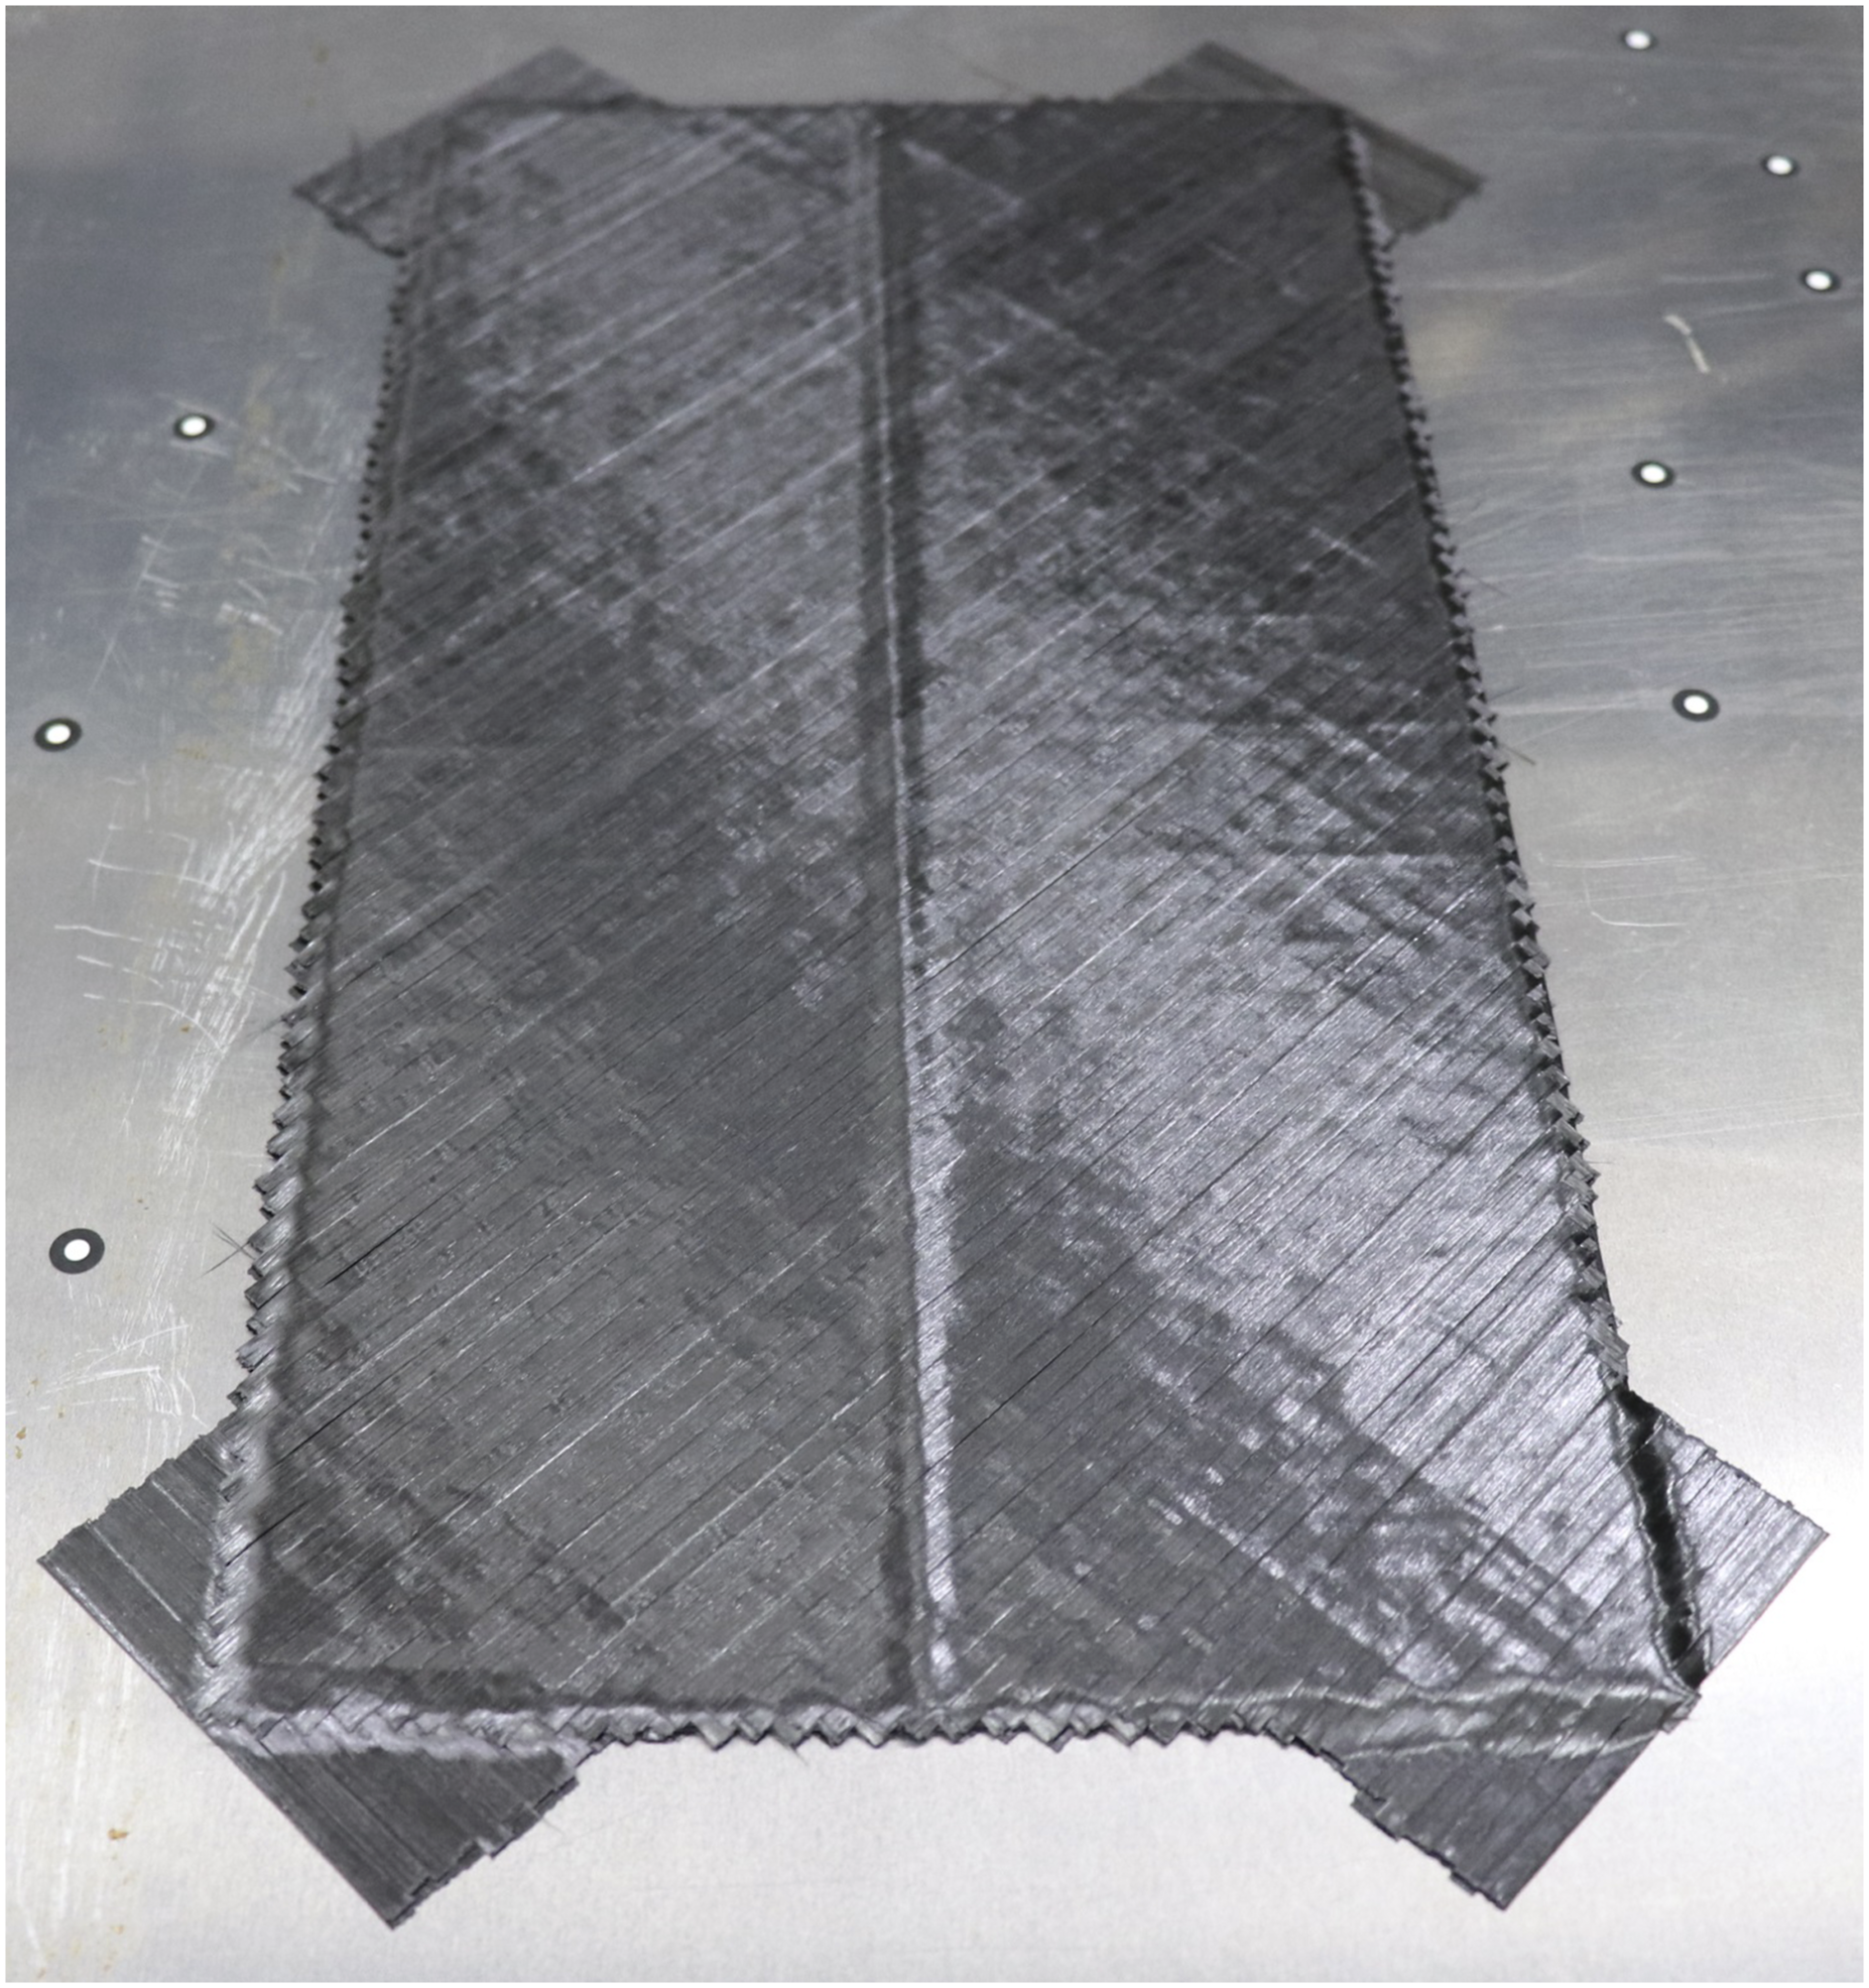
Process monitoring
A ply inspection system by InFactory Solutions GmbH was installed to the AFP machine in order to monitor the lay-up process. The system is integrated into the placement head and consists of a 3D scanner that measures the surface topography of the laminate via laser triangulation directly behind the nip point. The unit used in the inspection system is a C4-2040-GigE laser profilometer by Automation Technology GmbH. This profilometer captures 2048 pixels/profile with a sampling rate of up to 1 kHz. With the used setup a height resolution of up to 10 μm can be achieved. The fiber placement head with the integrated inspection system can be seen in Figure 4. 8 × 1/8 inch fiber placement head by Coriolis Composites with integrated ply inspection system by InFactory Solutions.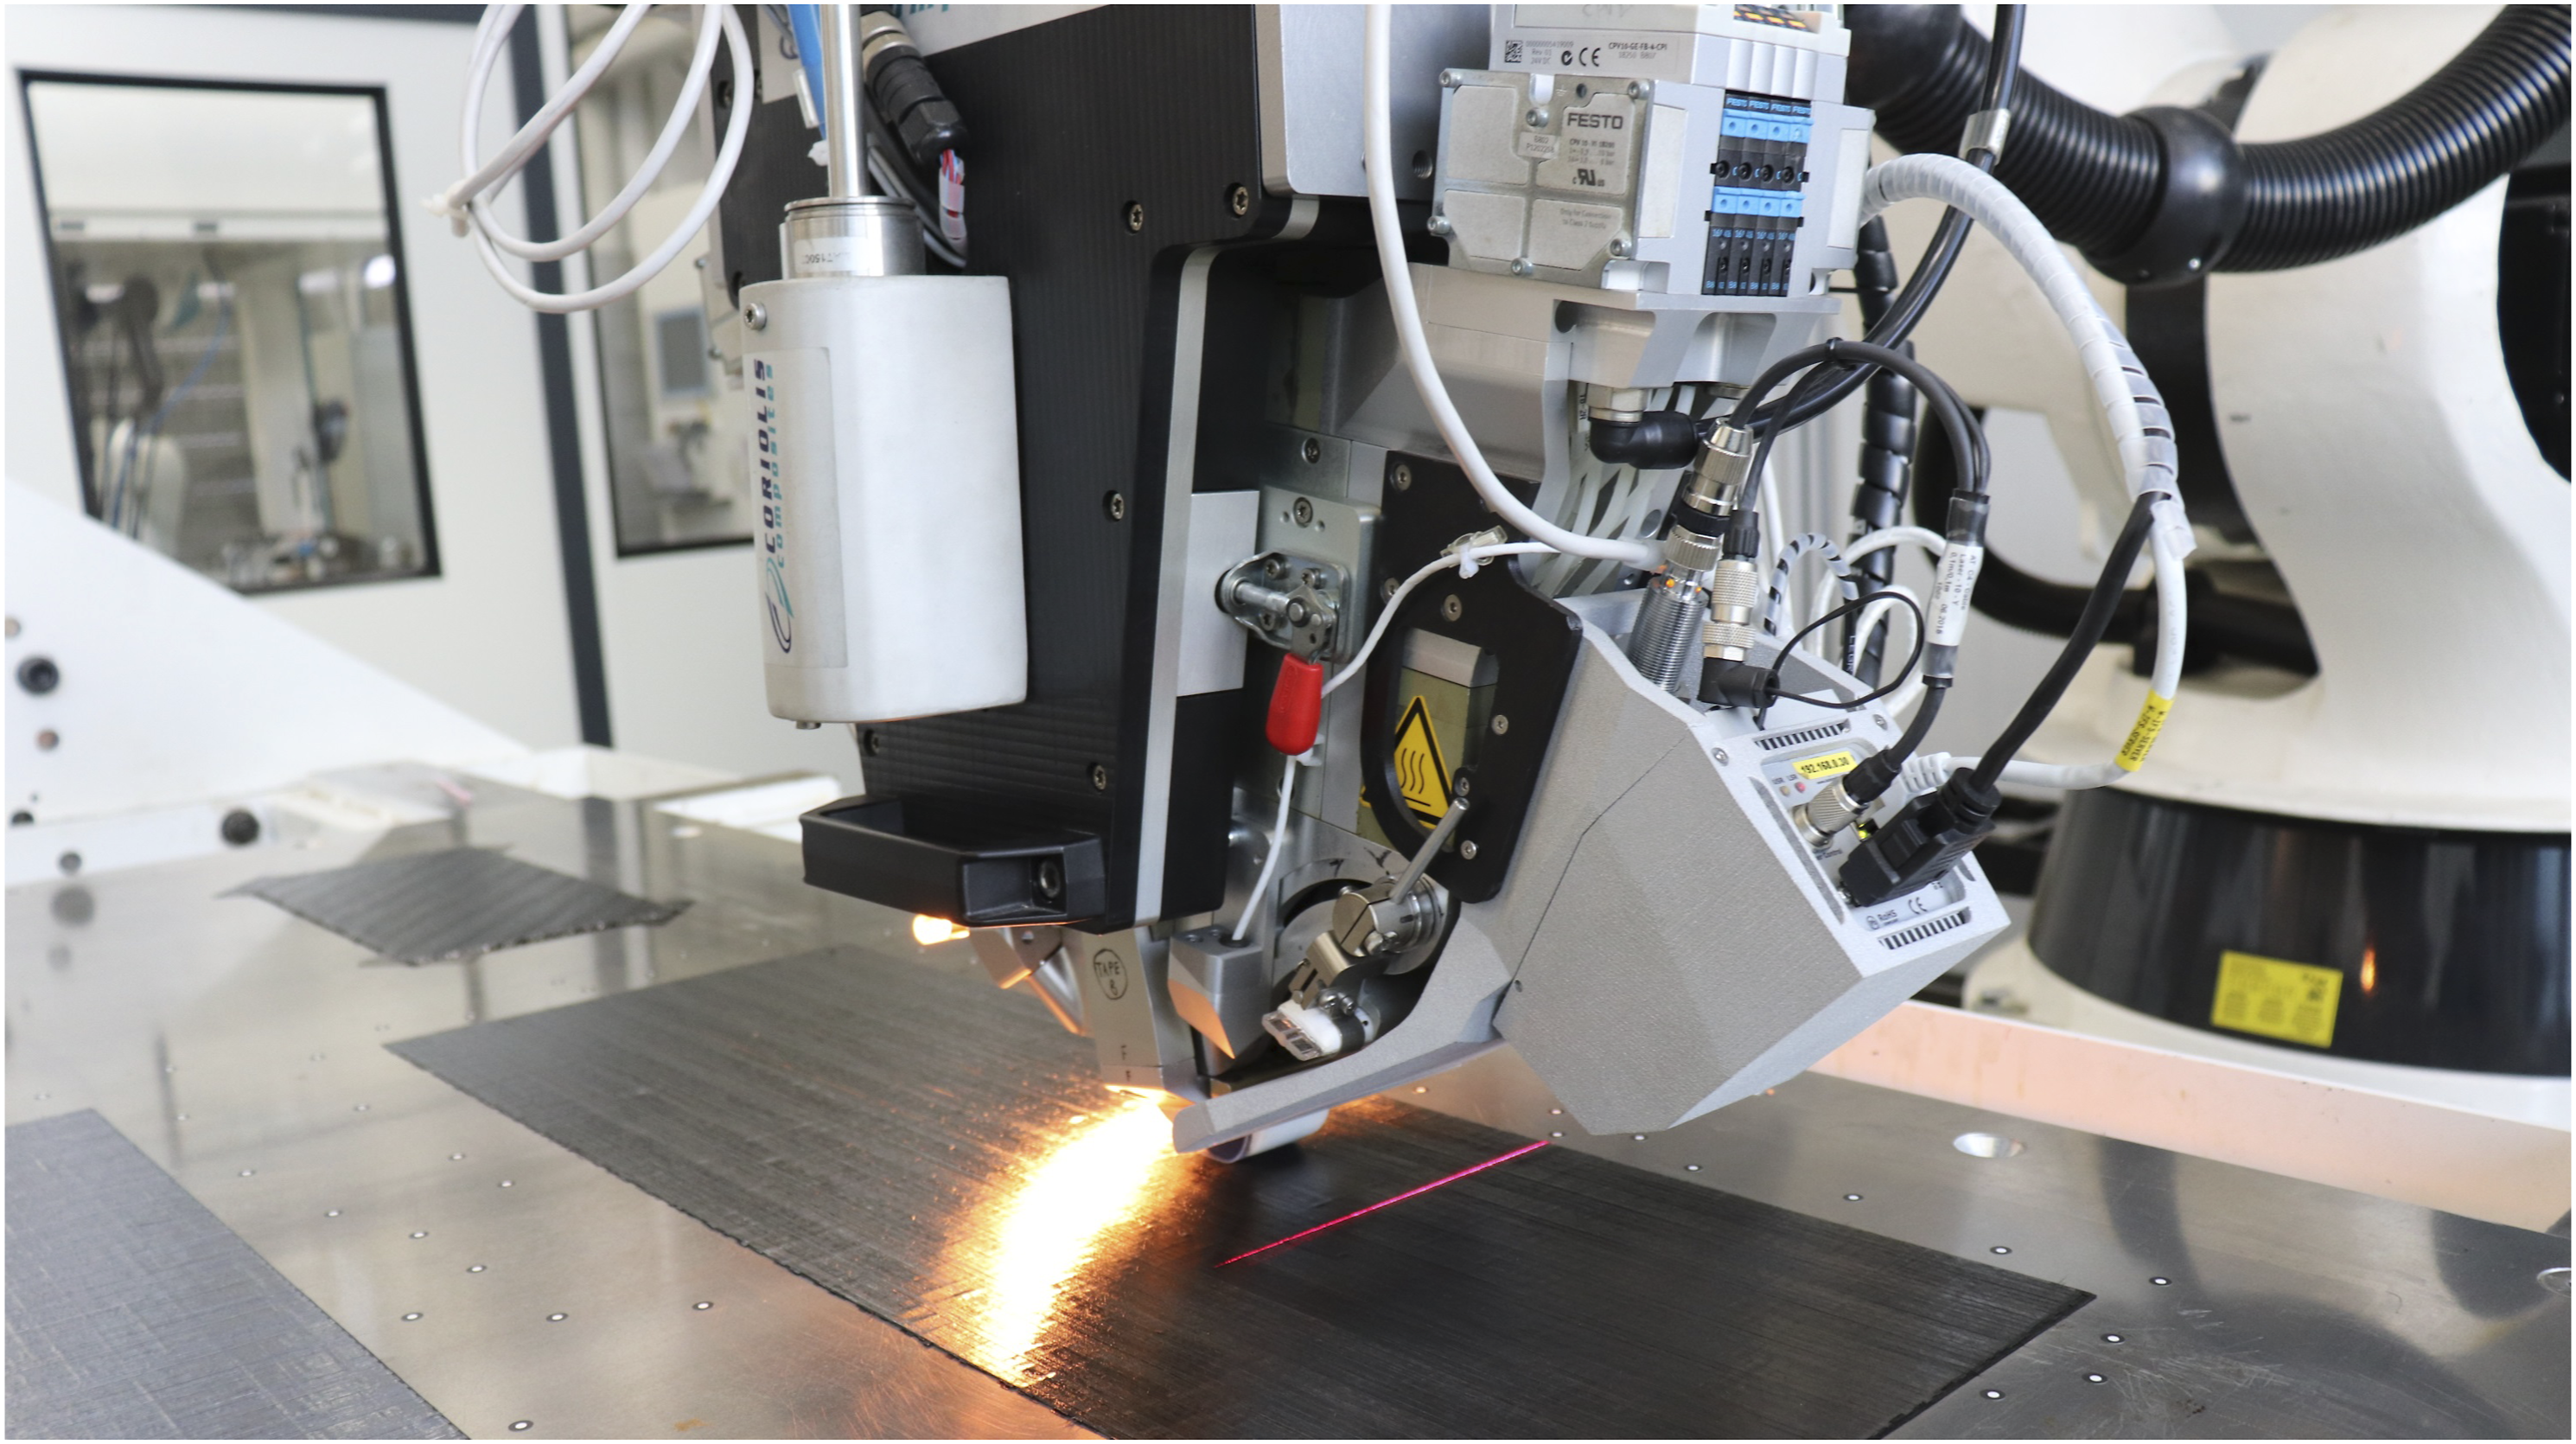
As output files the system provides PNG files with a bit depth of 16 bits in grayscale. The gray value of each pixel represents the height of the captured surface at this position. For the detection and evaluation of the defects an image-processing pipeline developed in
24
was used and adopted. The goal of the image-processing pipeline is an automatic extraction of the image region with the defect, which can be either a gap or an overlap. The task is thus that of image segmentation. Before a segmentation algorithm is applied, the grayscale images are filtered using the median blur technique to remove noisy pixels caused by measurement errors. This improves the quality of further segmentation steps. Afterward, the Otsu method for image thresholding is applied to obtain a binary mask that marks the defect region. The Otsu method can be considered as an automatic pixel histogram-splitting algorithm that maximizes the inter-class pixel variance (i.e., the variance between the defect and reference image regions) and was first introduced by Otsu.
26
The obtained binary mask is then used to obtain the defect region and the reference region. The reference region is used later to calculate the defect volume. Figure 5 illustrates the proposed image segmentation pipeline on an image from the F_G_4 configuration. Illustration of the proposed image segmentation pipeline. (a) Median blurring is applied on the raw input image, (b) Otsu thresholding generates a binary mask for the defect region, (c) the binary mask is used to obtain the defect (1) and reference (2) images.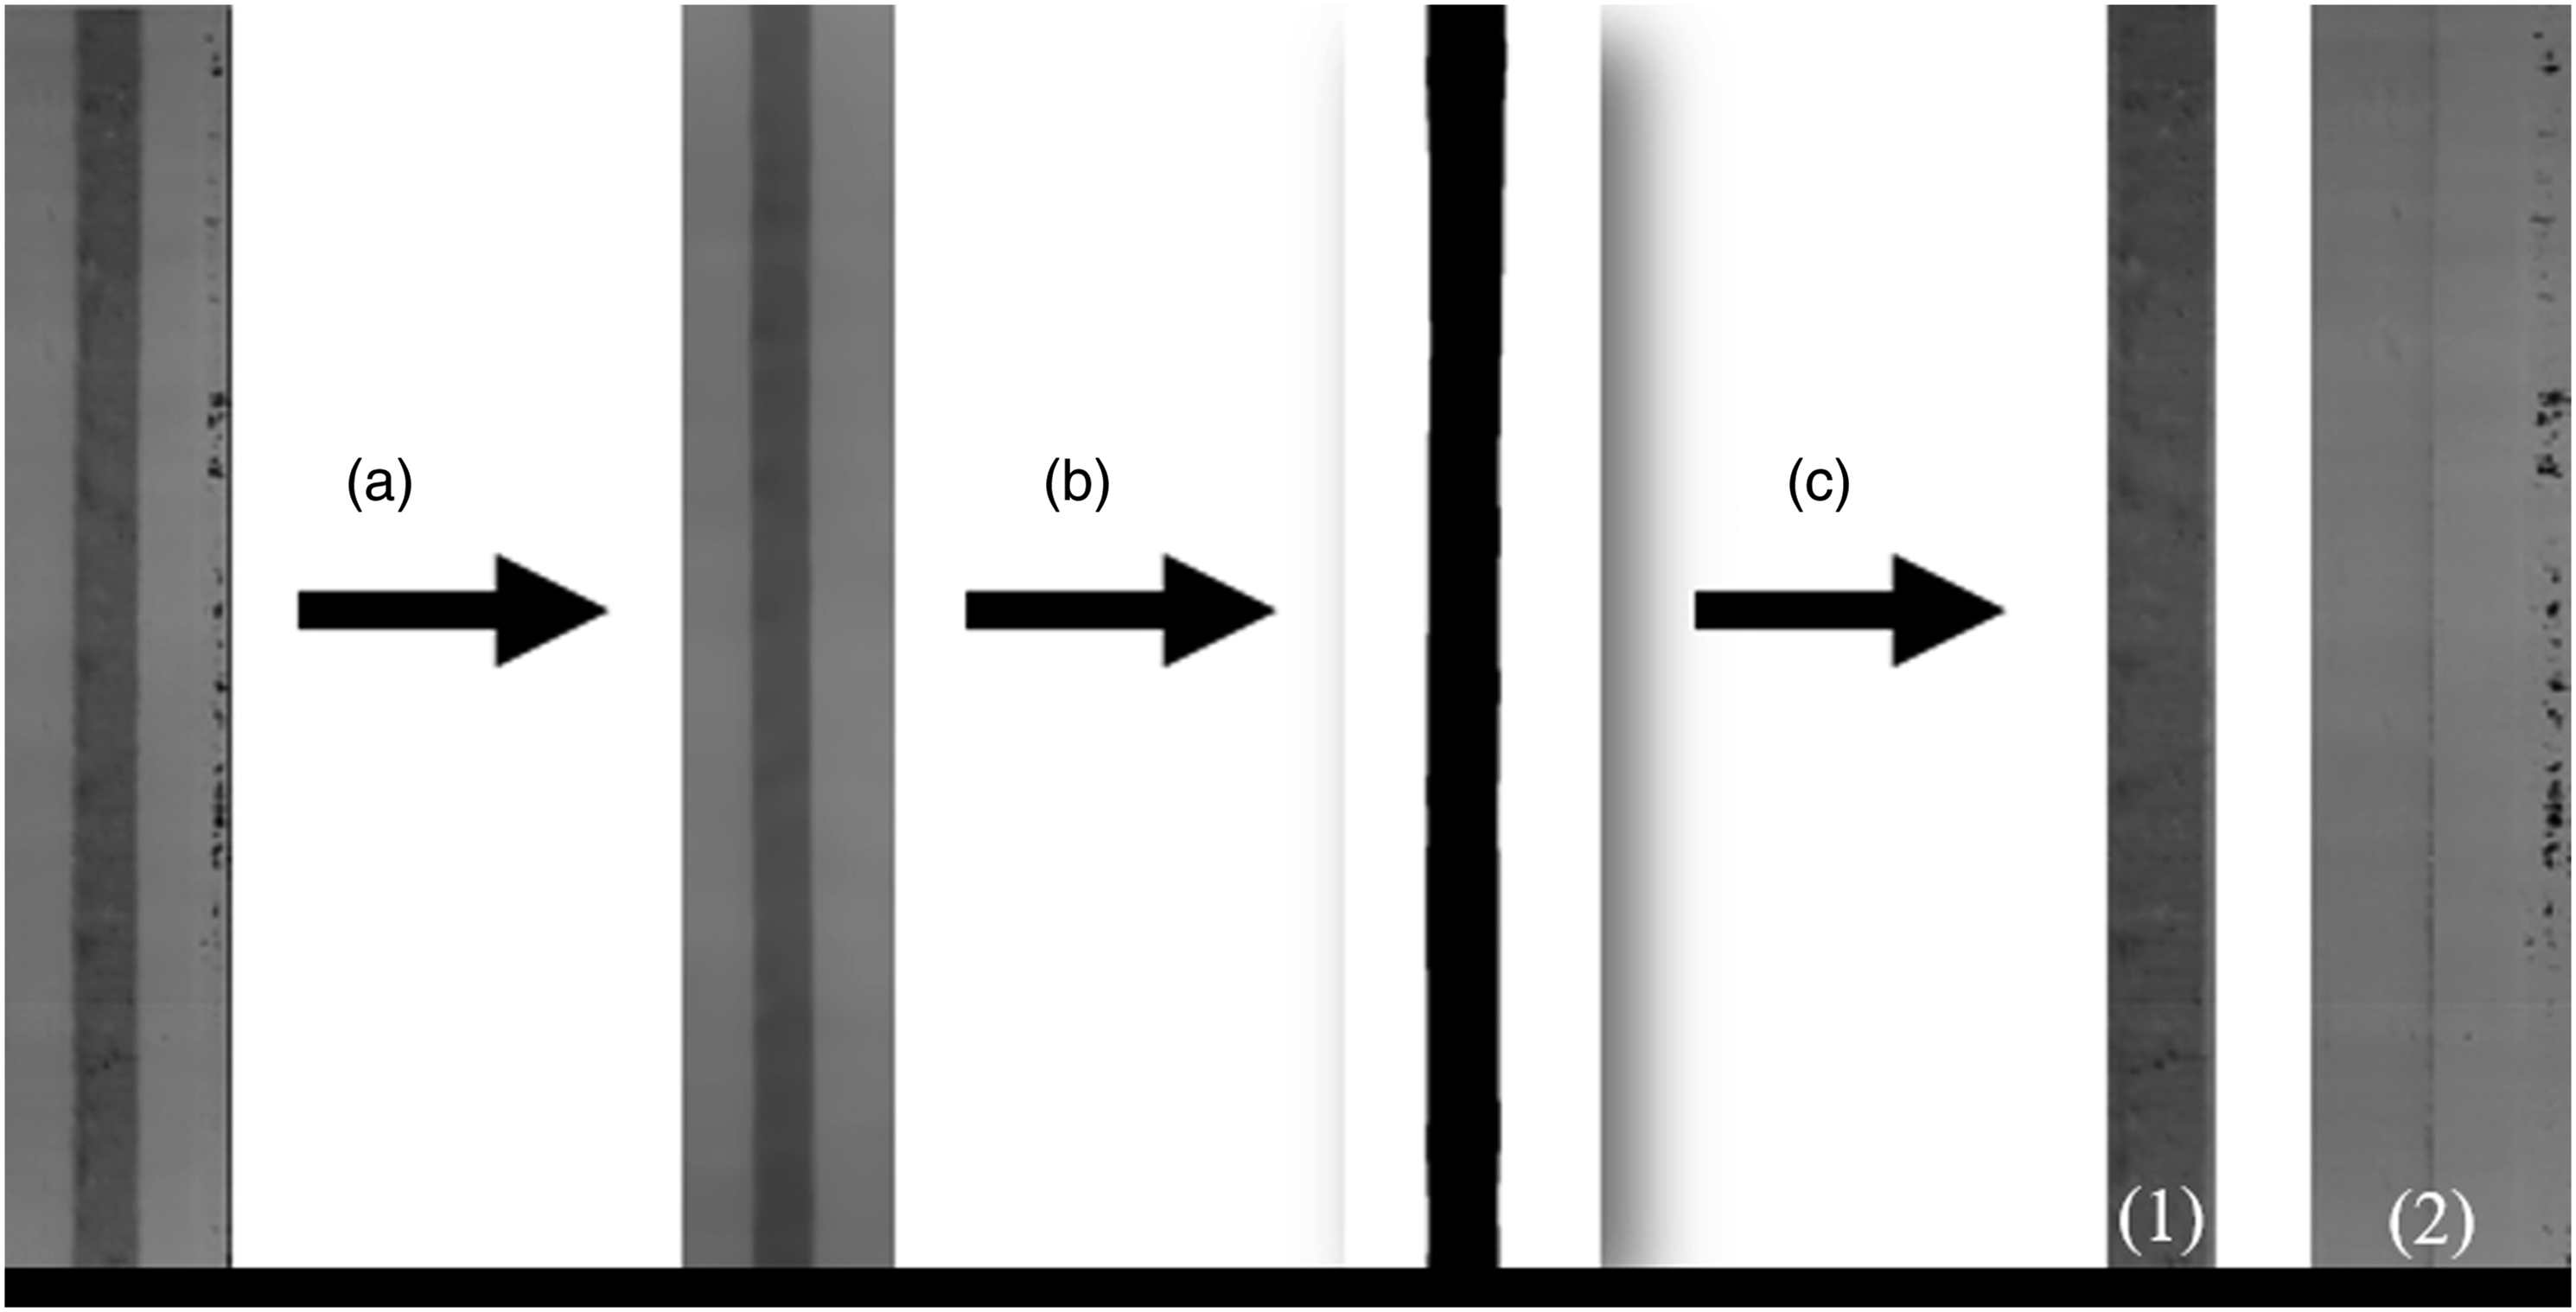
Characterization
The specimens for mechanical testing were cut out by a water-jet in order to meet the required dimensional tolerances. Figure 6 illustrates the orientations of the specimens and defects in the manufactured laminates. Orientations of specimens in the manufactured laminates for: (a) in-plane shear tests and (b) tension or 3-point-bending tests.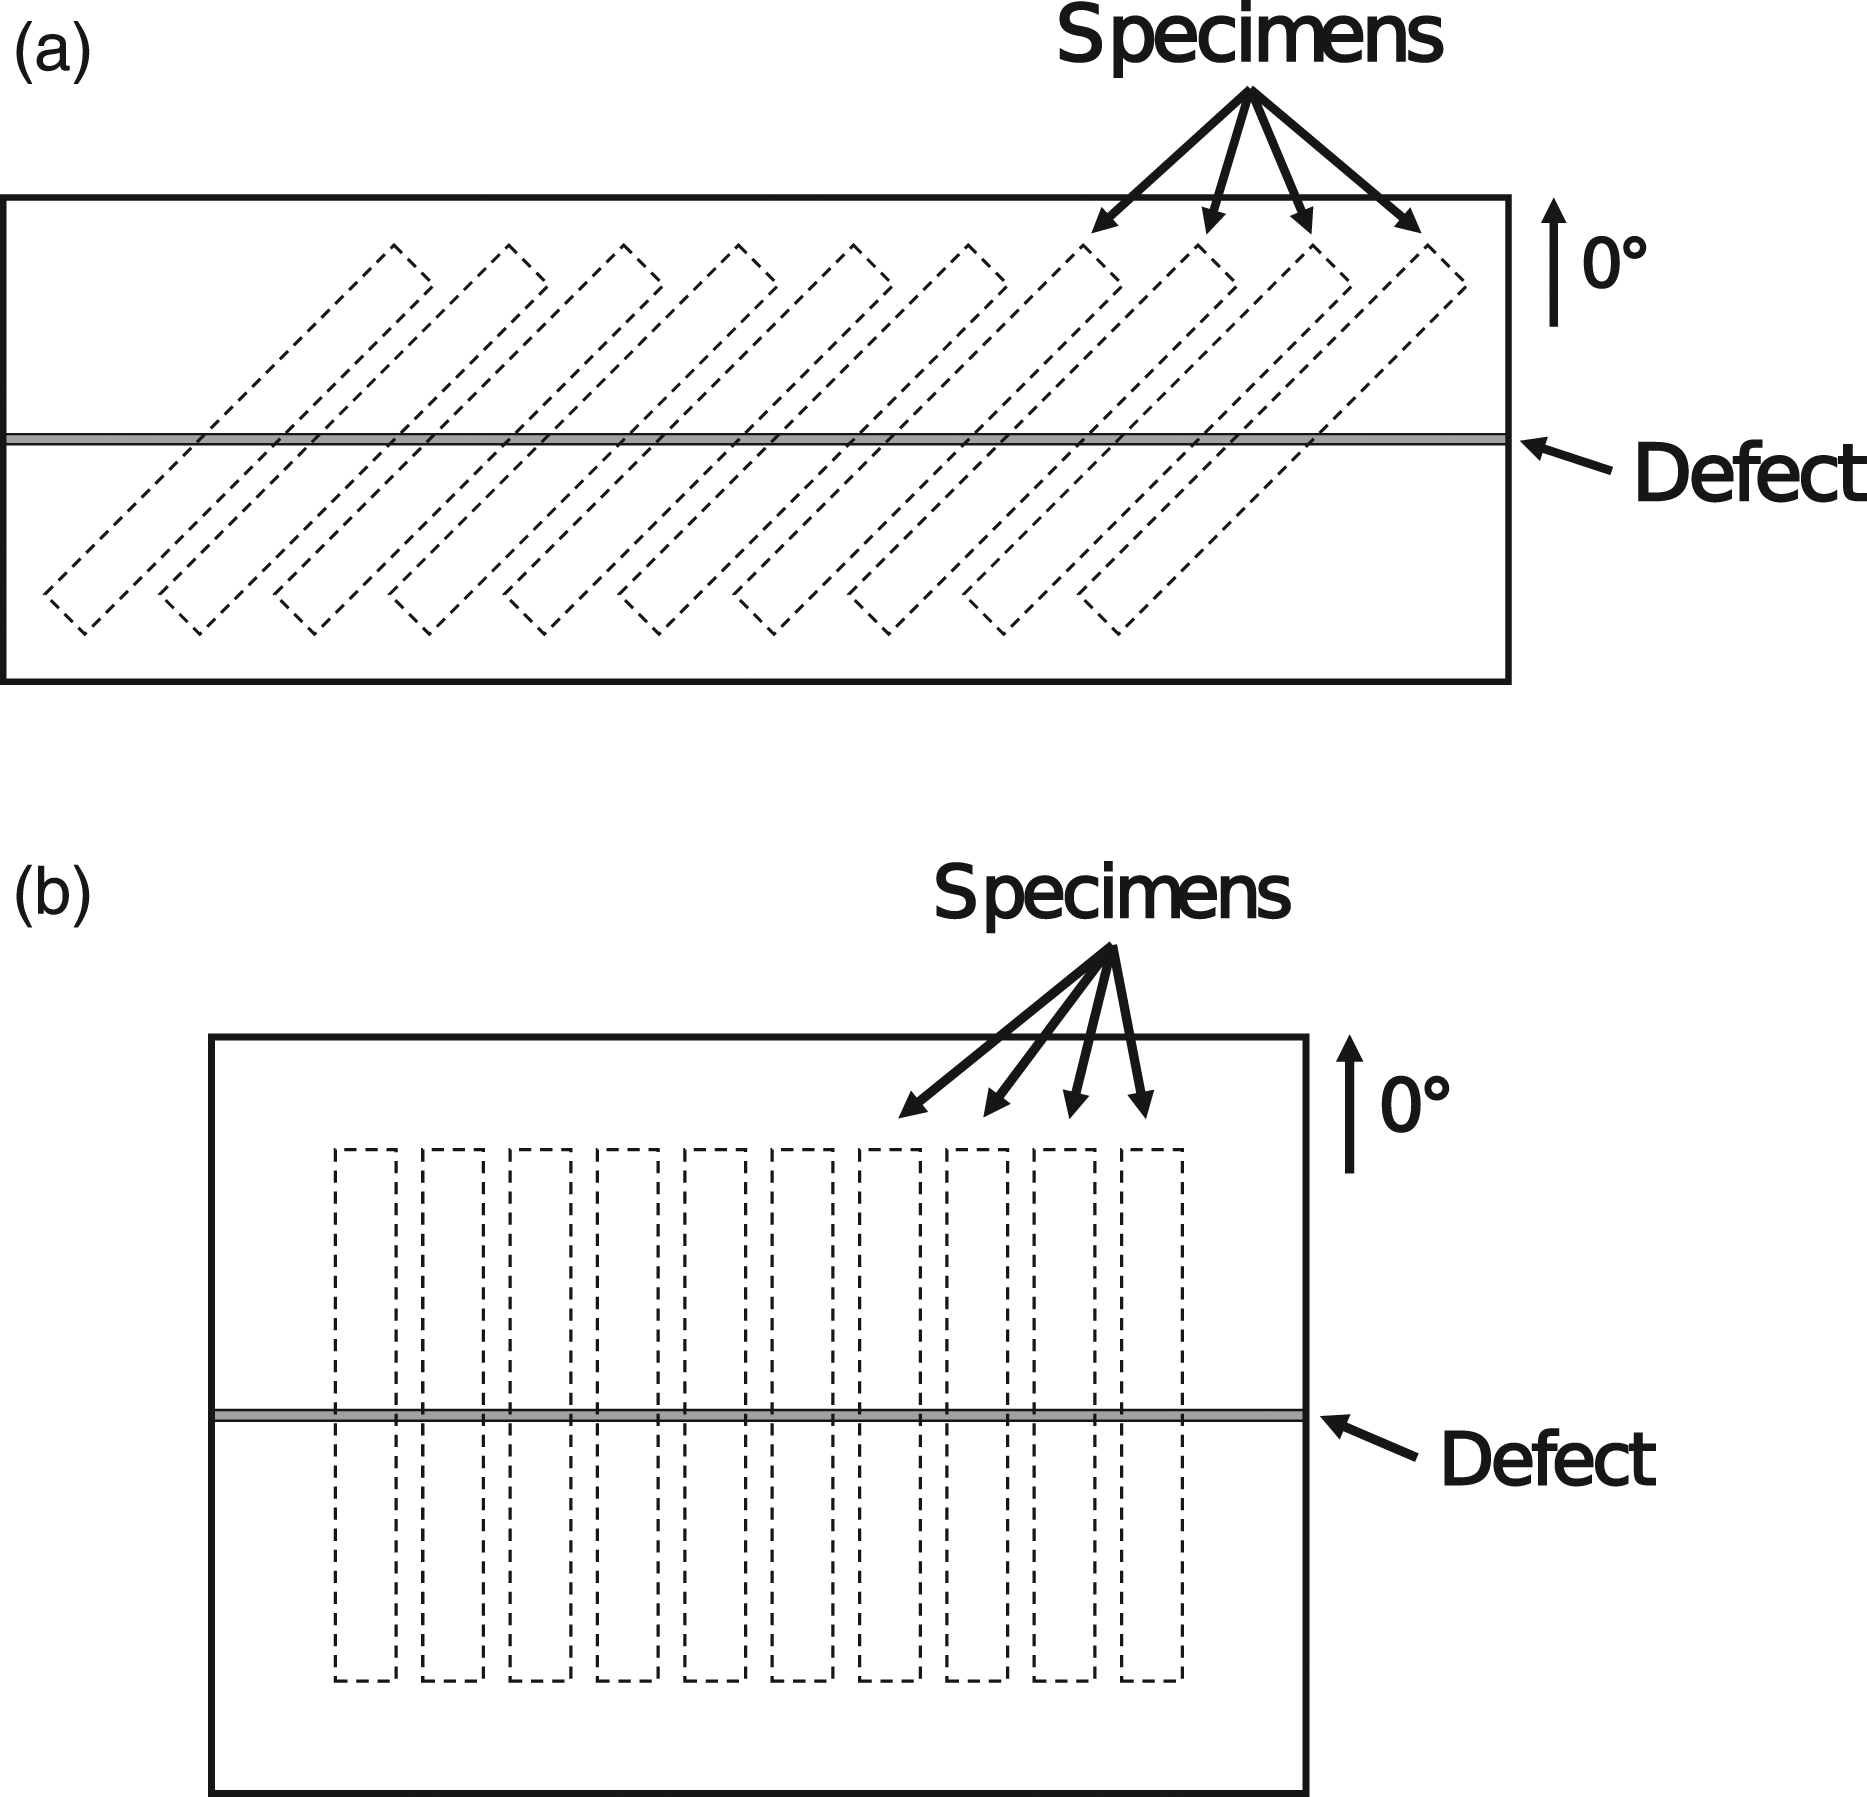
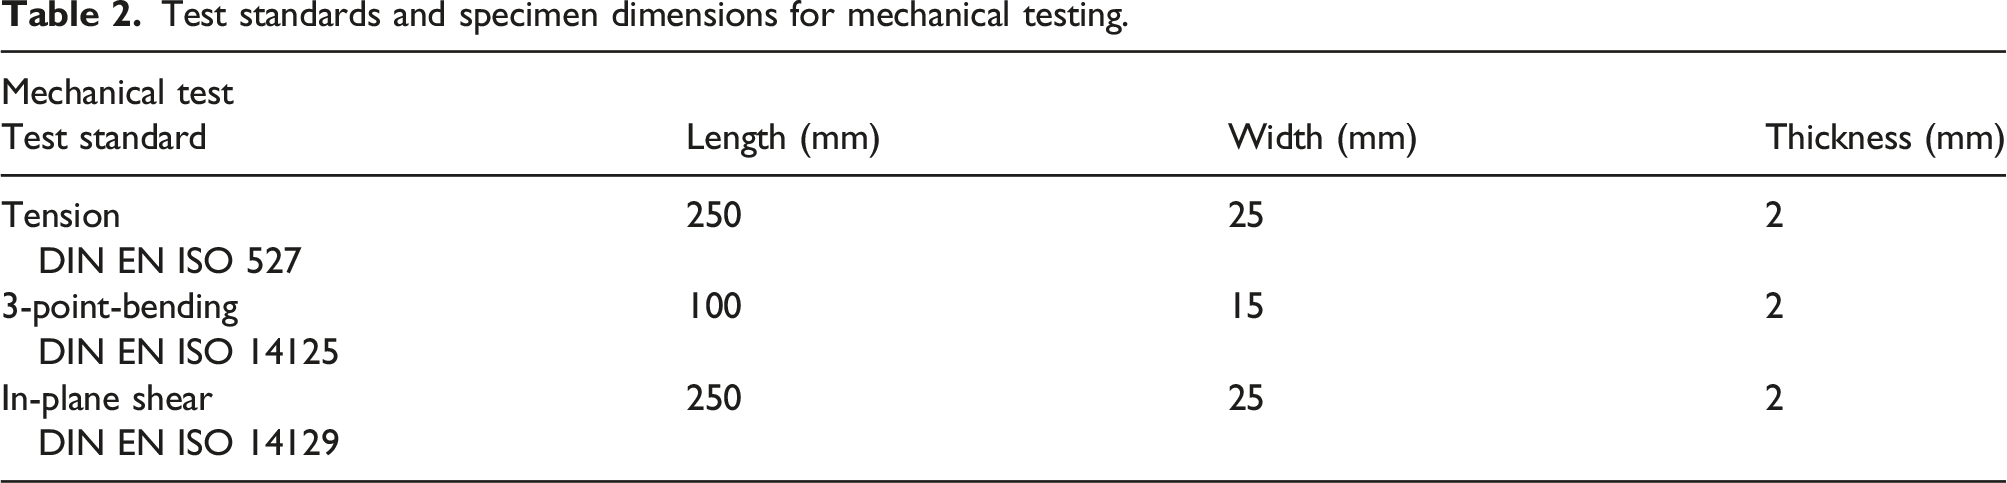
Mechanical testing was carried out using an Inspekt 100 universal testing machine by Hegewald and Peschke with a 100 kN load cell.
Test standards and specimen dimensions for mechanical testing.
Fiber undulations after curing were investigated by microscopy. For this purpose, we prepared one microsection for each defect configuration. The microsections were analyzed using a BX41 optical microscope by Olympus.
Results and discussion
Micrographs
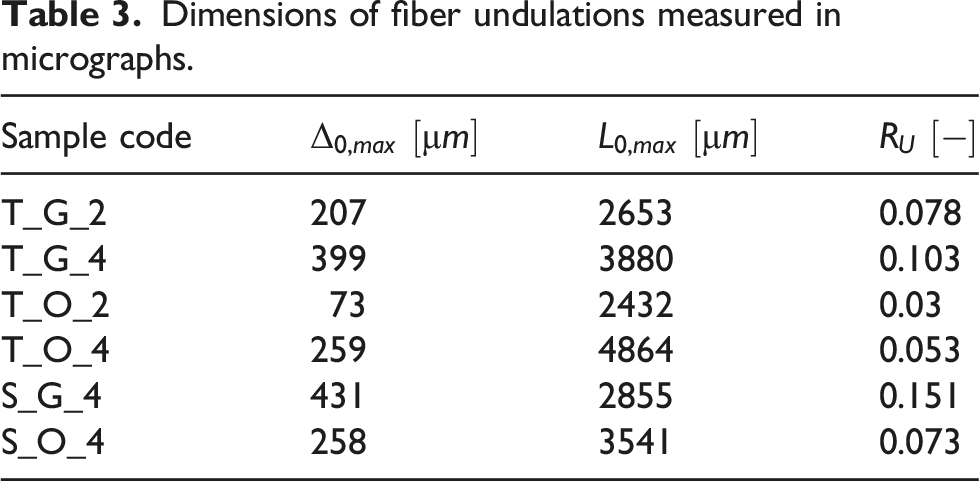
In Figures 7 and 8 the fiber undulations induced by gaps in the quasi-isotropic laminate after curing can be seen. As mentioned before, the samples for tensile and bending tests have an identical stacking sequence and defect design. In this section we will therefore only refer to samples for tensile testing since their micrographs are identical to the ones used for bending tests. Figure 7 shows the undulations of the load bearing fibers (0° fiber orientation) caused by two gaps positioned on top of each other in the neighboring 90° plies. A maximum deflection of 207 μm from the undisturbed level of the 0° layer can be measured. The distance between onset of the fiber undulation and maximum deflection is measured to be 2653 μm. Moreover, this length corresponds to half of the total length of the buckle. In order to assess the severity of the fiber undulations, a ratio between the two values was calculated as follows: Micrograph of laminate with defect configuration T_G_2 after curing. Micrograph of laminate with defect configuration T_G_4 after curing.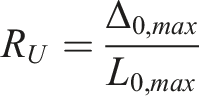
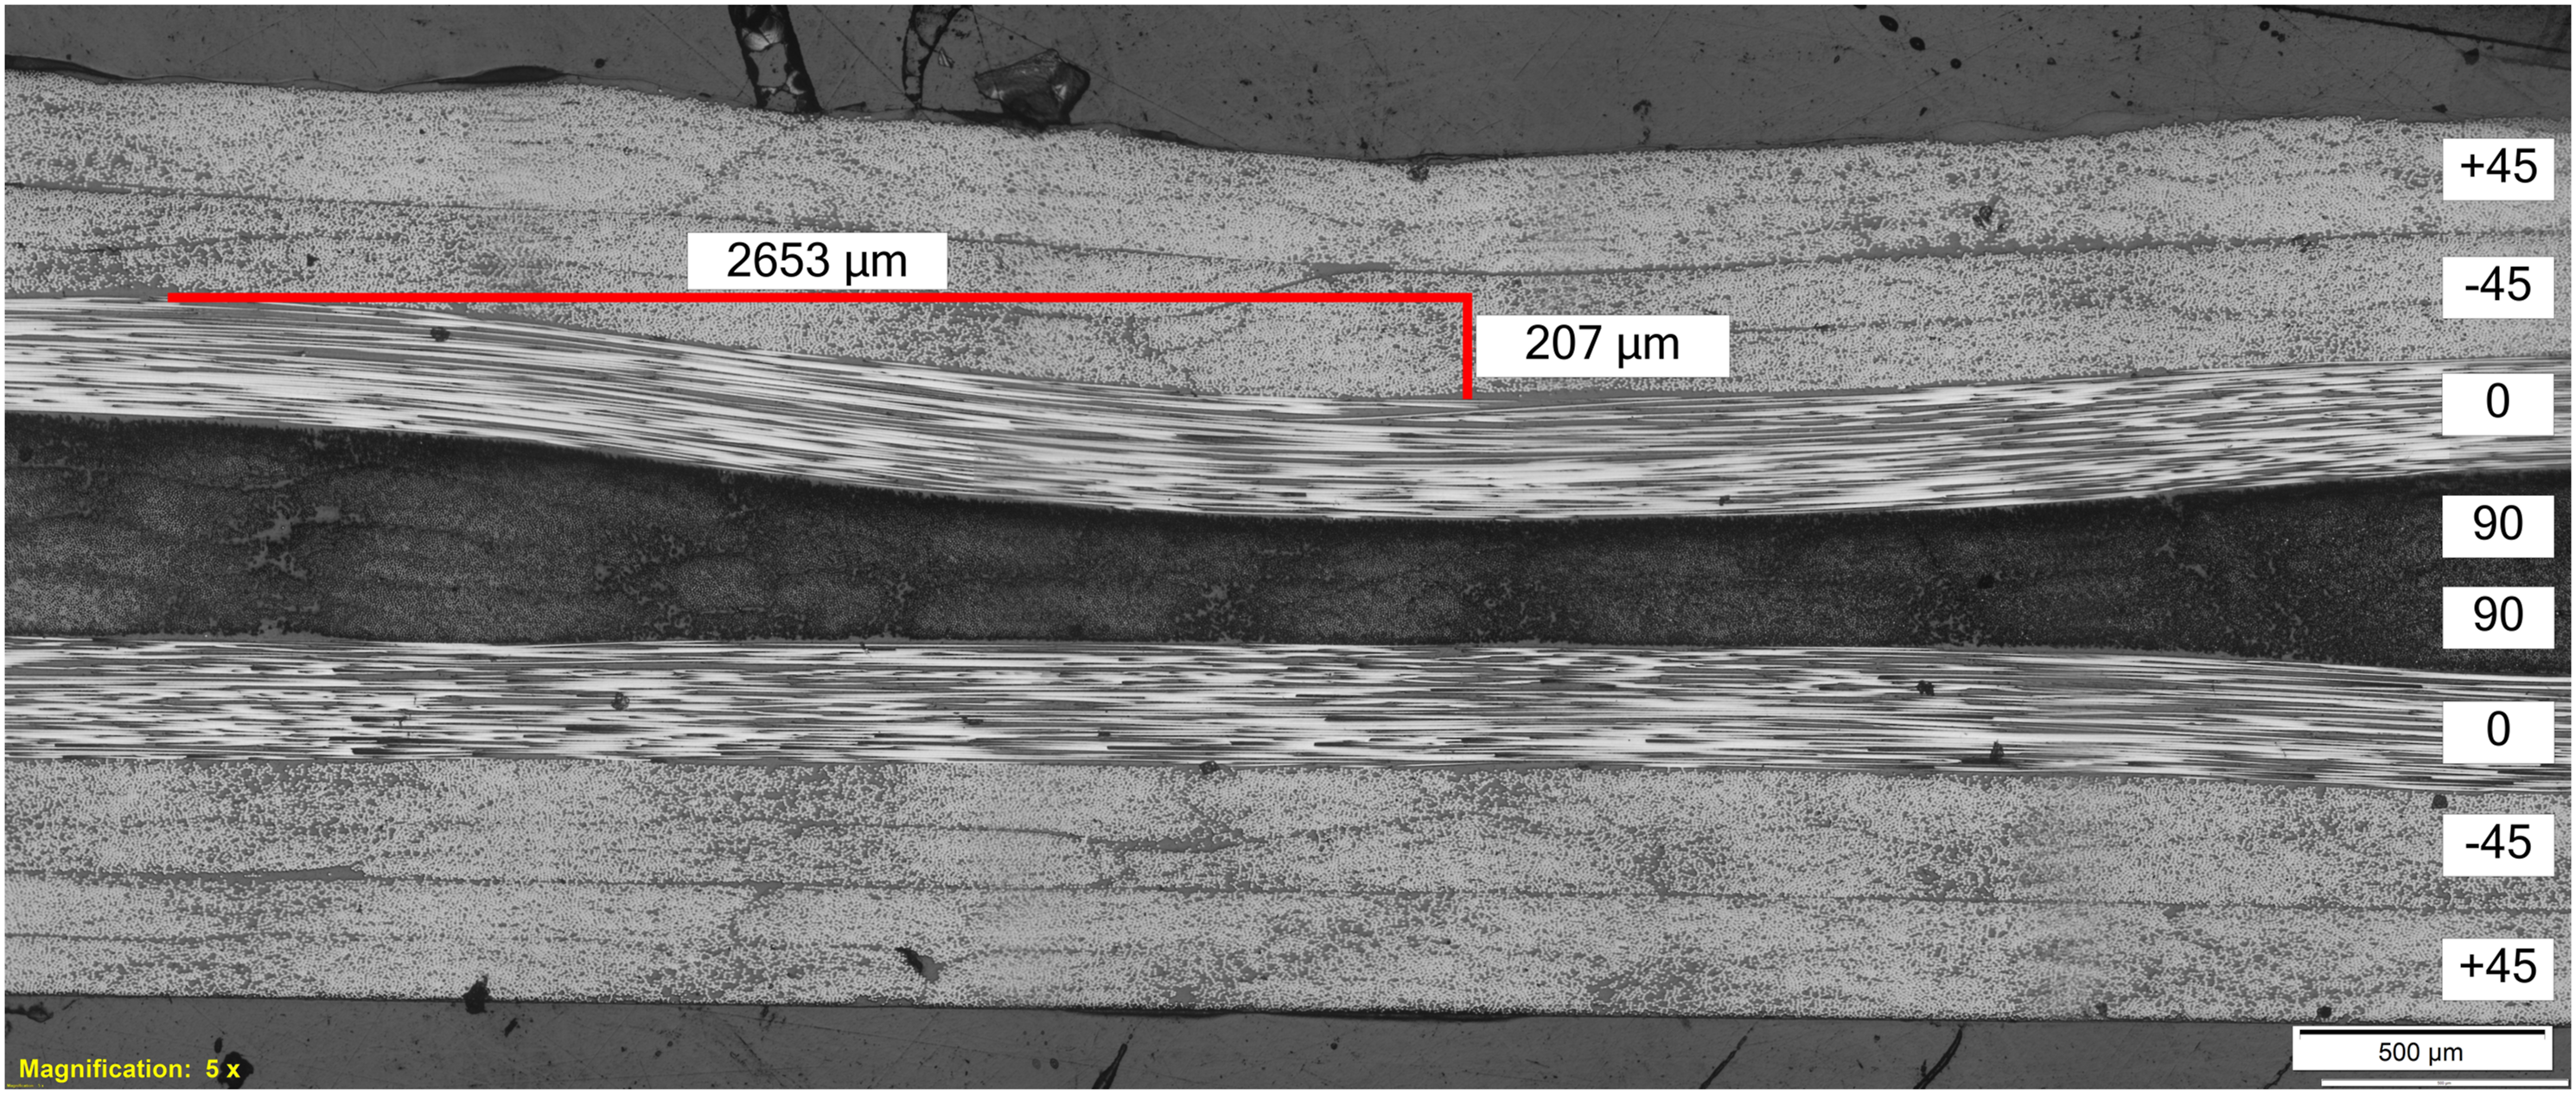
The fiber undulations after curing in a quasi-isotropic laminate with a defect configuration containing four gaps positioned on top of each other can be seen in Figure 8. As expected, the larger defects lead to stronger fiber undulations of the neighboring plies. A value of 399 μm can be measured for
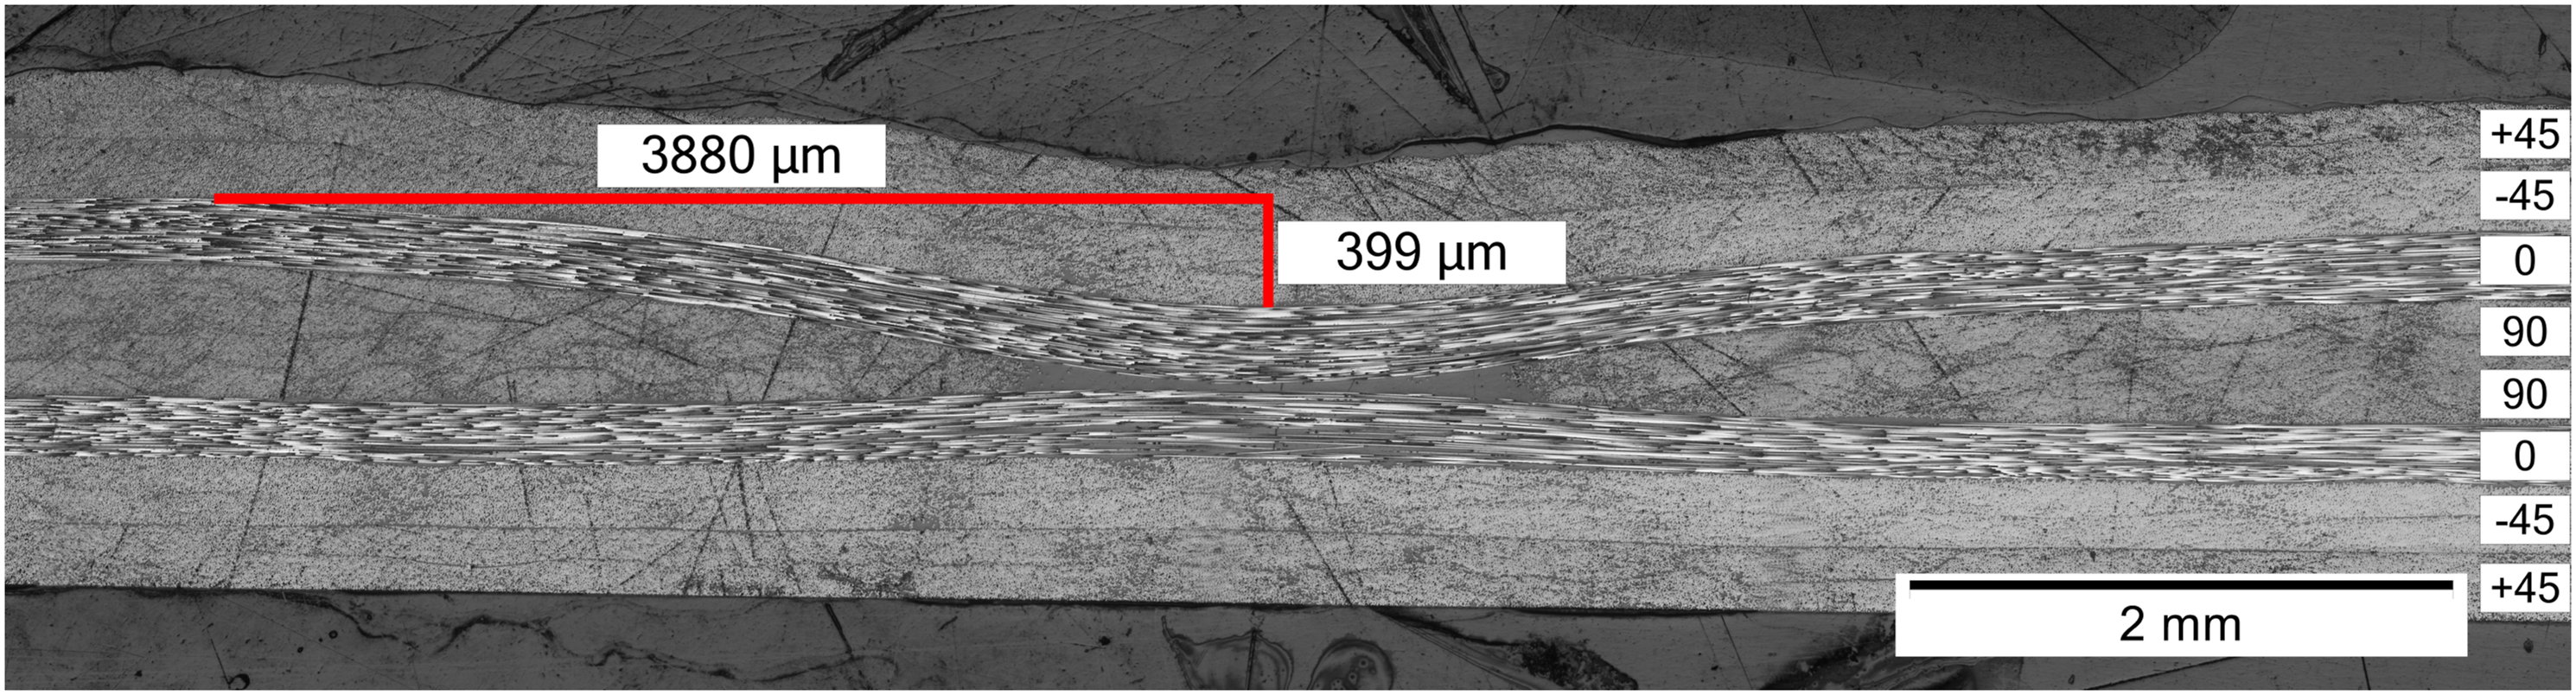
Figures 9 and Figure 10 show the fiber undulations after curing induced by overlaps in a quasi-isotropic laminate. Interestingly, it can be observed that the maximum deflection of the fibers in the 0° plies is significantly lower than for the same amount of gaps in an identical stacking sequence. With a value of 73 μm, the deflection caused by two overlaps is 65% lower than for a configuration with two gaps, while the distance between onset of the fiber undulation and maximum deflection is almost identical. Micrograph of laminate with defect configuration T_O_2 after curing. Micrograph of laminate with defect configuration T_O_4 after curing.
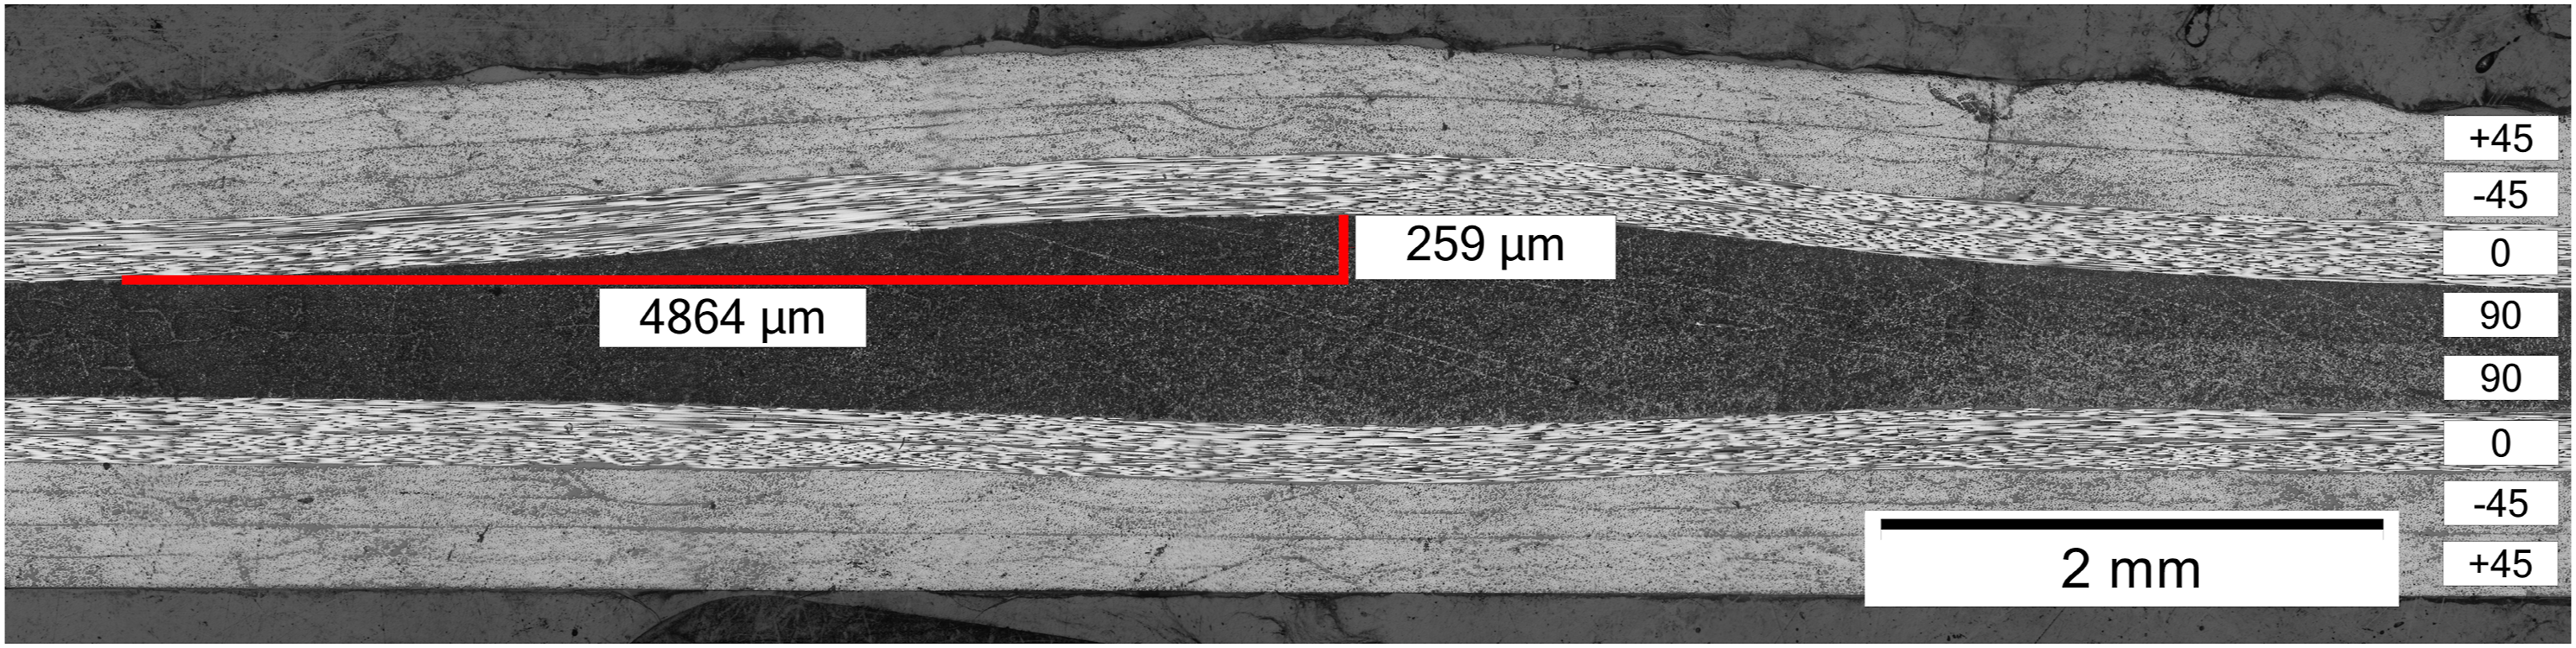
For a configuration containing four overlaps a deflection of 259 μm was found, compared to a value of 399 μm for four gaps. Furthermore, a larger distance from onset of the fiber undulation to maximum deflection can be seen compared to the corresponding gap configuration. As a result, the calculated values of
The micrographs of the specimens for in-plane shear tests can be seen in Figures 11 and 12. Configuration S_G_4 shows a maximum deflection of the 0° fibers of 431 μm with a distance between onset of the fiber undulation and maximum deflection of 2855 μm. For the corresponding overlap configuration, the values are measured to be 258 μm and 3541 μm, respectively. Micrograph of laminate with defect configuration S_G_4 after curing. Micrograph of laminate with defect configuration S_O_4 after curing.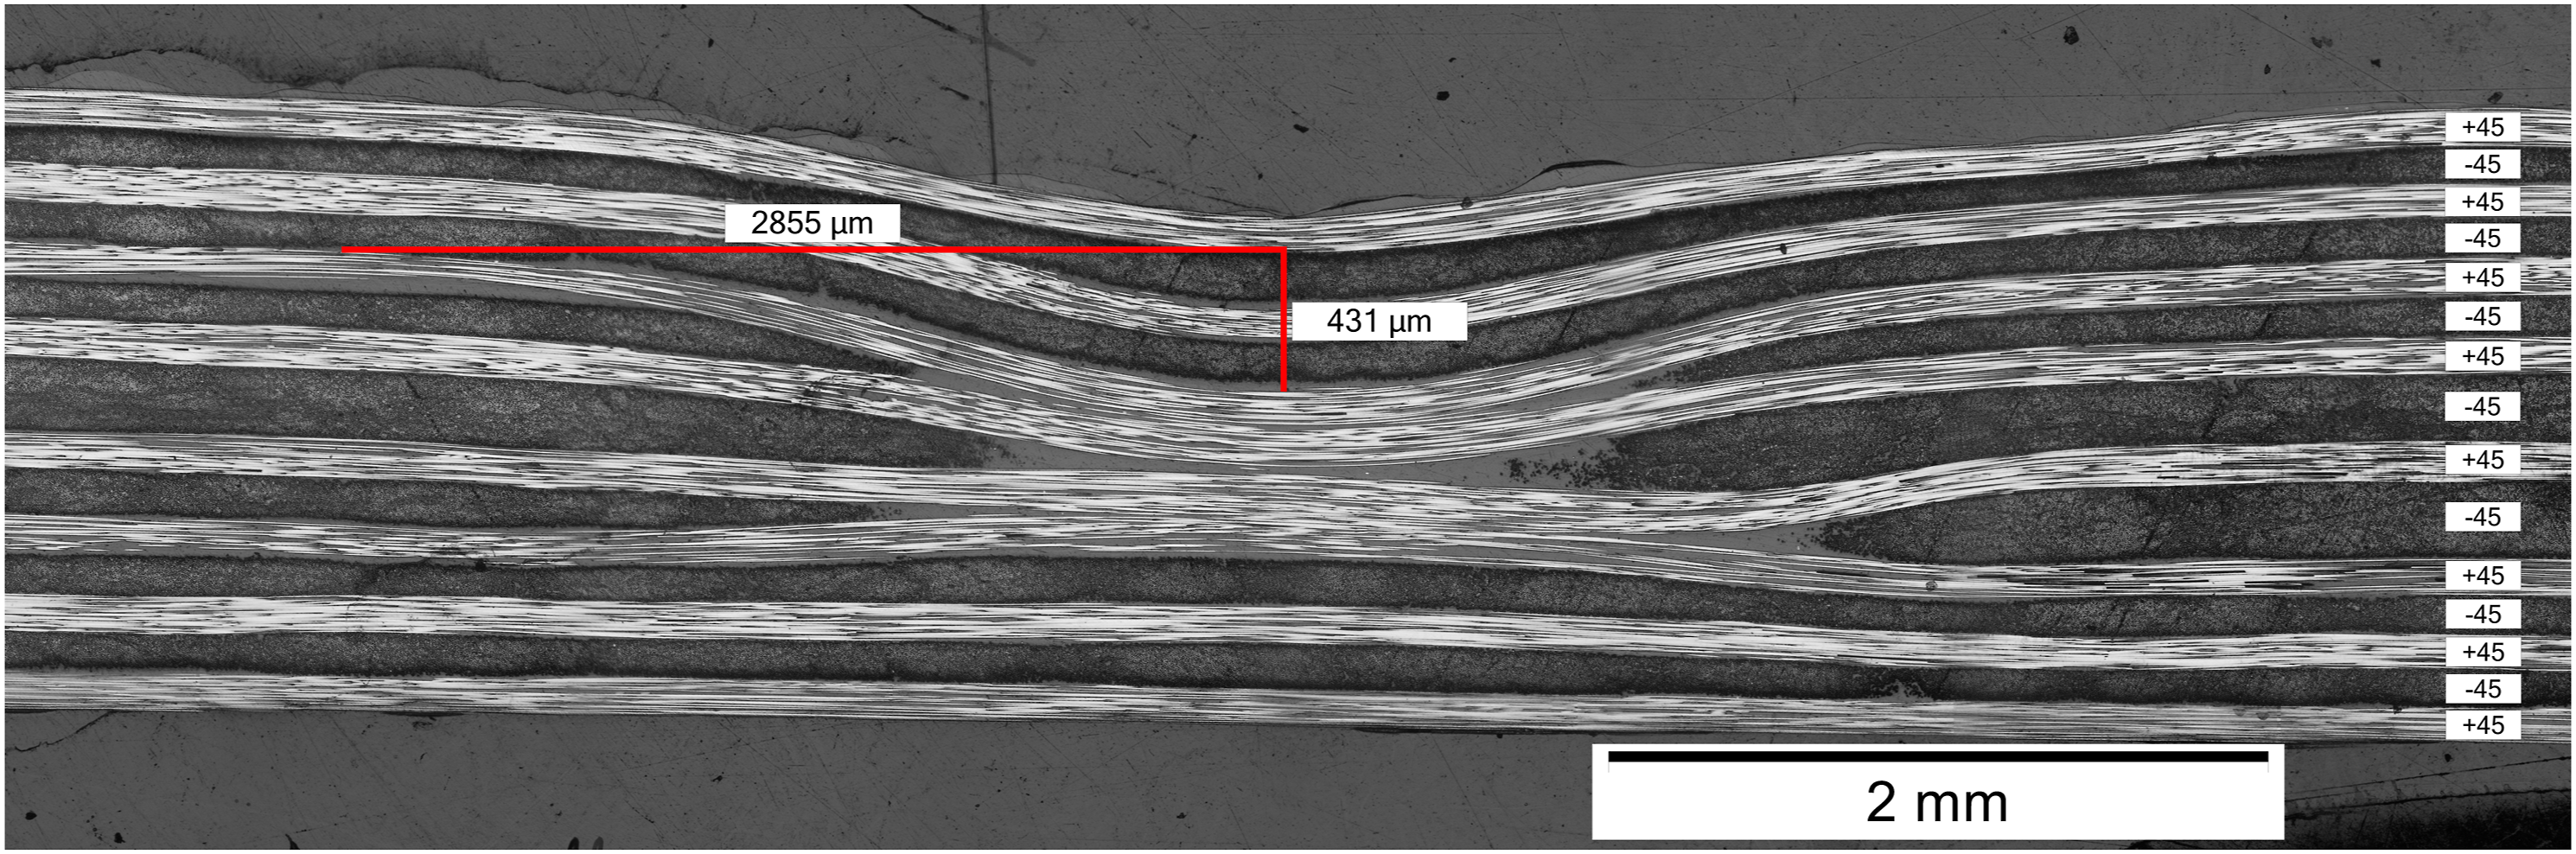
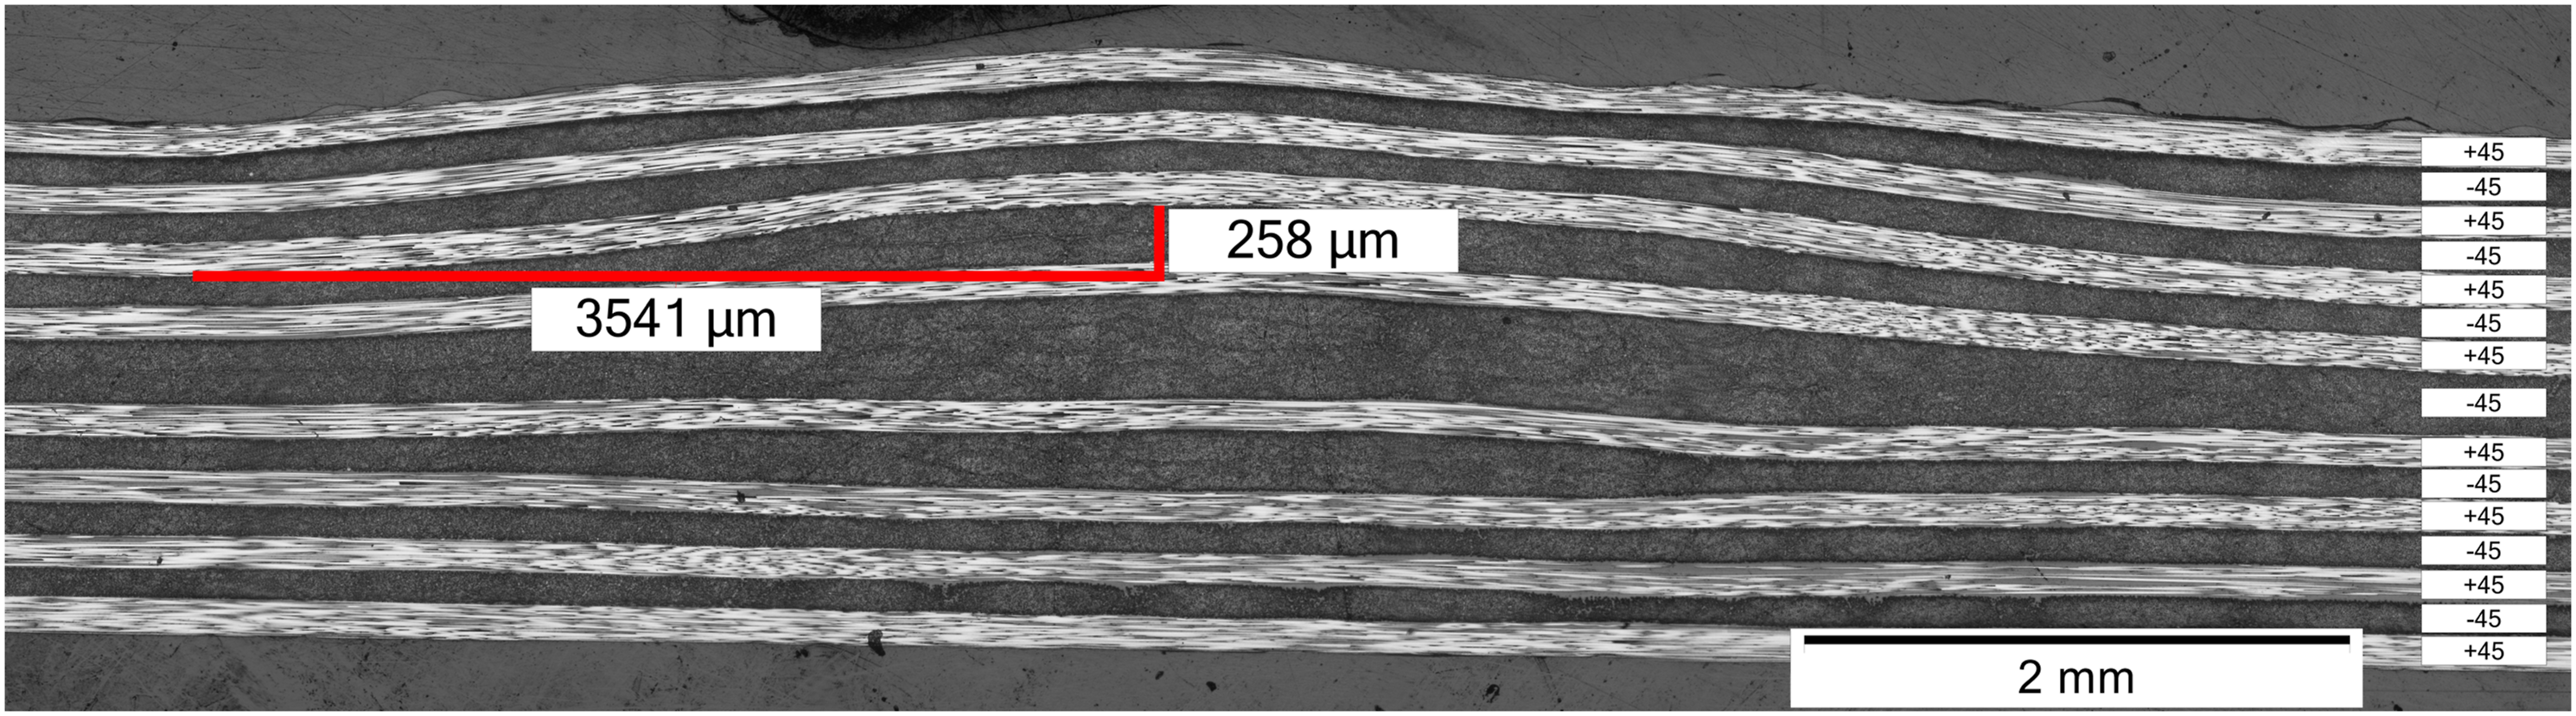
As mentioned before, the samples intended for in-plane shear tests do not have a quasi-isotropic laminate design. According to the test standard (DIN EN ISO 14129) a stacking sequence of [+45/-45]4S was chosen instead. Consequently, the fiber undulations revealed in the micrographs have to be assessed independently from the findings for quasi-isotopic laminates. However, the same trend can be observed for both laminate types. The presence of gaps leads to significantly more severe fiber undulations than the identical number of overlaps with the same size.
Dimensions of fiber undulations measured in micrographs.
Tensile tests
The summarized results of the tensile tests can be seen in Figure 13. For the results the mean of at least five tests has been calculated. The error bars represent the corresponding standard deviation. Ultimate tensile strength of different defect configurations.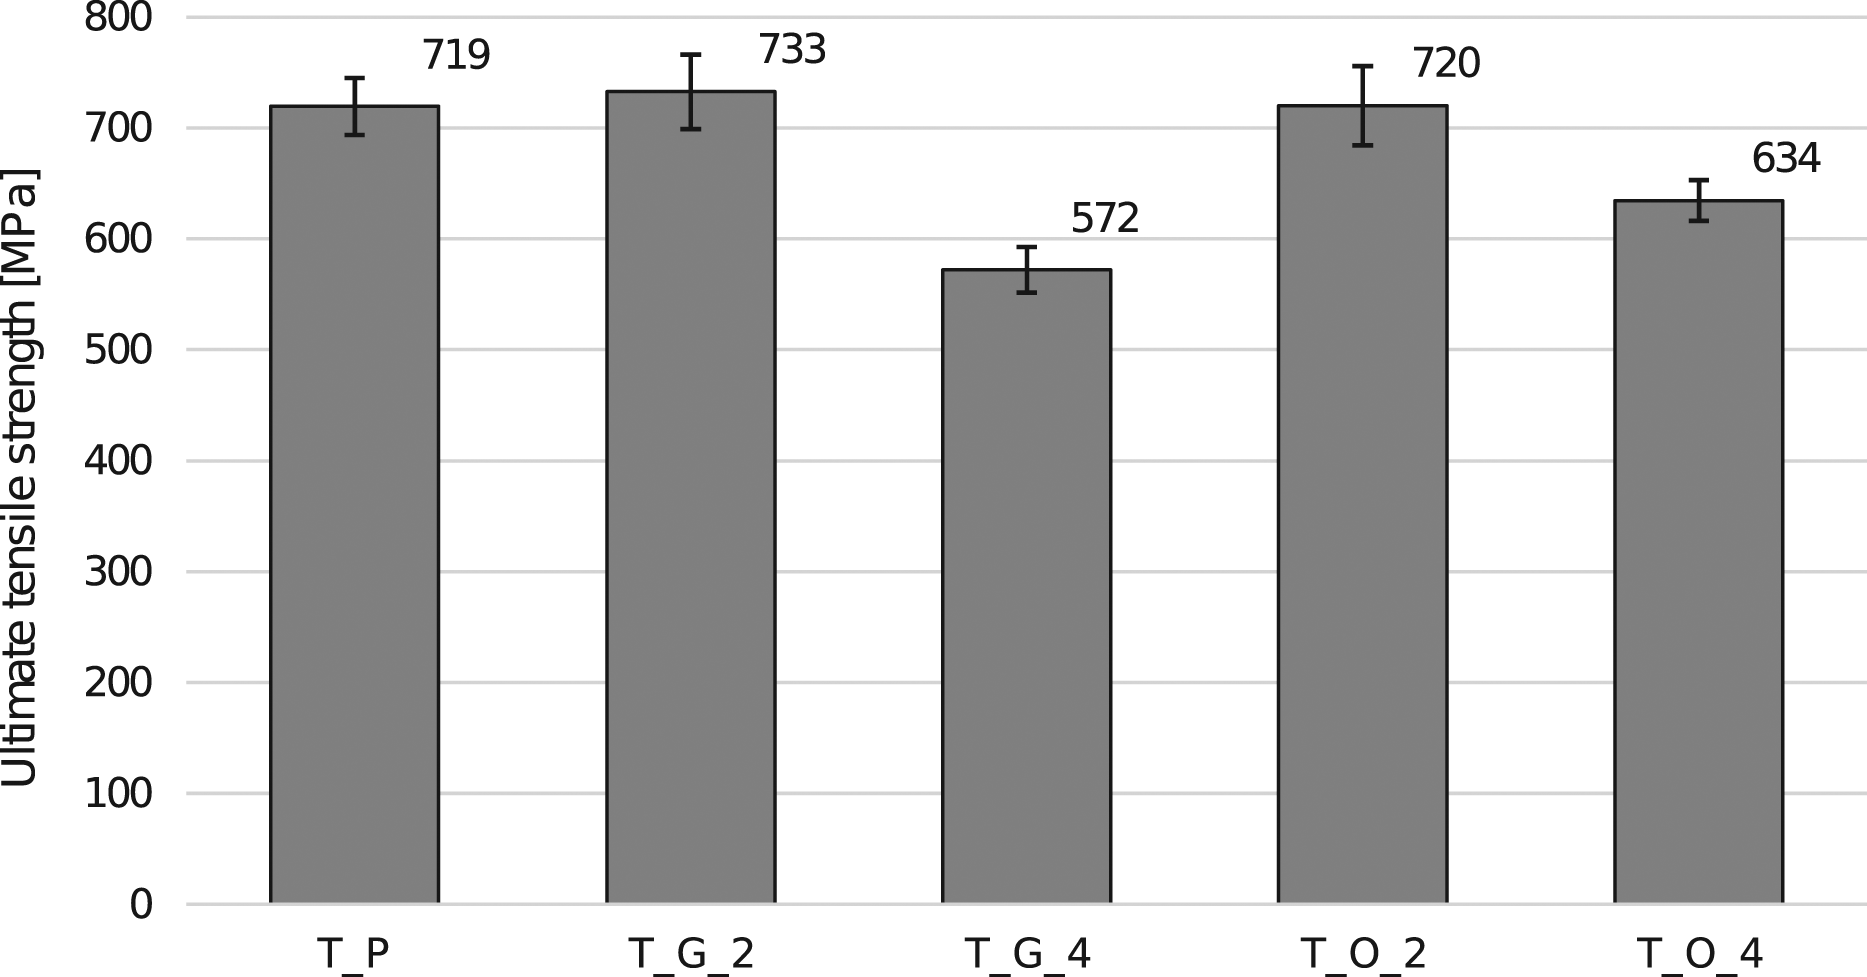
The pristine samples showed an ultimate tensile strength of 719 MPa which is in good correspondence with the values that can be found in literature. For a quasi-isotropic laminate design with 16 plies of IM7/8552 Woigk et al. 17 reported a ultimate failure stress of 750 MPa. In another study by Wisnom et al. a value of 660 MPa was found. 27
The tests of the samples containing defects showed values of 733 MPs for the configuration T_G_2 and 720 MPa for T_O_2. Therefore, the presence of small defects in the laminate did not lead to a measurable knockdown in tensile strength even though pronounced undulations of the load bearing 0° fibers can be observed in the micrographs of the laminates.
The samples of defect configuration T_O_4 showed a failure stress of 634 MPa and therefore a strength reduction of 12% compared to the pristine samples. For T_G_4 a reduction of 20% compared to pristine samples was observed leading to a tensile strength of 572 MPa.
In can be concluded that gaps or overlaps that are restricted to only one or two plies do not lead to significant changes of the ultimate tensile strength of a laminate despite the fact that they induce fiber undulations in the neighboring plies. However, defects that reach a certain thickness lead to a significant knockdown in strength. Furthermore, the tests showed that the configuration T_G_4 has a more severe impact on the laminate performance than T_O_4. We assume that this is due to the fact that loading the specimen with tensile force causes a straightening of the 0° fibers. In case of a gap configuration this fiber straightening provokes early delamination of the plies in the defect area. In addition, the micrographs consistently showed higher values of
Bending tests
In Figure 14 the results of the 3-point-bending tests are summarized. The pristine samples yielded a flexural strength of 824 MPa. Samples containing gaps showed a knockdown in flexural strength of 11% for the configuration F_G_2 and 29% for F_G_4, respectively. Interestingly, for configurations containing overlaps, the flexural strength value was found to be higher than the pristine property. F_O_2 showed an increase 5%. For F_O_4 an increase of 7% was measured. Flexural strength of different defect configurations.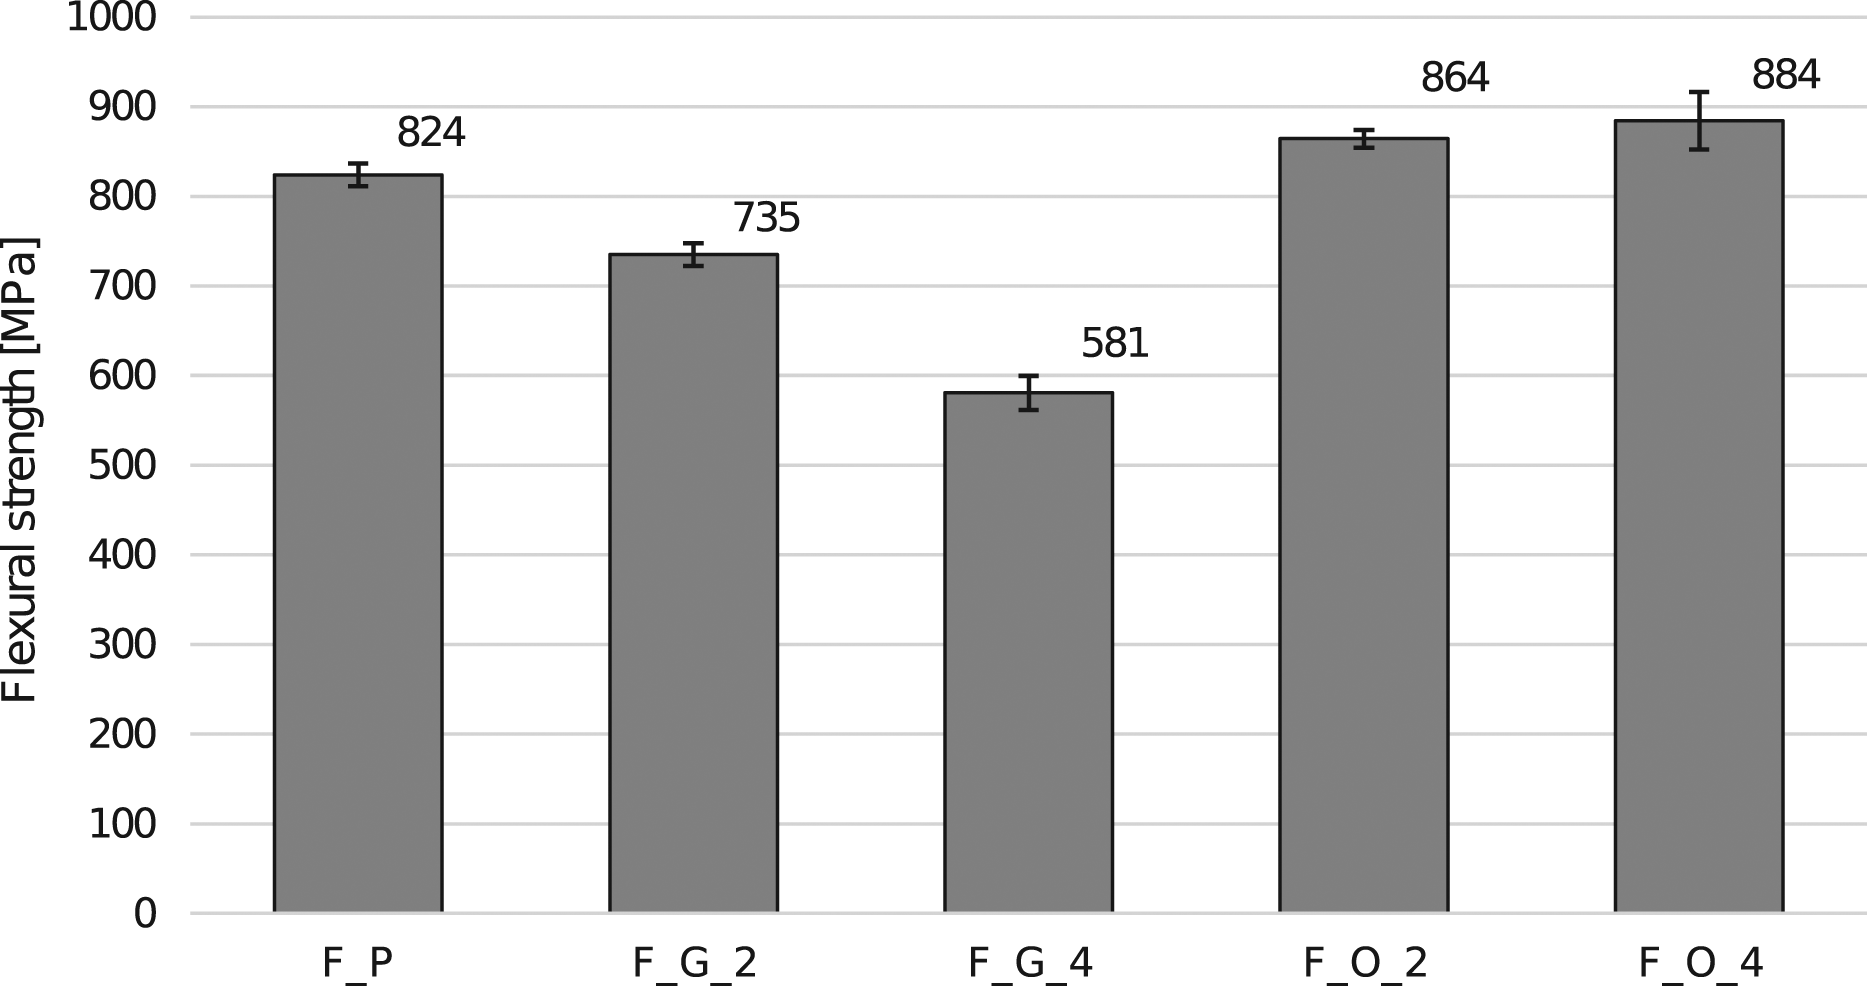
These findings can be explained by the out-of-plane undulations of the load bearing 0° fibers. As it can be seen in the micrographs, the presence of gaps leads to undulations of the 0° fibers towards the neutral axis causing a reduction in flexural strength. In case of a configuration containing overlaps, the out-of-plane undulations of the load bearing fibers lead to an increased distance to the neutral axis and therefore a higher flexural strength of the sample.
In-plane shear tests
The results of the in-plane shear tests are shown in Figure 15. As for the tensile and bending test results, at least five tests have been used to calculate the mean value. The error bars again represent the corresponding standard deviation. In-plane shear strength of different defect configurations.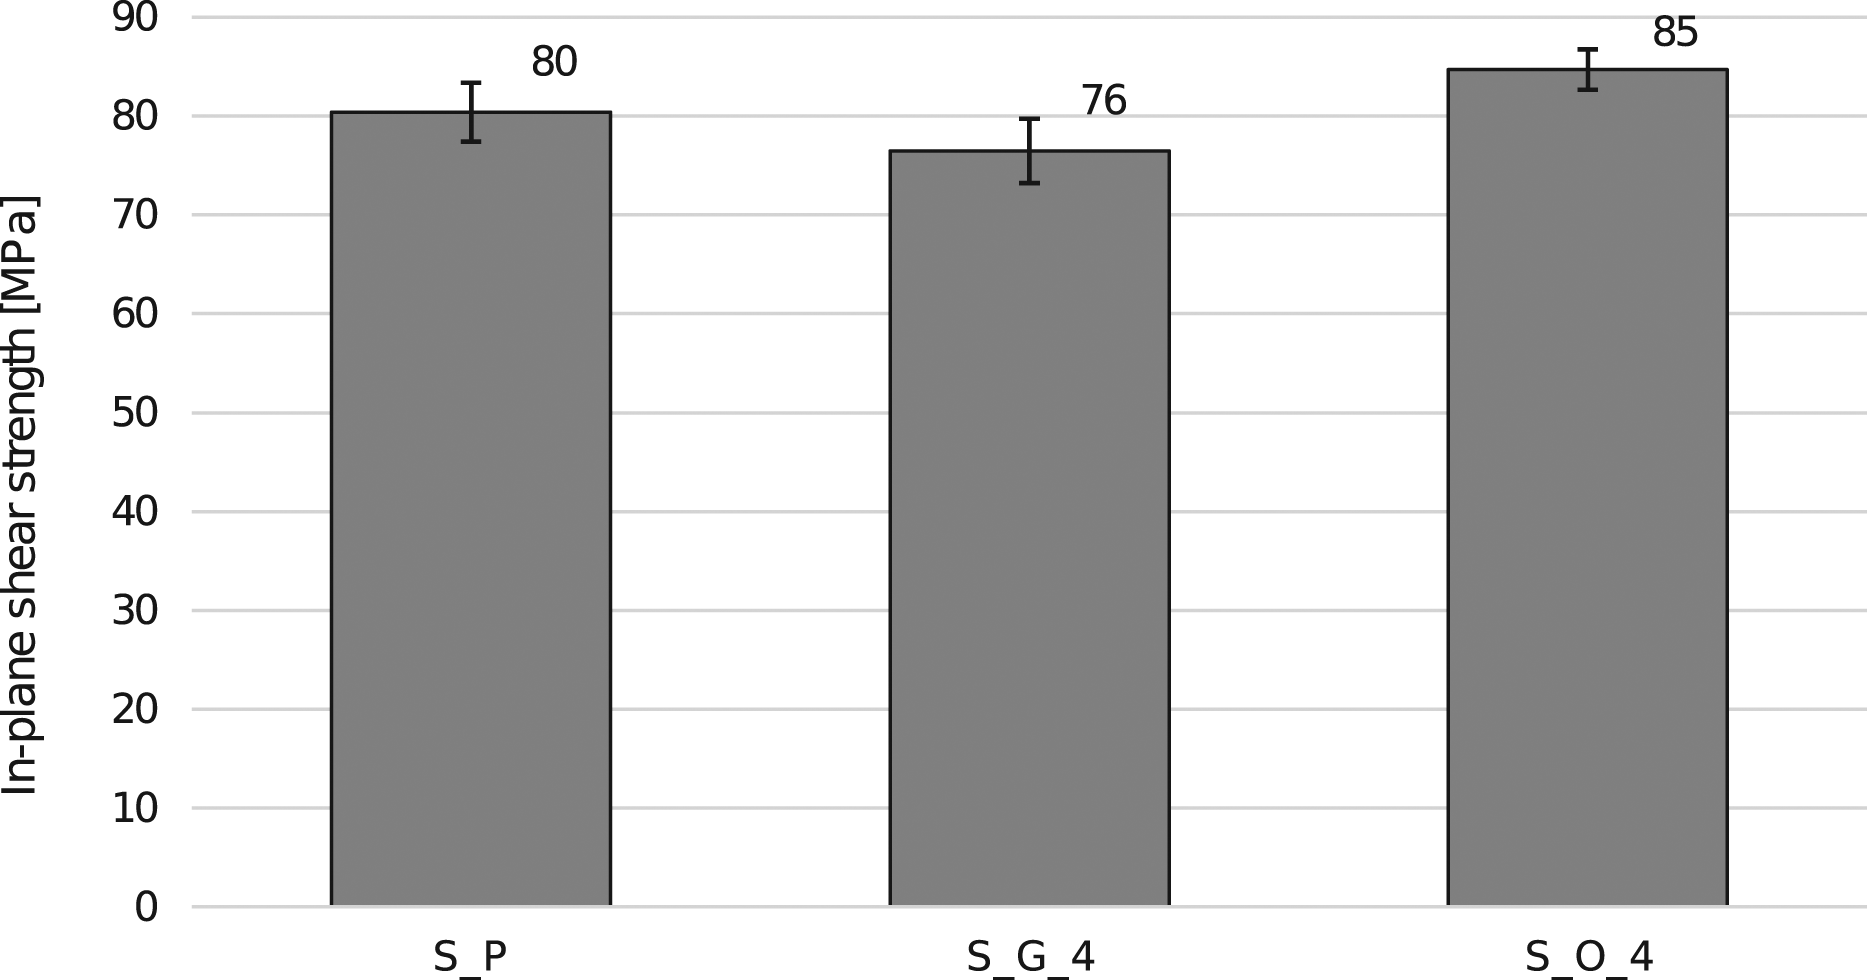
An average in-plane shear strength of 80 MPa was measured with the pristine samples. The integration of gaps caused a decrease of 5% leading to a value of 76 MPa. For the overlap configuration a strength of 85 MPa was measured corresponding to an increase of 6%.
The observed knockdown in strength can be attributed to the missing fibers in the laminate due to the four plies containing a gap. The micrographs show that induces a resin rich area in the specimens which causes the reduction in strength. Such resin rich areas can not be observed for samples containing overlaps.
Image analysis
The images of the defect and reference regions from the listed configurations, extracted using the pipeline described in the Image-processing sub-chapter, are now analyzed using geometric and statistical features. The goal of this analysis is to relate mechanical measurements, such as tensile tests, to the defect volume, which can be considered an image feature obtained from the 3D scanner system. The volume is derived from the multiplication of the area of the defect image (image width x image height) and the defect depth, which is defined as the difference between the grayscale intensity average of defect and reference region (see Figure 16). 3D visualization of a scan captured with the laser sensor system. Shown is a sample containing a gap. The defect region, reference region and the defect depth, that are used for calculating the defect volume, are marked.
Figure 17 shows the calculated defect depths for all tested configurations together with the corresponding standard deviation of the depth. Here, the formation of defects in the lay-up in measurement data can be seen. For specimen T_O_4 overlaps are generated in Ply 7, 8, 9, and 10. The increase in defect depth is correctly reproduced here, and in detail the increase per additional layer is also correctly reproduced by the constant slope. In contrast to this, sample F_G_4 shows a representation of a gap in which the depth falls into the negative due to the subtraction and the described behavior during the deposit and the inline scans with constant slope. For the two-layer expression of the defects (Ply 8 and Ply 9), the depiction in the measured data is analogous. The difference in the graphs T_G_2_T5 and T_G_2_T13 is due to the scan position. T5 and T13 indicate two different scan paths within the same layer and defect. In the T_G_2_T5 scan, the defect is closer to the edge of the sensor system’s field of view. In the case of gaps, this leads to a smaller observation angle and a less pronounced defect visualization in the scan image. In the case of overlaps, the changes in the defect visualization are much less pronounced, which is also confirmed in the two graphs T_O_2_T5 and T_O_2_T13 in Figure 17. Such effects must be taken into account in future investigations. Defect depths of the configurations discussed. While a negative slope of the depth curve across the plies indicates a gap, a positive trend indicates overlap effects.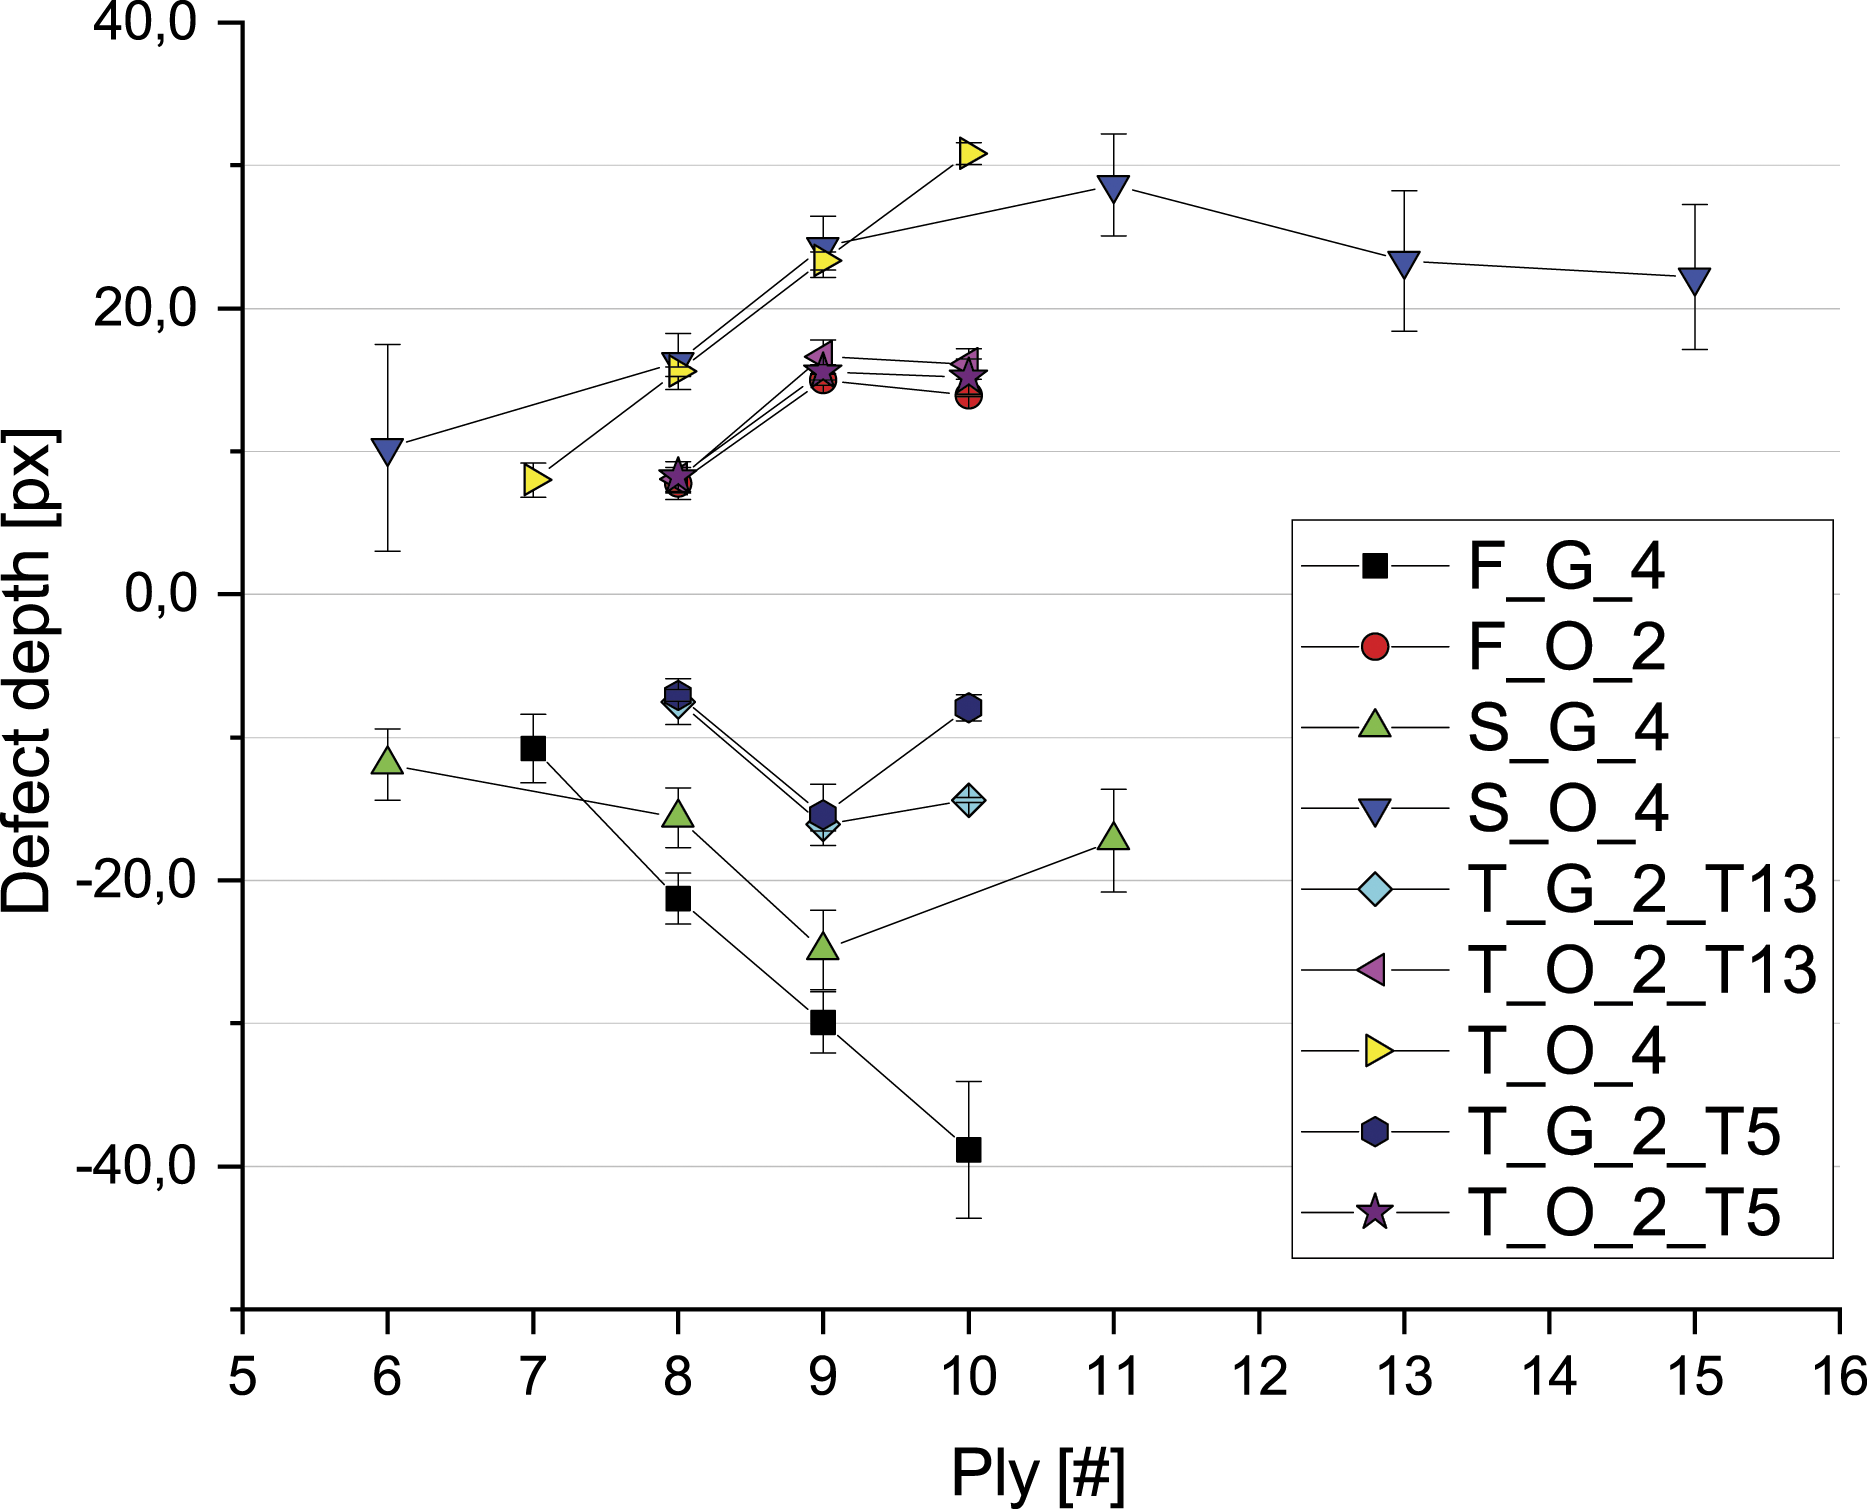
In the case of the in-plane shear samples and their measurement data, a different behavior can be observed. Overlaps remain very well visible in the sensor data even across cover layers. Gaps are bridged by cover layers and can therefore hardly be mapped by the sensor data (see Figure 2). This behavior is visible in the graphs of S_G_4 and S_O_4 in Figure 17. While the measured height in the measurement data for the overlaps adds up over the number of layers, the intermediate layers bridge the gaps and lead to an underrepresentation. In addition, the Graph for S_O_4 and the evaluated measurement data until Ply 15 indicate that overlaps in this range are well detectable at least until four cover layers with the sensor system.
Figure 18(a) shows the defect volumes of different sample types that have been calculated from laser sensor measurements. A correlation between the defect volumes and the undulations determined using microscopy can be seen in Figure 18(b). For both defect configurations (gaps and overlaps) the degree of undulation rises with higher defect volume. Subsequently, also a higher mechanical knockdown was observed for specimens with higher defect volumes and higher degrees of undulation, respectively. (a) Defect volumes of different samples derived from laser sensor measurements; (b) defect volumes in relation to the degree of undulation RU.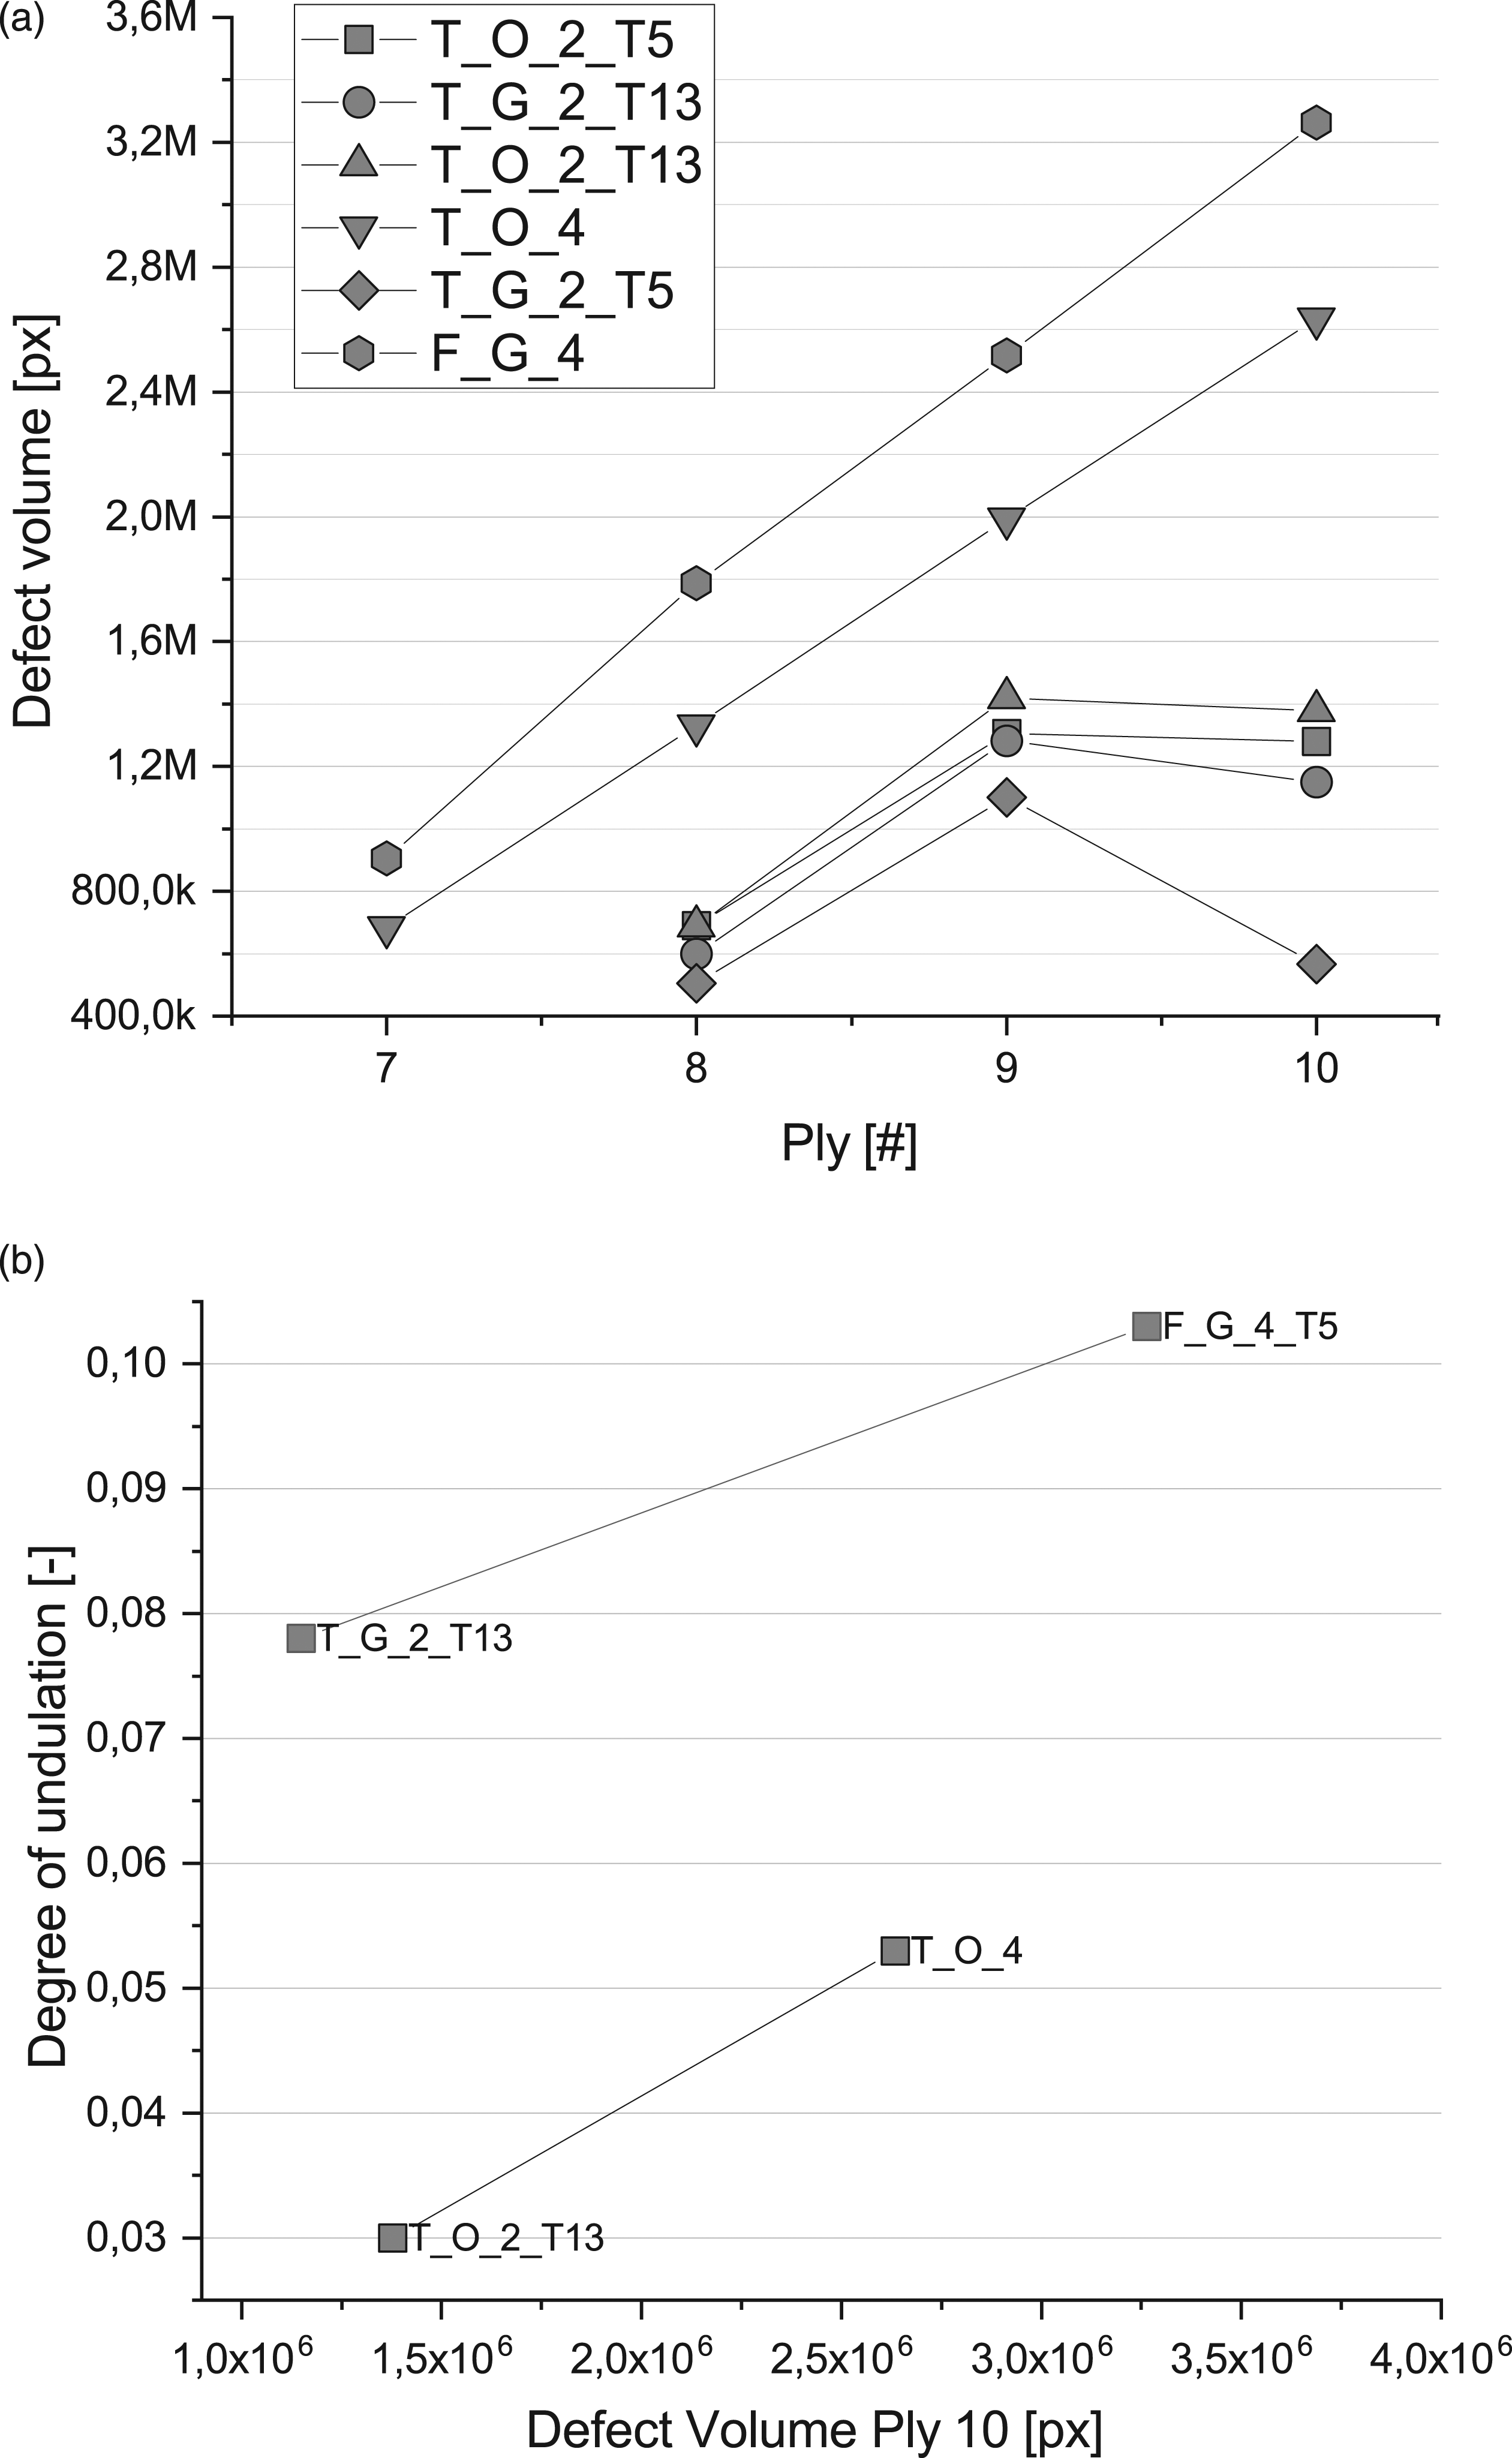
Following the multimodal sensor data analysis described by Rajesh and Chaturvedi, Pearson’s sample-based correlation coefficient is used to relate the mechanical measurements to the 3D scanner system measurements of the fiber placements.
28
Specifically, the sample correlation between the tensile test samples (T_*) and pixel-based volume metrics of the tensile samples is calculated. The correlation coefficient 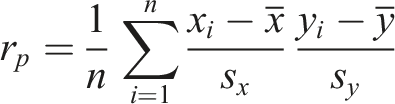
Conclusions
In the presented study the effect of different defect configurations on the mechanical performance (i.e., tensile strength, flexural strength and shear strength) was investigated. The goal was not only to determine the mechanical knockdown which is caused by the defects but to link them to manufacturing data generated by a process monitoring system during lay-up.
The tests showed a reduction of ultimate tensile strength of up to 20% depending on the defect configuration. Interestingly, a knockdown could only be observed when the defects reached a thickness of 4 plies which led to severe fiber undulations. Defects extending only over 2 plies showed no impact on tensile strength. Furthermore, a substantially higher reduction of the tensile strength was found for gaps compared to overlaps of the same size. This can be explained by the higher degree of undulations of the load bearing fibers that was observed for gaps. Bending and in-plane shear tests both showed an increase of the performance for samples containing overlaps and a decrease for samples with gaps.
The work carried out here also made it possible to establish a correlation between the defect volumes measured inline and the mechanical properties, in the form of tensile strength, for consolidated AFP specimens. It was found that tensile strength decreases with increase in measured defect volume (rp=−0.98). This evidence raises the possibility of future detection methods and the correction of the possible decrease of mechanical properties already during deposition. Moreover, due to the bridging of subsequent plies over defects, it can be concluded that the detection of defects has to be performed “inline” in order to allow for a reliable quantification of the laminate quality.
Further investigations must follow to substantiate the applicability for other characteristic values (shear strength, flexural strength). Particular attention must be paid to an ample amount of samples in order to ensure the validity of the statistical conclusions. Combined with the possibility of applying this technique to real components and to time-dependent phenomena, 24 this work is another crucial step towards inline monitoring of defects in the AFP process
Footnotes
Declaration of conflicting interests
The author(s) declared no potential conflicts of interest with respect to the research, authorship, and/or publication of this article.
Funding
The author(s) disclosed receipt of the following financial support for the research, authorship, and/or publication of this article: This work was supported by the Bavarian Ministry of Economic Affairs, Regional Development and Energy (grant number LABAY 93D); and the German Federal Ministry for Economic Affairs and Energy (grant number 20W1526F).