
Abstract
Cultural processes can reduce self-selection into math and science fields, but it remains unclear how confidence in computer science develops, where women are currently the least represented in STEM (science, technology, engineering, and mathematics). Few studies evaluate both computer skills and self-assessments of skill. In this paper, we evaluate gender differences in efficacy across three STEM fields using a data set of middle schoolers, a particularly consequential period for academic pathways. Even though girls and boys do not significantly differ in terms of math grades and have similar levels of computer skill, the gender gap in computer efficacy is twice as large as the gap for math. We offer support for disaggregation of STEM fields, so the unique meaning making around computing can be addressed.
Introduction
Some scholars have suggested that gender differences in STEM (science, technology, engineering, and mathematics) skills account for the underrepresentation of women in computing occupations (Hedges and Nowell 1995). But there is evidence that, like math scores, the gender difference in computer skills has narrowed (Aesaert and van Braak 2014) or does not exist. Other research shows that stereotypical beliefs and messages that men are “naturally” better at math and science have consequences for computing paths. Women tend to underestimate their skills in fields in which gendered stereotypes are active, and culminate in “biased” self-assessment (Correll 2001; Eccles et al. 1993).
For computing, the evidence of this phenomenon is less clear. Young people are assumed to develop computer skills in the course of engaging with the tech around them, but these notions are rarely unpacked. Surveys often focus on undergraduate populations, yet self-assessments of ability take form prior to college. Middle school is particularly consequential for the pipeline because it is when decisions are made about college preparation (Legewie and DiPrete 2014), but computer education is decoupled from U.S. early education (Google and Gallup 2015). Girls’ perceptions of computer ability may be dampened in the key period of middle school, perhaps more so than in other STEM fields, but without substantial controls for computer skills and comparisons among other STEM fields, the role of self-assessments in computing pathways will remain elusive.
In the current paper, we offer further clarification on the intersection of gender, skill, and self-assessments in STEM by providing cross-field comparisons. Specifically, we evaluate gender differences in academic efficacy (Bandura et al. 2001) across math, science, and computing with controls for skill and STEM grades. We do so using a diverse data set of 3,902 children in middle school, a particularly consequential period for academic pathways. We find that even though girls and boys have similar levels of computer skill, and do not statistically differ in math grades, the gender gap in computer efficacy is twice as large the gap for math. Self-reported math and science grades strongly correlate with their ability to learn measures and vary little by gender, but they offer minor predictive power for computer efficacy.
While our study is limited in that it is cross-sectional, our results suggest that the socio-psychological processes which affect self-assessments of ability may disadvantage girls, especially because they are not consistent in ways that promote or scaffold cross-field confidence. Children who perform well in math courses may not necessarily come to perceive they have substantial capacity to also learn computer science, for example, even when they are skilled in using digital devices.
Literature Review
The field of computing has significant consequences for communities, industries, and the state in terms of control over access, speech, privacy, marketing, and national security (Eubanks 2018; O’Neil 2016; Thebaud and Charles 2018), but it has so far been challenging to bring different voices to the field. A more equitable gender ratio in the computer industry, for example, may reduce some of the hostility experienced by women and other groups already working in the field and offer more role models to young people considering this path. But the most recent data trends show that 18 percent of computer science majors are women—approximately half the current representation in the other physical sciences and in a decline since 1986 (Corbett and Hill 2015; DuBow and Gonzalez 2020; National Science Foundation 2014). In this same period, women made significant inroads in other STEM majors such as the physical and health sciences, where the proportion of degrees conferred to women rose from 27 to 40 percent (Corbett and Hill 2015; DuBow and Gonzalez 2020; National Science Foundation 2014).
While sociologists have tended to address the demand-side processes which contribute to occupational gender segregation such as job queues and statistical discrimination, supply-side explanations may be equipped to shed more light on the computer science pipeline, investigating the factors which shape skills, attitudes, and occupational aspirations. Such phenomenon appears to influence interest, course planning, and the pursuit of a college major in STEM (Correll 2001; Riegle-Crumb, Moore, and Ramos-Wada 2011), especially in wealthy, liberal, individualistic, postindustrial countries such as the United States (Charles and Bradley 2006).
Prior research into the supply-side processes across STEM fields such as computer science has been somewhat limited because most studies are conducted within one or two domains of STEM and often draw from undergraduate samples. Decisions about pursuing science most often take place far before college, in middle school (DeWitt, Archer, and Osborne 2013; Jacobs et al. 2002; Tai et al. 2006). Thus, ability, experience, and socio-psychological processes could reduce women’s self-selection in computing, but it remains unclear how this differs from developing skill and confidence in math and science. Recent research shows that as early as elementary school, computer science and engineering gender stereotypes are stronger than stereotypes about math and science (Leslie et al. 2015; Master et al. 2017), and thus more evidence is needed about self-assessments across fields in this key period. Our review places focus on these comparisons.
Sources of Gender Differences in STEM Self-conceptualizations
Ability and performance
An explanation traditionally cited in the debate around women’s underrepresentation in STEM fields is that girls do not perform as well as boys in the core subject of mathematics (Hedges and Nowell 1995). Often considered a subject integral to all STEM fields, gender differences in math scores and other math outcomes are very minimal on average or do not exist (Else-Quest, Hyde, and Linn 2010; Reardon et al. 2019). In fact, girls tend to outperform boys on math tests in elementary school (Gibbs 2010), and the correlation between girls’ performance in mathematics and their aspirations for jobs involving mathematics appears very small (Charles and Bradley 2006). Boys are slightly more likely than girls to be represented among the very top math and science scorers in high school, but this small difference has probably minor impact on selection into STEM majors (see Cheryan et al. 2017). High school math scores formerly increased the statistical likelihood of majoring in computer science, but this relationship has slowly diminished over the last four decades, perhaps as computing has become an academic field of its own (Sax et al. 2015; Sax et al. 2017).
Alternatively, some have suggested that gender differences in computer skills may explain the decrease in women’s representation in majors, an assumption that is still alive and well as shown in a 2017 memo by former Google engineer James Damore. Research into computing task-skills is unfortunately rare for children. Although operational skills are possibly more influential when it comes to computing paths (Hargittai 2010; Helsper 2012), the limited evidence available shows that girls actually have more Web skills than boys (Aesaert and van Braak 2014). To better understand the role of computer skills in computing paths, the present study evaluates a range of tasks—Web skills as well as operational.
Experiences at home and school
A source of the gendered variation in STEM self-conceptualizations may derive from the contexts in which children learn these skills. Children increasingly encounter digital devices as babies and those from higher SES households may have more access and derive more familiarity with technology than other children (Xie et al. 2015; DiMaggio et al. 2004). A body of research suggests that children develop more interest and confidence when equal access is provided in low-stakes experiences which signal that children of all genders can engage and enjoy learning, thus countering stereotypes (Gee 2015; Hayes 2008). There is also some evidence that parents tend to give children toys which correspond with gender identity, a culmination of gendered store layouts, subconscious choices, and marketing (Coyle and Liben 2016; Weisgram 2016). Research has found that boys have greater access to STEM-related materials than girls (Archer et al. 2012), which may also apply to computers (Margolis and Fisher 2003). Even when home technologies are equally distributed, boys may more often monopolize alone time on a shared family computer, a significant advantage when it comes to the development of key operational skills gained in play (Gee 2003; Margolis and Fisher 2003). Similar phenomenon also shapes children’s experiences when it comes to early math and science learning at home (Bhanot and Jovanovic 2005; Crowley et al. 2001; Ford et al. 2006). Parents with more time and money to spend may reinforce children’s gender-stereotypical interests to a greater extent than other parents or simply invest in more gendered ways that extend already existing stereotypes (Dotti Sani and Treas 2016; Hao and Yeung 2015; Raley and Bianchi 2006).
School is also a context in which children develop attitudes toward learning. Math and science classes in K-12 are less likely to be taught by women than other subjects (Banilower et al. 2013) and teachers may reinforce gender stereotypes (Upadyaya and Eccles 2015). It could be that math and science and their designation as “core” curricula have been successful in that it builds children’s skills and confidence in these fields. The gender difference in math competence net of math scores is well documented (Correll 2001; Eccles 1994; Eccles et al. 1993), and children who perform well in high school math and science are generally more likely to choose a STEM field in college (Wang, Eccles, and Kenny 2013). Indeed, women have made great strides in recent years in STEM fields overall (DuBow and Gonzalez 2020; National Science Foundation 2014). But a growing body of evidence suggests that girls with more options available to them are less likely to choose computing. That is, when children with high math competence also have high verbal competence, they are less likely to pursue STEM careers. More often than boys, girls develop competence in both areas (Ceci and Williams 2010; Ceci, Williams, and Barnett 2009; Wang et al. 2013).
Thus, the current debate about computing paths has tended to shift from considerations of where girls are deficient to rather the ways in which girls develop interest (Ceci and Williams 2010). In the United States, many children have less experience with computer science as an academic pursuit in comparison with math and the life sciences because the former is rarely part of early education curricula (Google and Gallup 2015; Puckett 2019). In a survey of 1,697 elementary school principals, 60 percent reported that their school did not offer any computer science courses, most often citing a lack of state evaluation of this particular subject matter. Of the courses offered, only 21 percent included learning “what makes computers work the way they do” (Google and Gallup 2015:43). When computer science courses are available, most often they are not required or “core” which lessens the rate at which girls elect to take them (Buchmann and Dalton 2002; Charles and Bradley 2006, 2009). Even when girls elect to take computer courses, math and science grades have not been shown to have significant correlation with middle schoolers’ interest and self-assessments of computer ability (Leaper and Brown 2008: 689). Girls may have higher academic standards for themselves than boys (Mann and DiPrete 2016), relying more on grades to inform their identity, which might be a disadvantage when it comes to academic subjects not part of the core curriculum, such as computing.
Culturally shaped beliefs
In addition to skill and experiences, culturally shaped beliefs such as those embodied by stereotypes may impact self-conceptualizations differently across STEM. Beliefs about the importance of a particular field, the people who work therein, and the overall climate may impact self-conceptualizations. Research finds that women tend to underestimate their skills in fields which are traditionally associated with men and culminate in “biased” self-assessment (Correll 2001; Eccles et al. 1993). That is, even when skills are taken into account, women and girls perceive that they know less than similarly skilled men and boys. Performance and skill development may be dampened when there is a perceived threat of being viewed as an imposter in a masculine field (Steele 1997), but the meanings attached to distinct fields likely vary and also play a part (Correll 2004).
More recent research suggests that self-conceptualizations are influenced by the history of individual fields, the occupations therein, and perceptions of who has tended to signal ability and interest in them (Thebaud and Charles 2018; Wynn and Correll 2017). While it is often assumed that children will develop positive attitudes toward learning computer science on their own (Prensky 2001), the “boy hacker icon” is unique to the field of computing. A culmination of brilliance, a rebellious personality, and raw talent (Margolis and Fisher 2003), this stereotype is common in American culture, such as in the case of the social cache applied to “tech gurus” such as Steve Jobs. “Brilliance narratives” around what is essential for success in these fields—intelligence and agency as opposed to communal traits—broadly maps onto the distribution of men and women across STEM fields (Cheryan et al. 2017; Leslie et al. 2015). Fields which are believed to require natural ability—such as computer science, engineering, and physics—are also the fields in which women are most underrepresented in comparison with fields such as biology (Leslie et al. 2015; Meyer, Cimpian, and Leslie 2015). This is especially important for young people because beliefs around innate ability or a “fixed” mind-set as opposed to a growth mind-set may not only dampen academic performance (Perez-Felkner, Nix, and Thomas 2017; Yeager and Dweck 2012) but bias people’s understanding of their own aptitudes and affinities (Charles 2017; Correll 2004).
Self-conceptualizations which include confidence in learning computer science may also be different from simple understandings of one’s current tech skills. For example, while perceptions of skill may be grounded by tasks a child can execute on a device as well as test scores, grades, and other outcomes, abstract notions of interest and ability may be more vulnerable to stereotypes. Self-rated skills and confidence measures have tended to be grouped together as “expectancies” in other STEM research (Wigfield and Eccles 1992). This is partly justified by research finding that math scores are positively related to math confidence (Perez-Felkner et al. 2017) as well as career aspirations in math and science (Riegle-Crumb et al. 2011). However, perceived skill and confidence in computing may not be as strongly related when it comes to tech and tech fields due to gender-differentiated feedback in various modalities of usage (Cotten, Anderson, and Tufekci 2009; Lent, Brown, and Hackett 1994). Psychologists and others have noted that the consideration of one’s current capabilities is fundamentally different from understanding one’s potential to succeed in an academic field (Bandura 1997; Lent et al. 2011; Watt 2006). For example, even though many girls develop interest and confidence in using the devices around them, the computer science stereotype is currently that of an isolated, antisocial individual, which can be unappealing because it is incongruent with gender norms (Cheryan et al. 2009). In the last 20 years, the number of devices available commercially has vastly expanded which may be a good thing because it affords children more opportunities to learn technology (Prensky 2001). On the contrary, the inundation of digital assistance technology, digital gaming devices in addition to cell phones and computers, may elicit more messaging about gender and innate ability than in science and math, especially because tech learning primarily takes place in informal settings such as the home.
The Current Project
Given the important role of self-conceptualizations in STEM pathways, we explore gendered self-assessments for distinct fields within STEM. We do this in two ways, first evaluating gender differences in children’s confidence in their ability to learn computing, math, and science, and use Albert Bandura’s (1997; Bandura et al. 2001) measure of academic efficacy, asking students to report their perceptions of competence in these three subjects, a reliable indicator suited for children. We also separately examine perceptions of computer skill to explore the extent to which they are affected by various measures associated with home and school experiences. As mentioned above, we do so using a unique data set of middle school students, a key period for STEM pathways. Middle school is when decisions are made about college preparation (DeWitt et al. 2013; Legewie and DiPrete 2014), yet authentic performances of gender are especially prized in early adolescence, perhaps more so than at any other time in the life course (Crouter et al. 2007; Williams 2006). Developmentally and socially, the middle school grades tend to be a period of gender intensification. Often the conglomeration of several elementary schools, it is a time in which norms and social hierarchies shift to become more influenced by friendships than by parents and increasingly complex. Same-sex friendships become especially important for social support and identity (Wentzel, Barry, and Caldwell 2004) as children are introduced to more specialized classes and more involved extracurricular activities (Hill, McQuillan, Spiegel, and Diamond 2017; Sáinz and Eccles 2012). While math and science interest also declines over the course of the middle school grades (Hill, McQuillan, Talbert, et al. 2017; Simpkins, Davis-Kean, and Eccles 2006), computer efficacy may decline more dramatically over the middle school grades as students attend to their core classes.
Most studies of academic efficacy have focused on a single domain in STEM, usually math. Few studies distinguish between the different STEM fields and no studies, to our knowledge, test these three fields separately in this population. Although our research design and measures are limited, such comparisons may shed light on how computer science develops at this stage of the life course. Some research has not found a gender difference in science self-assessments in comparison with math, for example (Simpkins et al. 2006), while others have found a gender difference in middle schooler’s science efficacy (Hill, McQuillan, Spiegel, and Diamond 2017). In a survey of fourth and fifth graders, Shank and Cotten (2014) find that boys have more math and science efficacy than girls by 0.55 standard deviation (SD) units while the gender difference, still skewed toward boys, is considerably lower for technology efficacy: 0.15 SD units. However, they use a combined measure for math and science and inconsistent controls for skill across the domains.
To be clear, our study does not have the capacity to determine exactly why there may be gender differences in academic efficacy or perceived skill, nor will the causal relationship between interest and confidence come to bare. Moreover, we cannot fully account for skills in such a way that only “biases” remain. Although not ideal, math grades, science grades, and a task-based skill measure will serve to disentangle somewhat the issue of skill from self-assessment, possibly teasing apart the more grounded aspects of computer knowledge from more ambiguous notions around self-competence. Using ordinary least squares (OLS) regression, we will compare gender differences in SDs across the different models presented.
Based on our review of the literature, we therefore hypothesize the following: Even though STEM fields broadly require very similar forms of ability, the gender differences in computer efficacy may be larger due to the aforementioned role of parent resources, a lack of computer education in school, and more strongly gendered stereotypes in computer science.
Even though they are often grouped as “expectancies” in Eccles et al.’s expectancy-value models (Eccles 2005; Eccles and Wigfield 2002; Wigfield and Eccles 2002), we are interested in the ways in which computer skill and self-assessed ability may show different gender gaps—perhaps deriving from different social processes (Watt 2006). We hypothesize that perceived computer skill gender differences will not be as large as the difference in computer efficacy because it is more grounded in computer task-skills.
Method
Sample and Data Collection
This study reports analyses of a sample of middle school students in the Southeastern United States. The qualitative results were collected between November 2013 and October 2014, consisting of eight focus groups across two schools that included a total of 93 students. In-depth interviews were also conducted with 24 students which were then transcribed and coded. The survey instrument was developed in light of the findings of the qualitative phase. We then piloted 300 surveys in one school prior to full data collection. After preliminary analysis, questions were added to the survey, and the instrument was finalized with the institutional review board (IRB). The survey was then administered to the main sample in the fall of 2015 through the spring of 2016. The survey was administered in classrooms, in a paper-and-pencil format, resulting in an initial sample of 5,235 students (see below). On average, surveys were completed in 30 minutes.
Respondents derive from a stratified sample of middle schoolers in three school districts in the Southeastern United States. We focused on obtaining a sample that was diverse and large enough to allow us to answer our research questions with sufficient statistical power (Cohen 1992). The selection of schools was based on the proportion of children qualifying for reduced lunch as well as proportions of Black, Hispanic, and Asian students according to publicly available information. We gained permission to survey 15 schools in total, including 13 public schools (magnet and nonmagnet) and 2 private schools. The proportion of students surveyed in each school was dependent on degree of access (including sign on from principals and teachers) and surveyor resources. The student response rate was high, partly due to receiving IRB approval for an “opt out” form. 1 We aimed for a near census of the schools to which we gained access and, on average, we sampled a median of 83 percent of the school populations according to publicly available information about each school. In the circumstance that we were not able to survey all students due to limited staffing and other issues, a convenience sample was achieved, though we were careful to include a representative sample whenever possible. As such, the proportion of White, Black, Hispanic, and Asian students surveyed in each school very closely resembles each school’s publicly reported information. 2
As mentioned above, the three counties we surveyed are located in the Southeastern United States. The U.S. South has higher poverty rates than the national average, and there is some evidence that gender differences in math and English language arts scores in the Southern region reflect more traditional stereotypes about gender-appropriate careers (Pope and Sydnor 2010). Reardon et al. (2019) find that the gender difference in math and English language arts state accountability tests tend to reflect the Pope and Sydnor findings but there is considerable variation by school district. The three counties we surveyed are representative of the majority of counties in the United States in that the gender difference in math is −0.05 to 0.05 SD units and −.35 to −.25 SD units for English language arts. This is not to say that the respondents do not have less traditional notions of gender norms, only that this is not evidenced by the available information. Unfortunately, we do not have measures to evaluate respondent gender beliefs, and readers should take caution in this respect.
A significant portion of respondents in our sample had at least one parent who worked in a STEM field, but this information was missing for almost half of respondents. Among those with nonmissing information, 37 percent reported a parent in a STEM field. This means that the true value in our sample is at least as high as the national average of 20 percent (Sax et al. 2015), and likely higher due to the academic and industrial makeup of the survey area. 3 Our respondents may be more knowledgeable of STEM fields than other children in the United States, and thus caution should be taken when generalizing from the results.
We identified a consistent analytic sample with information for all models. This sample was demographically similar to overall. Applying listwise deletion reduced our sample by 25 percent but did not significantly change the mean SES, the gender differences across the models, nor the substantive results. Demographic characteristics of the sample are described in Table 1. Overall 36 percent of the sample is estimated to receive reduced cost lunch. While typically underrepresented in surveys of this kind, Black students comprise 16.9 percent of the data set (658 respondents), Hispanics 11.6 percent (430 respondents), Asian Americans 10.8 percent (420 respondents), and multiracial children 16 percent (623 respondents).
Demographics of Combined Sample (N = 3,902).
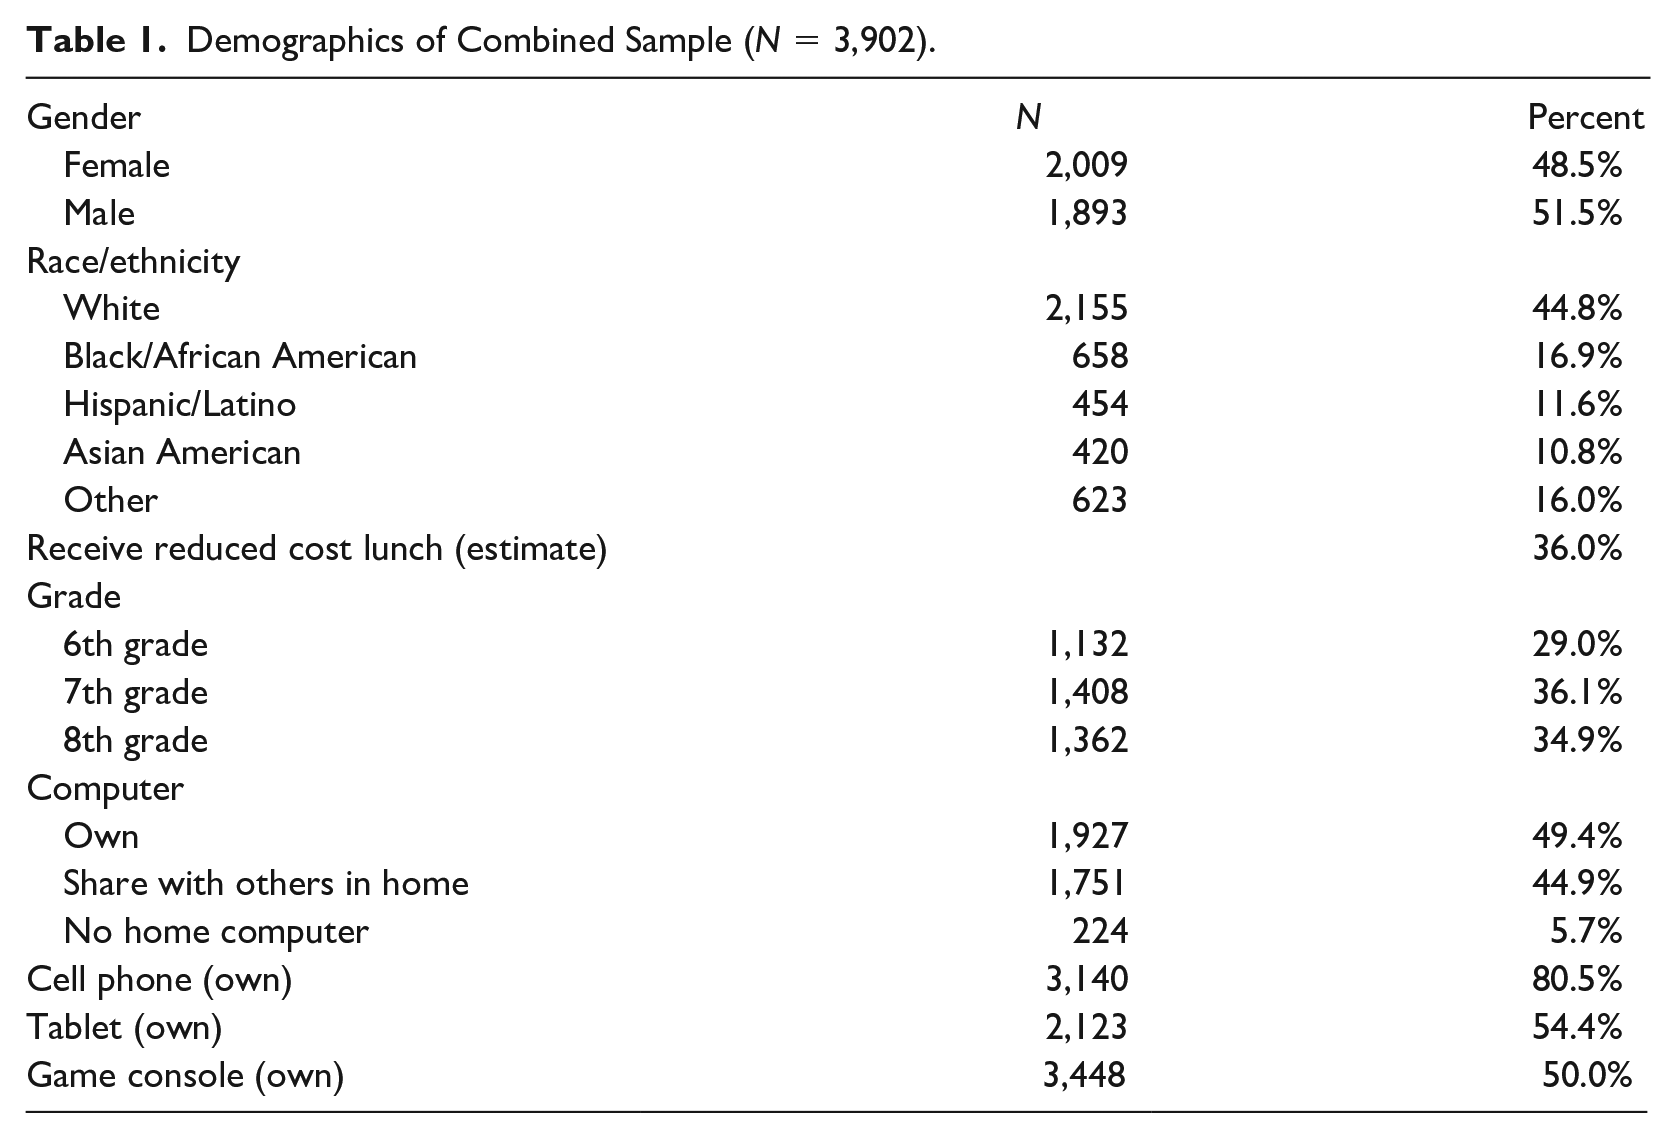
We have also included the device ownership measures in Table 1. Although the trends found in our sample are similar to those found nationally (Anderson and Jiang 2018), there is additional granularity when it comes to computer access. That is, we distinguish between sharing and owning a computer because more autonomous access may be a factor in learning and attitudes (Margolis and Fisher 2003). Notable is the large gender difference in gaming console access with 35 percent of girls and 67 percent of boys reporting that they owned this device. Adding those who share a console to those who own, girls and boys had about equal access to gaming consoles in the home (similar to Anderson and Jiang 2018—84 and 94 percent, respectively).
Measures
Dependent variables
As mentioned above, academic efficacy is a measure which evaluates perceived competence in a specific field of academic study and was developed by Albert Bandura et al. (2001). We emulate this wording and scale. Students in the survey were asked: “Please rate how well you feel you are able to do each of the things described below” with the numbers 1 through 10 listed for them to circle. “Learn math,” “learn science,” and “learn computers” were included in the list of five items (see Figure 1). Our measure is future-oriented and specific to academic learning of computers, math, and science.
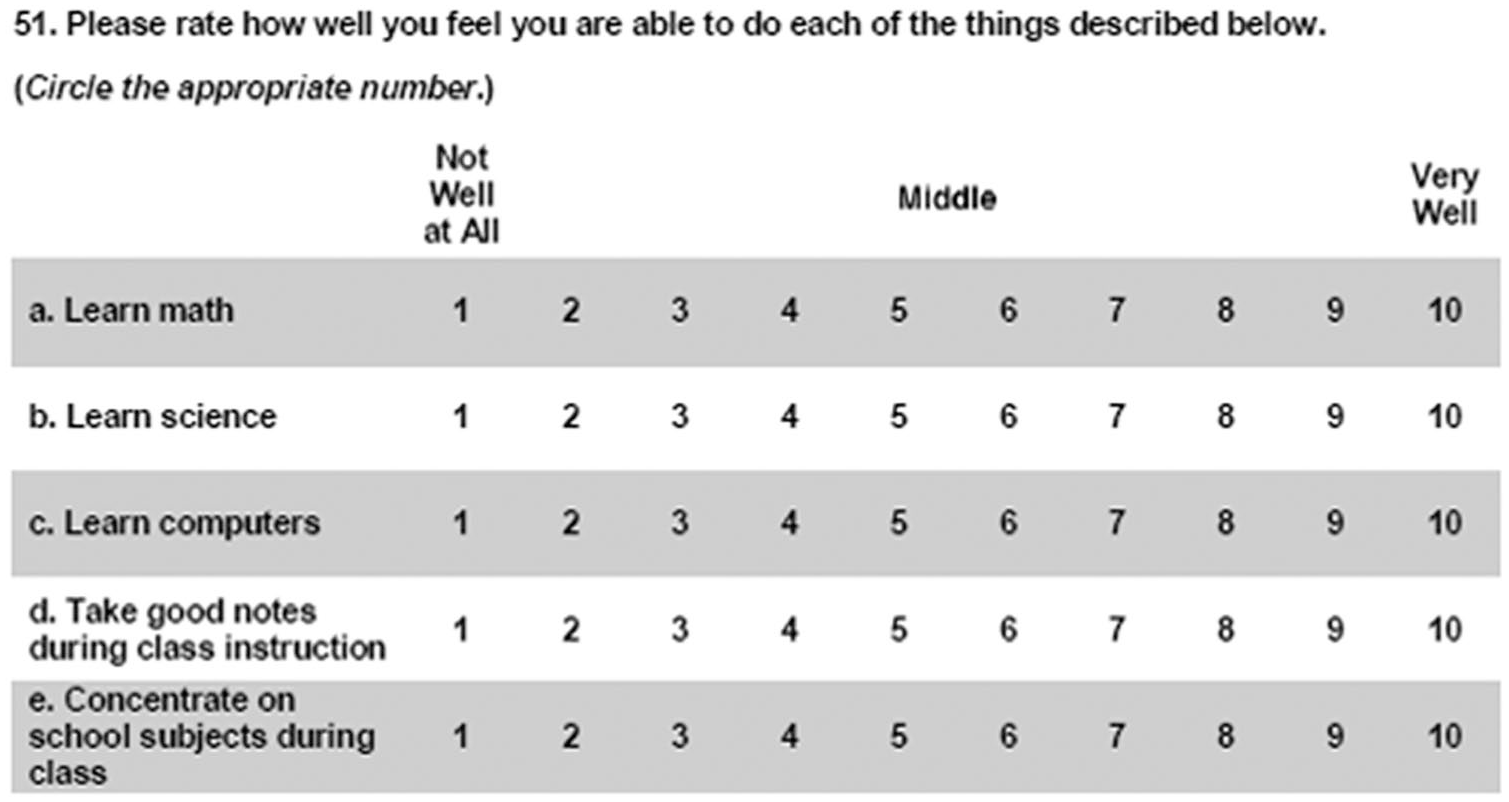
Measures of academic efficacy in survey.
Perceived computer skill is a measure similar to Eszter Hargittai and Steven Shafer (2006). Prior research suggests that access, usage, and skill associated with computers are generative in computer science pathways, more so than other devices (Goode 2010; Margolis et al. 2017; Margolis and Fisher 2003). 4 Perceived skill is a dependent variable in the second multivariate analysis to examine its correlates. It is derived from the question on the survey, “How skilled are you in each of the following?” and reported on a scale of 1 to 10, similar to Hargittai and Shafer (2006), though these authors used a scale of 1 to 5.
Variables of interest
Our task-based skill measure (or “task-skill” for brevity) is a scale generated from a list of 12 tasks that students reported to have done on a computer (0–12). Respondents netted an additional point on the scale for each task completed. Self-reported task familiarity constructs have good predictive power of actual skills completed in a lab environment (Hargittai 2005, 2008; Hargittai and Hsieh 2011; Hargittai and Kim 2010). Our index consists of a battery of self-reported literacy items in using software, hardware, and the Internet, and is similar, in many respects, to a more recent survey, the National Assessment of Educational Progress Computer Access and Familiarity Study (NAEP 2019). Specifically, respondents were asked to report whether they had attached a file to an email, rebooted a computer, connected to wifi, uninstalled programs, used task manager to stop a nonresponsive application, operated a computer from its command line, and so on. The Cronbach’s alpha for the tasks is .76. As task difficulty increased (attaching a file to an email, for example, as opposed to using a computer from the command line), the proportion of children who had “done” the task declined. Also, between computer efficacy and perceived computer skill, the task-based skill measure is the only one which is positively associated with grade level, corresponding with skill accumulation over the middle school grades (see Table 3). Although self-reported tasks do not necessarily indicate actual skill, this method of gauging skill may be an improvement from other measures, such as time spent on a computer per week, one or two survey items that address Web-related tasks (such as in the case of the General Social Survey), or overall self-rated skill (Hargittai 2005, 2010). We nevertheless take caution when interpreting this variable as it is subject to self-report error. Children who do not recognize a particular term might underreport their experience in having done a task or simply not recall having done a task. Although we also asked respondents in a separate measure if they had “heard” of each of the items and not done it (as opposed to having heard of the term and done it), there is a possibility that self-reports may be inflated if students are particularly confident with computers and other technology.
Given the limitations of our computer task-skill measure, we also include the perceived skill measures in the academic efficacy models as they may provide coverage for other skills which are not included in the battery of questions which make up the task-skill measure, for example. We include all of the perceived skill measures (perceived skill in using a computer, cell phone, tablet, and console) in the academic efficacy analyses as controls to indicate the kind of experience respondents have in using specific devices at home or at school.
Control variables
SES is likely related to self-conceptualizations, but children tend to lack knowledge of parental income and family wealth (see Kolenikov and Angeles 2009). Our measure of SES is a composite adapted from the measure of SES in PISA (Programme for International Student Assessment 2014, Chapter 16), a well-known cross-national comparison of 15-year-old student achievement. PISA combines parents’ highest education, highest occupation socioeconomic index, 5 and an index of 23 household items intended to measure wealth, cultural possessions, and educational resources. The weights assigned to each component are empirical; they come from the principal components analysis. We emulate the PISA measure of SES, the only exception being that we use a different index in the place of home possessions. While PISA uses items in the home such as dishwashers, televisions, and telephones, we expected that there would not be enough variance in these items to be indicative of the differences in wealth and resources across our sample. PISA also includes computers in their list of home possessions but, as an item of interest in our study, this item needed to be used separately in the analysis. Our modification for the purposes of this project was to use books in the home as a measure of human capital together with parental education (used by PISA as well as the Trends in International Mathematics and Science Study [TIMSS] and the NAEP), as well as a measure of home crowding, a proxy for a household’s consumption capacity or a resource constraint. Other research has looked at number of siblings as a constraint on financial resources as well as parental attention (Cowan et al. 2012), but home crowding should better reflect the abundance or lack of resources across different outcomes of interest compared with home possessions. 6 Our analysis showed that our SES composite measure explains more variation in respondent math grades than simple household size. 7 Our SES variable has a mean of 0 and an SD of 1, and ranges from −5.58 to 1.52.
Our variables describing race and ethnic origins derive from an item on the survey, “What is your race or origin? Check all that apply” with the following categories: “White,” “Black or African American,” “Hispanic/Latino/Spanish,” “Asian (including India/Pakistan),” “Native American,” and “other: specify.” Our measure is similar to the combined race and ethnicity question, described in Krogstad and Cohn (2014), which has been found to significantly improve the identification of Hispanics (Cohn 2017). Only those respondents who placed themselves in the single-race category were coded as such. The “other” category was checked for answers consistent with multiracial identity. Children who indicated “White” and also reported European American lineage in the “other” section were coded as White. The “other” category consists of Native American and multiracial children. Readers thus need to be careful when interpreting the “other” category or making comparisons to it. 8 The “race” categories in all regression analyses are dummy variables. The omitted category is “White.”
As mentioned above, we distinguish between sharing and owning devices. The tech ownership measures are constructed from a question on the survey which asked respondents whether they own a computer, cell phone, tablet, or gaming system, and whether they have their own device, whether they shared it with people in their family, or whether they did not have the device. Answers to these questions were coded as “owning,” “sharing,” or “not having.” Ambiguous answers were coded as missing.
Math grades and science grades are self-reported. Higher values indicate As, lower values indicate Ds, and so on. To be clear, this measure is not a sufficient control for skills in math and science. As Robinson and Lubienski (2011) show, the gender gap in math achievement scores widens over the elementary grades, with boys outscoring girls. Furthermore, teachers tend to rate girls’ math abilities higher than those of boys despite boys’ higher performance on achievement tests. In addition, respondents may inflate their performance when they report their grades, especially if they are lower performing (Rosen, Porter, and Rogers 2017). Without measures to account for these phenomena, there are limitations on our ability to isolate the effect of math and science skills from math, science, and computing efficacy. Readers are advised to take these issues into account when considering the analyses below, and we address this further in the “Limitations and Future Work” section.
Missing Values
Stata applies listwise deletion to observations with at least one missing value in any variable. Without accounting for this, sample sizes will change from model to model, which limits the ability to compare the effect of gender across all analyses. We identified a consistent analytic sample with information for all models by generating a dummy variable using Stata’s missing() feature. The following descriptive statistics, correlations, and regression models include only those respondents who have nonmissing data across all models. While this reduces our sample size overall by about 25 percent (from 5,235 to 3,902), the substantive conclusions reached did not change.
Analytical Strategy
Our analysis takes place in two main parts. First, bivariate analyses evaluate the extent of the gender differences across the dependent variables—academic efficacy (math, science, computing) and perceived computer skill (Table 2)—and then the correlations are presented (Table 3). Task-skill, grades, and perceived skill in using devices are included as we are attempting to isolate self-assessments from actual skill. Second, multivariate analyses (OLS regressions) reflect our two hypotheses and evaluate gender differences across the three academic efficacy measures as well as perceived computer skill, net of computer task-skill, grades, and the control variables. To make comparisons across the two kinds of dependent variables in the multivariate analyses (four dependents in total), we standardized them. Computer task-skill is also standardized in the multivariate analyses. Thus, the coefficients in Tables 4 and 5 should be interpreted as changes in SD units in the dependent variable. We use the notation of “SD” to denote this.
Bivariate Analyses for Dependent Variables and Variables of Interest.
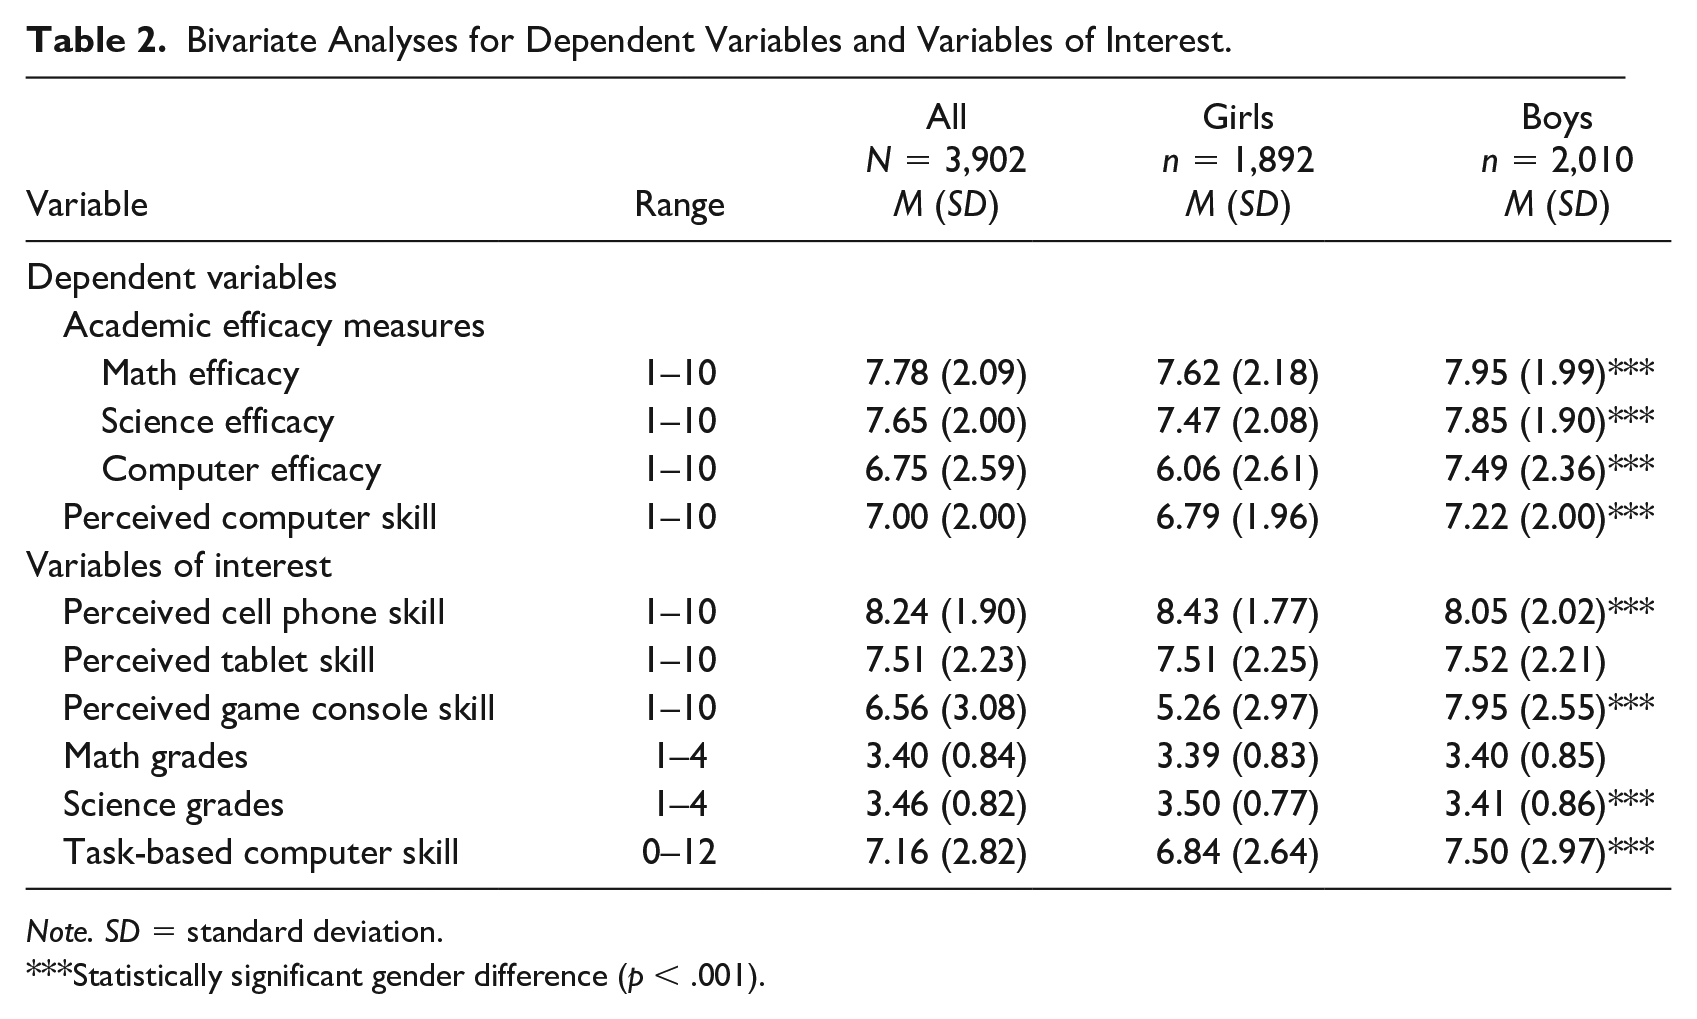
Note. SD = standard deviation.
Statistically significant gender difference (p < .001).
Correlation Matrix—Variables of Interest (N = 3,902).
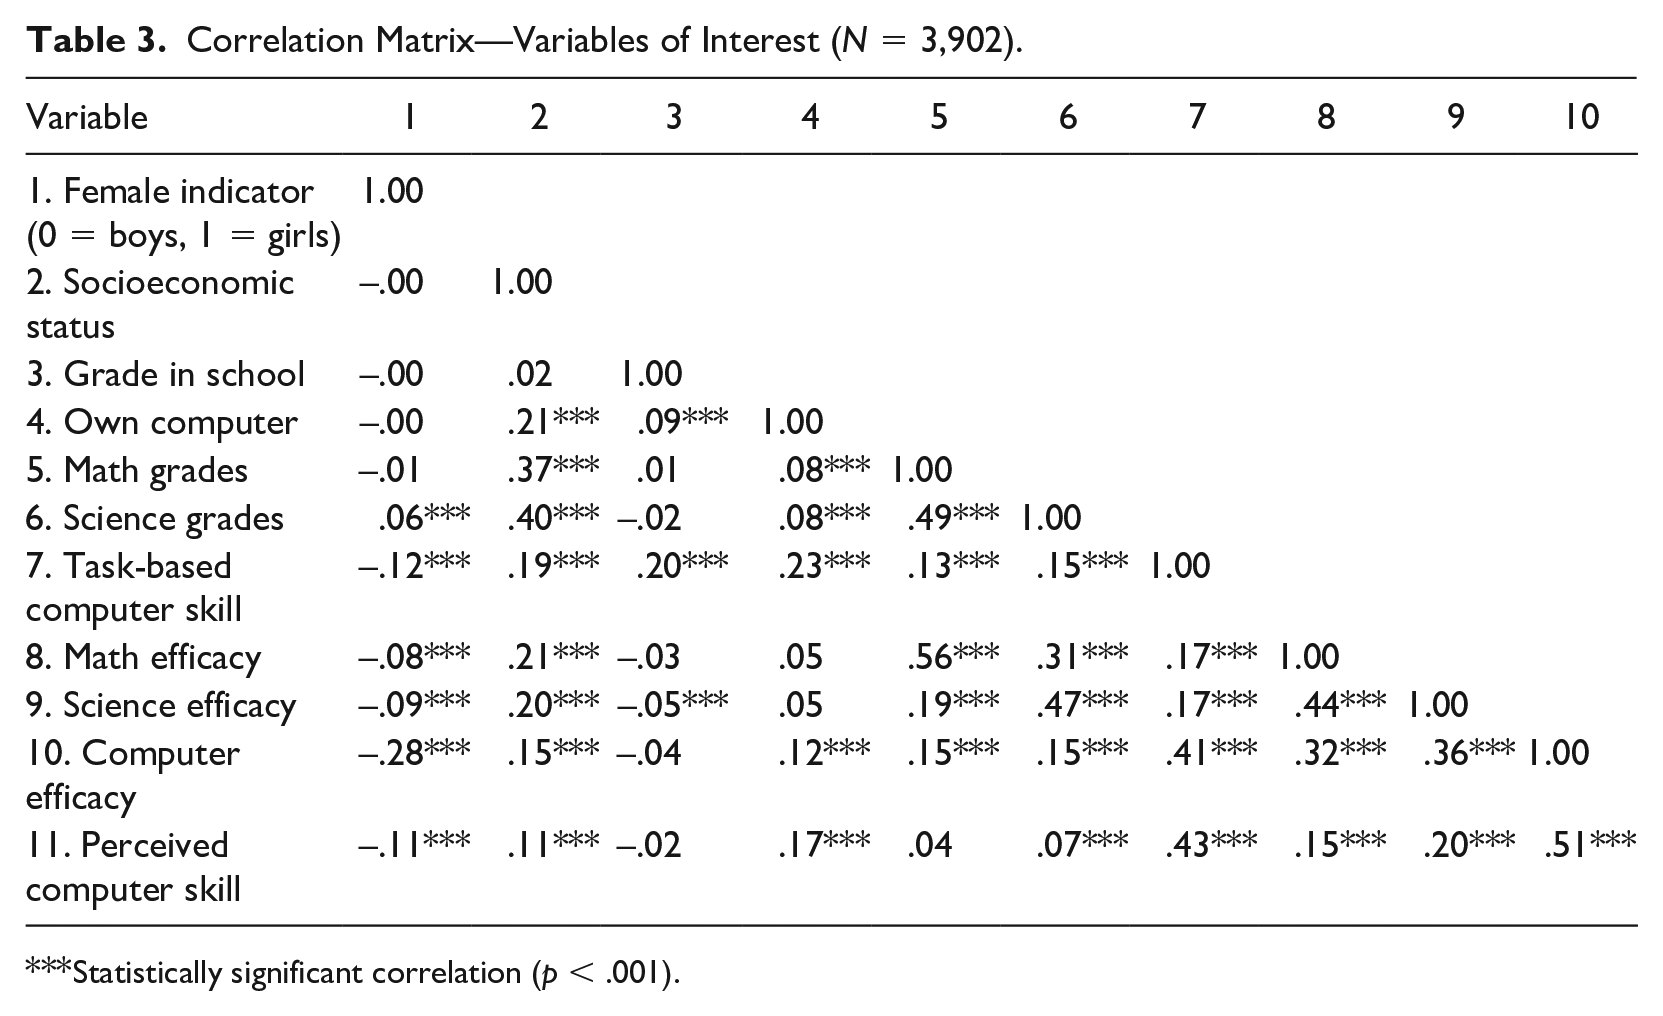
Statistically significant correlation (p < .001).
Linear Regression of Math, Science, and Computing Efficacy.
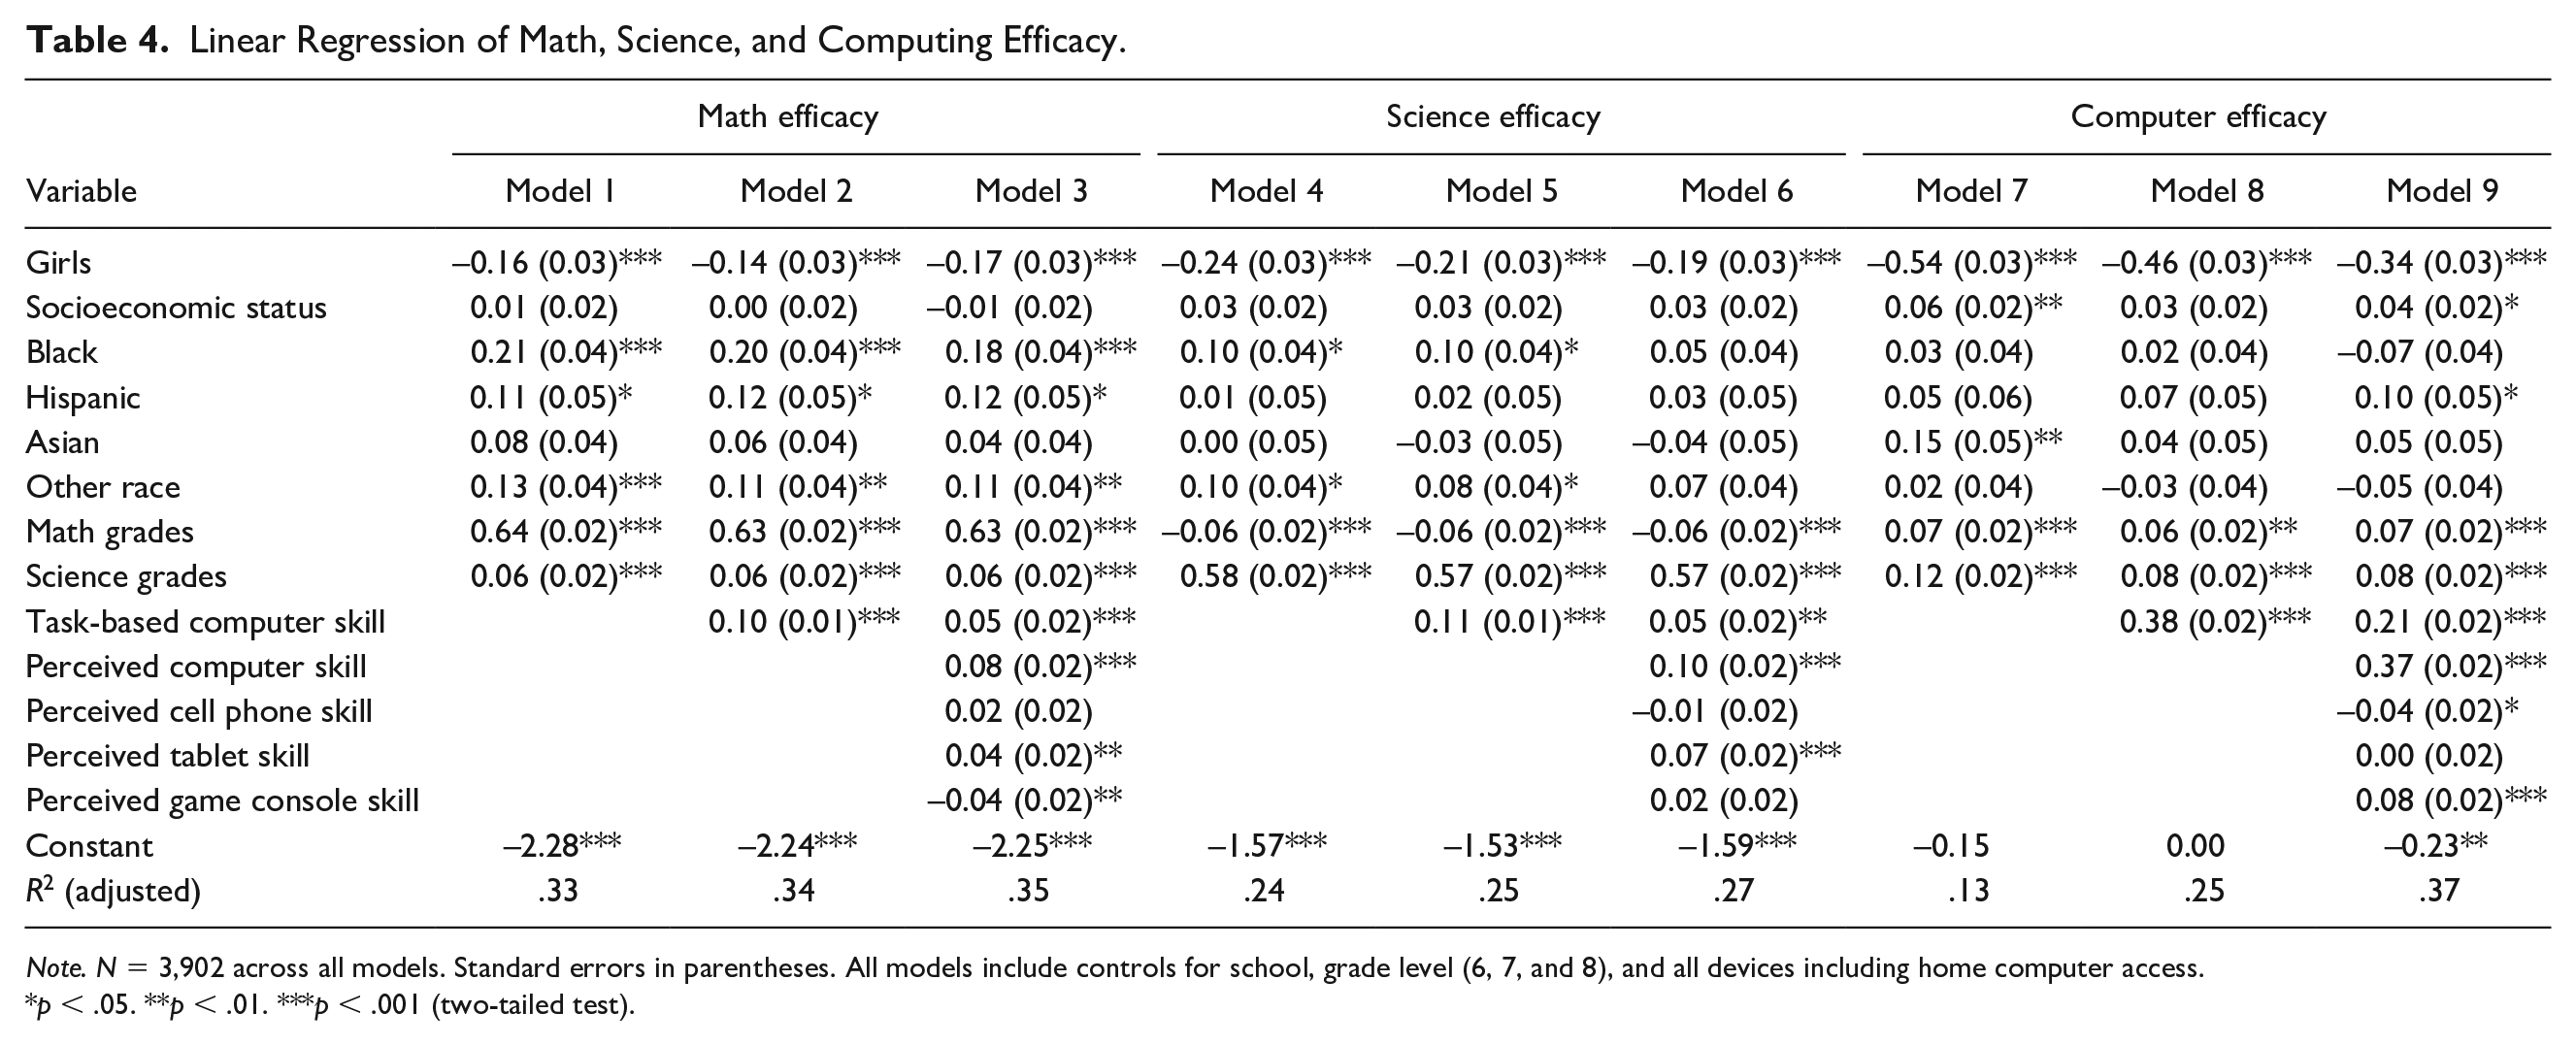
Note. N = 3,902 across all models. Standard errors in parentheses. All models include controls for school, grade level (6, 7, and 8), and all devices including home computer access.
p < .05. **p < .01. ***p < .001 (two-tailed test).
Linear Regression of Perceived Computer Skill.
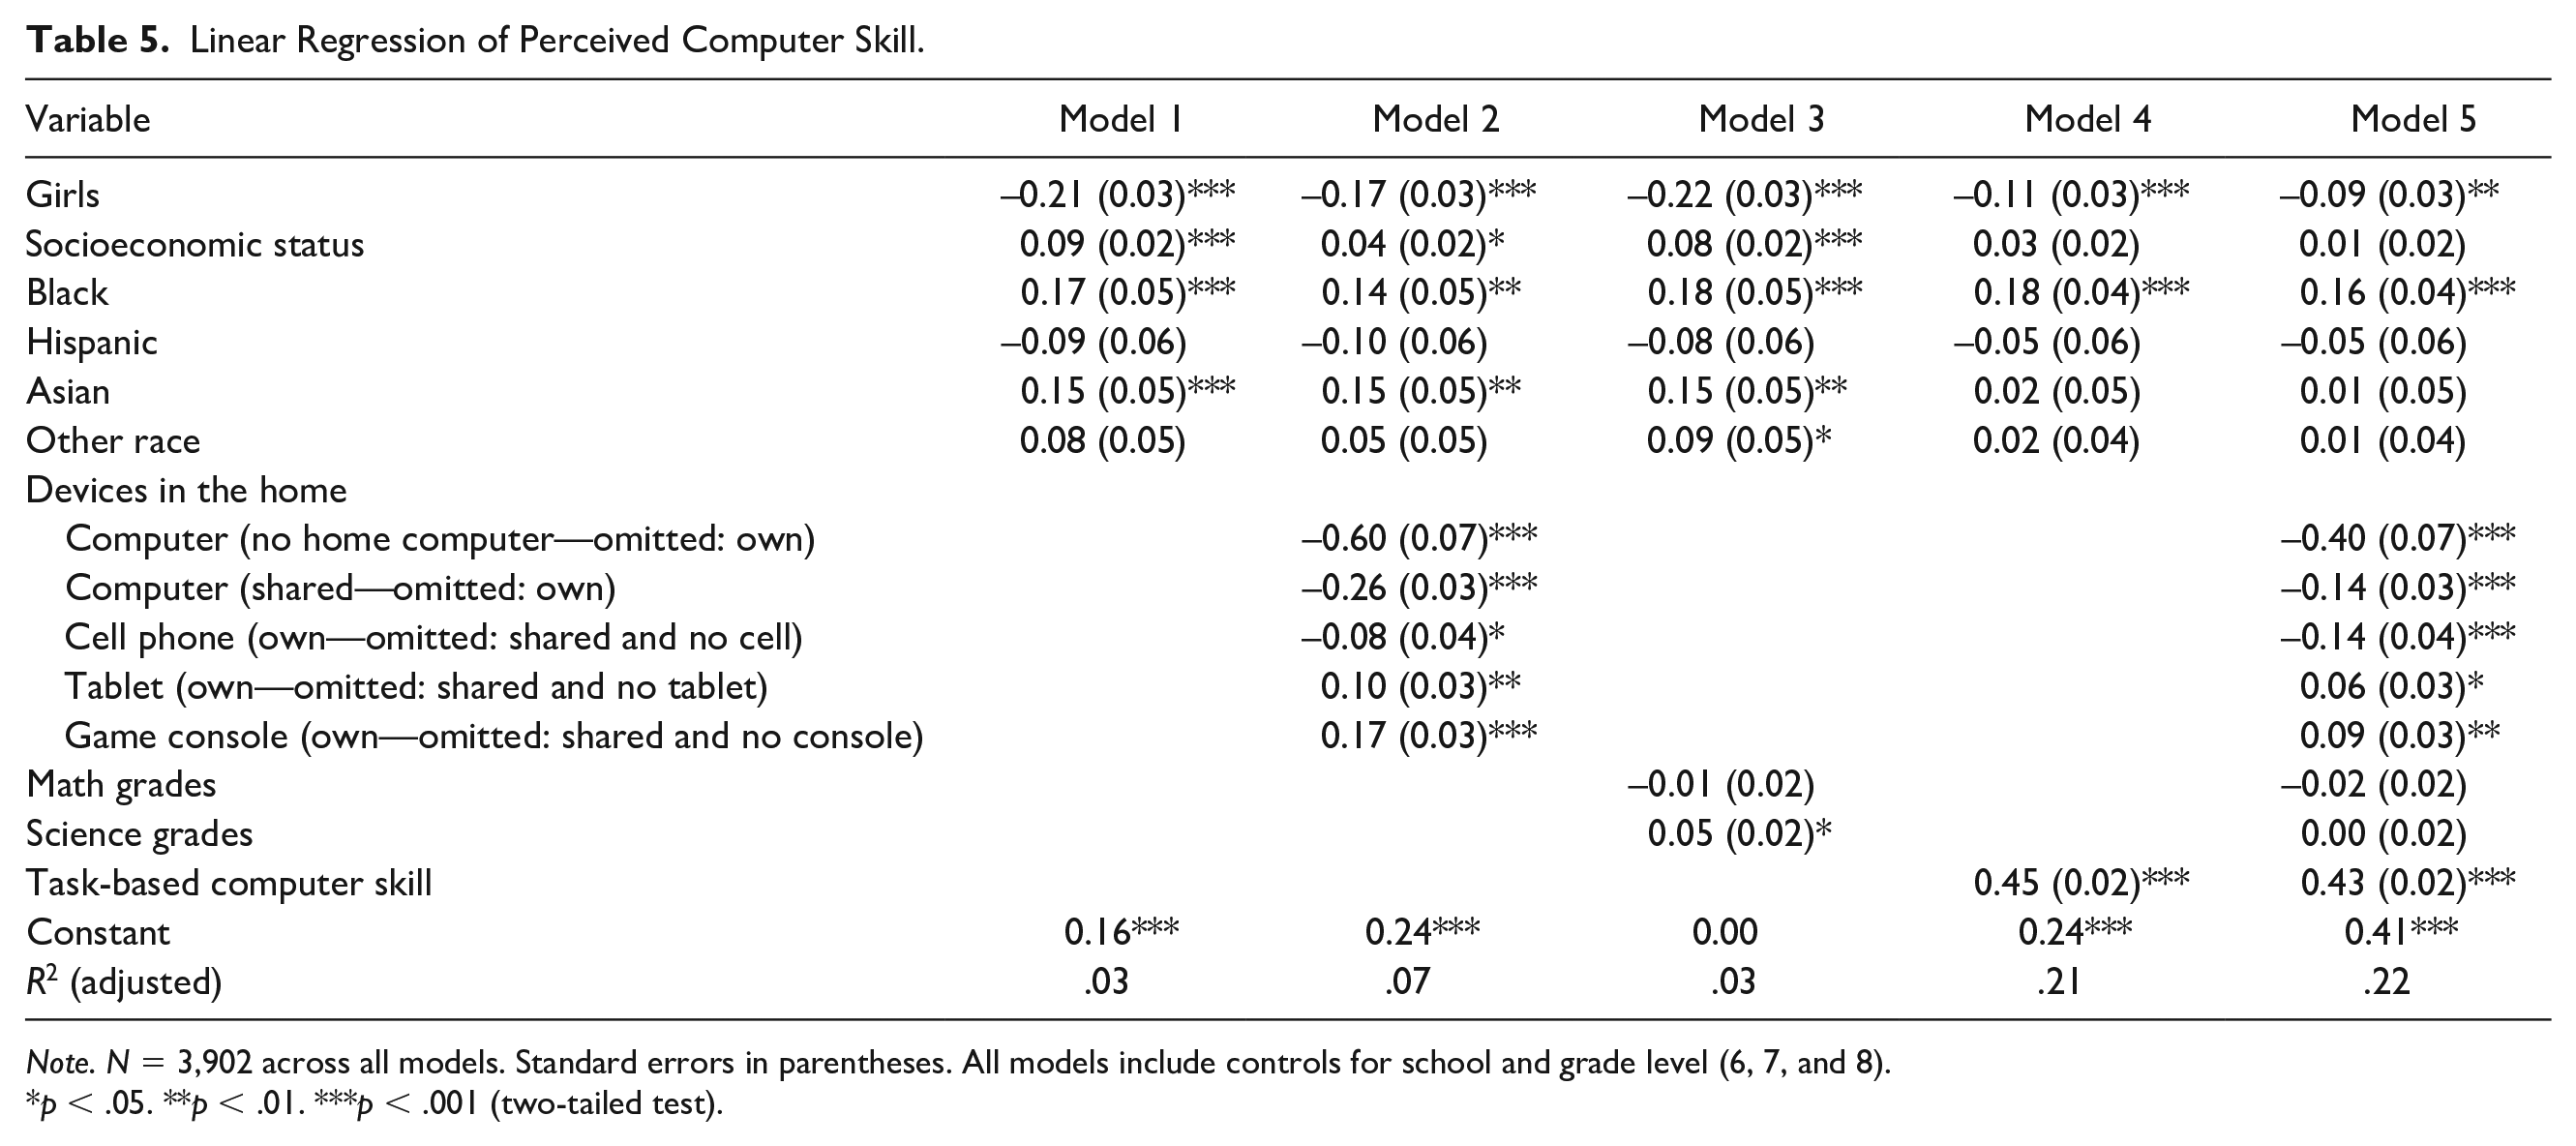
Note. N = 3,902 across all models. Standard errors in parentheses. All models include controls for school and grade level (6, 7, and 8).
p < .05. **p < .01. ***p < .001 (two-tailed test).
Results
Bivariate Analyses
The bivariate results provide support for some of the predicted gender differences and show evidence of internal validity (Table 2). Notably, the sample mean for computer efficacy is lower for all respondents in comparison with math and science (6.75 compared with 7.78 and 7.65 on a scale of 1–10). Also, the gender difference in computer efficacy is larger in comparison with math and science efficacy. Of the two self-conceptualization measures, academic efficacy and perceived skill, the standard deviation is higher for computer efficacy. The gender differences in these two measures vary. There is a much larger gender gap for computer efficacy, −1.43 on a scale of 1 to 10 which is the equivalent of −0.55 standard deviation units. 9 Girls rate themselves lower in perceived computer skill than boys though this difference is smaller (0.43 less on a scale of 1–10, or −0.2 SD).
The results of the bivariate analysis also show gender differences in task-based computer skill. The average girl in our survey reported that they had done 0.66 fewer tasks on a scale of 0 to 12 (or −0.23 SD). While the mean gender difference is negligible, there are more boys in our sample with a high level of skill than girls. Of the 11 percent of sample in the 90th percentile of computer skills (having done 11 or 12 tasks out of 12 asked), the proportion of boys was 15 percent, compared with 6 percent of girls. Boys were more likely to report that they had operated a computer from a command line (a 12 percent difference) and used task manager to stop an application (a 16 percent difference), suggesting that the gender difference grows as task complexity increases. The average boy in our survey has slightly more technical/operational skills while girls have slightly more Web-based skills, a finding consistent with Helsper and Eynon’s (2013) sample of adults.
There is no significant gender difference in math grades, as found elsewhere (Gibbs 2010). Girls report significantly higher science grades than boys, though the difference is small (about one-tenth of a shift between letter grades, −0.09).
Correlation Matrix
Bivariate correlations are shown in Table 3. Consistent with prior research, the female indicator (boys = 0 and girls = 1) has a negative relationship with task-based computer skill, all of the academic efficacy measures, and perceived computer skill. In comparison to computer efficacy and perceived computer skill, task-based computer skill is the only measure which is significantly related to grade level (at .2). This may be consistent with skill accumulation over the course of middle school grades. Importantly, there is a robust relationship between math and science efficacy (.44), but computer efficacy is not strongly related to the math and science grades (both correlated at .15). Similarly, task-based skills and perceived computer skills are only weakly associated with math and science grades. The perceived computer skill measure is more strongly related to computer efficacy (.51) than to task-based computer skills (.43). Besides task-skill and perceived skill, there are no other stronger correlates to computer efficacy in our survey.
Multivariate Analyses
Computer, science, and math efficacy
Looking now toward the motivation for the present paper, we estimated OLS regressions using the academic efficacy measures as dependent variables, standardized. The multivariate regression analyses of math, science, and computer efficacy measures are presented in Table 4. While girls report lower math and science efficacy than boys, the gender gap in computer efficacy is larger even with controls for math and science grades. In fact, comparing constrained models 1, 4, and 7 in Table 4, the gender difference in computer efficacy is approximately three times as large as the gender difference for math (−0.54 standard deviation units or SD in comparison with −0.16 SD) and twice as large as the gender difference for science (−0.24 SD). Adding task-skill and then the perceived skill measures to the models reduces the gender coefficient for computer efficacy to −0.34, still about twice as large as math and science with the same controls (models 3, 6, and 9). For context, recall the bivariate results in Table 2; the gender coefficient of −0.34 for computer efficacy in Table 4 represents a gender difference of nine-tenths of a unit on the Bandura academic efficacy scale of 1 to 10 in comparison with a 0.36-unit gender difference in math and science efficacy. H1 is supported.
Across the perceived STEM efficacy measures, we also find that computer efficacy is less sensitive to grades than math and science efficacy. That is, while the association between math and science grades on their corresponding efficacy measures appears to be large (0.63 and 0.57 SDs, respectively), they have minor association with computer efficacy (Table 4; models 7, 8, and 9). In addition, computer efficacy appears more sensitive to the variables associated with the home. Model 9 shows that each SD of SES increases computer efficacy by 0.04 SD, an effect that is not borne out in any of the math and science models. There is no significant interaction between gender and SES when predicting computer efficacy. In combination, perceived skill in using computers and computer task-skills are most associated with computer efficacy in model 9 (0.37 and 0.21 SDs, respectively). In contrast, the computing skill measures have only minor association with math and science efficacy. Not shown here, the gender difference in computer efficacy persists even when the uneven gender distribution of task-skills is taken into account. Furthermore, the perceived skill measures for each device have more statistical power in the models than device ownership. The device ownership variables are included in the base model, but when perceived skill is added to the analyses, these measures are no longer statistically significant.
Perceived skill
The second motivation for this paper is to compare the gender difference in perceived skill with the gender difference in computer efficacy as they may tap different social processes. In our models, the gender differences in perceived skill appear smaller than the gender difference for computer efficacy, and H2 is supported. Prior research has indicated much larger differences in perceived skill, though in an adult sample (Hargittai and Shafer 2006). Initially −0.21 SD, the gender difference is reduced to −0.09 SD when the task-based skill measure is included in the model, a change of 57 percent (see Table 5). Although readers should keep in mind that our task-skill measure is subject to response bias and not necessarily reflective of actual skill, this relationship is congruent with previous findings which suggest that girls view their computer skills lower than they actually are, but not to the extent that other research has found. With the coefficient for task-skill at 0.43, there is a much stronger relationship between task-skill and perceptions of skill than prior analyses have suggested (Hargittai and Shafer 2006), and task-skill also appears more closely related to perceived skill than to computer efficacy.
Although not reported in Table 5, boys’ computer task-skills have a slightly greater effect on their perceived computer skill. Boys’ task-skill is associated with perceived computer skill at 14 percent in comparison with girls’ skills, a modest but significant difference. In contrast, Correll (2001) found that boys’ math scores were less associated with perceptions of math skill. When it comes to computers, our results suggest that it is not boys who are inflating their sense of skill but rather girls devaluing theirs.
Importantly, devices and the degree of autonomous usage appear related to perceptions of skill. As suggested by other authors (Cotten et al. 2009; Hargittai and Shafer 2006), this is not a simple matter of “having” or “not having,” but is associated with usage patterns with particular devices. In addition, the freedom associated with owning a cell phone, tablet, and gaming console is not as strongly associated with perceptions of computer skill as having a computer of one’s own. These other devices are, however, significantly associated with perceived skill and suggest that all home devices are part of the way that computer skill develops, though this is difficult to know without panel data and more detailed measures which also assess devices that children may use at school.
Discussion
This paper was primarily motivated to evaluate the gender difference in computer efficacy as it plays a significant role in the development of interest and skill in early computer science pathways. Few studies have teased apart skills from self-assessments in this particular field of STEM. We thus assessed the gender gaps in academic efficacy across three STEM fields—computing, math, and science—in the key developmental period of middle school, hypothesizing that the gender gap in computing would be larger. While our analyses suggest that girls appear slightly behind boys when it comes to operational computer skills and presents an important issue for future exploration, this difference is rather small and unlikely to explain the current state of their participation in computer science paths overall. Net of skills and our other controls, we find the gender difference in computer efficacy is over twice as large as the difference in math and science efficacy. In contrast, the gender gap in perceived computer skill is smaller than for the gender difference in computer efficacy, and thus both hypotheses are confirmed. The remainder of this section delineates the various ways that these findings may shed light on the current state of gender dynamics in computing pathways, as well as its limitations.
Young people are often assumed to develop computer skills in the course of engaging with the tech around them as “digital natives.” While this may be true to some extent, our results suggest that even when girls and boys are similar in terms of skill and perceived skill, girls’ self-assessment of computing ability is lower than their assessment of their math ability. These data are limited due to a cross-sectional survey design, and the measures cannot speak to the nature of gendered stereotypes in the formation of interest and identity. With these cautions in mind, it is our hope that the results support further inquiry into the distinctions between STEM fields. Still emerging as field, the current pathways into computer science were shaped over the course of several decades, now to the point that many young people expect that a college degree in computing is a required credential for entrance into tech occupations. This was not the case just 20 years ago when many people developed programming skills informally through in-person interaction (such as gaming), online discussion forums, or bulletin board system services (BBS), motivated to better understand how to modify or improve their own hardware or software which was not commercially available to the extent that it is today. Thus, the stereotype of a self-taught “genius” is congruent with all nascent fields to some extent or at least those unassociated with femininity. That computing is not integrated into early education in the United States is perhaps not surprising if we consider this context. What we can say is that there are signs from our analyses that the culturally shaped beliefs about ability may be stronger for computing than other core STEM curriculum. The earlier in life that one imagines themselves as someone who is proficient in the field of computing—not just currently having skill—the more dividends might be accumulated from in-person and online performances (Crowley et al. 2001; Funk and Parker 2018), not to mention the information or validation derived from signaling tech enthusiasm to teachers and other adults (Calarco 2011; Lareau 2003; Paino and Renzulli 2013; Puckett and Nelson 2019).
Our results also suggest that computer efficacy is more sensitive to experiences associated with home environments. The SES composite measure and perceived computer skill measures were more influential in the computer efficacy models than in the math and science efficacy models, though no significant gender interactions with SES were found in our models of computer efficacy. As a field which in many ways is defined by its devices, this finding parallels research which suggests that SES may increase the resources children have to explore technology (Xie et al. 2015; Margolis et al. 2017; DiMaggio et al. 2004), but it does not support evidence from some studies which find that higher SES parents reinforce their children’s gendered STEM interests to a greater extent than other parents (Dotti Sani and Treas 2016; Hao and Yeung 2015; Raley and Bianchi 2006). Additional study of this phenomenon is greatly needed, in particular why computing may differ from other STEM fields in this respect.
Grades in math and science do not appear to significantly reduce the gender gap in computer efficacy. In contrast, math and science efficacy appear more strongly related to math and science grades. This does not mean that school experiences are irrelevant to computer efficacy, only that we did not detect it in our limited analysis. School subjects may be socially isolated from learning computer science to some extent due to their current decoupling from middle school education. Thus, self-conceptualizations that incorporate the confidence learned in math may not be easily connected to confidence in computing in the current circumstances of early education. In addition, girls may have higher standards for themselves than boys (Mann and DiPrete 2016), relying more on grades to inform their identity. Without such feedback about computing proficiency in the classroom, girls may set their sights on other fields. Furthermore, the small effect of grades on perceptions of computing ability suggests that even when they do poorly in school, boys may still believe they have innate ability, a reality which may buffer them from obstacles they encounter in STEM pathways (Sanabria and Penner 2017).
Overall, our results suggest that gender differences in STEM self-assessments vary by the skill measure used. Our results imply that the gender gap in computer efficacy is fairly persistent in that grades and two measures of skill reduced the gender difference to one-third of an SD which is double the gender gap found in math and science efficacy. By contrast, our analysis of perceived skill shows that the gender difference is much narrower than other research has suggested and shows a closer association with computer task-skill. Our models imply that while girls underestimate their skills, this effect is somewhat small in comparison with other surveys (Hargittai and Shafer 2006; Huffman, Whetten, and Huffman 2013). While these efficacy and perceived skill measures have tended to be grouped together as “expectancies” and used interchangeably to predict educational and occupational choices (Eccles 1994; Wigfield and Eccles 1992), skill perceptions may be less susceptible to the influence of computer science stereotypes because they are anchored in direct observation. As Bandura (1997) and Watt (2006) have suggested, self-assessments of current capabilities may be fundamentally different from perceived ability to be successful in a particular academic pathway. The distinction between these two self-assessments may contribute to the understanding of computing paths independently from other STEM paths. Because academic learning of computing is not typically available in early schooling and masculine cultures may be stronger in this field, attitudes and self-assessments of ability may be more consequential than skill in developing interest in computing paths (Master and Meltzoff 2020). Computer efficacy may influence how children come to pursue career paths as well as professional identity, the embodiment of ability (Cech et al. 2011). Our results suggest that when examining participation in computer science paths, choices around self-assessment measures should be carefully considered.
Invariably, however, our study is not equipped to demonstrate how or why there are larger gender differences in computing self-assessments than in math and science. Messages about these fields are pervasive in the media, there is well-documented evidence of a “chilly climate” in STEM classrooms, and girls have difficulty finding same-gender role models in computer science, just to name a few possible reasons. Ultimately, we hope to contribute to the conversation about the role of computer skills in early computer science paths. There are signs from our analyses that the gender gap in computer science pathways is not about ability alone which continues to be the subject of much debate in some spaces.
Some researchers and educators have advocated for required computer curriculum in middle school, and our results suggest that this change could be successful if these spaces offer the opportunity for all children to engage and enjoy learning, thus countering stereotypes (Cheryan et al. 2009; Thebaud and Charles 2018). Our results indicate that girls and boys have very similar levels of skill, which suggests that we are missing out on some talented girls who might be successful in computing. Computer classes in middle school may also allow for children to see how their interest in math and science connects with computing. Early classroom experiences which facilitate adult-led, inclusive learning might provide more objective standards and competing narratives which dispel notions of men’s “innate” computer ability and link up with math proficiencies. Research which investigates the role of computer science curriculum—especially comparing the effects of required and optional or “elective” courses in early education—would be well served.
Limitations and Future Work
Our methodology allows for a comparison of gender differences in self-conceptualizations, but it does not offer the ability to evaluate the processes by which these perceptions come about. Readers should consider the effect of reverse causality. While skill—perceived and task-based—may very well bring about computer efficacy, it is likely that the reverse is also true as interest and motivation may bring about skills when children are more invested in the pursuit (Wigfield and Eccles 1992).
Readers should also consider the study’s methodological limitations when it comes to assessing skill in math, science, and computing. We did not have access to achievement tests, and self-reported math and science grades are subject to report bias, especially for lower performing students (Rosen et al. 2017). Even if students accurately report their grades, some evidence suggests that teacher assessment can be biased in favor of girls (Robinson and Lubienski 2011). Readers are advised to take these measurement issues into account, and future research should aim to disentangle these issues further.
Work should also continue to examine why the gender difference is greater in computer efficacy than in other STEM fields. Our respondents are children, and we do not have measures which are typically used to evaluate outcomes such as intended college major. Thus, our findings may not apply to the entire computer science pipeline, though other research can be used to contextualize our results (Cheryan et al. 2017; Sax et al. 2017). Finally, due to our research site location, parent labor force participation in STEM fields is very likely above the U.S. average. While controls for parent occupation did not change the regression results, our respondents’ knowledge of STEM fields may be higher than other children in the United States. Additional research which disaggregates STEM fields would be beneficial, including that which examines the relationship between SES and gender. Although others have found an interaction between SES and gender when modeling STEM interest (e.g., Charles and Bradley 2006), we did not find an interaction between gender and SES when modeling computer efficacy.
Conclusion
Digital technology is ubiquitous, yet the ways in which it intersects with social inequalities are often obscured or deeply embedded in informal interactions. We extend the scholarship on digital inequality by disaggregating the STEM fields and establishing some baseline differences in academic efficacy across math, science and computing. We find that when girls and boys in the critical period of middle school have similar task-based skill—and even similar perceptions of skill—girls may be less likely to view themselves as having ability to learn computing. For some time, scholarship has explored how masculine cultural narratives shape children’s experiences when it comes to early math and science learning. The meaning making around computer pathways will continue to be elusive until more emphasis is placed on self-assessments and digital technology in both the private and public sphere. Additional investigation of these issues is greatly needed as the significance of computing and machine learning continues to grow in scientific research, national security, infrastructure, consumer behavior, and private life.
Footnotes
Acknowledgements
We thank the editor and the three anonymous reviewers whose comments and suggestions helped improve and clarify this manuscript.
Declaration of Conflicting Interests
The author(s) declared no potential conflicts of interest with respect to the research, authorship, and/or publication of this article.
Funding
The author(s) disclosed receipt of the following financial support for research, authorship, and/or publication of this article: This material is based upon work supported by the National Science Foundation under Grant No. 1203234.