
Abstract
Unions are known to increase earnings and wage equality. Therefore, indications for recent union revitalization provoke the question of what unions would do today were they to restore their union density and hence power to the level of the early 1980s (about 20%). This article presents wage estimates for 1983 to 2020, assuming a 20% union density from 1983 onward, revealing higher earnings and lower wage inequality. However, since union membership today typifies low-wage workers with weaker bargaining power than formerly, the benefits from restoring union density and power will likely be lower today than in the past.
Union decline is one of the most important explanations for America's shortfall in upward mobility in recent decades. Union density—the fraction of workers who belong to labor unions, a common-use proxy for union power—has been falling in the US private sector for almost 40 years; from 25% in the early 1970s to 6% in 2021 (Figure 1). 1 The widespread recognition that unions work for the economy (Freeman & Medoff, 1984) implies that union decline has caused three specific dynamics for workers’ earnings. First, the decline in union density has resulted in fewer workers benefiting from the well-documented positive effect of unions on their members’ earnings (known as “union wage premium”—the percentage by which unionized workers’ wages exceeds wages of similar nonunionized workers). Second, because of union decline, unions’ ability to set norms or labor standards that raise comparable nonunion workers’ earnings has weakened. Third, union decline led to deteriorating bargaining power of unions, resulting in a lower union wage premium for unionized and nonunionized workers. Since historically unions have raised wages more for low-wage and middle-wage workers than for higher-wage workers, inequality researchers firmly agree that union decline has exacerbated earnings inequality. Union decline partly explains also the decline in labor's share, the shrinkage of the middle class, the growth in the numbers of the working poor, and the shortfall in economic mobility for African Americans and new immigrants (see Kristal & Cohen, 2017).
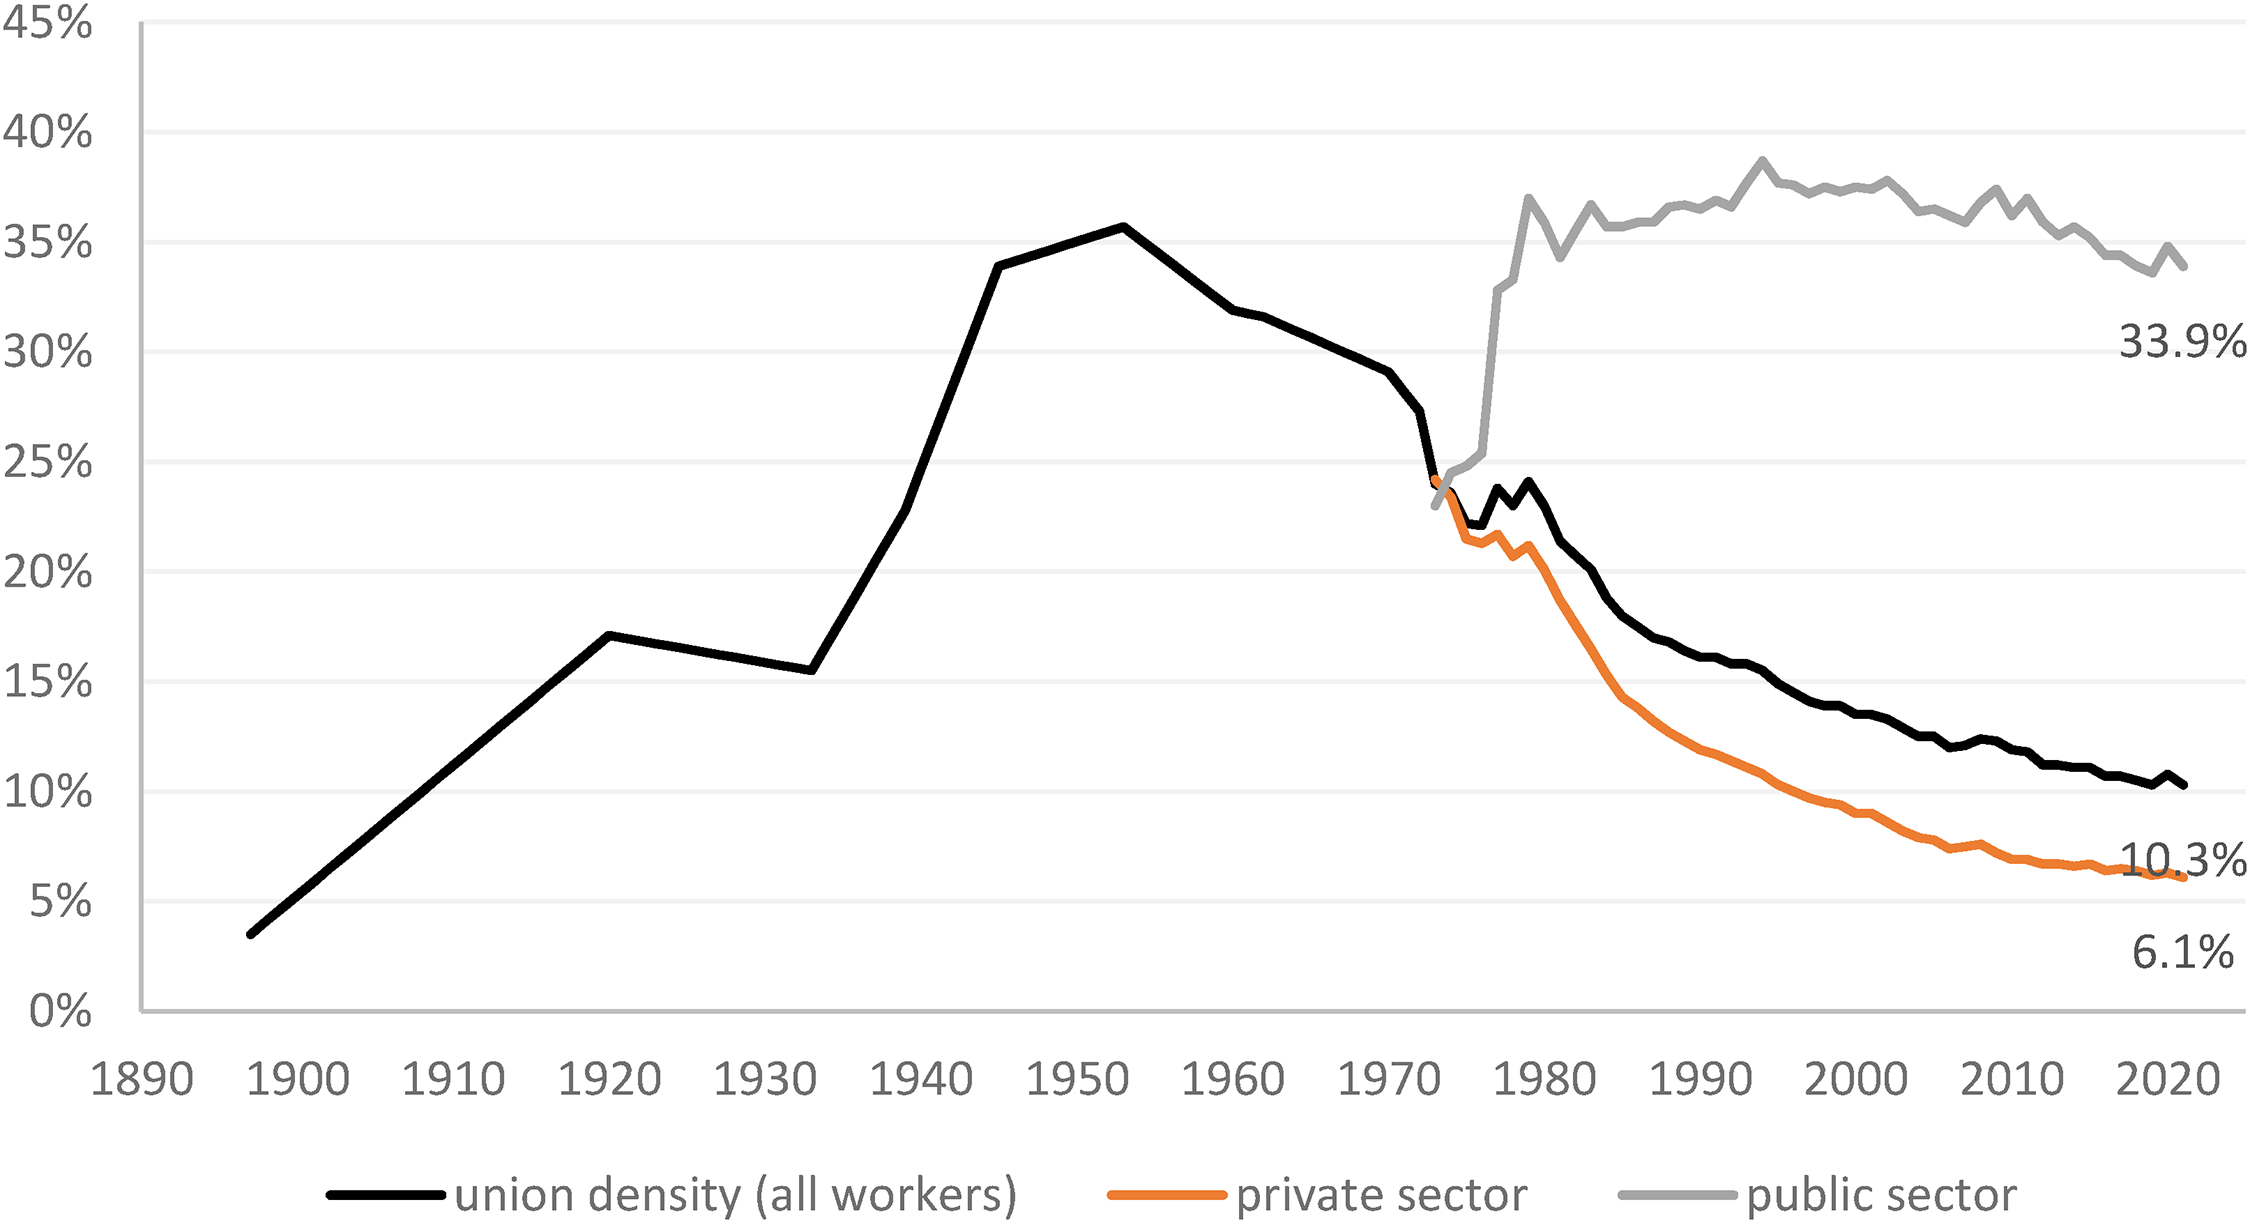
Union density (membership), 1890 to 2021. Union density is measured by division of the number of union members by the number of wage and salary workers. Union data for the years 1901 to 1972 were compiled from Troy and Sheflin (1985, Table 3.91). Union membership figures for 1973 to 2021 were compiled from http://www.unionstats.com/(data for 1982 were imputed).
Recent writings suggest that US workers are engaged in a major upsurge in union organizing—activities ultimately aimed at achieving a collective bargaining agreement—to strengthen their voice and economic power. Kochan et al. (this issue) describe a significant upsurge in union organizing activities and election success in the US during 2022. Broadening the historical scope, Figure 2a shows union organizing activities under the NLRB and election success over the past almost 100 years based on statistics published in NLRB annual reports. While the number of elections somewhat increased in 2022 compared to the numbers in 2020 and 2021 (up to 1,223 elections in 2022, albeit lower than the upswing in 2015 to 1,490 elections), it is too early to conclude if it signifies a turning point. However, supporting the thesis of a major upsurge in union organizing, it is evident from Figure 2a that the percentage of elections won by unions has increased over the past 40 years since reaching the bottom 40% in the early 1980s.
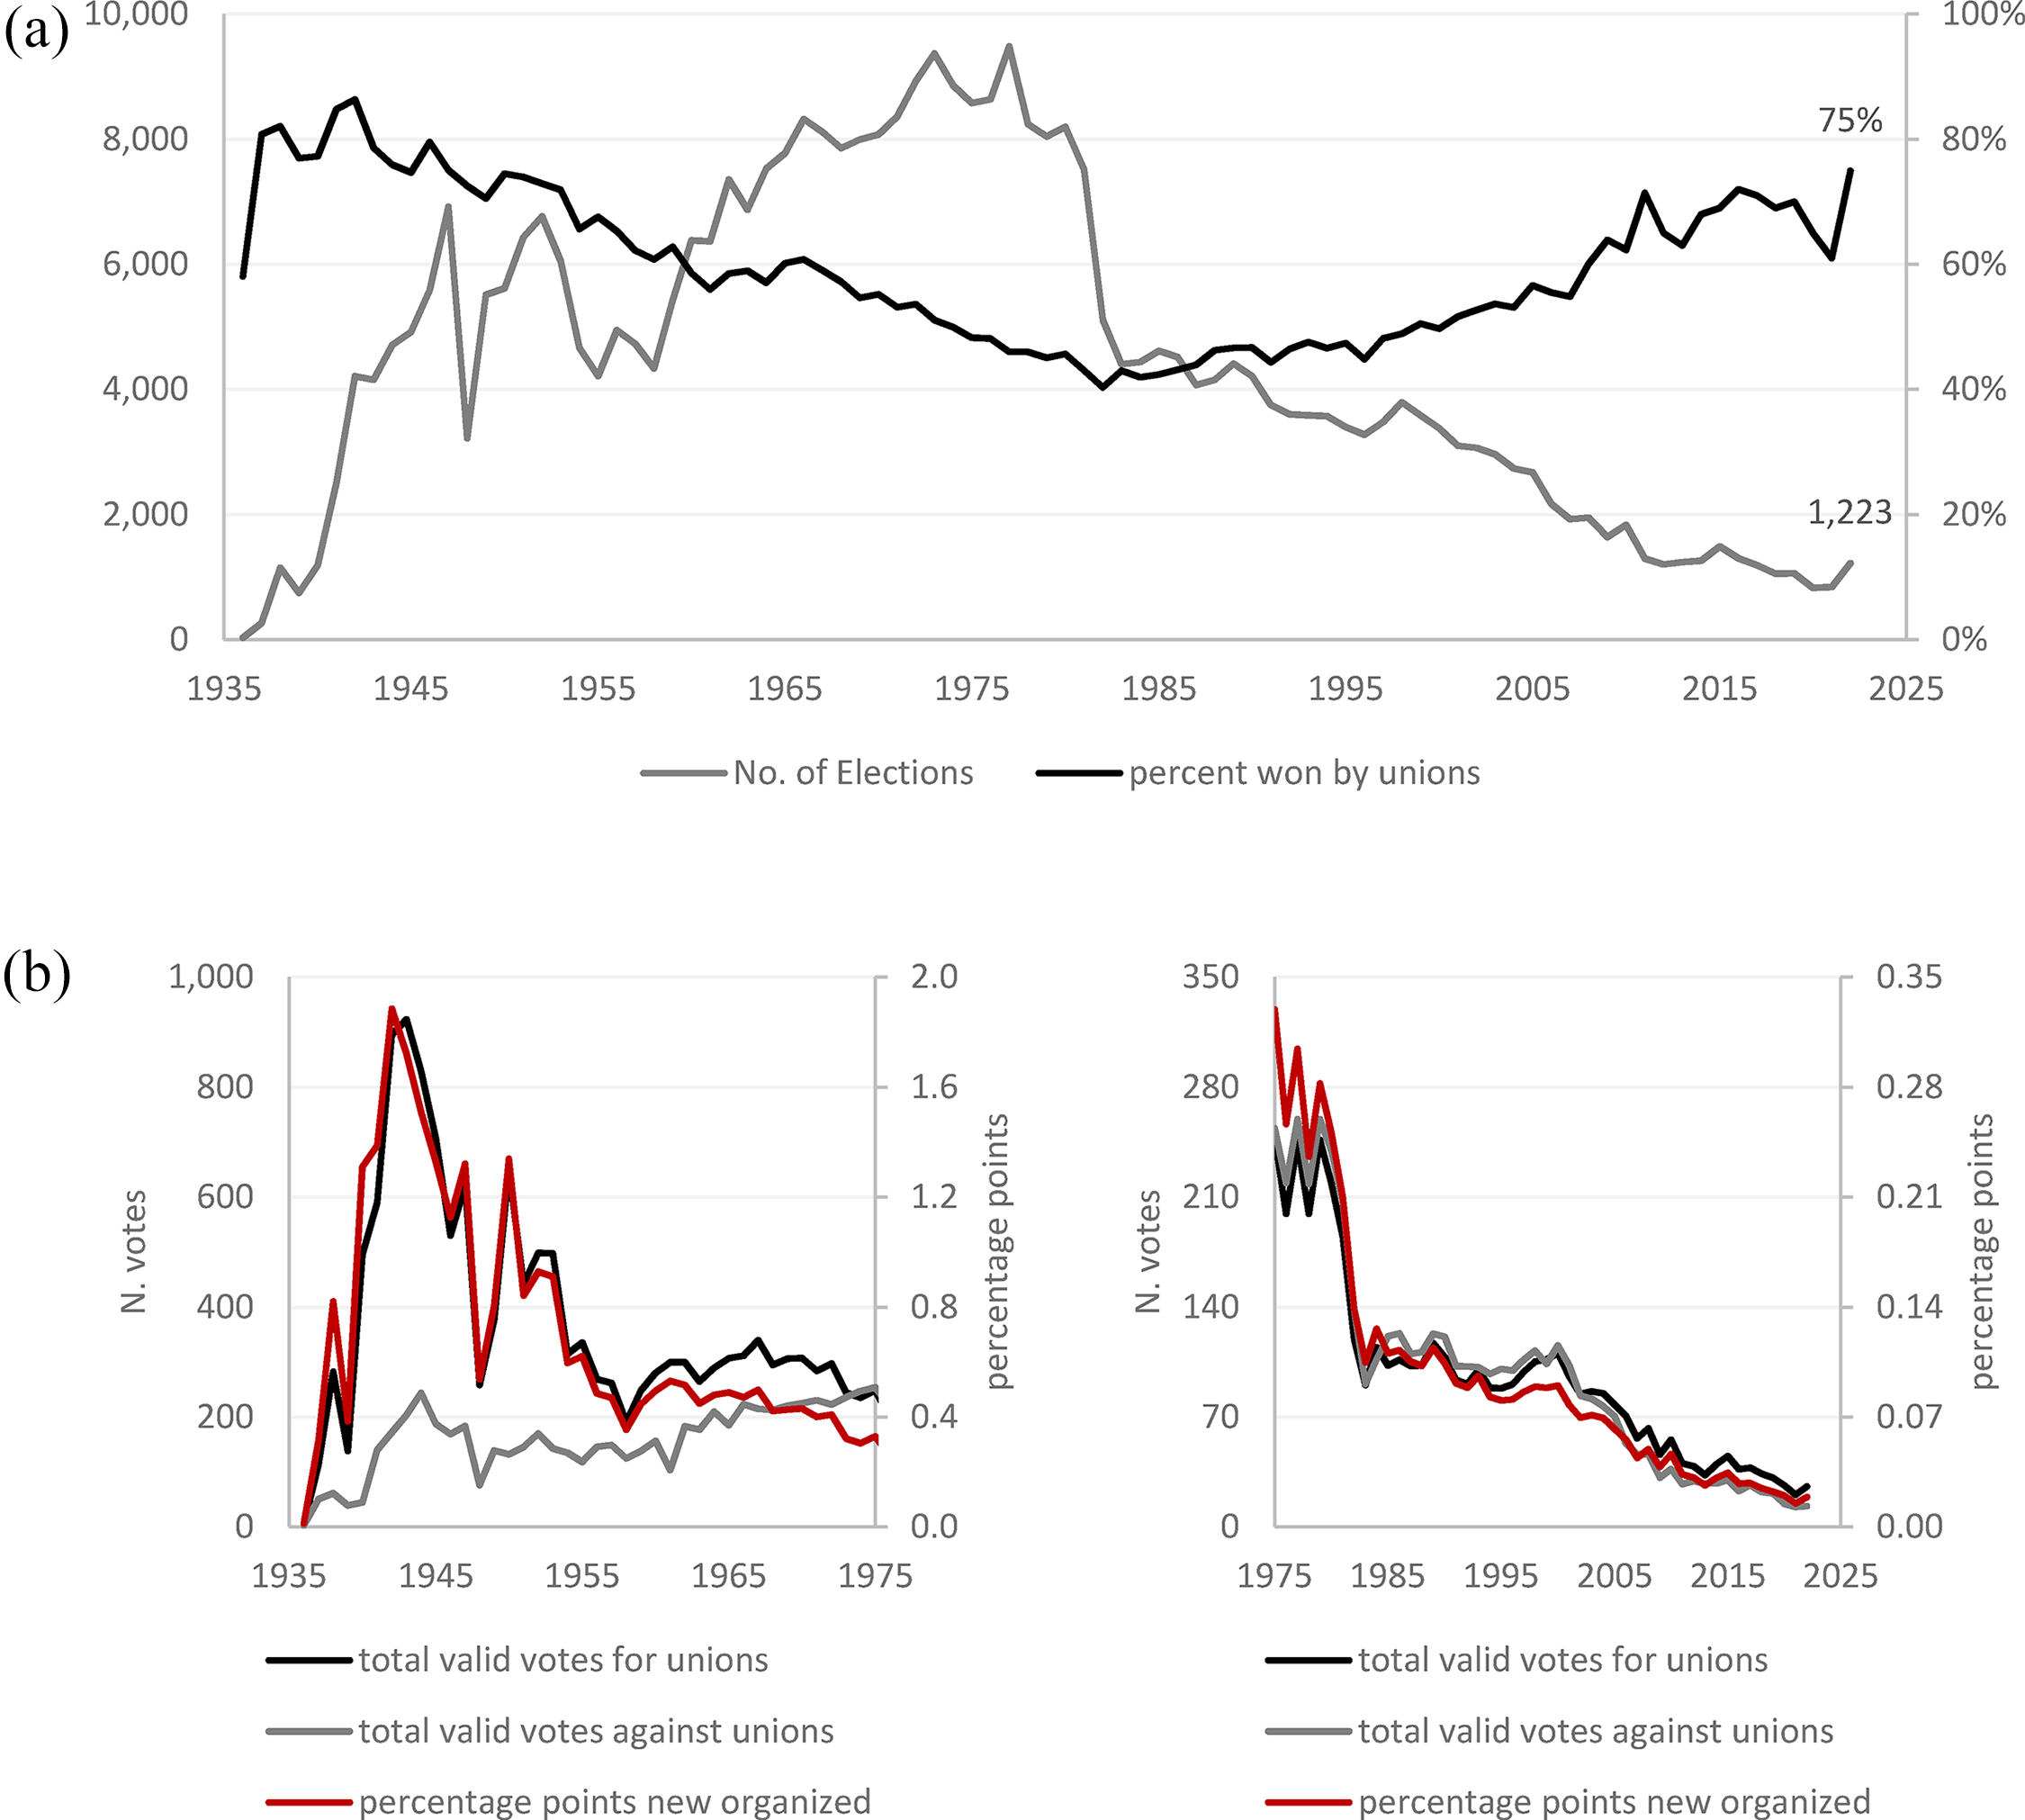
NLRB election statistics: 1936–2022. Data: NLRB annual reports available at https://www.nlrb.gov/reports/agency-performance-reports/historical-reports/annual-reports and https://www.nlrb.gov/reports/nlrb-case-activity-reports/representation-cases/election/election-statistics. Newly union organizing under the NLRB is measured by the number of valid votes of workers for union (source: NLRB) out of full-time equivalent employees (source: BLS). Ideally, new union organizing under the NLRB should have been measured by the number of eligible voters in union-won elections out of full-time equivalent employees, but these numbers are not available for the entire period. (a) Number of representational elections under the NLRB and win rates and (b) Number of votes for and against unions (1,000) and percentage of workers newly organized under the NLRB.
Does this upsurge in union organizing translate to an overall increase in union power, as evident in union density? Figure 1 reveals that union density for the entire private sector has not increased in recent years, but the decline has been lessened. That union density did not increase despite the triumph in NLRB elections is partly because most of the units that unions have organized in recent years are small, translating into a small number of newly organized workers (Figure 2b, right side). Newly organized workers indicate how success in organizing new workplaces translates into union membership and density. From 1990 onward, the numbers are negligible, less than one-tenth of a percentage point, reaching one-hundredth in 2022. Unsurprisingly, the highest numbers for newly organized workers were back in the 1940s, about two percentage points in a year (Figure 2b, left side). Rebuilding union power through membership can also come from unionized workplaces’ recruiting more workers and workers who organize in other ways than through the NLRB election process. I am not aware of available statistics on these sources for union revitalization, yet the stagnation in overall union density suggests that the numbers could be low.
What Can Unions Do? The “Simple” Story
Indications for union revitalization provoke the question of what unions would do today were they to restore their union density and hence power to the level of the early 1980s (about 20%). There is no straightforward answer. Much has changed since the early 1980s. Union decline, in tandem with ongoing technological change and firms relocating overseas or replacing US-made goods with imports, has reduced the share of blue-collar jobs in manufacturing and increased pink-collar jobs in services and temporary jobs in trade and services industries, together with a growth in the wage premium associated with higher education across industries. The reality of harsher economic and political contexts for unions—employers’ militant stance against unions and changes in the application and administration of labor law—carries certain implications (Kristal, 2019).
But suppose unions succeed in restoring their power in organizing new members. Is it worthwhile? To provide estimates for how the pay of middle-wage earners and low-wage workers would look were the unionization rate restored to its early 1980s level—about 20%—I examine a counterfactual estimate. 2 Utilizing data from the Current Population Survey (CPS) of the Bureau of Labor Statistics (BLS), I set out new estimates of the weekly earnings of median-wage and tenth-percentile workers from 1983 to 2020 had union density been at 20%, based on what I term “the simple story.” The simple story emerges from past research and suggests that unionized workers would have benefited from a wage premium of about 22% if density was 20% yearly—two numbers that described 1980. Likewise, nonunionized workers would have benefited from a similar wage premium resulting from a union presence in their local labor market poses an economic threat to nonunion competitors. My estimation strategy includes four steps each year, the first two for unionized workers and the last two for nonunionized workers. I first multiplied the wages of all unionized workers by the difference between the wage premium in the specific year (taken from Macpherson & Hirsch, 2021) and a wage premium of 22% that typified the year 1980. Second, I randomly sampled nonunionized workers. The sample size and observed union members summed up to 20% percent density. I then multiplied sampled workers’ wages by 22%. The first and second steps “fix” the wage distribution by taking into account the effect of the decline in union wage premium (first step) and union density (second step). The last two steps account for these effects on nonunionized workers. Hence, I repeated the first step for nonunionized workers employed in a local labor market (defined by industry-region) with a unionization rate above 5%. Lastly, I multiplied by 22% the wages of all nonunionized workers employed in an industry-region with a unionization rate (of only sampled workers) above 5%.
Figure 3 underscores what is well known: although productivity, which indicates an economy's potential for improved pay, has risen significantly, workers’ incomes on the lower half of the income ladder have risen slowly. Real wages for a typical (median-wage) worker have modestly increased in recent decades, and real wages for low-wage workers (tenth-percentile wage earners) have stagnated, at least until 2017. Had unions restored their power, what would median-wage and low-wage workers’ real wages have been? Figure 3 presents an estimation of the simple story. According to these estimations, real weekly wages would have increased faster had unions maintained their power. Real weekly wages of the median worker would have increased by 15.1% faster from 1983 to 2019 3 and real weekly wages of low-wage workers would have increased by 5.7%. According to the “simple story” strategy, weekly wages for median-wage workers would have been an estimated 13.9% ($124) higher in 2019. For a year-round worker (50 weeks of work), this translates into an annual wage increase of $6,212. Weekly wages for low-wage workers would have been an estimated 12% ($53) higher in 2019 if private-sector union density had been 20%. For a year-round worker (50 weeks of work), this translates into an annual wage increase of $2,647.
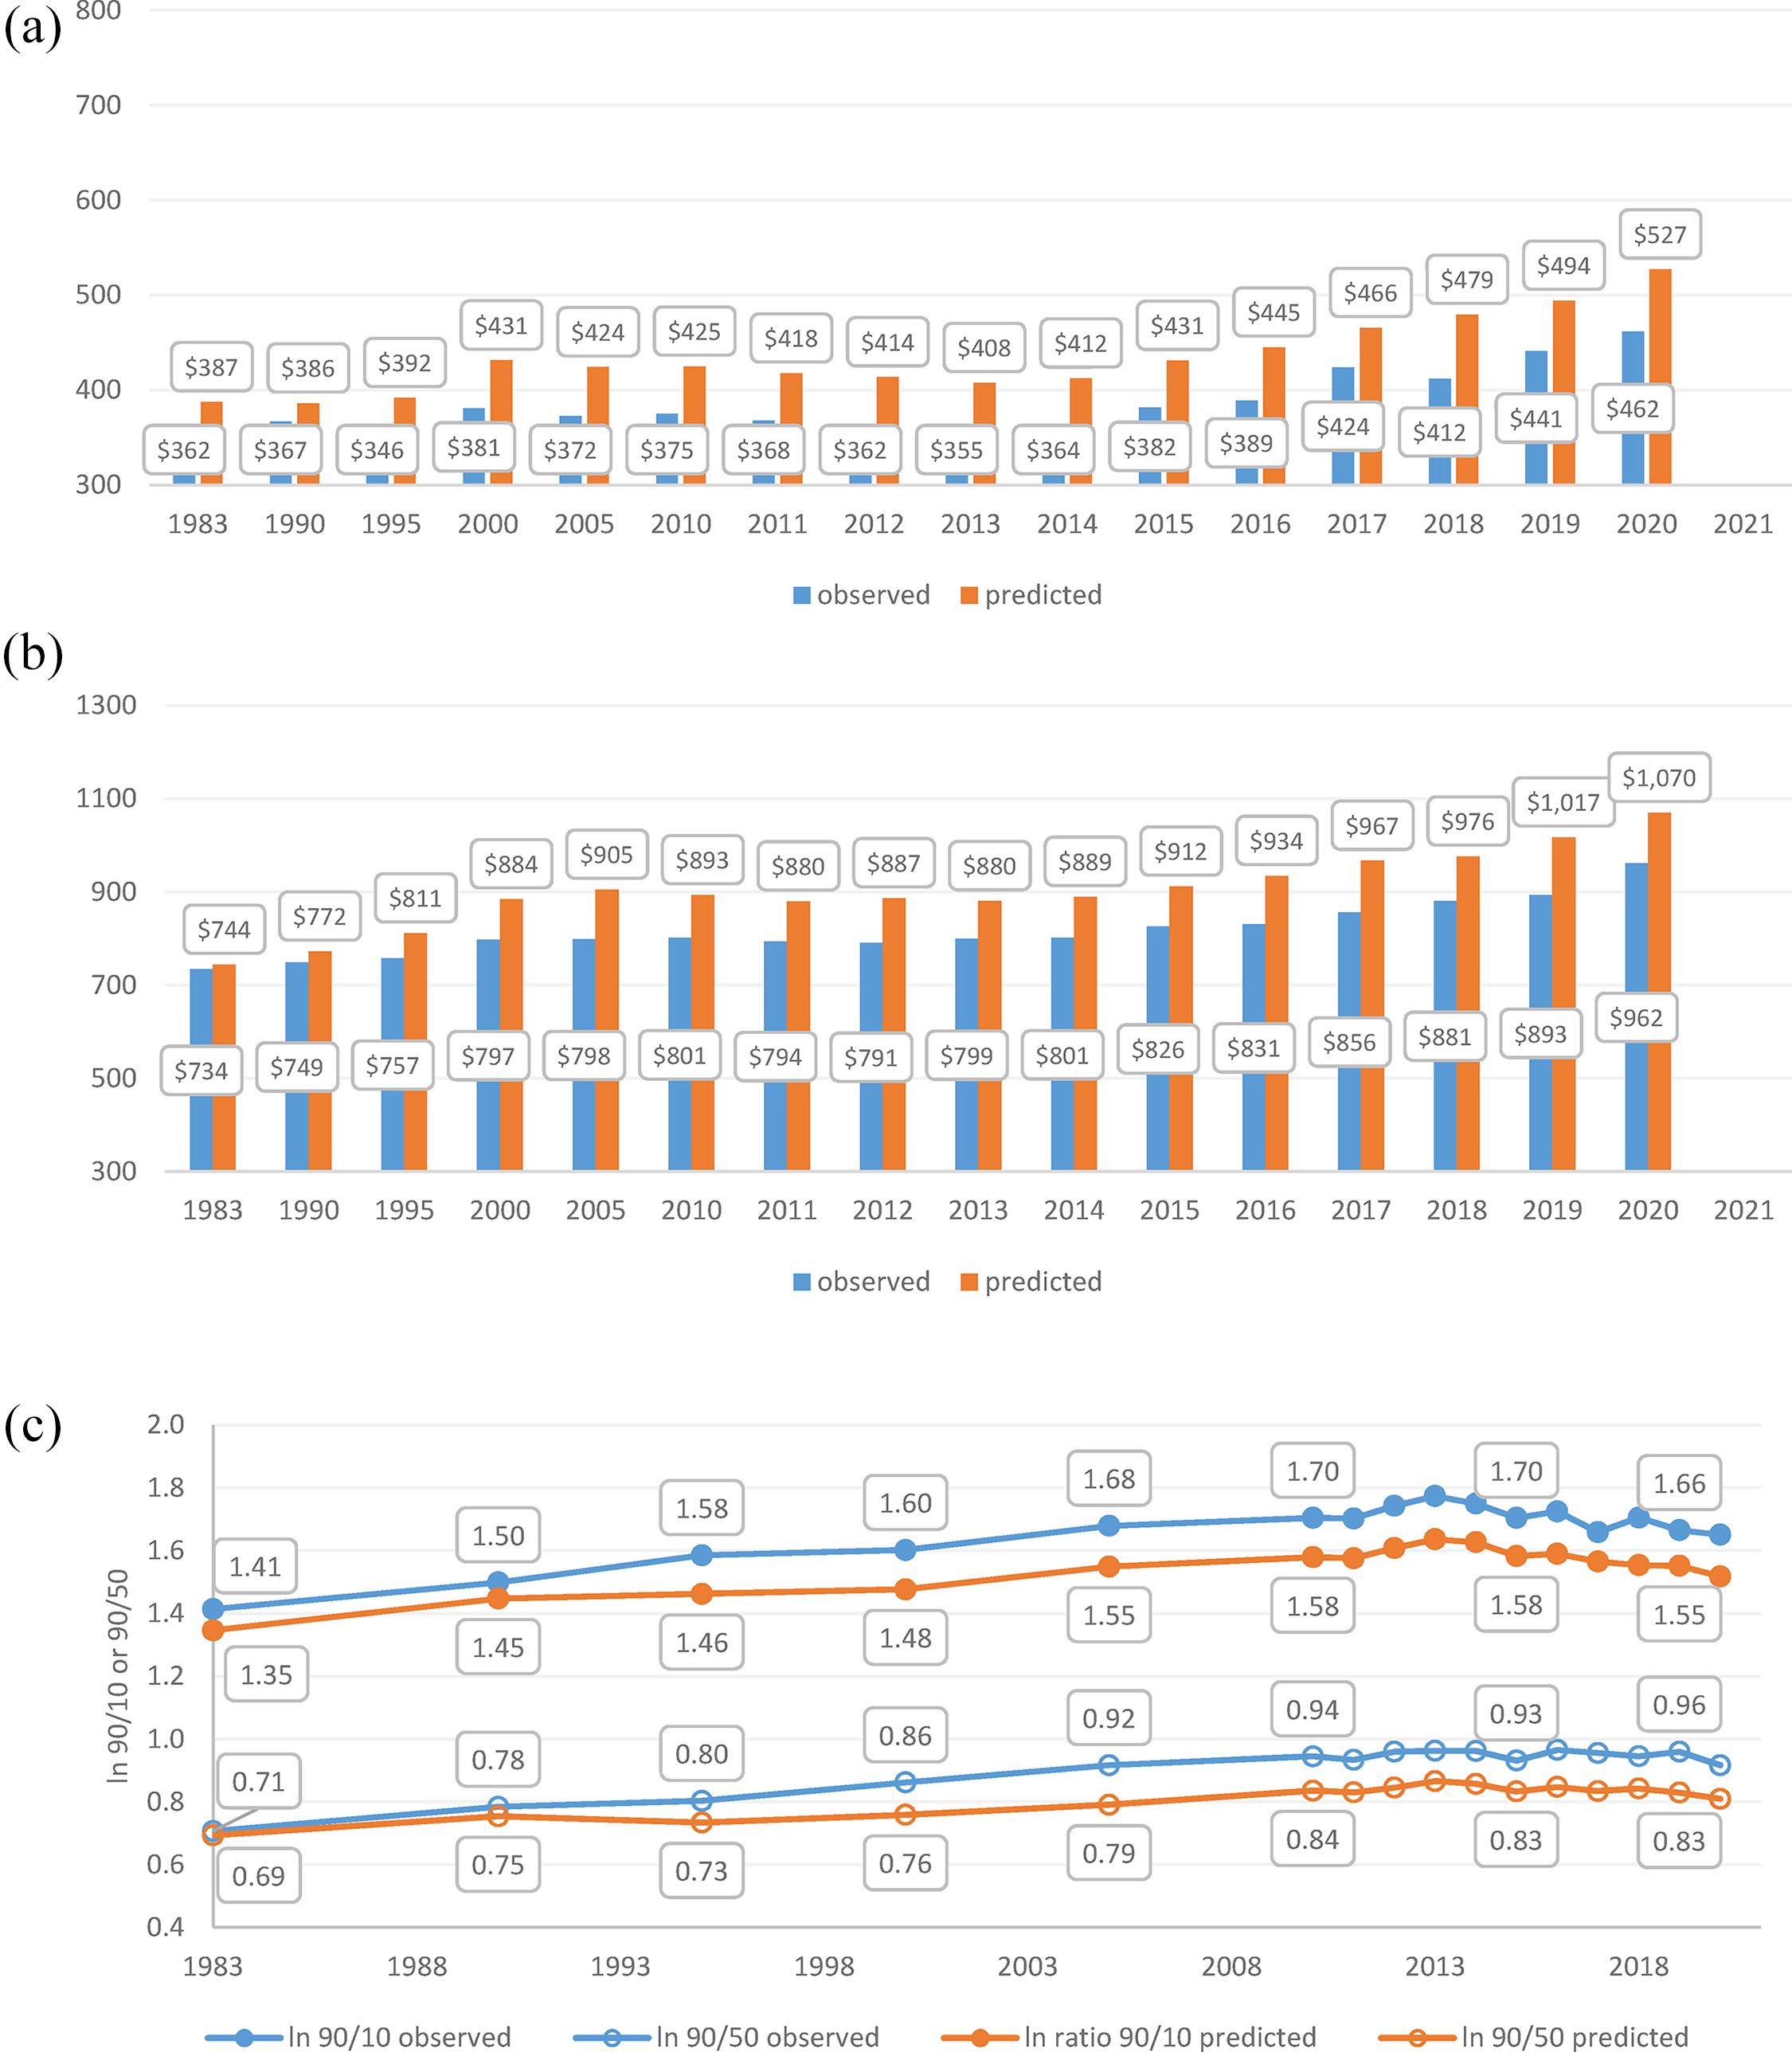
“The Simple Story”: Observed and Predicted Weekly Wages assuming 20% Union Density for low-wage and median-wage workers, 1983 to 2020 (2020 dollars). Notes: The figure is constructed using CPS-MORG files for full-time private-sector workers aged 18 to 65 years. Wages are converted into constant 2020 dollars (to account for inflation) using the CPI-U-RS price series. I restrict the sample to nonimputed earners and trim high and low outliers. Estimates are adjusted using appropriate CPS weights. See explanations in the text for the predicted wages. (a) Observed and predicted weekly wages for low-wage workers (10th-percentile wage earners), (b) Observed and predicted weekly wages for median-wage workers (50th-percentile wage earners) and (c) Observed and predicted wage inequality between high- and low-wage workers (90/10) and high- and median-wage workers (90/50).
Wage inequality would also have been lower had unions restored their power (Figure 3c): 4% lower (1.55 instead of 1.66) for the ratio between high-wage and median-wage workers (90/50) and 14% lower (0.83 instead of 0.96) for the ratio between high-wage and low-wage workers (90/10). Moreover, beyond earnings, total compensation (earnings plus benefits) would have increased faster, and compensation inequality would have been lower had unions maintained their power. This is since (1) inequality in employer-provided benefits is higher than wage inequality, and (2) unions increase the likelihood of obtaining benefits and their value (Kristal et al., 2020).
What Can Unions Do? The “Complex”—But More Realistic—Story
Up till now, I provided estimates for the earnings of middle-wage and low-wage workers, and the gaps between them and high-wage workers were unions restored their density and hence their bargaining power to its early 1980s level. I did so by assuming that unionized and nonunionized workers would benefit from an average wage premium of about 22%. In doing so, I also assumed that union density and union wage premiums are equally distributed among groups of workers. But the story is more complex, suggesting a less promising result for what unions can do today to workers’ earnings even if union density would have significantly increased. As I show in the following analyses, which do not assume that unions restored their power to 20% density, the typical union member in recent years is younger, more likely to be a woman, and to earn low wages than the typical union member in the early 1980s (Figure 4). These characteristics of union membership generate an assumingly lower structural bargaining power and evidently a lower wage premium for unionized workers than assumed so far (Figure 5). Suggesting that the estimates in the simple story presented above are exaggerated for the effect of unions on earnings and wage inequality.
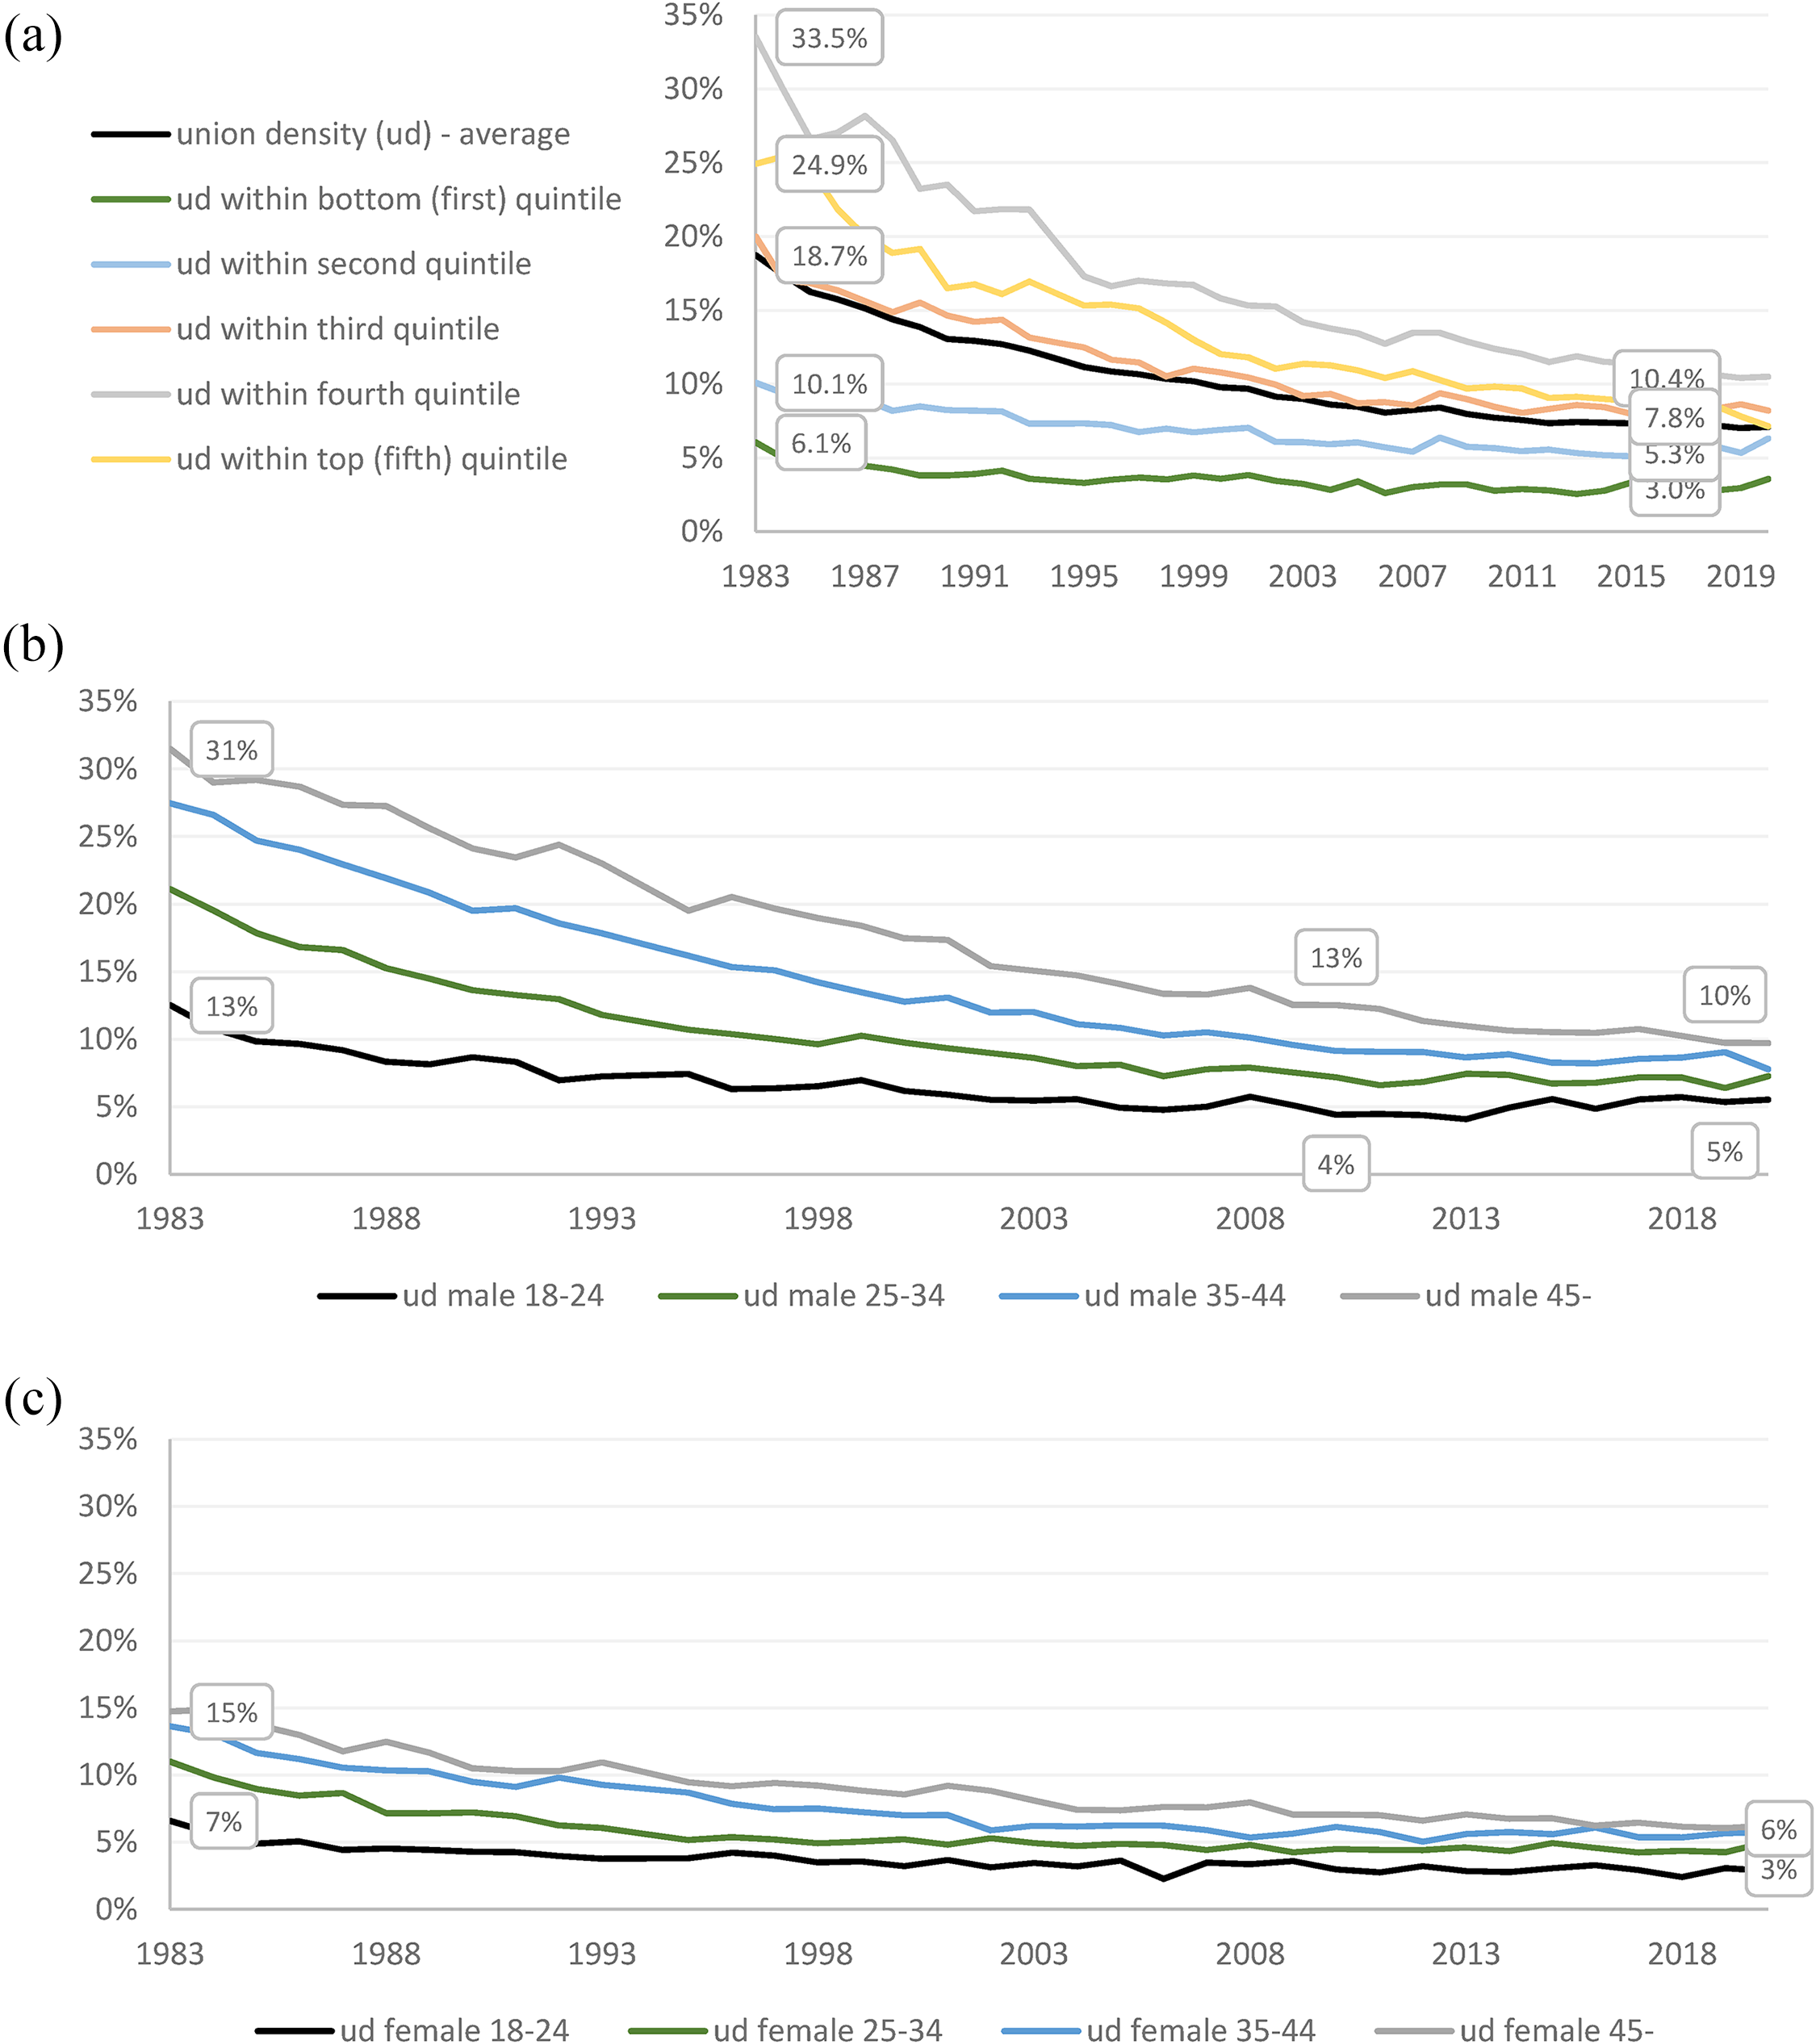
Unionization rates by wage quintiles, age groups, and gender, 1983 to 2020. Notes: The figure is constructed using CPS-MORG files for full-time private-sector workers aged 18 to 65 years. Wages are converted into constant 2020 dollars (to account for inflation) using the R-CPI-U-RS price series. I restrict the sample to nonimputed earners and trim high and low outliers. Estimates are adjusted using appropriate CPS weights. (a) Unionization Rates by wage quantiles, (b) Unionization Rates by age, male and (c) Unionization Rates by age, female.
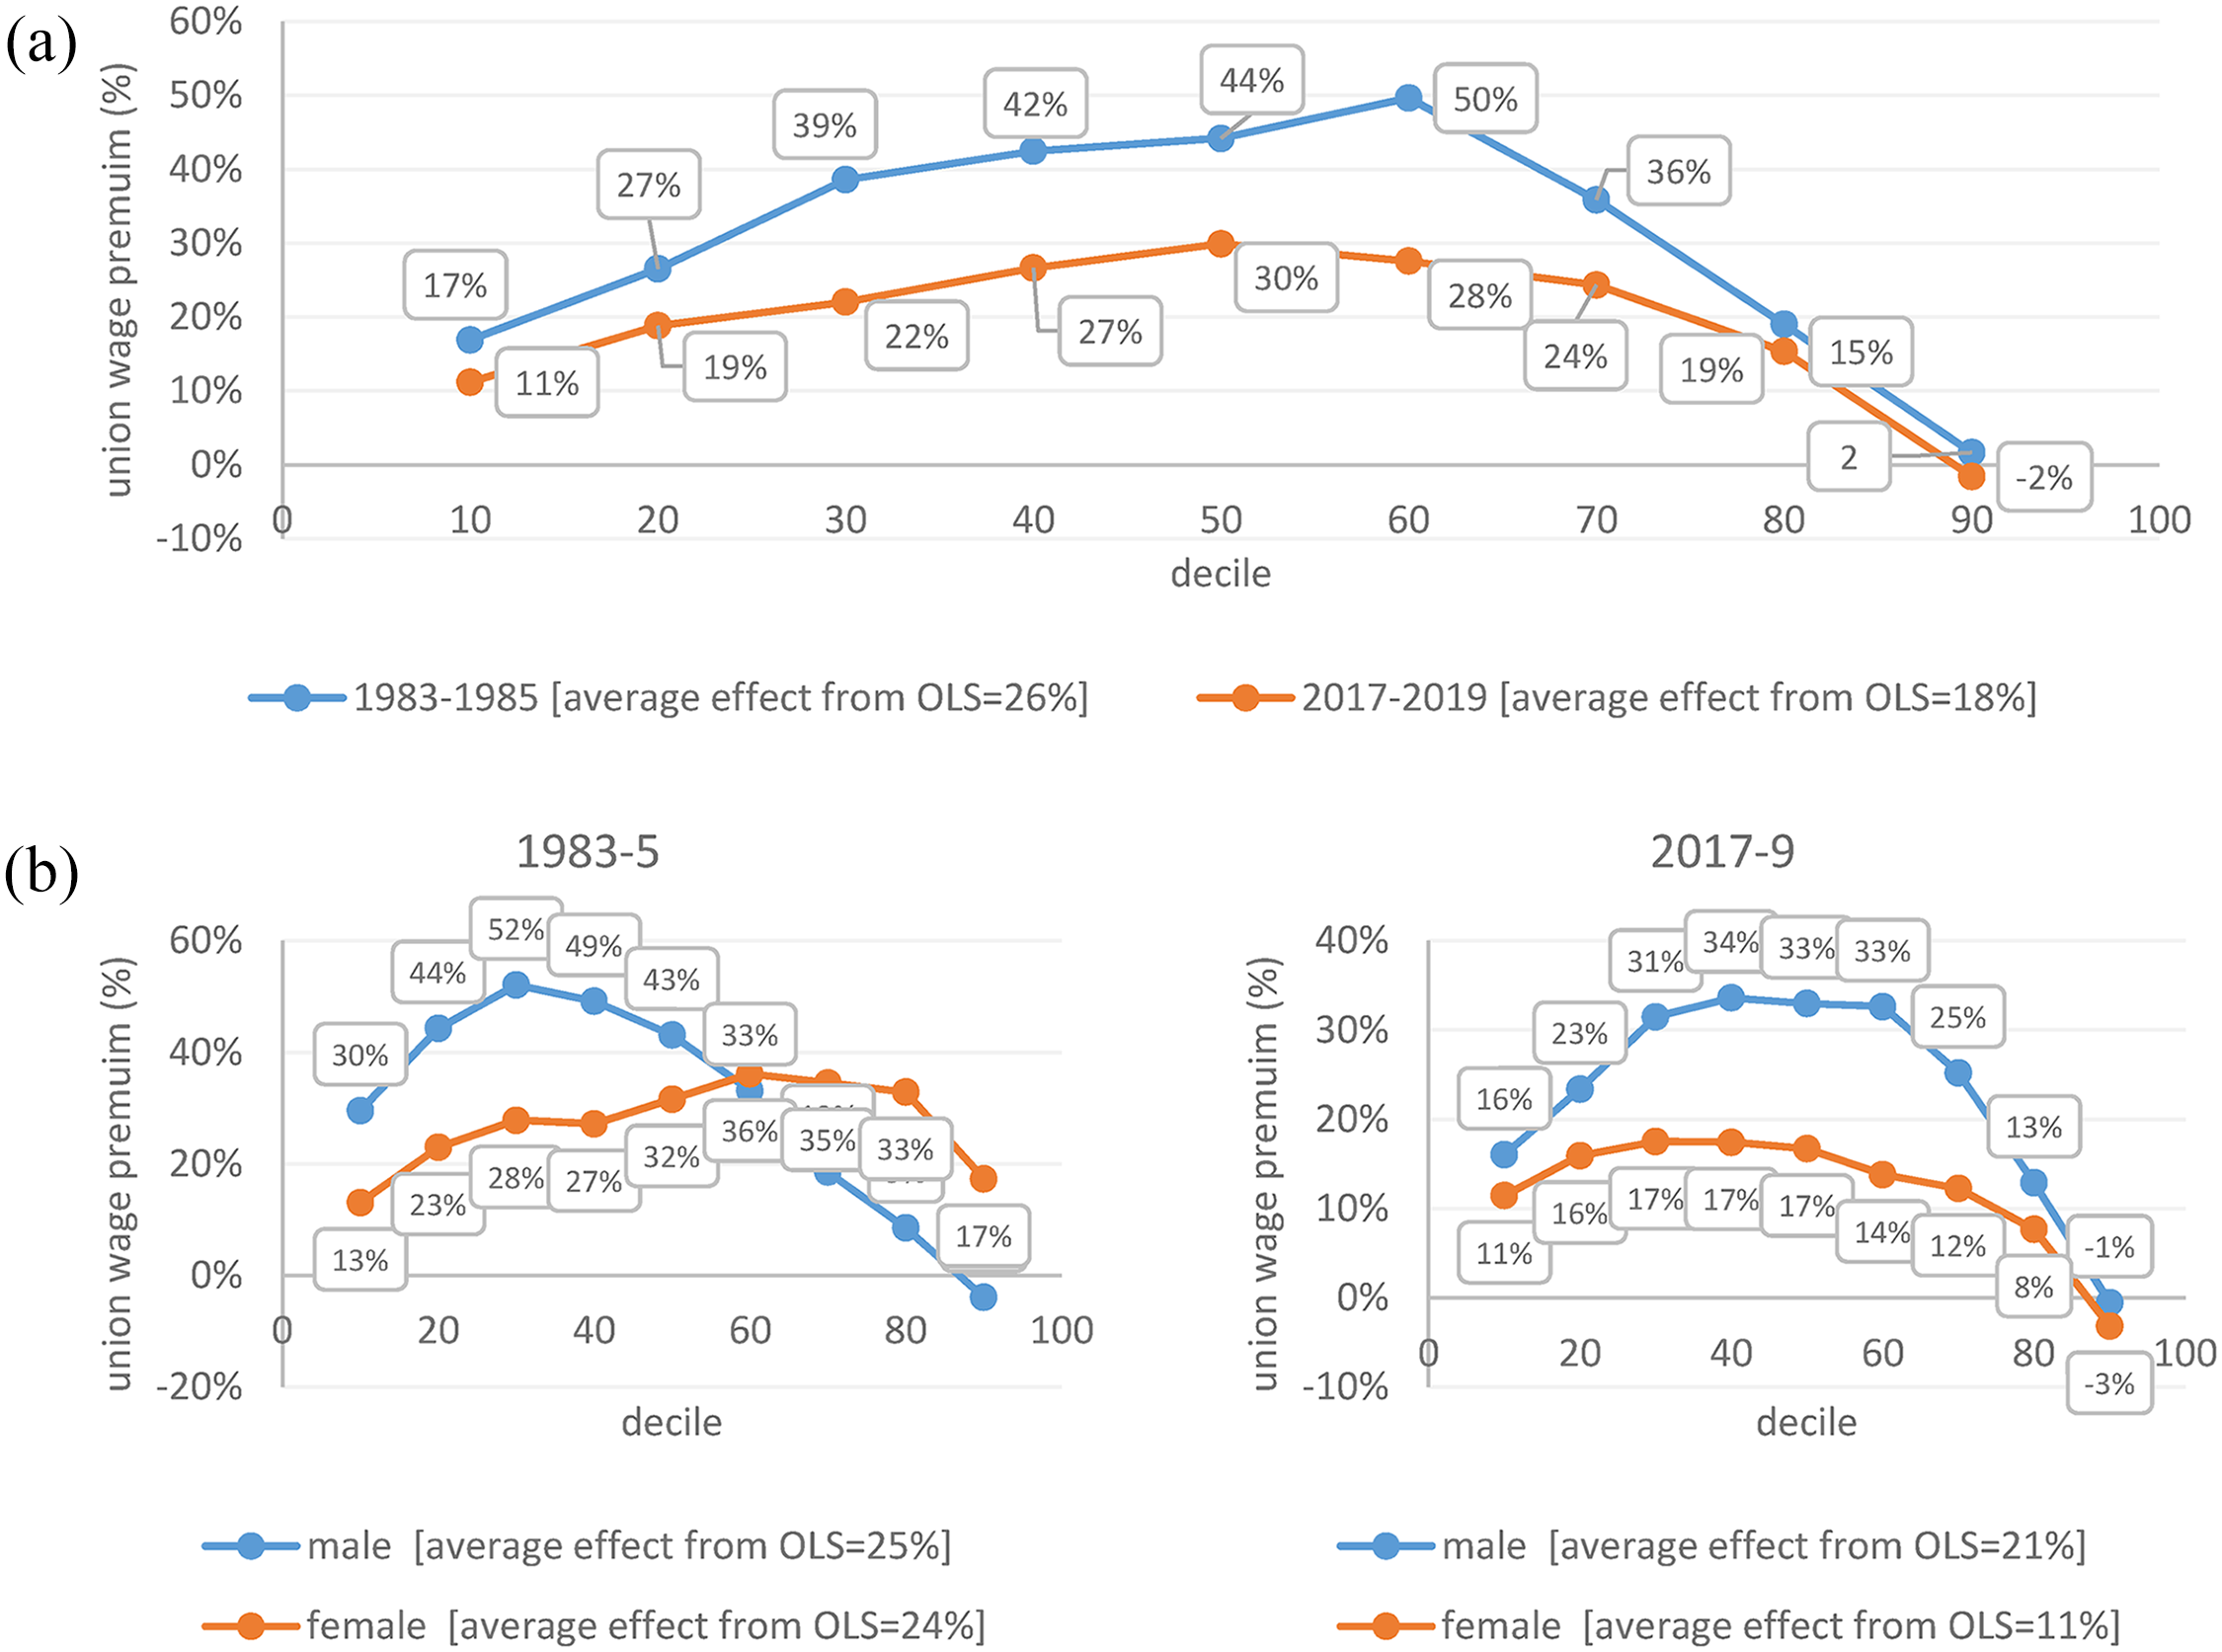
Union wage premium by wage quintiles and gender, 1983 to 1985 and 2017 to 2019. Notes: The figure is constructed using CPS-MORG files for full-time private-sector workers aged 18 to 65 years. Wages are converted into constant 2020 dollars (to account for inflation) using the R-CPI-U-RS price series. I restrict the sample to nonimputed earners and trim high and low outliers. Regression models include the following set of covariates: gender, marital status, age and age squared, metropolitan area, region, four mutually exclusive race/ethnicity measures (non-Hispanic white, non-Hispanic African-American, non-Hispanic other, and Hispanic), four mutually exclusive education measures (less than high school, high school diploma or equivalent, some college, 4 or more years of college), one-digit industry codes, one-digit occupation codes, hours worked per week, and year fixed-effects. Models are weighted to be representative of the active workforce. (a) Unconditional quantile regression estimates of the effect of union status on log wages, 1983–85 and 2017–2019 and (b) Unconditional quantile regression estimates of the effect of union status on log wages by gender, 1983–85 and 2017–2019.
Figure 4 shows union density by wage quantiles and basic demographic—age groups and gender—from 1983 onward. The figures reveal two interesting trends. First, the decline in union density was mostly among workers in the upper three wage quantiles, mainly among middle-age men. In 2019, only a small fraction of high-wage workers was organized—7.8% of workers at the top wage quintile and 10.4% of workers at the fourth wage quintile—about the third of the numbers in 1983. Second, the upsurge in union organizing seems to be mostly among young male workers in the lower two wage quintiles. It is therefore safe to assume that union structural bargaining power over work conditions was much higher in 1983 than in 2020. Yet the most recent organizational success among professional high-wage workers (such as journalists and architects), which probably appears in 2021 to 2022 data, may increase union bargaining power.
That a typical union member in recent years substantially differs from the typical union member back in the early 1980s has probably affected union bargaining power and, consequently, its impact on unionized and nonunionized workers’ earnings. We know from Firpo et al. (2009) that in the early 1980s, the union wage premium varied for workers at different wage levels. To show by how much, I estimated the union wage premium at various points along the wage distribution by analyzing Unconditional Quantile Regression (UQR) models. Unconditional quantile regression defines quantile pre-regression and then estimates the union wage premium at various points on the wage distribution. UQR differs from the more commonly used conditional quantile regression that estimates the union wage premium at different points of the wage distribution within each gender and educational group (or other covariates).
Figure 5a depicts results from UQR estimates of the effect of union status on log wages for all workers in 1983 to 1985 and 2017 to 2019. Clearly, the union wage premium is highly nonmonotonic—it rises over the first six deciles of the wage distribution and then declines. Hence typical workers whose weekly earnings are around the median of the earnings distribution (between the 30th and the 70th wage percentile) benefit the most—in terms of their wages—from being unionized: more in 1983 to 1985 than in 2017 to 2019; next are low-wage and high-wage workers, and workers at the 90th wage percentile do not benefit from being unionized. It is well recognized that among low-wage workers, unmeasured skills positively correlate with union status (i.e. union members are positively selected), which leads to a positive bias in the union wage premium in OLS estimates for low-wage workers. This means that the “true” union wage premium for low-wage workers is even lower than estimated by UQR models. The pattern of union wage premium by wage level presented in Figure 5a somewhat differs from the known pattern that was calculated only for males by Firpo et al. (2009). Figure 5b presents the results of the same models as Figure 5a, but by gender. The graph for males in 1983 to 1985 shows the same pattern found by Firpo et al. (2009). The graph for females is similar but contracted—the union wage premium for a female is lower than for a male.
Taking together the characteristics of union membership in recent years (Figure 4) and union wage premiums by wage level and gender (Figure 5), suggest a less promising result for what unions can do today to workers’ earnings, even if union density would have significantly increased.
Conclusions
This article is not about how to strengthen and rebuild the collective bargaining system in the United States and the feasibility of such policies. It focuses solely on the estimated impact of increasing unionization to its level in the early 1980s—about 20%—examining whether this policy is worthwhile. The findings suggest that increasing private-sector unionization is an important tool for fueling wage growth for low-wage workers and even more for typical workers (median-wage). Having said that, since the early signs of an upsurge in union organizing arise mainly among low-wage workers with weaker structural bargaining power than formerly, the benefits from restoring union density and power will likely be lower today than in the past.
Footnotes
Declaration of Conflicting Interests
The author(s) declared no potential conflicts of interest with respect to the research, authorship, and/or publication of this article.
Funding
The author(s) received no financial support for the research, authorship, and/or publication of this article.