
Abstract
Objectives
Current pharmacological antidepressant treatments suffer from low remission rates and slow initiation of therapeutic effects. In addition, the development of new antidepressant treatments is confounded by the lack of consensus on efficient and valid neurophysiological targets. Temporal complexity is an alternative measure of dynamic brain activity that estimates brain signal variability at several timescales. It can be easily extracted from non-invasive brain recordings and provides new insights into pathophysiological mechanisms. We aim to assess the potential of brain temporal complexity as a novel neuromarker to predict the effectiveness of antidepressant treatments.
Method
We measured longitudinal changes in temporal complexity of electroencephalography signals in patients undergoing 8 weeks of escitalopram treatment through a Canadian Biomarker Integration Network in Depression (CAN-BIND) trial.
Results
As early as 2 weeks after the start of treatment, reduction of complexity in fine timescales was associated with improvement in depressive symptoms. After 8 weeks of treatment, the treatment-related effect shifted towards an increase in coarse timescale complexity, linked to symptom improvement.
Conclusions
These results suggest a relative shift away from local, segregated information processing, measured by complexity at fine timescales, in the short term, potentially in favour of a higher long-range communication across networks, as indicated by higher complexity measures at coarse timescales in the long term. Further research into the modulation of multiscale temporal complexity by antidepressant treatments could open new possibilities for faster-acting and more efficient treatments.
Plain Language Summary Title
Changes in Complexity of Brain Activity During Treatment for Depression: A CAN-BIND-1 Study Report
Plain Language Summary
Over 300 million people worldwide suffer from depression. Current antidepressant treatments take a long time to take effect and only 30-50% of patients respond to treatment. Additionally, the development of new antidepressant treatments is made difficult by a lack of consensus on which brain processes are altered in depression and should be targeted relieve patients’ symptoms.
Measuring the complexity of brain activity, i.e. how predictable or regular the brain activity is, could provide new insights into how brain activity changes throughout antidepressant treatment and could help us assess how a patient responds to a treatment and if the treatment is effective.
We measured changes in complexity of brain activity, measured by electroencephalography (EEG) signals, in depressed patients while they received escitalopram antidepressant treatment through a Canadian Biomarker Integration Network in Depression (CAN-BIND) clinical trial. We measured how the complexity of brain activity changes after 2 weeks and 8 weeks of treatment, compared to pretreatment EEG patterns.
As early as two weeks after the start of treatment, we observed that patients who exhibited a stronger reduction of complexity of fast brain activity also saw greater improvements in their depressive symptoms. In the long term, after eight weeks of treatment, this relationship shifted and patients who exhibited a stronger increase of complexity of slow brain activity saw greater improvements in their depressive symptoms.
Our results suggest that antidepressant treatment could act by decreasing local processing of information in the brain (measured by complexity of fast brain activity) in favour of increasing long-range communication across brain regions (measured by complexity of slow brain activity). This finding opens new possibilities for the development of faster-acting and more efficient antidepressant treatments that modulate complexity of brain activity.
Introduction
Major depressive disorder (MDD) affects over 300 million people worldwide, 1 placing it among the most prevalent and disabling health disorders.2–4 First-line antidepressants, usually serotonin reuptake inhibitors (SSRIs), require several weeks to produce therapeutic effects 5 and yield remission rates below 50%, often requiring several trials with different medications to achieve remission. 6 Identifying alternative antidepressant targets and faster and more efficient treatments remain a priority to enhance the lives of people with MDD.
Electroencephalography (EEG), an affordable and non-invasive method of recording brain electrophysiology, has been explored as a tool for predicting antidepressant response. Classical methods of resting-state EEG signal analysis extract frequency-domain information, including phase and amplitude of cortical oscillations, and previous studies have identified altered patterns of cortical oscillations in MDD7,8 which have shown promise in predicting response to pharmacological antidepressant treatments.9–14
However, cortical oscillations only provide a partial view of dynamic brain activity. Oscillatory measures capture the presence of regular, predictable and narrow band brain activity. Brain activity, however, is known to show a high degree of temporal variability 15 and exhibit complex patterns spanning several temporal and spatial scales. 16 Such complex brain activity makes a significant contribution to human behaviour and healthy cognition during development and aging.17,18
Complex signals convey more information19–21 and the complexity of brain signals has been linked to cortical information processing capabilities. 22 Multiscale complexity measures temporal correlations at several levels of a system and can be used to estimate the extent to which specialized local neural units are globally integrated within large-scale brain networks. 23 These findings suggest that multiscale complexity captures important information about physiological processes.
As such, complexity may offer new insights into pathological conditions and their treatment.24–27 An open-label pharmacological study of mirtazapine treatment for 6 months reported an association between reduction in Lempel-Ziv complexity and improvement in clinical symptoms. 28 Additionally, responders to seizure therapy (here defined as Electroconvulsive Therapy, ECT, or Magnetic Seizure Therapy, MST), one of the most effective antidepressants, exhibited reduced complexity in fine timescales in selective brain regions. This association was particularly evident in parieto-occipital regions and source localized to nodes of the default mode network (e.g., posterior cingulate cortex and precuneus). 24
Despite these promising findings, few studies have investigated modulation of brain temporal complexity by antidepressant treatment. Moreover, existing studies had very limited sample sizes (<40 patients). It remains unclear whether these findings generalize to pharmacological treatments and whether SSRIs also modulate complexity in a large cohort.
In the current study, we investigated if an SSRI, escitalopram, modulates brain temporal complexity. We collected resting-state EEG signals and Montgomery–Åsberg Depression Rating Scale (MADRS) scores in a cohort of patients with MDD undergoing 8 weeks of open-label escitalopram treatment from multiple centres across Canada as part of the first CAN-BIND study.29,30 EEG data and scores of symptom severity were collected at baseline, after 2 weeks and 8 weeks after the start of treatment. We measured changes in complexity at multiple temporal scales at an early (week 2) stage of the treatment to capture fast treatment response and at an intermediate-term (week 8) to capture longer lasting changes in brain activity. Taking prior findings into consideration, 24 we hypothesized that reduction in depressive symptoms following escitalopram treatment would be associated with an early and long-term reduction in complexity at fine timescales. We first conducted a hypothesis-driven analysis focused on changes in fine timescale in two regions of interest (fronto-central and parieto-occipital regions) identified in prior reports. 24 However, escitalopram might modulate brain temporal complexity beyond these specific regions and timescales. To assess this, in a second step, we extended our analysis to other timescales across the whole brain.
Methods
Participants
Participants were recruited as part of the CAN-BIND 1 study at four sites in Canada where EEG was acquired: University of British Columbia (UBC), Queen's University (QNS), Toronto General Hospital (TGH), and Centre for Addiction and Mental Health (CAMH). Of the 132 recruited participants, 125 participants were included in the analysis (94.7% retention). Seven participants were excluded due to early drop-out before completing the visit at week 8. See Supplemental Figure S1 for study flow diagram.
The study protocol is in accordance with the Declaration of Helsinki. It was approved by the research ethics board of each institution included in the study and registered with clinicaltrials.gov (https://clinicaltrials.gov/ct2/show/NCT01655706). All participants gave informed written consent.
Recruited participants aged between18 to 60 years and met inclusion criteria, including (1) DSM-IV criteria for a Major Depressive Episode of at least 3 months duration and a diagnosis of MDD, according to a Mini-International Neuropsychiatric Interview; (2) remained free of psychotropic medications for at least five half-lives before the baseline visit; (3) had a MADRS score equal or superior to 24; and (4) were fluent in English. Exclusion criteria are provided in Supplemental material. Further details on inclusion and exclusion criteria can be found in reference [29].
Visits and Clinical Assessments
After a baseline visit, participants underwent an 8-week treatment trial with clinical assessments at baseline and every two weeks thereafter. At the week 8 visit, responders were identified as participants with a ≥ 50% decrease in the MADRS score from baseline; other participants were identified as non-responders.
Pharmacological Treatment
Participants received open-label escitalopram treatment starting at 10 mg/day, which could be increased to 20 mg/day during the second week or later if clinically indicated. If participants were unable to tolerate the 20 mg dose, it could be reduced to 10 mg at the treating psychiatrist's discretion. The half-life of escitalopram is 27 to 33 h and steady-state concentration levels are reached after 7 to 10 days of administration.31,32 See references [29,30] and Supplemental Table S2 for further details on the pharmacological treatment.
EEG Recording and Data Standardization
Five minutes of eyes-closed resting-state EEG was recorded at baseline, and then at 2 and 8 weeks after the start of the treatment. More details on EEG recording are given in Supplemental material.
Datasets across sites were standardized using the EEGLAB toolbox 33 running on MATLAB. Data were down-sampled to 512 Hz and re-referenced to average reference. A fully automatic pipeline, adapted from the ERPEEG toolbox 34 was used for EEG data cleaning. Data were high-pass filtered at 0.5 Hz using a second-order Butterworth infinite impulse response (IIR) filter. Following automatic detection with the EEGLAB plugin clean_rawdata, bad channels were removed while bad data segments were corrected. Line noise at 60 Hz and its harmonics were removed using the ZapLine method. 35 Infomax Independent Component Analysis (ICA) was applied to data high-pass filtered at 1 Hz. 36 The components associated with artefacts were identified automatically using the ICLabel algorithm 37 and then removed from the original data high-pass filtered at 0.5 Hz. Lastly, spherical decomposition was used to interpolate deleted channels, and EEG data were re-referenced to average.
EEG Source Localization
Brainstorm software 38 was used for EEG source localization. Reconstructed sources were grouped into 148 regions of interest. An averaged source-level time series of 5 min resting-state signal was obtained for each region of interest.39,40 More details can be found in the Supplemental material.
Multiscale Entropy
Sample entropy (SE) was computed over multiple timescales. The profile of SE over several timescales is called multiscale entropy (MSE). SE estimates the predictability of signal amplitude by identifying repeating patterns in the time-series. 41 We set the length of patterns to two consecutive data points (m = 2), and two patterns were considered to match if their absolute amplitude differed by less than 15% of the standard deviation of the signal (r = 0.15). 24 SE measurement was repeated for 70 timescales using the coarse graining procedure. 41 The signal at timescale t is the original signal averaged inside non-overlapping time windows of length t. Hence, considering the sampling rate of our EEG data, SE at scales 1, 12 and 35 corresponds to sampling rates of 512, 42.67 and 14.63 Hz and time windows of 23.44, 68.36 and 1.95 ms, respectively. See Supplemental Table S3 for full table.
Prior to calculating MSE, EEG data were low-pass filtered at 50 Hz using a second-order Butterworth IIR filter. The 5min resting-state EEG data was then divided into 30 s epochs. For all 58 electrodes and all 148 sources, MSE was computed on each 30 s epoch and then averaged over all epochs. 24
Statistics
At baseline, we compared age and MADRS scores between responders and non-responders using independent sample t-tests. Chi-squared test was used to compare sex between responders and non-responders.
Mixed models with repeated measures were then used to examine the effects of antidepressant response on MSE for the main effect of Antidepressant Response (responder and non-responder), Time (baseline, week 2 and week 8), and the interaction effect Antidepressant Response×Time. For post hoc comparisons, we performed independent sample t-tests to compare MSE between groups of responders and non-responders for each time point (baseline, week 2 and week 8). We also performed paired sample t-tests and compared MSE values between week 2 and baseline (early change) and week 8 and baseline (late change) for both antidepressant response groups (responder and non-responder). Lastly, Spearman's rank correlation was used to examine the association between changes in MSE and percentage reduction in depression symptom severity, both for early and late changes.
Initially, we restricted our statistical analyses to fine timescales (1–11 timescales) and on two clusters of electrodes, a fronto-central and a parieto-occipital cluster identified in Farzan et al. 24 Then, we performed all analyses for three timescale categories (fine: 1–11, mid: 12–34, and coarse 35–70), across all electrodes in sensor space, and all reconstructed sources in source space. Fine and mid and timescale categories were defined based on timescale categories identified in Farzan et al. 24 and found to be modulated by antidepressant treatment. The coarse timescale category comprises timescales not investigated by previous studies.
Cluster-based non-parametric permutation tests were used to correct for multiple comparisons over fine timescales for our initial local analysis and over timescale and channels for our whole-brain analysis (5000 permutations, two-tailed, alpha = 0.05, see Supplemental material for more details). 42 Post hoc t-test comparisons in source space were performed only for significant sensor-level post hoc t-test results, with no multiple comparisons correction applied. 43
Results
Demographic and Clinical Characteristics
In total, 125 participants were included with 56 identified as responders and 69 as non-responders at week 8 (Table 1). No differences in age (p = 0.806), sex (p = 0.464), or MADRS score at baseline (p = 0.296) were observed between responders and non-responders. The proportions of responders and non-responders did not vary significantly between recording sites (see Supplemental Table S1).
Demographics and Clinical Characteristics (mean ± SD).
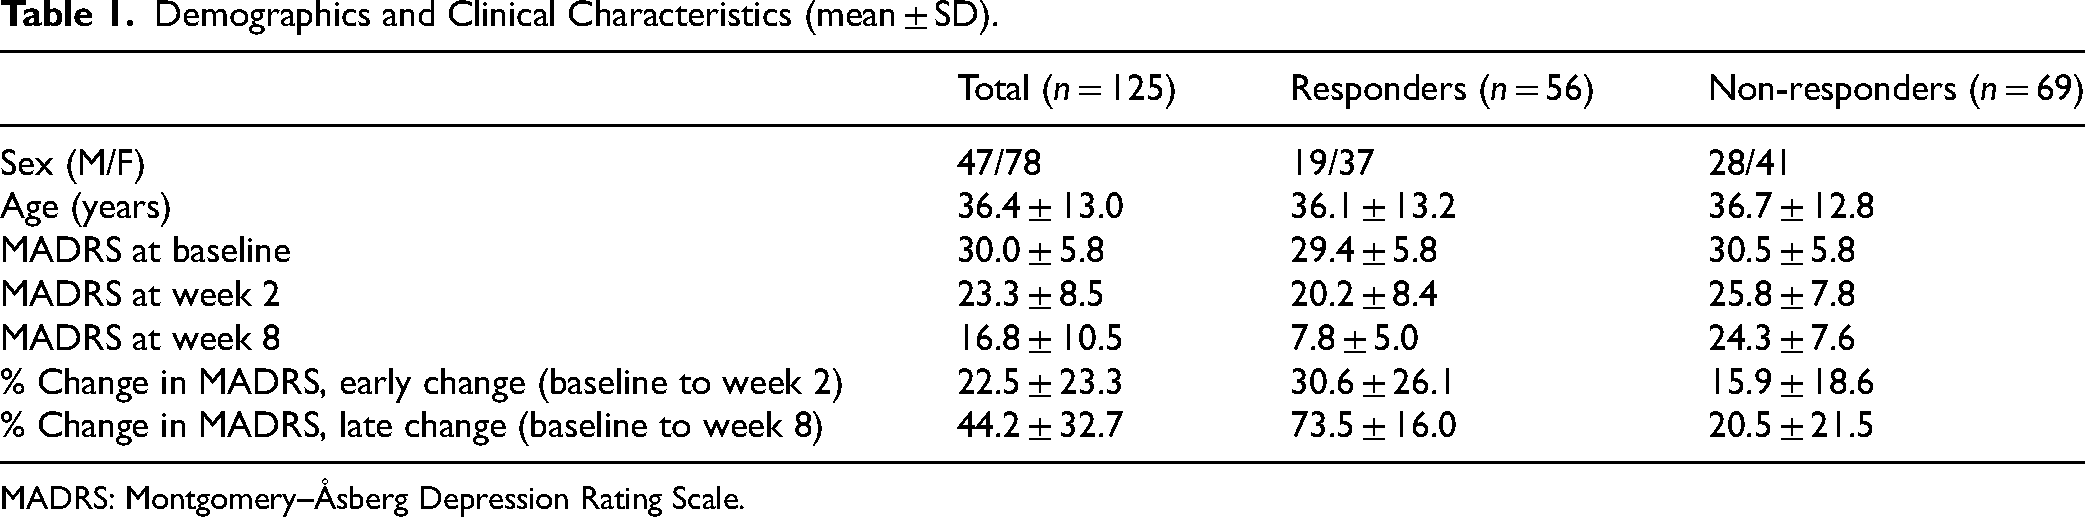
MADRS: Montgomery–Åsberg Depression Rating Scale.
Changes in Fronto-Central and Parieto-Occipital Fine Scale Complexity Over Escitalopram Treatment
The first analysis step assessed fine timescales (1–11) in the fronto-central and parieto-occipital areas. A mixed-model with repeated measures revealed a significant main effect of Time (F = 3.73, p = 0.0268) at timescale 2 and a significant interaction effect of Time×Response at several timescales (F between 3.08 and 3.57, p < 0.05) for the fronto-central electrodes cluster (Figure 1(a), first row). For a cluster of parieto-occipital electrodes, there was a significant interaction of Time×Response for several timescales (F between 3.1 and 3.66, p < 0.05) (Figure 1(a), second row). As such several post hoc t-tests and correlation analyses were performed. Cluster-based permutations tests were used to correct for multiple comparisons over timescales for all post hoc tests.
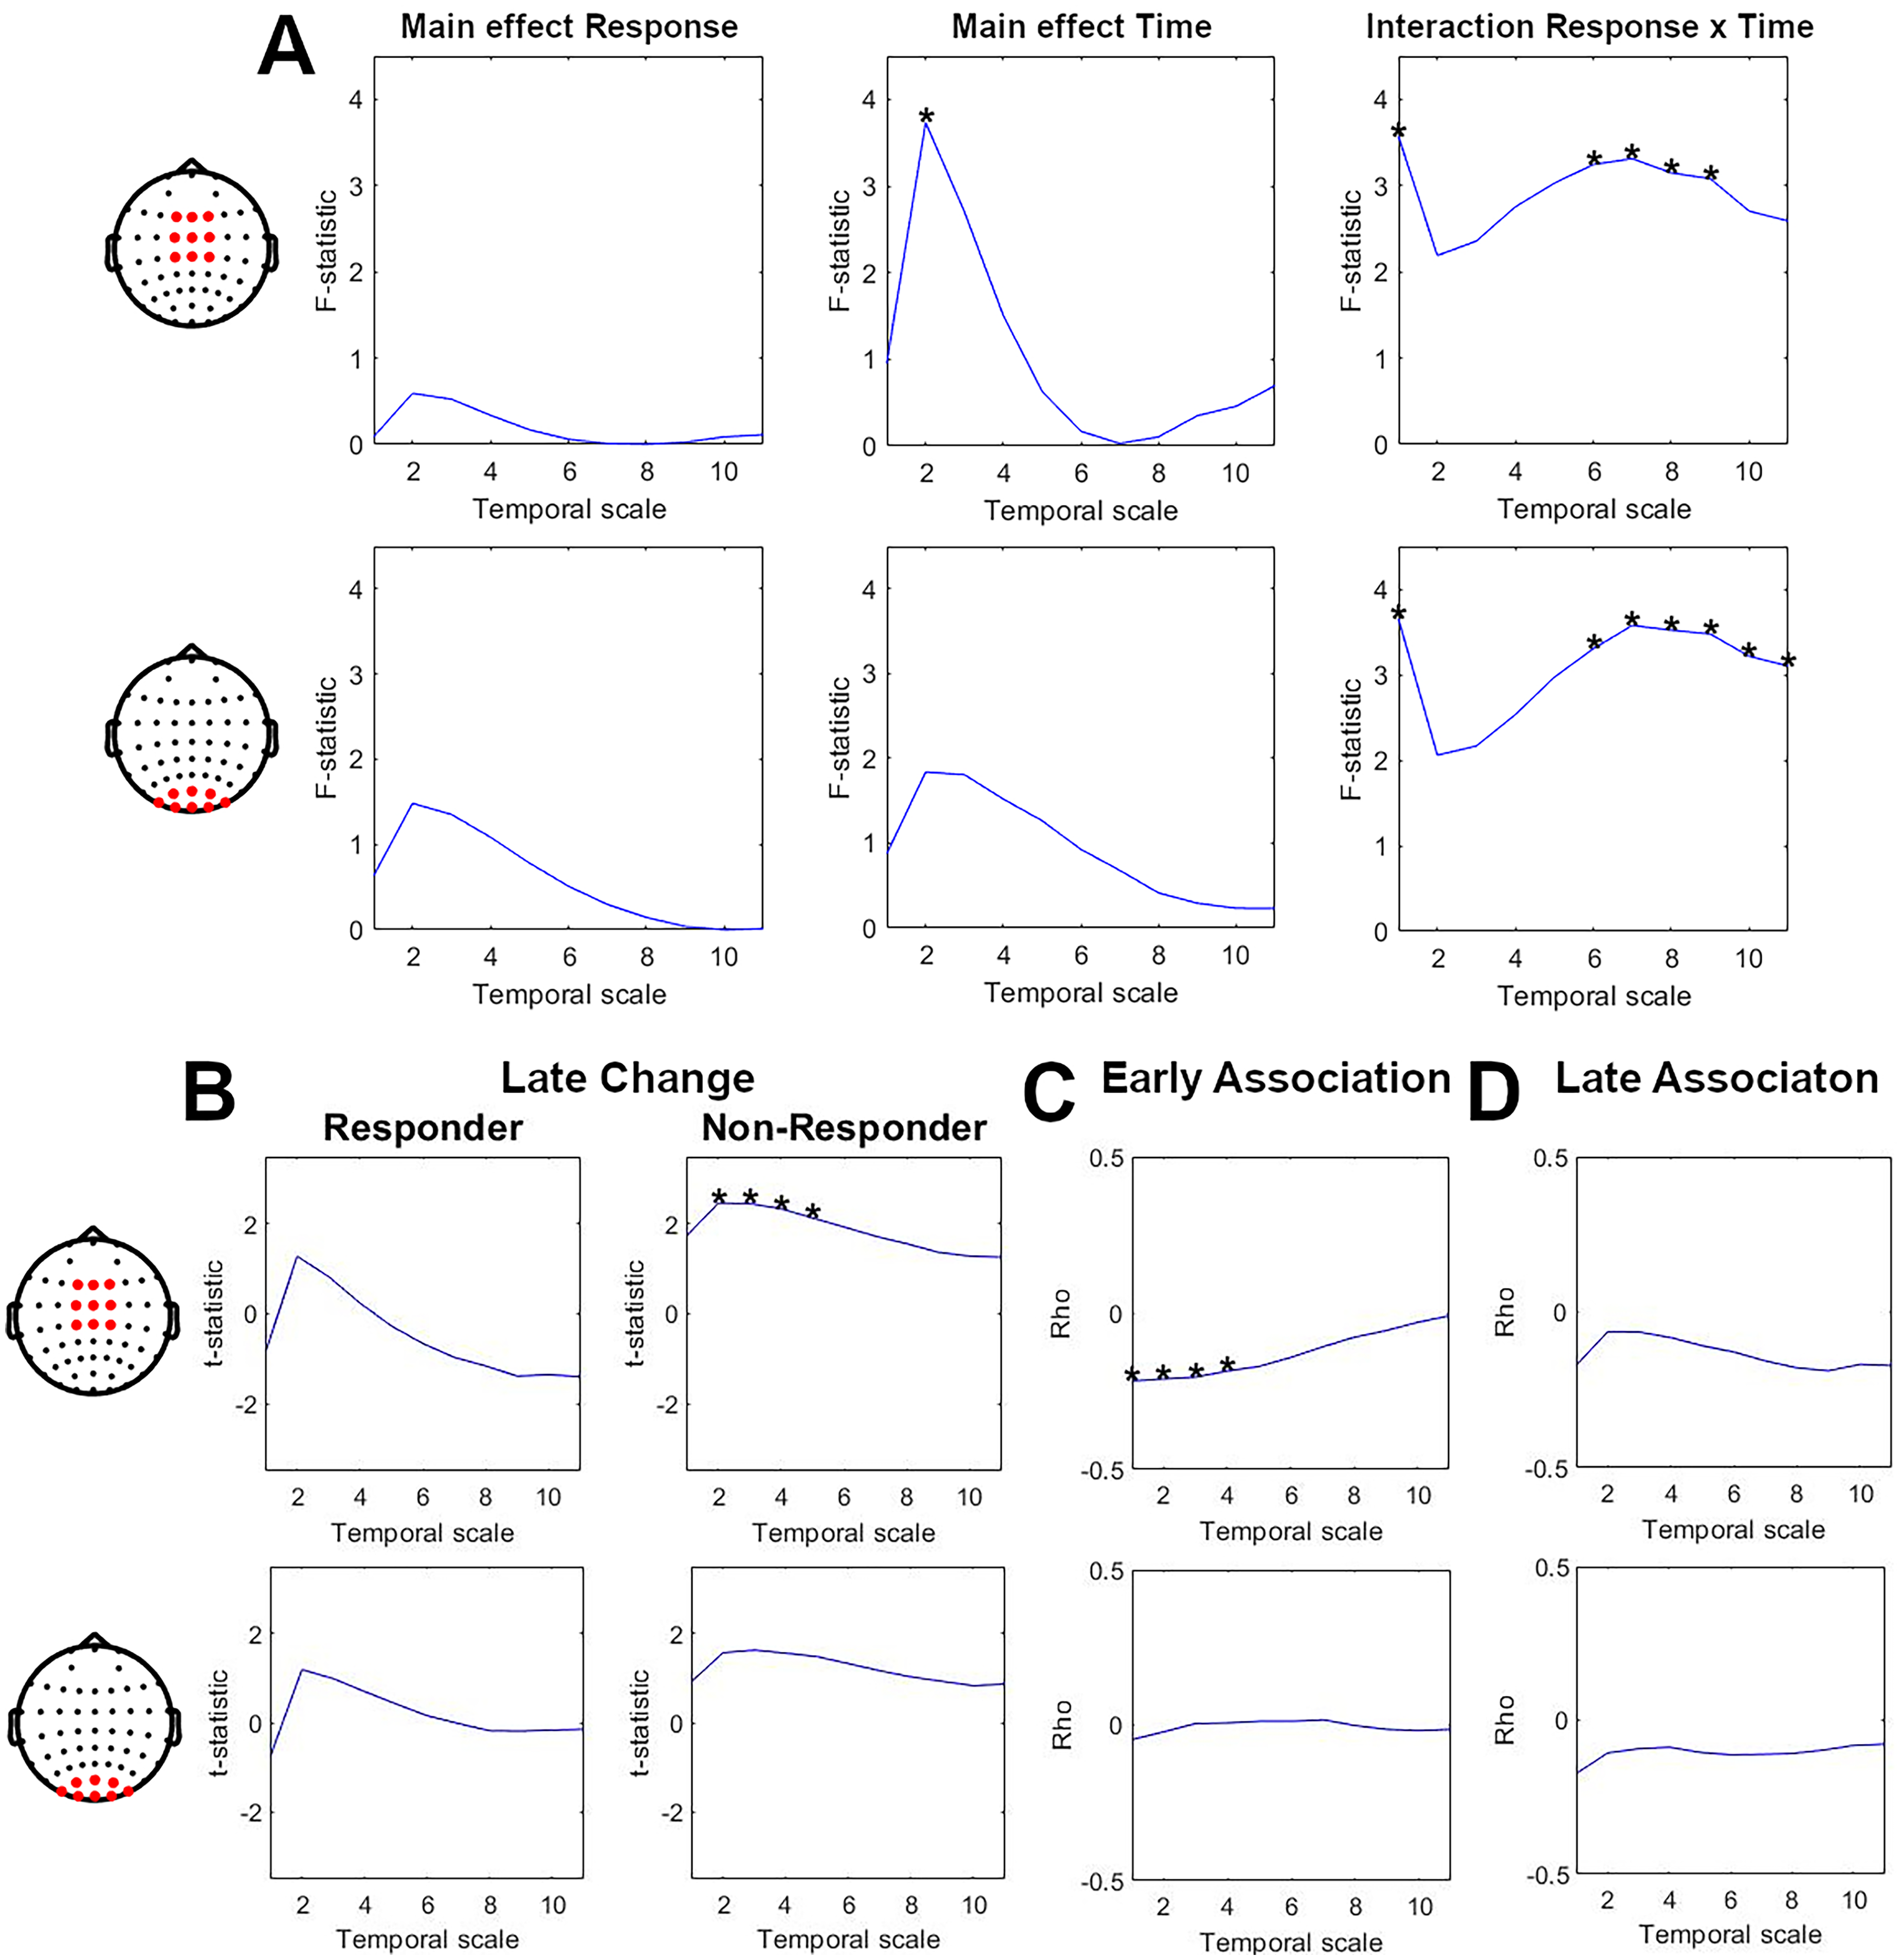
Modulation of complexity at fine timescales during 8 weeks of escitalopram treatment. The first row shows changes in fine timescale complexity (scales 1–11) for a cluster of fronto-central electrodes. The second row shows changes in fine timescale complexity (scales 1–11) for a cluster of parieto-occipital electrodes. Bold stars indicate significant results (p < 0.05). (a) Result of mixed model repeated-measure analysis. The first column shows graphs of F-statistical value along timescales for the main effect of Response (responder, non-responder). The second column shows graphs of F-statistical value along timescales for the main effect of Time (baseline, weeks 2 and 8). The third column shows graphs of F-statistical value along timescales for interaction effect Response×Time. (b) Result of pairwise comparison between complexity at week 8 and baseline for responders (first column) and non-responders (second column). The graphs show t-values on y-axes along timescales on x-axes. (c) Results of correlation analyses for early association (baseline to week 2) between changes in depressive symptoms and changes in complexity at fine timescales. The graphs show rho values on y-axes along with timescales on x-axes. (d) Results of correlation analyses for late association (baseline to week 8) between changes in depressive symptoms and changes in complexity at fine timescales. The graphs show rho values on the y-axis and timescales on the x-axis.
Comparison of temporal complexity between baseline and week 8 showed a significant increase in complexity at scales 2 to 5 for non-responders (cluster p = 0.0244, mean t-statistic = 2.35) in a fronto-central cluster of electrodes (Figure 1(b), second column). This effect was not significant for a parieto-occipital cluster of electrodes (Figure 1(b), second row) or for the responder group (Figure 1(b), first column).
Correlation analyses revealed a significant association between early (baseline to week 2) improvements in depressive symptoms and an early decrease in fine timescale complexity at scales 1 to 4 (cluster p = 0.0248, mean rho = −0.21). This significant association was observed in fronto-central electrodes but not in parieto-occipital electrodes (Figure 1(c)).
None of the other post hoc tests yielded significant results.
Whole-Brain Changes in Multiscale Complexity Over Escitalopram Treatment
In the second step, we extended our analysis to all timescales and all brain regions. In sensor space, there was a significant (p < 0.05) main effect of Response (mean F = 5.20, values between 3.95 and 7.21), Time (mean F = 4.69, values between 3.05 and 13.26), and interaction Response×Time (mean F = 3.84, values between 3.07 and 6.22) across several channels and timescales (Figure 2). Similarly, in source space, there was a significant main effect of Response (mean F = 5.63, values between 3.93 and 10.79), Time (mean F = 4.32, values between 3.07 and 12.94), and interaction Response×Time (mean F = 3.66, values between 3.04 and 6.1) across several ROIs and timescales (Supplemental Figure S2). Therefore, we performed post hoc t-tests and correlation analyses.
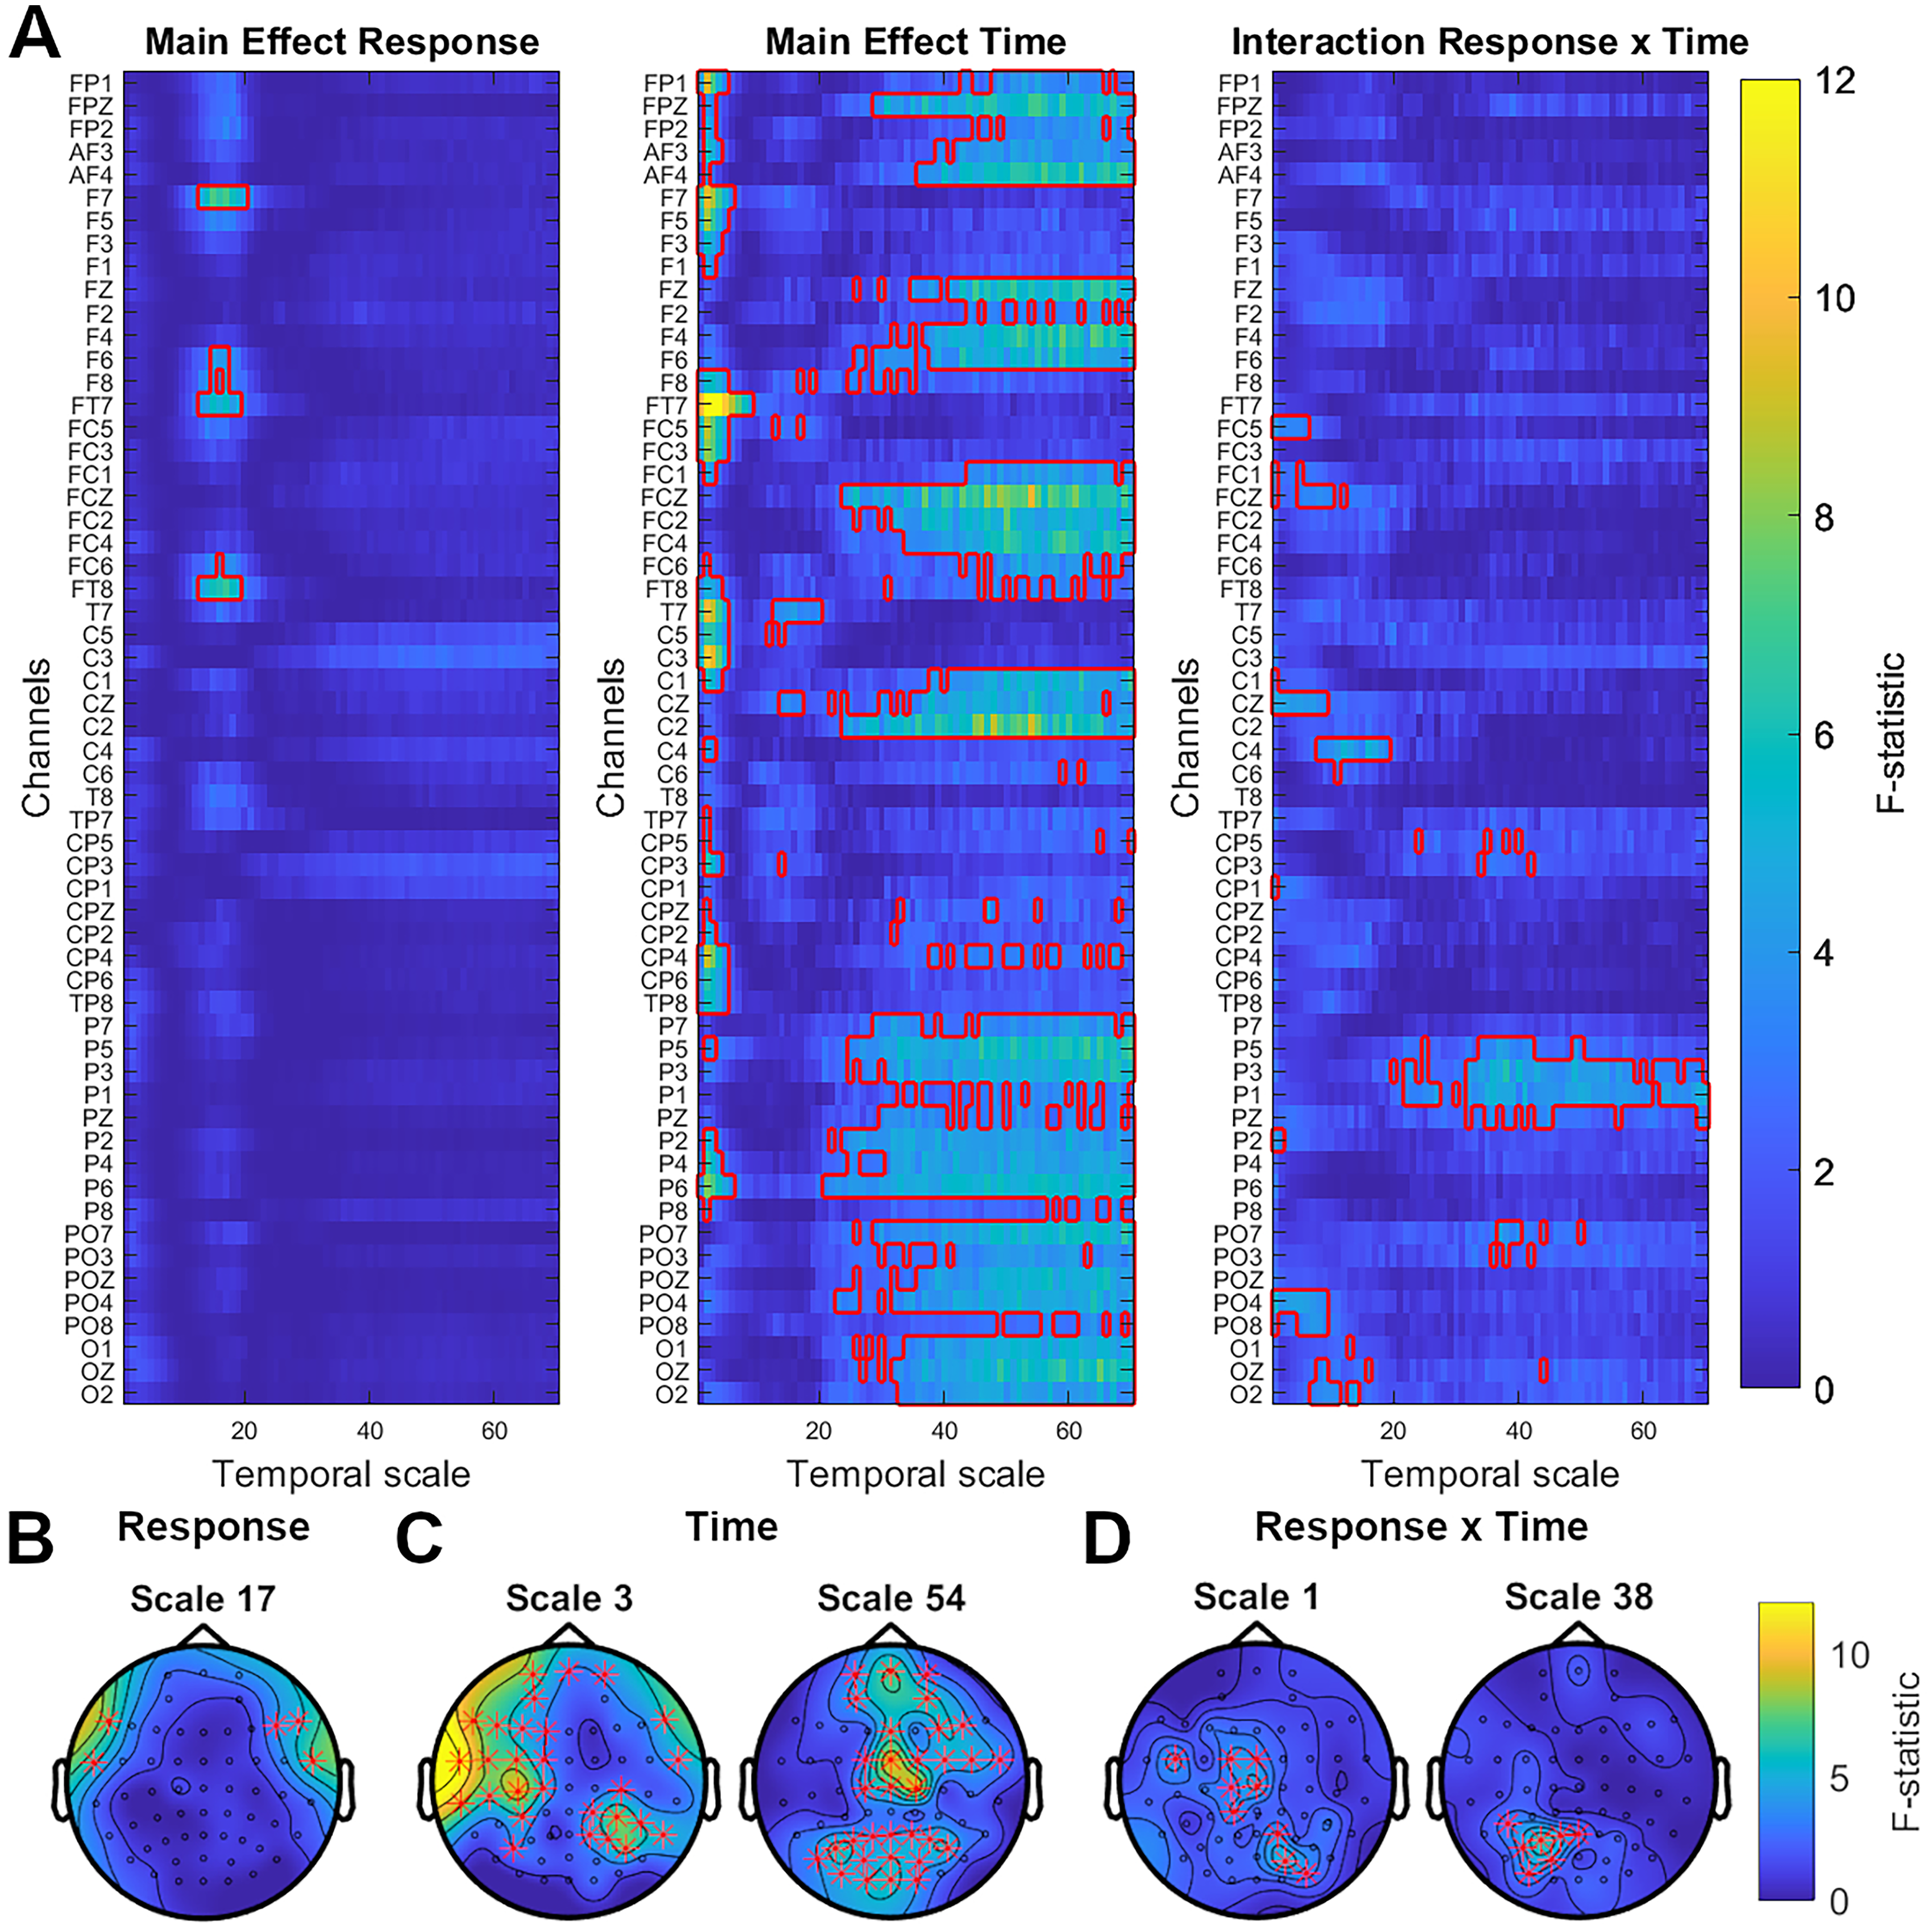
Modulation of multiscale complexity during 8 weeks of escitalopram treatment. (a) Result of sensor-level mixed-model repeated measure analysis for main effect of Response (responder and non-responder), main effect of Time (baseline, week 2 and week 8) and interaction Response×Time. The colour bar shows F-statistic for all channels, indicated on the y-axis, and all timescales, marked on the x-axis. Significant clusters (p < 0.05) are indicated by a red outline. (b)–(d) Topo plots illustrating F-statistic distribution across the scalp at selected timescales for main effect of Response (b), main effect of Time (c) and interaction effect of Response×Time (d).
Post hoc tests revealed significant late changes (baseline to week 8) of complexity for responders and non-responders in coarse and fine timescales, respectively (Figure 3(a)). The significant increase in coarse timescale complexity for responders after 8 weeks of treatment (cluster p = 0.0022, mean t-statistic = 2.61) was widespread over bilateral frontal, fronto-central, central, centro-parietal, parietal, parieto-occipital and occipital electrodes (Figure 3(b)). This effect was source-localized to the left inferior temporal lobe, left inferior parietal lobule and bilateral superior parietal lobule and occipital cortex (Figure 3(c)). For non-responders, there was a significant increase in fine timescale complexity after 8 weeks of treatment (cluster p = 0.008, mean t-statistic = 2.67). This effect was also widespread, covering bilateral frontal, centro-parietal, parietal, temporo-parietal electrodes, as well as left fronto-central, central, temporal and right parieto-occipital electrodes (Figure 3(d)). This effect was source-localized to the left pre- and post-central gyri, left parietal cortex, left superior temporal gyrus and bilateral prefrontal cortex and cingulate cortex (Figure 3(e)).
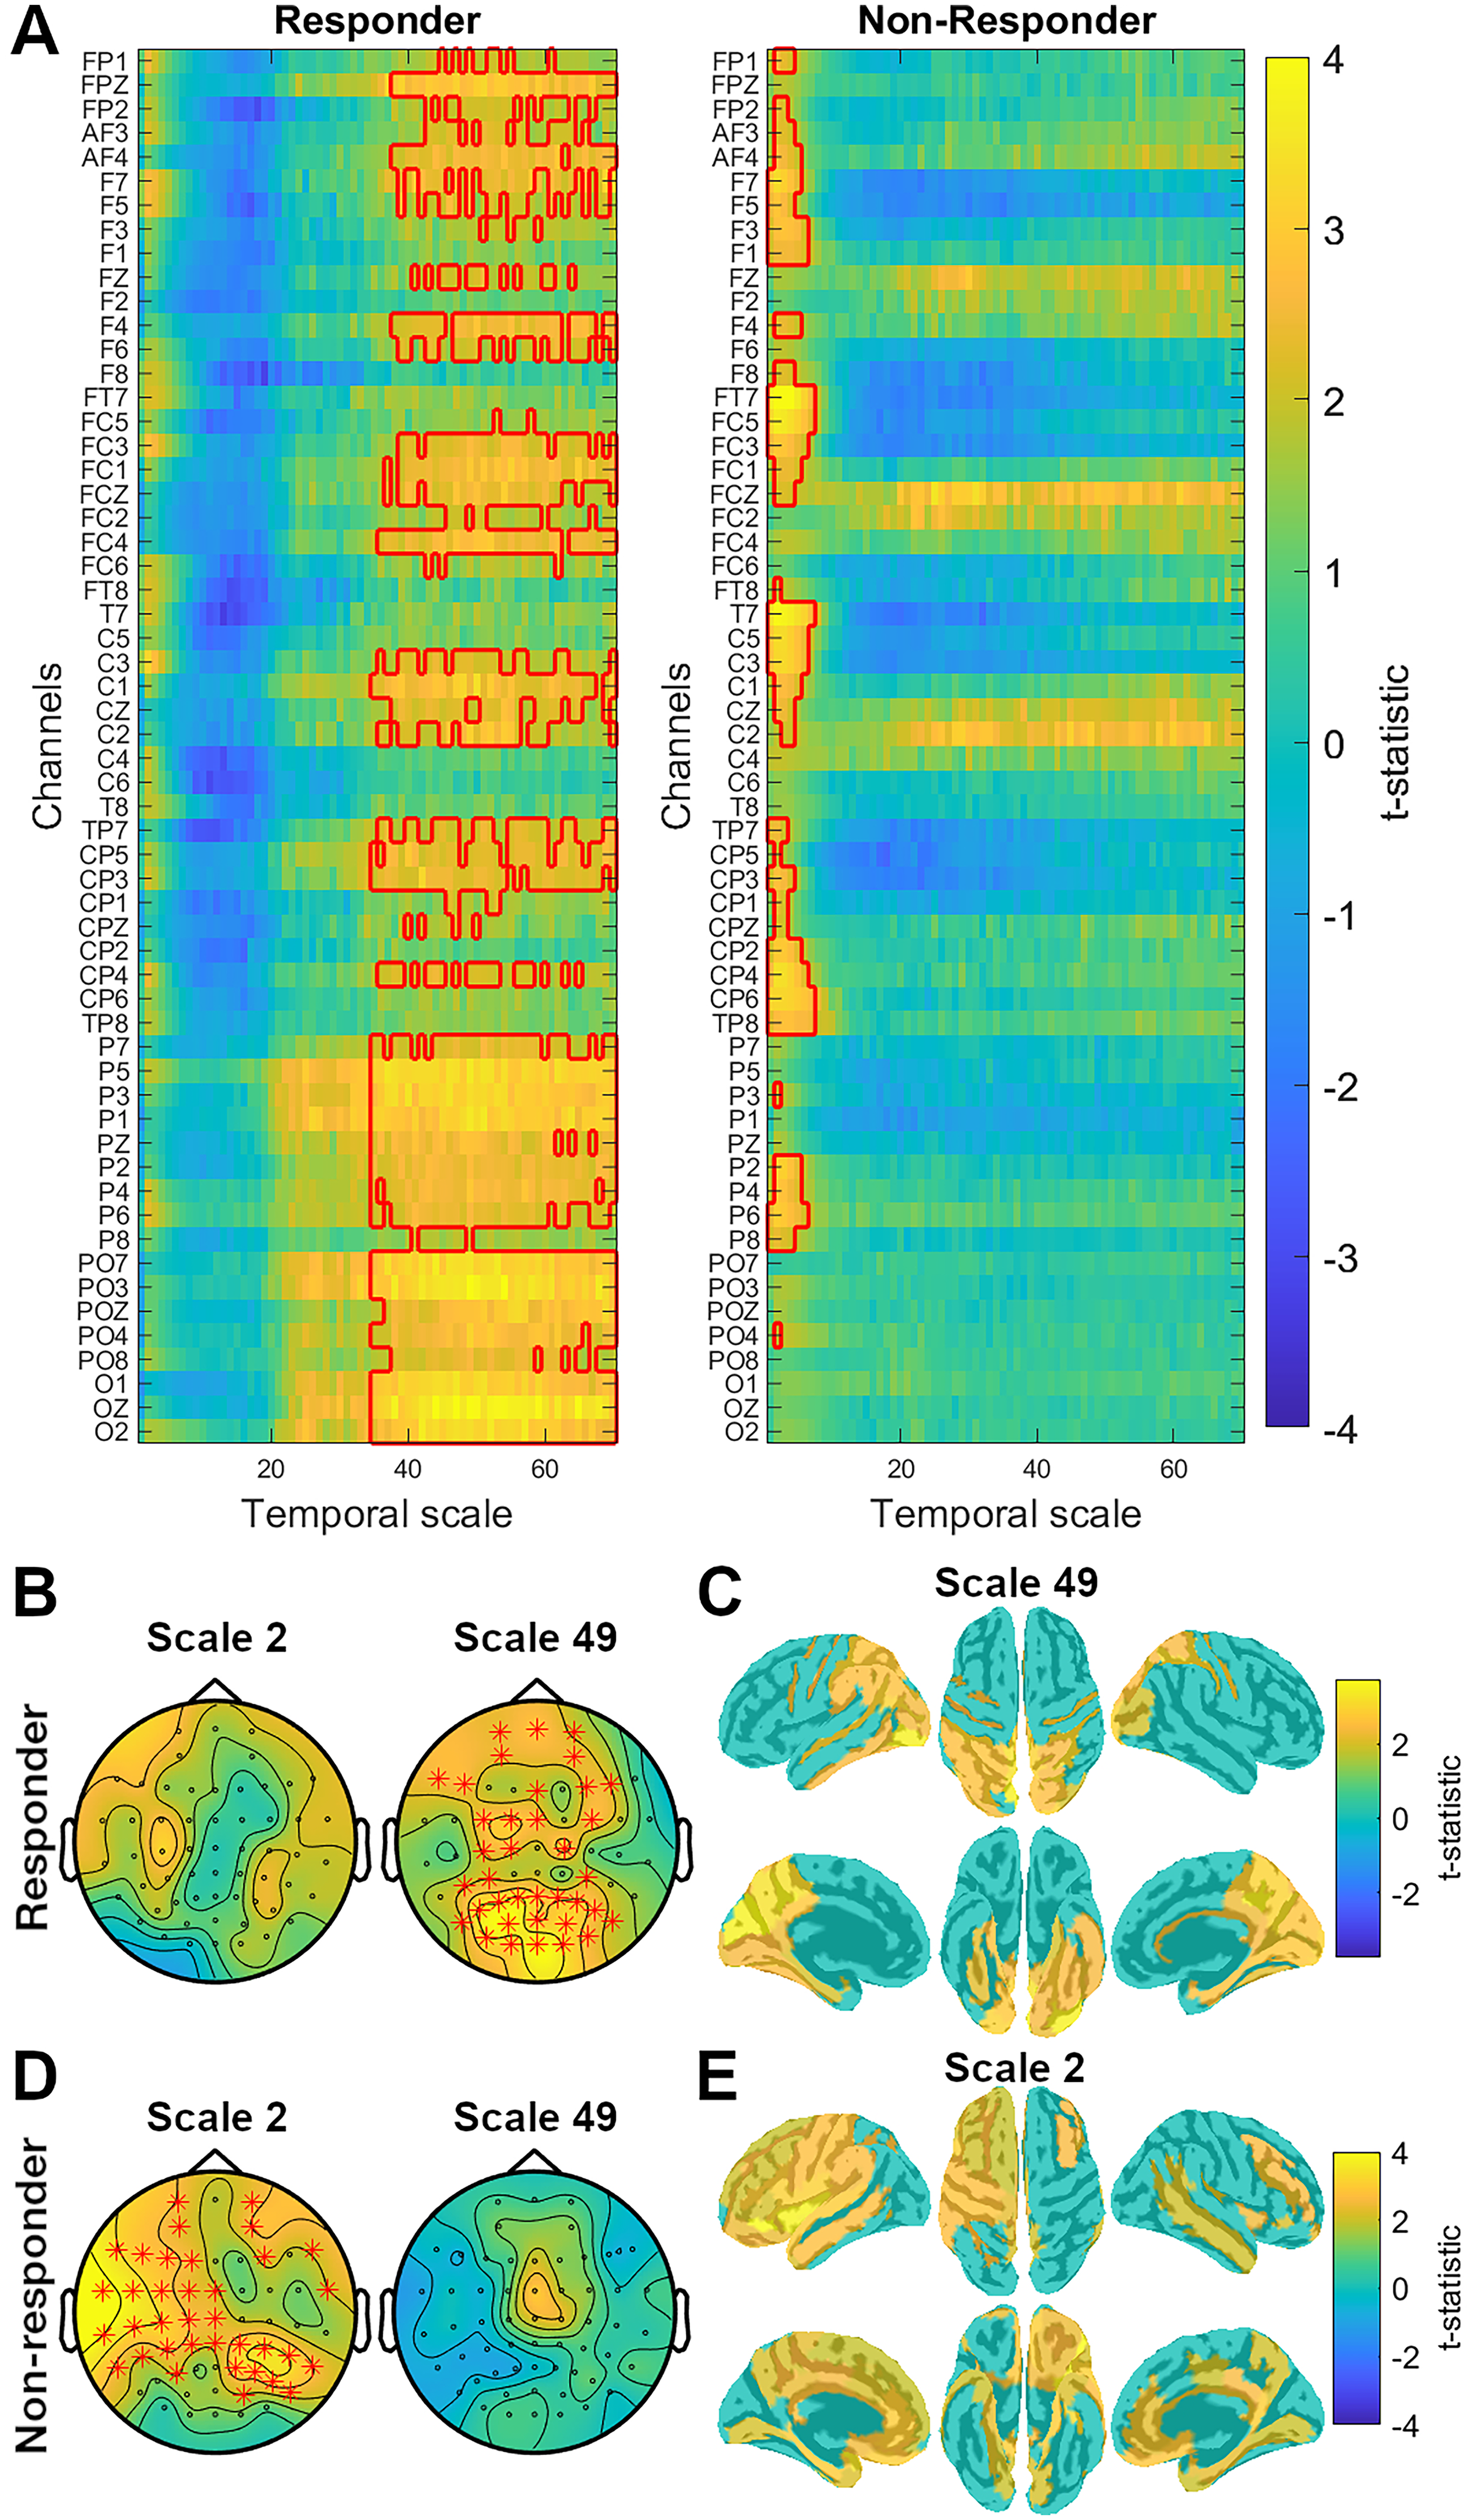
Late complexity changes in responders and non-responders following 8 weeks of escitalopram treatment. (a) Images depict t-statistic for complexity scores at week 8 compared to baseline for responders to treatment (first image) and non-responders (second image). The x-axes show timescales (from 1 to 70) and the y-axes show all electrodes. Significant clusters are indicated by a red outline. (b and d) The topo plots illustrate t-statistic distribution across the scalp at scale 2 and 49 for responders (b) and non-responders (d). Red stars indicate electrodes belonging to the significant cluster. (c and e) Source localized maps depicting source localization (uncorrected for multiple comparisons) of the significant clusters found in sensor-space for responders ((c), t-statistic represented at scale 49) and non-responders ((e), t-statistic represented at scale 2).
In sensor space, post hoc correlation analyses between early changes in complexity and clinical symptoms revealed a significant association between improvements in depressive symptoms and a decrease in the complexity of fine timescales after 2 weeks of treatment (cluster p = 0.0237, mean rho = −0.22) (Figure 4(a)–(d)). This significant association was observed over frontal, fronto-central, left temporal, centro-parietal and left parietal electrodes (Figure 4(b)) and was source localized to the medial prefrontal cortex, cingulate cortex and insula (Figure 4(c)).
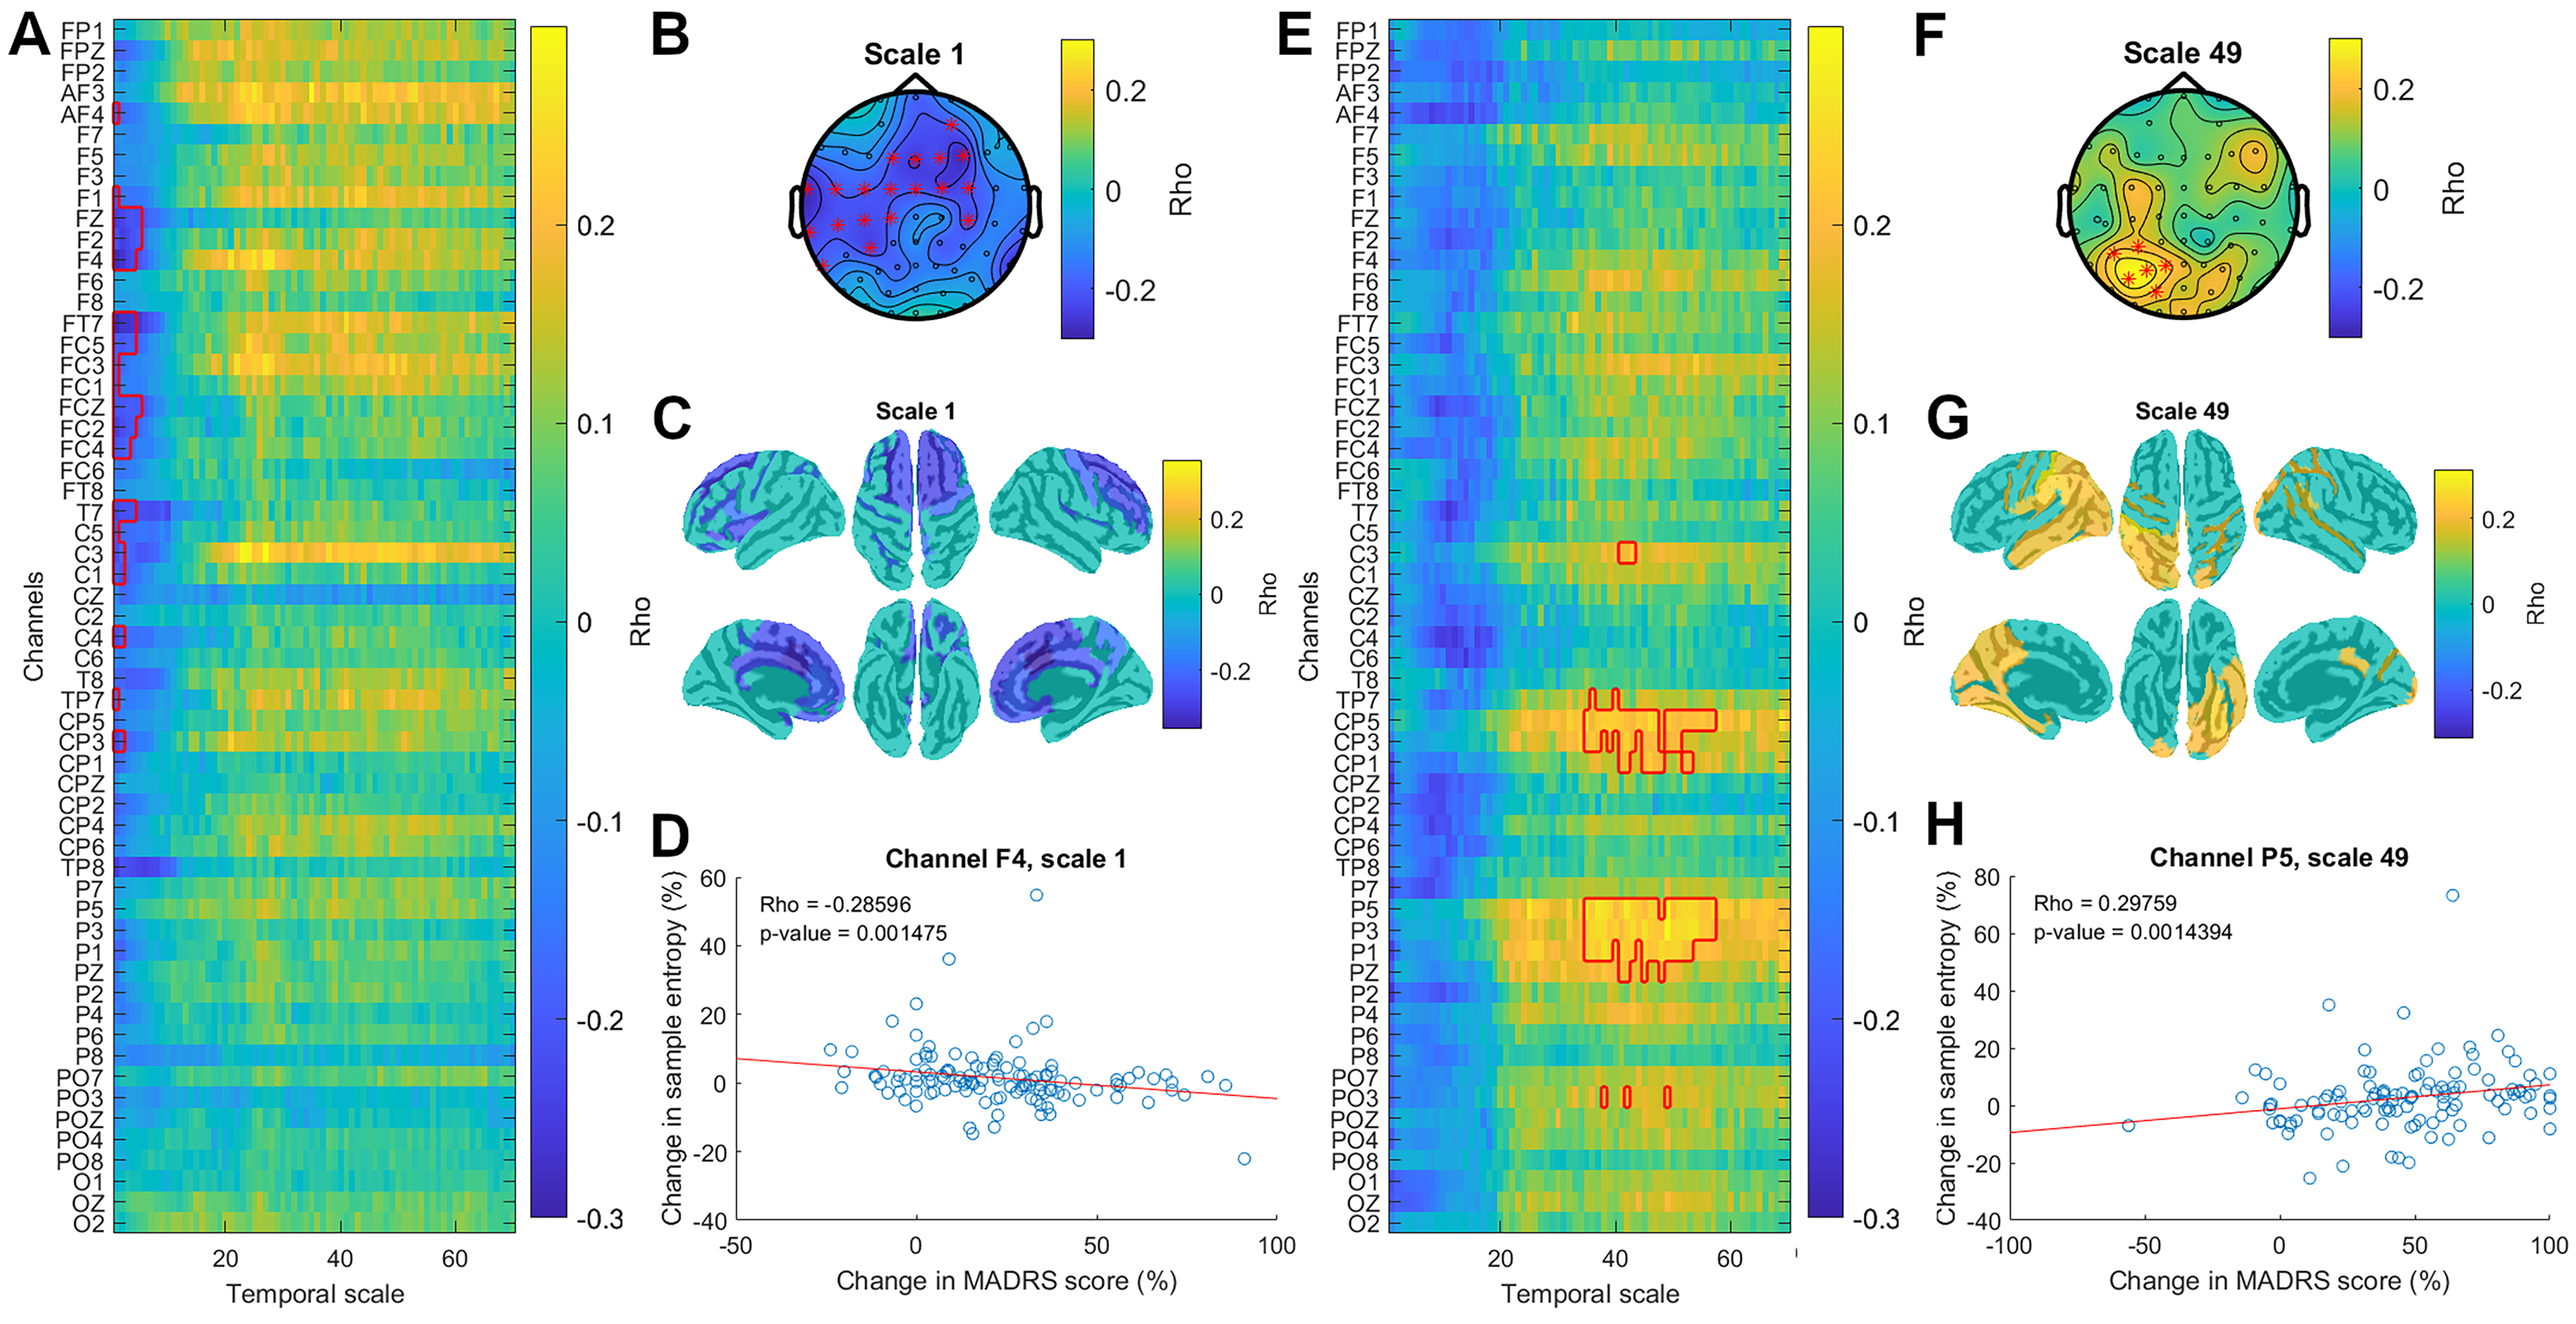
Association between early and late changes in complexity and improvement in depressive symptoms following 8 weeks of escitalopram treatment. Early changes in complexity correspond to changes from baseline to week 2. Late changes in complexity correspond to changes from baseline to week 8. (a) The image depicts the correlation coefficients for correlation between precent changes in MADRS score from baseline to week 2 and early changes in MSE for all channels (y-axis) and timescales (x-axis). Significant clusters are indicated by a red outline. (b) The topo plot illustrates the correlation coefficient at scale 1. Red stars indicate channels belonging to a significant cluster. (c) Source localized maps depicting source localization of the significant cluster found in sensor space at scale 1. (d) The graph illustrates the association between early changes in MSE at scale 1 (y-axis) against early changes in MADRS score (x-axis) for channel F4, where the correlation coefficient is maximal. Red line shows the linear fit of the data. (e) The image depicts the significant correlation coefficient for association between percent changes in MADRS score from baseline to week 8 and late changes in MSE for all channels (y-axis) and timescales (x-axis). Significant clusters are indicated by a red outline. (f) Topo plot illustrating correlation coefficient at scale 49. Red stars indicate channels belonging to a significant cluster. (g) Source localized maps depicting source localization of the significant cluster found in sensor-space at scale 49. (h) The graph illustrates the association between late changes in MSE (y-axis) at scale 49 against late changes in MADRS score (x-axis) for channel P3, where the correlation coefficient is maximal. The red line shows the linear fit of the data. MADRS: Montgomery–Åsberg Depression Rating Scale; MSE: multiscale entropy.
Additionally, correlation analysis between late changes in complexity and clinical symptoms revealed a significant association between improvements in depressive symptoms and an increase in the complexity of coarse timescales after 8 weeks of treatment (cluster p = 0.0243, mean rho = 0.22) (Figure 4(e)–(h)). This significant association was observed over left central, centro-parietal, parietal and parieto-occipital electrodes (Figure 4(e) and (f)) and was source localized to the left superior and inferior parietal lobule, left temporal cortex and bilateral occipital cortex (Figure 4(g)).
None of the other post hoc t-tests performed in sensor space survived correction for multiple comparisons. Significant clusters showing differences in complexity between responders and non-responders at baseline, week 2, and week 8 did not survive the correction for multiple comparisons (Supplemental Figure S3). Likewise, early changes (baseline to week 2) of complexity in responders and non-responders did not survive correction for multiple comparisons (Supplemental Figure S4).
Sensitivity Analyses
We confirmed that changes in escitalopram dose after the start of treatment did not affect multiscale entropy measures. We also replicated our analysis after applying Combining Batches (ComBat) harmonization to control for residual site differences in our EEG recordings (Supplemental Figures S5–S10). Methods, results and discussion for both analyses are included in the Supplemental materials.
Discussion
This study examined early and long-term changes in resting-state EEG temporal complexity throughout escitalopram treatment in MDD. Early improvements in depressive symptoms were linked to decreased complexity at fine timescales after 2 weeks of treatment. After 8 weeks, responders showed increased complexity at coarse timescales. An association was found between this increase in complexity at coarse timescales and symptom improvements at week 8.
As hypothesized, early improvement in depressive symptoms was associated with early reduction in resting EEG complexity in the fine timescales (scales 1–11) over fronto-central regions. After 8 weeks of treatment, an increase in fine timescale complexity also localized in fronto-central regions was associated with failure to respond to the treatment. These findings were replicated in the data-driven whole-brain analysis and were source-localized to the medial prefrontal cortex and cingulate cortex. This result is in line with the modulation of fine timescale complexity associated with improvement of depressive symptoms previously observed with other pharmacological treatments 28 and in another treatment modality: seizure therapy.24,44
Additionally, whole-brain analysis revealed that, in the long-term, improvement in depressive symptoms was associated with an increase in complexity at coarse (>35) timescales. These associations were source-localized to the left superior and inferior parietal lobule, left temporal cortex, and bilateral occipital cortex. An increase in complexity at coarse timescales has previously been observed in responders to ECT treatment for MDD. 24 However, to the best of our knowledge, no other study has investigated changes in multiscale entropy at several time intervals throughout treatment. The design of our study allows us to uncover changes in brain signal variability specific to each temporal scale over the course of 8 weeks of escitalopram treatment, with initial improvement of symptoms being associated with a decrease in complexity at fine timescales but long-term improvements being associated with an increase in complexity at coarse timescales.
This study combines a hypothesis-driven approach over fine timescales and an exploratory, whole-brain approach. We were thus able to demonstrate the robustness of the association between decreased brain temporal complexity in fine timescales and antidepressant response by replicating previous results.24,28,44 Simultaneously, we were able to expand the characterization of brain complexity as a target for antidepressant treatment by identifying a new association between increase of coarse timescale complexity and improvements of depressive symptoms. Our results highlight the importance of measuring brain signal variability over a wide range of temporal scales to fully characterize changes in brain temporal complexity. However, our findings in the coarse timescales are exploratory and will need to be replicated in future studies.
There is wide agreement in the literature that neural complexity is related to information processing.19,22 An optimal level of variability in neuronal firing is beneficial for neural processing.45,46 Similarly, at the level of network dynamics, computational models demonstrate that an optimal level of brain signal variability allows dynamic fluctuation of activity between brain networks, which supports more effective information processing.47,48
Other models theorize that brain signal variability can facilitate or inhibit information exchange between brain regions.23,49 High brain signal variability will prevent the formation of a stable synchronized state between brain regions and prevent efficient communication. The modulation of information exchange by brain signal variability levels is a key concept of the unified conceptual framework for information integration in the brain proposed by Tononi and colleagues.20,21,23 This framework proposes that optimal cortical information processing requires a balance between two opposite requirements: segregation and integration. Segregated, specialized sets of neurons are needed to extract information from specific features of sensory inputs. This is achieved through highly desynchronized local brain activity. However, in order to respond to complex environments, specialized information then needs to be integrated into coherent perceptual and cognitive states. This is achieved through long-range communication and synchronization between brain regions. Although both functional requirements (segregation and integration) appear to be opposite of one another, within the unified framework they occur at different scales (local and global, respectively). Complexity measured at multiple scales is thus uniquely suited to capture the balance of both processes as it estimates temporal correlations over several timescales. 23
The balance between local and long-range communication has been shown to be altered in MDD. Local connectivity disturbances have been reported in the anterior and posterior cortices. 7 Particularly, local connectivity is increased in the medial prefrontal cortex in depression. 50 Several meta-analyses have also reported alterations in interregional connectivity in MDD,51–53 although results remain heterogeneous, possibly because of symptom heterogeneity.51,54,55 Nonetheless, functional Magnetic Resonance Imaging connectivity obtained in the CAN-BIND 1 cohort, therefore including many of the participants included in this study, have replicated robust results from the literature showing increased connectivity within the Default Mode Network (DMN), between anterior DMN and the Salience Network (SN) and Cognitive Control Network (CCN), and between CCN and SN regions. They also reported weaker connectivity within the CNN in patients with MDD compared to controls. 56 It has been proposed that escitalopram treatment, which has been shown to modulate whole-brain connectivity, 57 could act by differentially modulating short- and long-range connectivity strength and normalizing altered patterns of information processing. 58
We speculate that the positive association between symptom improvement and complexity at coarse timescales measured in our data may be related to the early negative association with complexity at fine timescales. Lower complexity at fine timescales likely reflects reduced local, segregated brain activity at the beginning of treatment. This reduction may favour a subsequent increase in long-range interaction across networks, as evident from the changes in coarse timescales in the long term.
In animal models, complexity at fine timescales is positively correlated with regional entropy, a measure that is negatively correlated to functional connectivity. Conversely, coarse timescale complexity is negatively correlated with regional entropy. 59 In healthy humans, local brain signal variability at all timescales was shown to reflect the functional embedding of nodes within a network. 60 During healthy aging, at fine timescales, there is both an increase in complexity and local connectivity. Similarly, at coarse timescales, there is a decrease in both complexity and inter-hemispheric connectivity. 18
A similar reduction of local information processing associated with improvements in depressive symptoms was observed after ECT and MST. 24 Other evidence suggests a modulation of the balance of functional segregation and integration by ECT 61 and MST. 62 This suggests that different modalities of antidepressant treatment may act similarly by modulating the balance of local processing (i.e., functional segregation) and global information exchange (i.e., functional integration). However, the strength of this effect could vary between modalities. Seizure therapy could lead to a more widespread effect, extending to parietal, occipital and temporal cortices, 24 compared to the response to pharmacological treatment which was primarily localized to the frontal cortex in our data.
The potential generalizability of multiscale temporal complexity as a neuromarker for treatment across modalities provides a window of opportunity to develop new antidepressant treatments. Non-invasive brain stimulation modalities such as repetitive Transcranial Magnetic Stimulation may be tailored to modulate this neuromarker in a network-specific manner in healthy participants. 63 Future investigations of potentially new pharmacotherapies may include evaluating their modulatory impact on multiscale complexity measures.
However, the ability to generalize from this study is limited by its specific exclusion criteria (see reference [29] for further details). Secondly, the open-label design without a control group prevents any comments on placebo effects or the causality of our findings. Lastly, although this study has the advantage of a large sample size, larger cohorts are needed to confirm these findings and explore additional factors including age, depressive subtypes and other variables known for modulating brain complexity such as circadian rhythms 64 or arousal state. 65
In conclusion, our study revealed distinct early and long-term effects of escitalopram treatment in MDD and provides evidence that temporal complexity may be a target of escitalopram. As early as 2 weeks into escitalopram treatment, reduction of fine timescale complexity was associated with early improvement in depressive symptoms. In the long term, the treatment effect shifted towards an increase in complexity of coarse timescale associated with improvements in depressive symptoms. These results may reflect a relative shift away from higher regional entropy in segregated brain regions in favour of a higher long-range interaction across networks. This study also indicates the potential use of temporal complexity as a mechanistic marker of response to antidepressants. This opens an opportunity for the development of novel treatments targeting the modulation of temporal complexity.
Supplemental Material
sj-docx-1-cpa-10.1177_07067437251408188 - Supplemental material for Modulation of Brain Temporal Complexity During Treatment for Depression: A CAN-BIND-1 Study Report: Modulation de la complexité temporelle du cerveau pendant le traitement de la dépression: rapport de l’étude CAN-BIND-1
Supplemental material, sj-docx-1-cpa-10.1177_07067437251408188 for Modulation of Brain Temporal Complexity During Treatment for Depression: A CAN-BIND-1 Study Report: Modulation de la complexité temporelle du cerveau pendant le traitement de la dépression: rapport de l’étude CAN-BIND-1 by Chloé Stengel, Benjamin Schwartzmann, Raaj Chatterjee, Sravya Atluri, Yasaman Vaghei, Stephen R. Arnott, Pierre Blier, Prabhjot Dhami, Jane A. Foster, Benicio N. Frey, Raymond W. Lam, Roumen Milev, Daniel J Müller, Sagar V. Parikh, Claudio N. Soares, Rudolf Uher, Gustavo Turecki, Susan Rotzinger, Sidney H. Kennedy and Faranak Farzan in The Canadian Journal of Psychiatry
Footnotes
Author Contributions
P.B., J.A.F, B.N.F, R.W.L., R.M, D.J.M., C.N.S., G.T., R.U, S.R., S.H.K. and F.F. designed the study. C.S., B.S., R.C. and P.D. analyzed the data. C.S. wrote the manuscript and created all the figures. All authors contributed to writing the manuscript and editing the final version of the manuscript.
Data Availability Statement
Declaration of Conflicting Interests
The authors declared the following potential conflicts of interest with respect to the research, authorship, and/or publication of this article: P.B. has received consulting and speaking honoraria from AbbVie, Allergan, Bristol Myers Squibb, Eisai, Janssen, Lundbeck, Merck, Otsuka, Pfizer, Pierre Fabre Medicaments, and Sunovion, and research grants from CAN-BIND, CIHR, Janssen, OBI and Otsuka. J.A.F. has served on the Scientific Advisory Board for MRM Health NL and has received consulting/speaker fees from Alphasights, Benson & Hedges Inc., Novozymes, Klaire Labs, Takeda Canada, Rothman, and WebMD. S.K. reports grants from the Labatt Family Innovation Fund in Brain Health (Department of Psychiatry, University of Toronto), the Max Bell Foundation, the Canadian Centre on Substance Use and Addiction, the Ontario Ministry of Health and Long-Term Care (MOHLTC), and the Canadian Institutes of Health Research (CIHR). R.M. has received consulting and speaking honoraria from AbbVie, Allergan, Eisai, Janssen, KYE, Lallemand, Lundbeck, Neonmind, Otsuka, and Sunovion, and research grants from CAN-BIND, CIHR, Janssen, Lallemand, Lundbeck, Nubiyota, OBI and OMHF. C.N.S. reported receiving personal fees from Otsuka and Sunovion and grants from Ontario Brain Institute, SEAMO Innovation Funds, and Ontario Research Fund–Research Excellence outside the submitted work. S.V.P. reports research support from Sage, Janssen, Myriad, Takeda, OBI and CIHR; consulting income from Sage, Janssen, Otsuka, Mensante and Aifred; and equity in Mensante. G.T. reports personal fees from Pfizer Canada, Bristol-Meyers Squibb and Janssen Canada outside the submitted work. D.J.M. reports grants from the Canadian Institutes of Health Research (CIHR) and the Alternative Funding Plan (CAMH-AFP). D.J.M. has received a speaker honorarium rom Novagenic. S.R. reports receiving grants from Ontario Brain Institute and the Canadian Institutes of Health Research during the conduct of the study and having a patent to “Teneurin C-Terminal Associated Peptides and Methods and Uses Thereof” issued. S.H.K. has received funding for Consulting or Speaking engagements from Boehringer-Ingelheim, Brain Canada, Janssen, Lundbeck, Otsuka, Servier. He has received Research Support from Brain Canada, CIHR, Janssen, Lundbeck, Neurocrine, Ontario Brain Institute, Otsuka, Compass and Denovo. F.F. reports received funding from Michael Smith Foundation for Health Research, Ontario Brain Institute, Natural Sciences and Engineering Research Council of Canada Discovery, and Canadian Institutes of Health Research. All other authors report no biomedical financial interests or potential conflicts of interest.
Funding
The authors disclosed receipt of the following financial support for the research, authorship, and/or publication of this article: CAN-BIND is an Integrated Discovery Program carried out in partnership with, and financial support from, the Ontario Brain Institute, an independent non-profit corporation, funded partially by the Ontario government. The opinions, results and conclusions are those of the authors and no endorsement by the Ontario Brain Institute is intended or should be inferred. Additional funding is provided by the Canadian Institutes of Health Research (CIHR), Lundbeck, Servier. Funding and/or in kind support is also provided by the investigators’ universities and academic institutions. All study medications are independently purchased at wholesale market values.
ORCID iDs
Supplemental Material
Supplemental material for this article is available online.
References
Supplementary Material
Please find the following supplemental material available below.
For Open Access articles published under a Creative Commons License, all supplemental material carries the same license as the article it is associated with.
For non-Open Access articles published, all supplemental material carries a non-exclusive license, and permission requests for re-use of supplemental material or any part of supplemental material shall be sent directly to the copyright owner as specified in the copyright notice associated with the article.