
Abstract
Objective
This study established a machine learning model based on the multidimensional data of resting-state functional activity of the brain and P11 gene DNA methylation to predict the early efficacy of antidepressant treatment in patients with major depressive disorder (MDD).
Methods
A total of 98 Han Chinese MDD were analysed in this study. Patients were divided into 51 responders and 47 nonresponders according to whether the Hamilton Depression Rating Scale-17 items (HAMD-17) reduction rate was ≥50% after 2 weeks of antidepressant treatment. At baseline, the Illumina HiSeq Platform was used to detect the methylation of 74 CpG sites of the P11 gene in peripheral blood samples. Resting-state functional magnetic resonance imaging (rs-fMRI) scan detected the amplitude of low-frequency fluctuations (ALFF), regional homogeneity (ReHo), and functional connectivity (FC) in 116 brain regions. The least absolute shrinkage and selection operator analysis method was used to perform feature reduction and feature selection. Four typical machine learning methods were used to establish support vector machine (SVM), random forest (RF), Naïve Bayes (NB), and logistic regression (LR) prediction models based on different combinations of functional activity of the brain, P11 gene DNA methylation and clinical/demographic features after screening.
Results
The SVM model based on ALFF, ReHo, FC, P11 methylation, and clinical/demographic features showed the best performance, with 95.92% predictive accuracy and 0.9967 area under the receiver operating characteristic curve, which was better than RF, NB, and LR models.
Conclusion
The multidimensional data features combining rs-fMRI, DNA methylation, and clinical/demographic features can predict the early antidepressant efficacy in MDD.
Introduction
Major depressive disorder (MDD) is a common mental disorder characterized by significant and lasting depression, loss of interest, anhedonia, decreased energy, feelings of worthlessness, difficulty in concentration, sleep/eating disorders, and suicide idea/behavior. MDD can easily lead to functional impairment, causing a heavy disease burden to the patients, families, and society. The latest large-scale epidemiological survey showed that the current prevalence of MDD in China was 2.3%, and the lifetime prevalence was 3.9%. 1 Furthermore, the World Health Organization predicted that MDD would become the first global disease burden by 2030. 2
Currently, antidepressant is one of the first-line treatment options for MDD, and selective serotonin reuptake inhibitors (SSRIs) and serotonin and norepinephrine reuptake inhibitors (SNRIs) are the most widely used. However, over 50% of patients do not achieve remission after initial treatment and 30–50% do not respond to antidepressant therapy. 3 Previous studies have shown that early efficacy after 2 weeks of antidepressant treatment is important for subsequent treatment outcomes.4-6 If reliable biomarkers that predict early efficacy can be found before initial treatment, individualized and precise treatment for patients with depression will be promoted, and the remission rate will also be improved.
By analysing neuroimaging information, previous studies have revealed several imaging biomarkers to predict antidepressant efficacy at baseline. Resting-state functional magnetic resonance imaging (rs-fMRI) is a noninvasive neuroimaging technique that assesses spontaneous brain activity by measuring blood oxygen level-dependent signals in subjects at rest. 7 The amplitude of low-frequency fluctuations (ALFF), regional homogeneity (ReHo), and functional connectivity (FC) are common methods used in rs-fMRI. It was found that ALFF in the lingual gyrus and cerebellum at baseline is associated with early response to antidepressant therapy. 8 Another study found that compared with the patients with treatment-sensitive depression, those with treatment-resistant depression had lower ReHo in the bilateral cerebellum and higher ReHo in the left fusiform gyrus at baseline. 9 In addition, Goldstein-Piekarski et al. 10 showed that the functional connection between posterior cingulate cortex (PCC) and anterior cingulate cortex (ACC)/medial prefrontal cortex (mPFC) had an accuracy of 81.9% in predicting the 8-week efficacy of antidepressants. These studies suggest that rs-fMRI imaging can potentially be an objective neurobiological marker to reflect and predict the efficacy of antidepressant treatment.
Besides imaging biomarkers, epigenetics also contains essential information for predicting the efficacy of MDD. Epigenetics is the potentially heritable but environmentally modifiable regulation of gene function and expression mediated through non-DNA-encoded mechanisms. 11 Epigenetic studies have shown that genetic variation can affect the efficacy of antidepressants, and some genetic biomarkers have been identified.12,13
Protein P11 (also known as S100A10) is expressed in several brain regions related to the pathogenesis of depression, including the frontal cortex, hippocampus, basal forebrain, nucleus accumbens, amygdala, raphe nucleus, and hypothalamus.14-16 P11 expression was reduced in depressed mouse models and autopsy brains of patients with MDD.17-19 Mice lacking P11 resist antidepressant treatment.20,21 These studies suggest that P11 plays an important role in the pathogenesis of depression and the efficacy of antidepressants. Epigenetic studies have found hypermethylation of the P11 promoter in the prefrontal cortex of depressed model rats. 22 In clinical translational studies, Neyazi et al. 23 identified P11 promoter methylation as a reliable biomarker for predicting the response to electroconvulsive therapy (ECT). Our recent study also found that P11 gene DNA methylation in peripheral blood was significantly higher in MDD patients. P11 gene DNA methylation and early-life stress influenced the short-term efficacy of antidepressants through interaction. 24
Neuroimaging and epigenetics predict the efficacy of antidepressants from different aspects, but most previous studies look for the biomarkers by using single-dimension data information and traditional statistical methods, which limits the accuracy of efficacy prediction. Machine learning (ML) techniques have advantages in enhancing the interpretability of classification results and translating them into clinical applications when constructing MDD efficacy prediction models. 25 This study applied ML, based on multidimensional data of resting-state imaging, P11 gene DNA methylation, and clinical/demographic characteristics, to predict the early efficacy of antidepressant treatment in depression.
Methods
Participants
In this study, 300 MDD inpatients were recruited at the Department of Psychosomatics and Psychiatry, Zhongda Hospital Affiliated with Southeast University, Nanjing, China. All recruited participants were Han Chinese. These 300 patients are consistent with the patients enrolled in our previous study. 24 Only patients with a primary diagnosis of MDD (according to the criteria of the Diagnostic and Statistical Manual of the American Psychiatric Association, fourth edition [DSM-IV]), were included. The age of patients ranged from 18 to 65. All patients were newly diagnosed or had recently relapsed without the use of antidepressants for at least 2 weeks (at least 4 weeks for fluoxetine) and had a baseline score >17 on the Hamilton Depression Rating Scale-17 items (HAMD-17). The exclusion criteria of patients were as follows: had received any other DSM-IV Axis I diagnosis; had received a diagnosis of a personality disorder or mental retardation; had a history of organic brain diseases, endocrine diseases, primary organic diseases, or other medical illnesses that would impair psychiatric evaluation; had a disorder of the blood, heart, liver, or kidney; had ECT within the last 6 months before the study; had an episode of mania during the 12 months preceding the study; and were pregnant or lactating.
Among these 300 MDD patients, 2 patients were excluded due to noncompliance or withdrawal, and 7 were excluded due to modified diagnosis during the 1-year follow-up. Among the remaining 291 patients, 105 of them who were right-handed and eligible for magnetic resonance imaging (MRI) consented to a brain MRI scan at baseline. Among the 186 patients, 3 were left-handed, 12 had metal implants, and 171 did not wish to undergo brain MRI at baseline, therefore these patients were not included in the study. This study was approved by the Medical Ethics Committee for Clinical Research of Zhongda Hospital Affiliated with Southeast University (2016ZDSYLL100-P01) and followed the ethical principles of the Declaration of Helsinki. Written informed consent was obtained from all study participants.
The patients were treated with a single antidepressant according to the clinical features and pharmacological characteristics. Seven patients were excluded from the final analysis because of excessive head movement on MRI scans. The remaining 98 MDD patients were treated with antidepressants as follows: 54 patients received SSRIs, 31 received SNRIs, and 13 received noradrenergic and selective serotonergic antidepressants (NaSSAs). In this study, the doses of antidepressants were all converted into fluoxetine equivalent doses.26,27
Clinical Assessments
Demographic data were collected, and life stress was assessed at baseline. The Life Events Scale (LES) and the Childhood Trauma Questionnaire (CTQ) were used to assess recent and early stress. The details can be found in a previous study of our group. 24 The CTQ contains 5 subscales, namely physical abuse (PA), emotional abuse (EA), sexual abuse (SA), physical neglect (PN), and emotional neglect (EN). 28
HAMD-17 scores assessed the severity of depressive symptoms at baseline and clinical improvement after 2 weeks of treatment. According to the World Federation of Biological Psychiatric Societies guidelines, when the reduction rate of HAMD-17 total score is ≥50% after 2 weeks of treatment, it is considered to be a response to the treatment. 29
DNA Methylation Analysis
The P11 DNA methylation detection process is described in the previous study of our group. 24 The mean values of each CpG site in 291 MDD patients were used to fill in missing methylation values.
Acquisition, Preprocessing, and Feature Extraction of MRI Data
Siemens 3.0 Tesla magnetic resonance imaging system (Verio 3.0 MRI, Simens, Erlangen, Germany) was used for brain imaging data acquisition in a single center. rs-fMRI acquisition was performed using the T2-weighted gradient echo-echo planar imaging sequence. The high-resolution T1-weighted images of the whole brain were obtained by a 3-dimensional magnetization preparation-rapid acquisition gradient echo sequence. Described in the Supplemental Materials.
Feature Selection, Modeling, and Validation
In order to find the characteristics that can predict responders (RD) and nonresponders (NRD), 6992 variables were selected as candidate features, including 74 P11 methylation data, 116 ALFF, 116 ReHo, 6670 FC, and 16 clinical/demographic characteristics. The data reduction was carried out to avoid overfitting and redundancy. First, the Mann–Whitney U test was performed on methylation and imaging variables between the RD and NRD, and different variables between the 2 groups were retained (P < 0.1). Next, variables strongly correlated were removed to weaken multicollinearity. If 2 variables have a high correlation, remove the variable with the largest mean absolute correlation (the threshold was set at 0.65). Finally, with classification accuracy as the cost function, the least absolute shrinkage and selection operator (LASSO) method with 10-fold cross-validation was used to select important features for prediction. After performing LASSO, the features whose coefficients were nonzero were retained to generate the prediction model. To better understand the difference in the selected features between the RD group and the NRD group, the mean and standard deviation of the methylation and rs-fMRI features selected in the RD group and the NRD group were calculated, respectively, and a 2-sample t-test was used for statistical analysis.
Four typical ML methods were adopted to construct the predictive models, including support vector machine (SVM) with a radial kernel, random forest (RF), Naïve Bayes (NB), and logistic regression (LR). Due to the relatively small sample size, the Leave-One-Out Cross-Validation (LOOCV) method was used to evaluate the performance of the prediction models. To verify whether the combination of multidimensional data is superior to a single data set (DNA methylation data or rs-fMRI data), in addition to the combination of DNA methylation, rs-fMRI, and clinical/demographic features, the combination of DNA methylation data and clinical/demographic features, and the combination of rs-fMRI data and clinical/demographic features are also used. The above feature selection, modeling, and performance evaluation process were repeated. The performance evaluation indexes include accuracy, sensitivity, specificity, and area under the receiver operating characteristic curve (AUC). Statistical analyses were performed in R 4.0.2 (R Core Team, Vienna, Austria, https://www.r-project.org/) using the software packages “glment,” “e1071,” “randomForest,” “KlaR,” “caret,” and “edgebundleR.”
Results
Demographic Data and Clinical Characteristics
The demographic data and clinical characteristics of 98 MDD patients, including 51 RDs and 47 NRDs, are summarized in Table 1. There was a significant difference in the gender distribution between the RD and NRD groups (χ2 = 4.786, P = 0.029), and the proportion of women in the RD group was higher. However, there were no significant differences in age, years of education, baseline HAMD-17 score, duration of illness, age of onset, family history in first-degree relatives, with or without first-episode depression, having attempted suicide or not, negative LES, CTQ total score, EA, PA, SA, EN, and PN score, and fluoxetine equivalent doses between the 2 groups (P > 0.05). Forty-four of the 98 patients (44.90%) had ever tried a previous antidepressant(s). In addition, the nonparametric Kruskal–Wallis H test was used to evaluate the differences in effectiveness between the 3 treatment strategies. The results showed no significant difference in the reduction rate of HAMD-17 among the 3 treatment strategies (P = 0.082).
Demographical and Clinical Data of Participants.
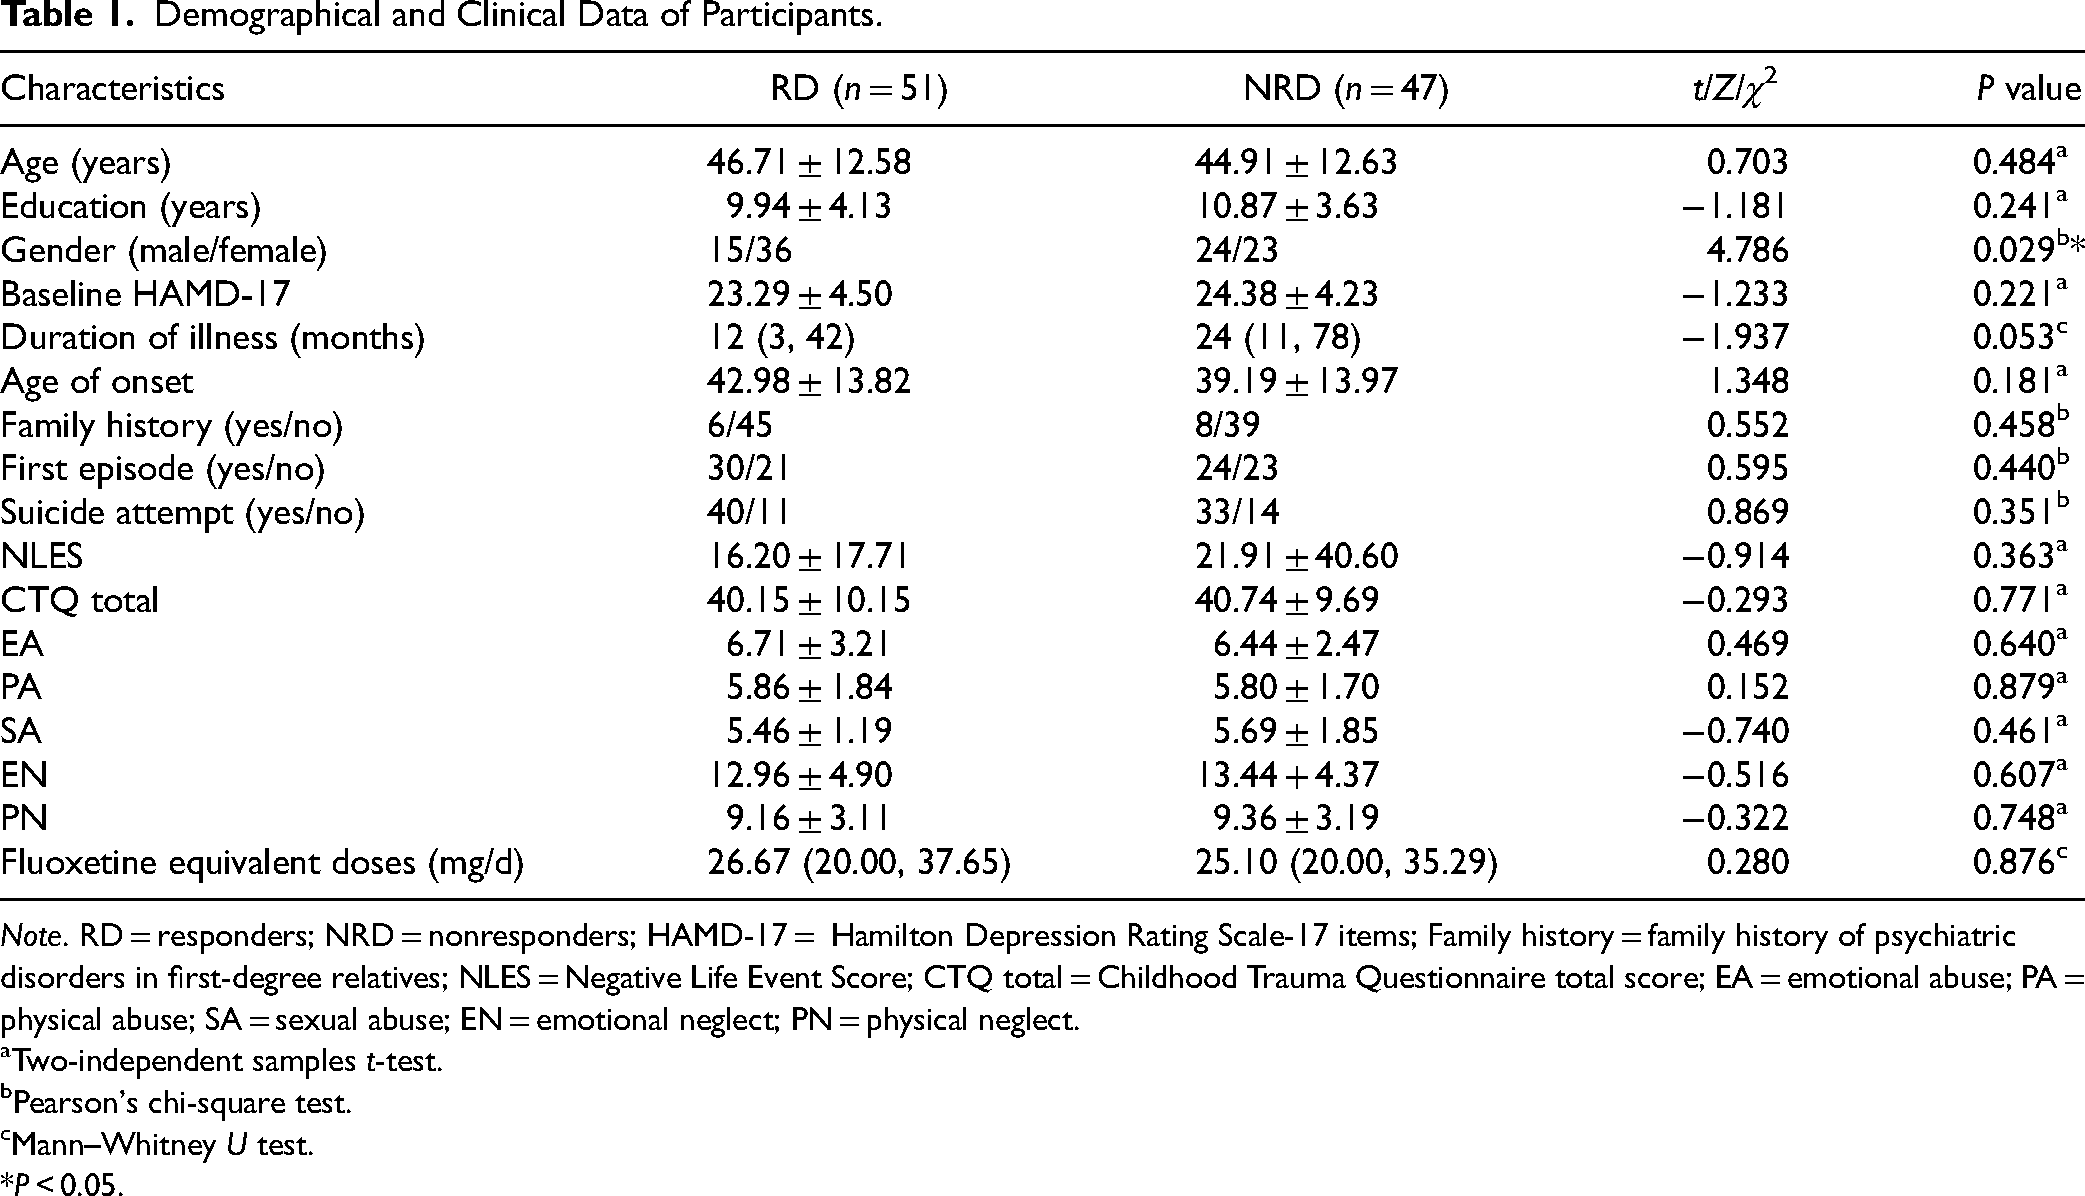
Note. RD = responders; NRD = nonresponders; HAMD-17 = Hamilton Depression Rating Scale-17 items; Family history = family history of psychiatric disorders in first-degree relatives; NLES = Negative Life Event Score; CTQ total = Childhood Trauma Questionnaire total score; EA = emotional abuse; PA = physical abuse; SA = sexual abuse; EN = emotional neglect; PN = physical neglect.
Two-independent samples t-test.
Pearson's chi-square test.
Mann–Whitney U test.
P < 0.05.
Feature Selection
During dimensionality reduction, 6976 methylations and rs-fMRI features were reduced to 531 by the Mann–Whitney U test. After removing variables with strong correlations, 246 features were retained. After the LASSO, 262 features (246 with 16 clinical/demographic variables) were reduced to 62 (including 5 P11 methylations, 1 ALFF, 1 ReHo, 53 FCs, and 2 clinical/demographic features). Supplemental Figure S1 shows the detailed process of the feature selection.
The 2 clinical/demographic features were duration of illness and gender. The 5 methylation signatures are P11-1-37, P11-1-85, P11-3-97, P11-3-150, and P11-4-132. The rs-fMRI features included ALFF of the right postcentral gyrus [automated anatomical labeling (AAL)58], ReHo of the temporal pole of the right middle temporal gyrus (AAL88), and 53 FC features (detailed in Table 2). The 53 FC-related brain regions were mainly located in the default-mode network (DMN), affective network (AN), visual network (VN), sensorimotor network (SMN), and cerebellar network (Figure 1). Among them, the angular gyrus (AG) was most highlighted (involved in 6 FCs). The differences in the selected features between the 2 groups are shown in Supplemental Table S1.
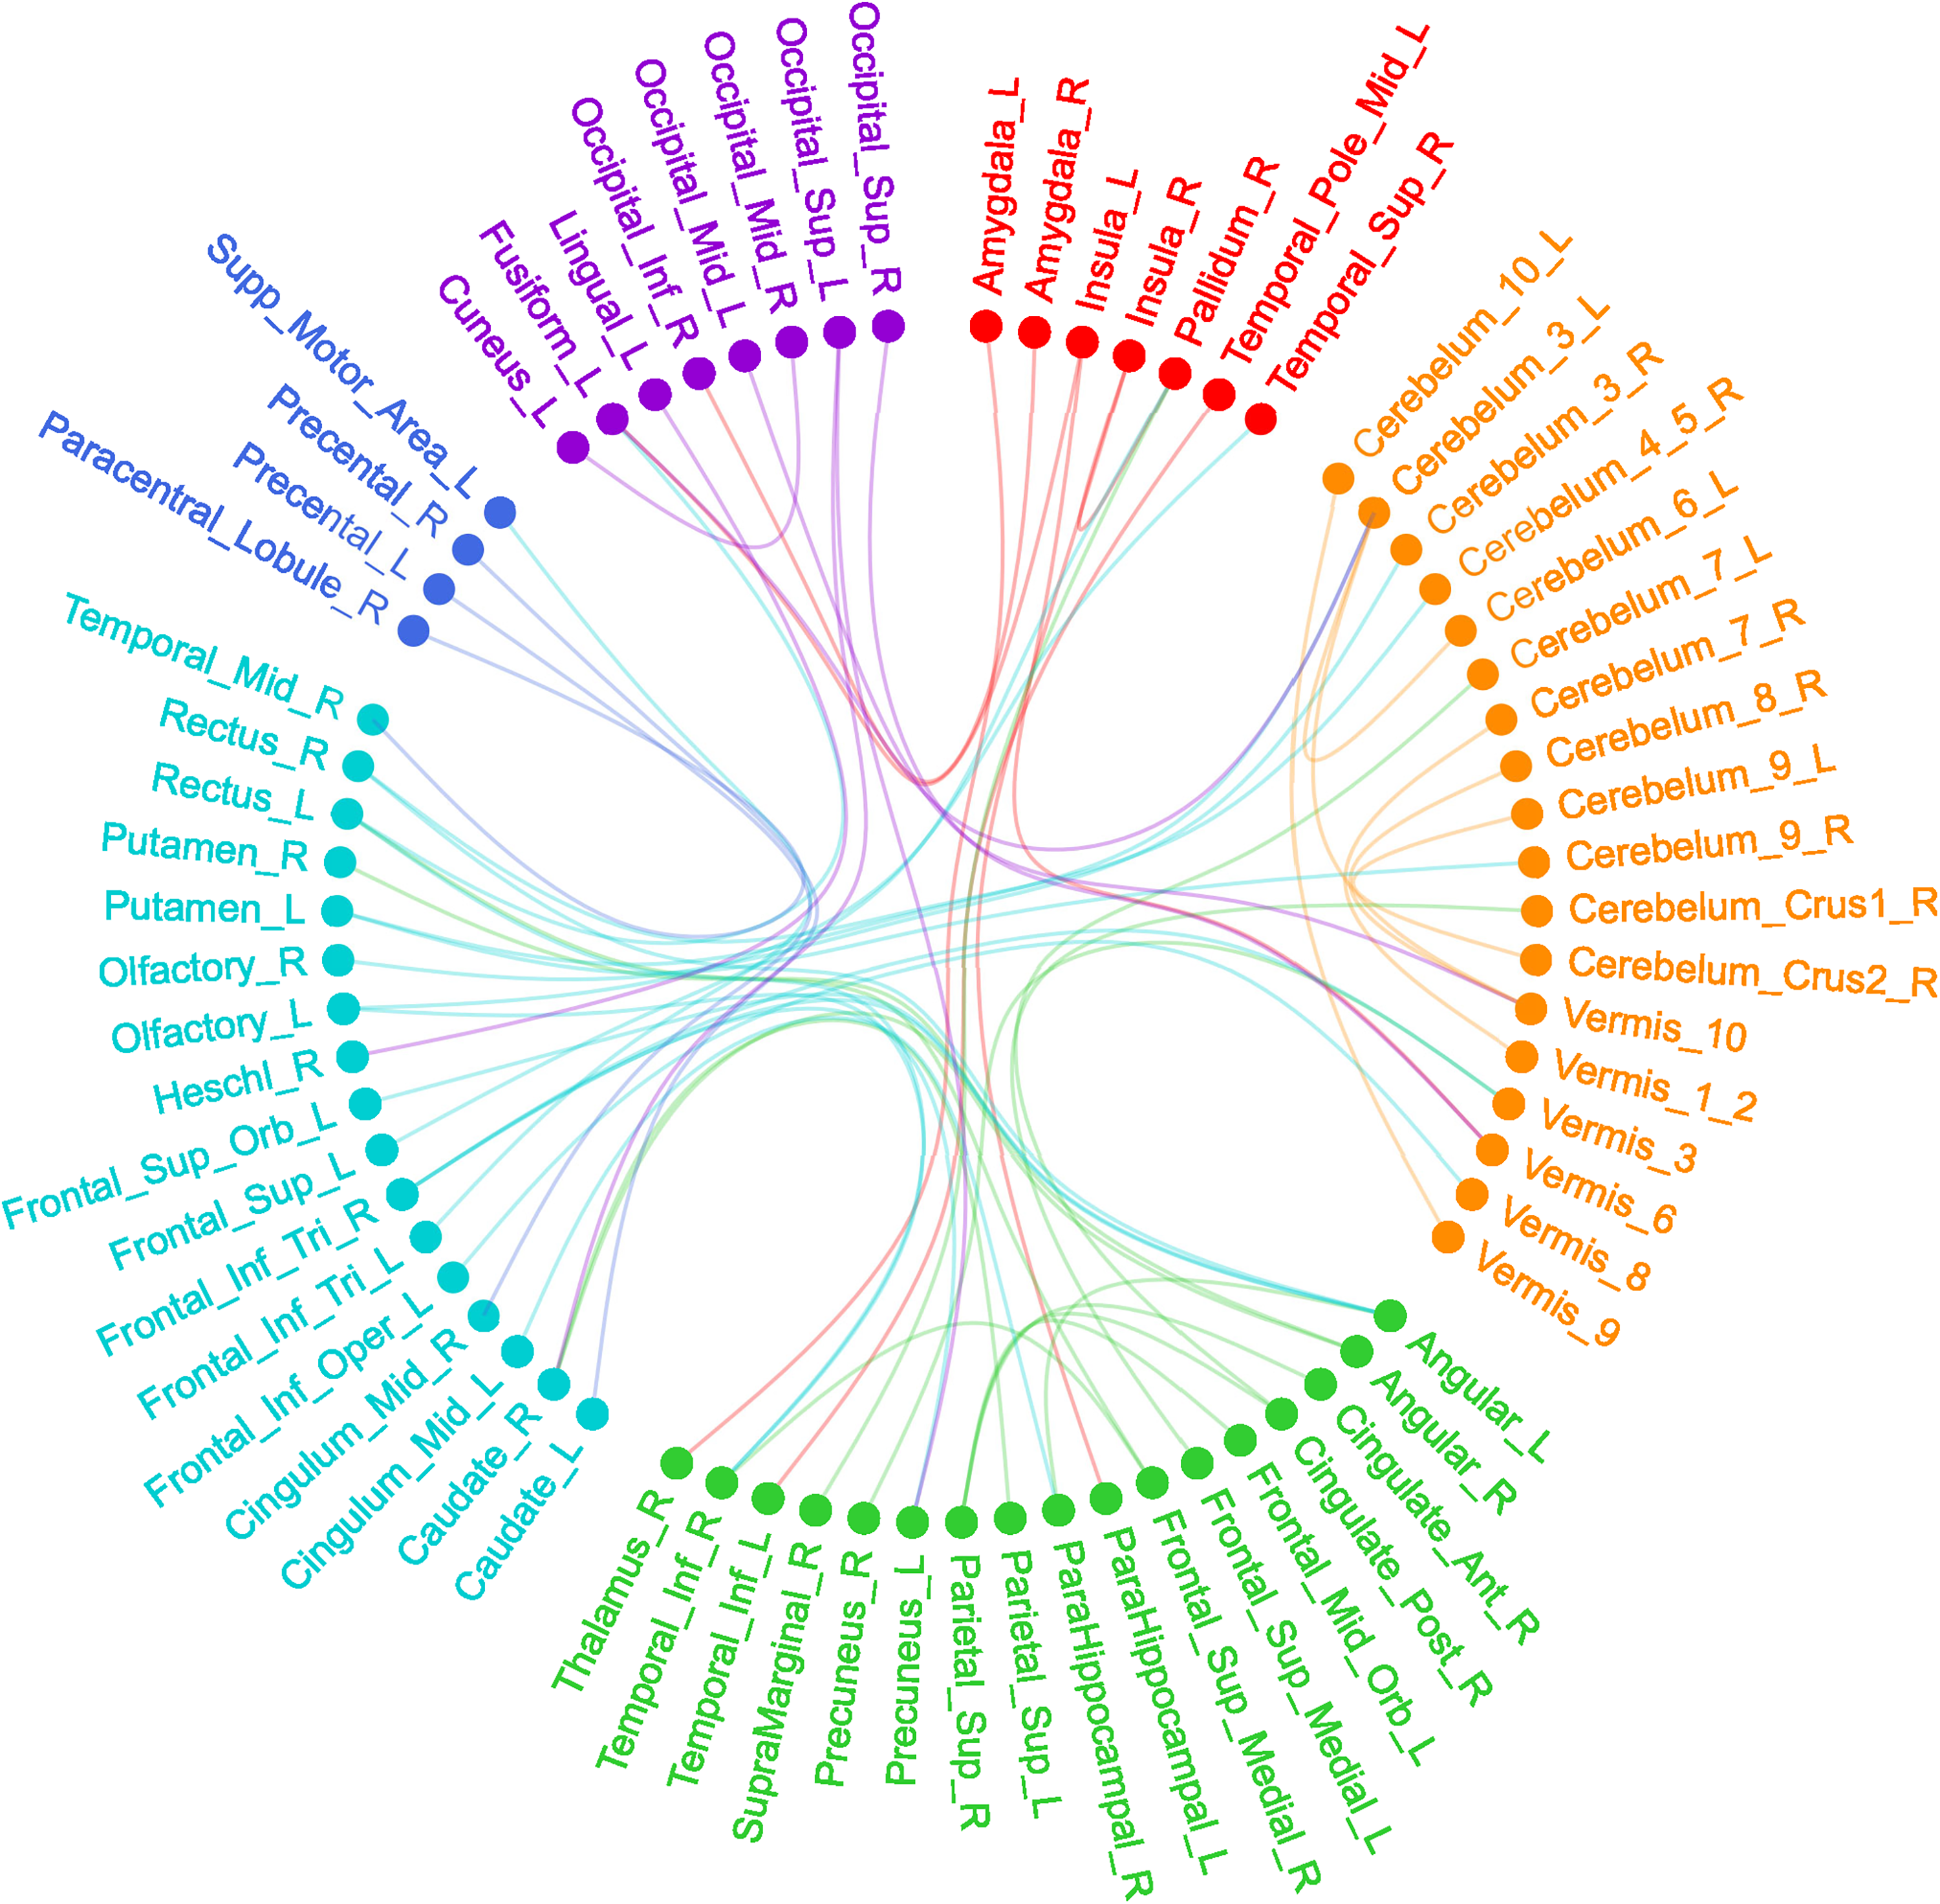
Fifty-three RSFC features for discriminating RD and NRD. The red spot indicates the affective network, the green spot indicates the default-mode network, the purple spot indicates the visual network, the blue spot indicates the sensorimotor network, the orange spot indicates the cerebellum area and the indigo spot indicates the other areas in the AAL template.
The FC Features for Discriminating RD and NRD.
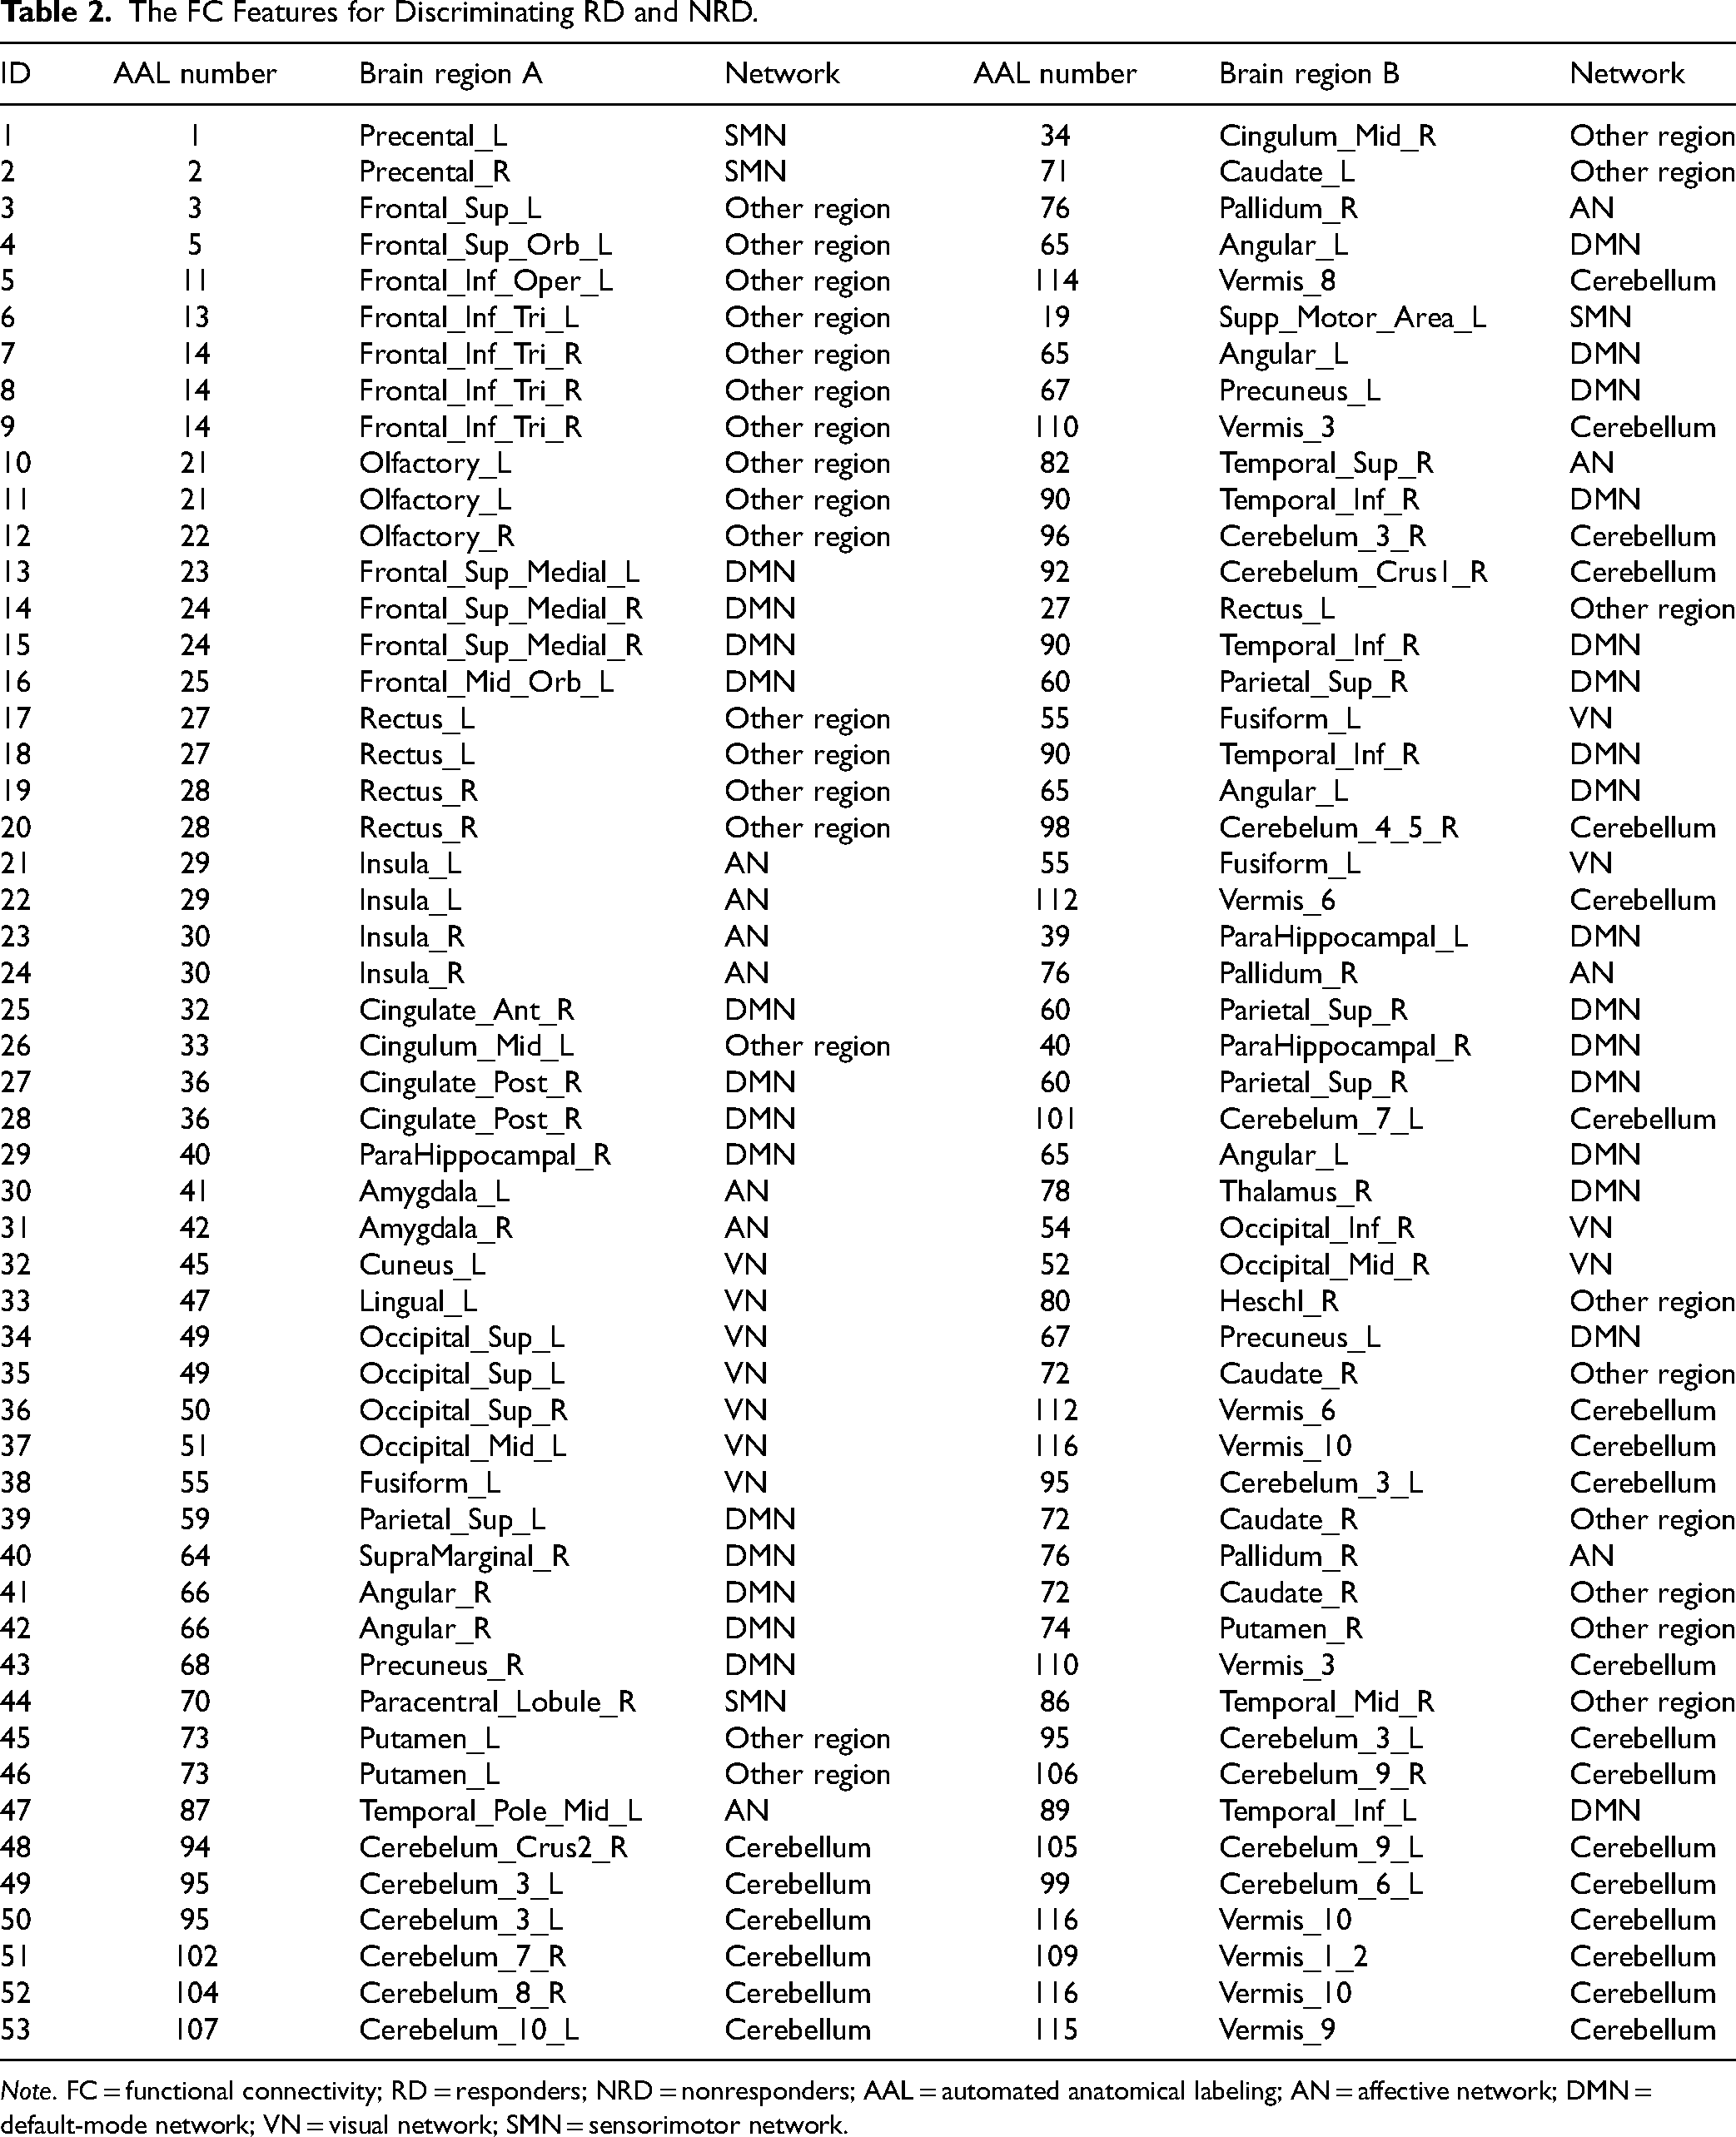
Note. FC = functional connectivity; RD = responders; NRD = nonresponders; AAL = automated anatomical labeling; AN = affective network; DMN = default-mode network; VN = visual network; SMN = sensorimotor network.
Verification Analysis
After the feature selection of multidimensional data, the 62 features obtained after selecting were input into 4 different machine learning (ML) classifiers (SVM, RF, NB, and LR) to establish the corresponding prediction models. Finally, the accuracy, sensitivity, specificity, and AUC of the 4 models were obtained by the LOOCV method.
Table 3 shows the performance of SVM, RF, NB, and LR models in predicting RD and NRD (without global signal regression [GSR]). The 4 ML algorithms have all shown good performance based on the multidimensional combined data sets of P11 methylation, rs-fMRI, and clinical/demographic features. Among them, the SVM model has the best performance, with 95.92% predictive accuracy and 0.9967 AUC, better than the RF, NB, and LR models (Figure 2). The performance of different feature sets was compared. The prediction model based on P11 methylation, rs-fMRI, and clinical/demographic features was generally better than the prediction model based merely on rs-fMRI and clinical/demographic features or DNA methylation and clinical/demographic features.
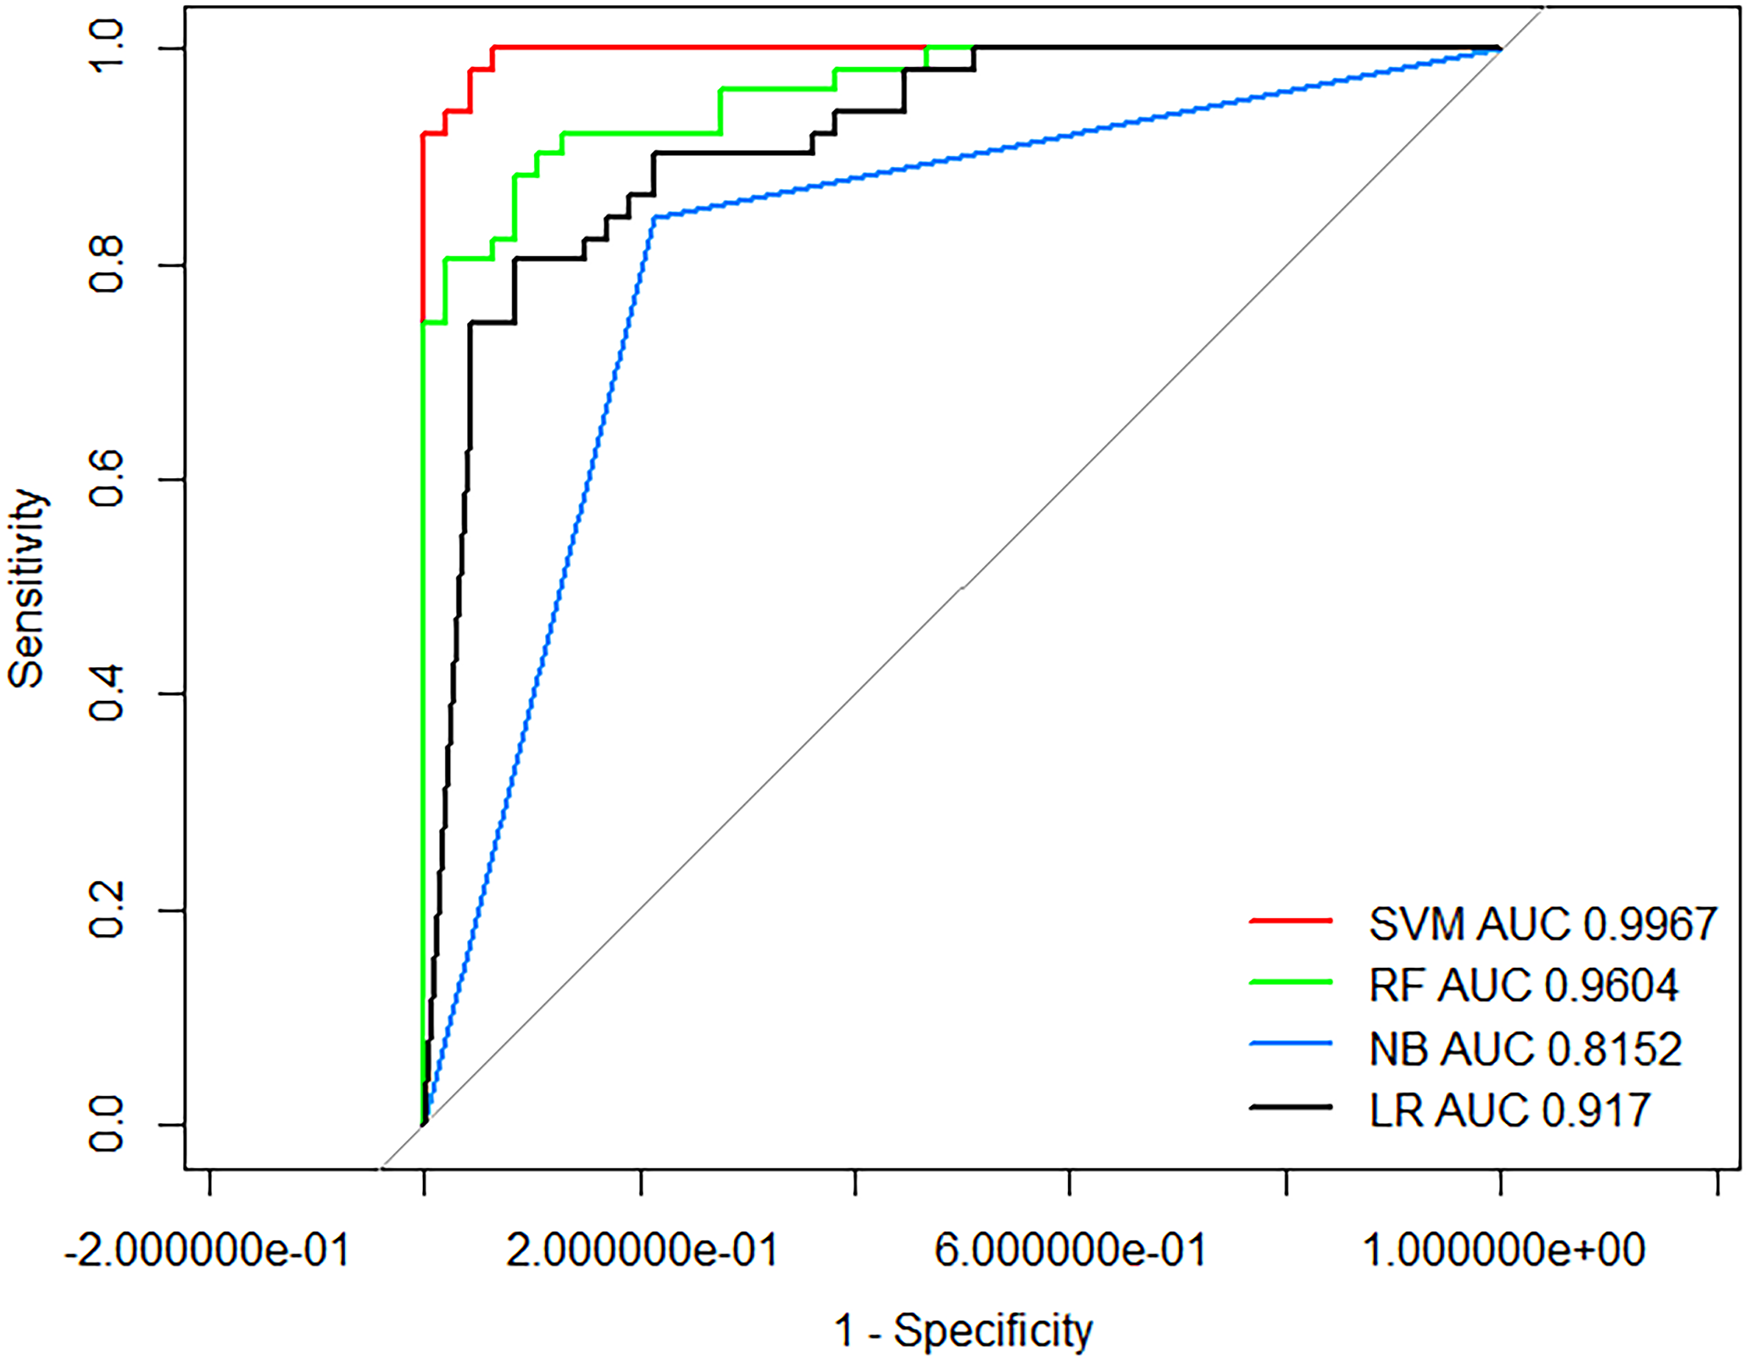
ROC curve of the SVM, RF, NB, and LR, based on the combined feature set.
Predictive Performance of SVM, RF, NB, and LR for Discriminating RD and NRD.
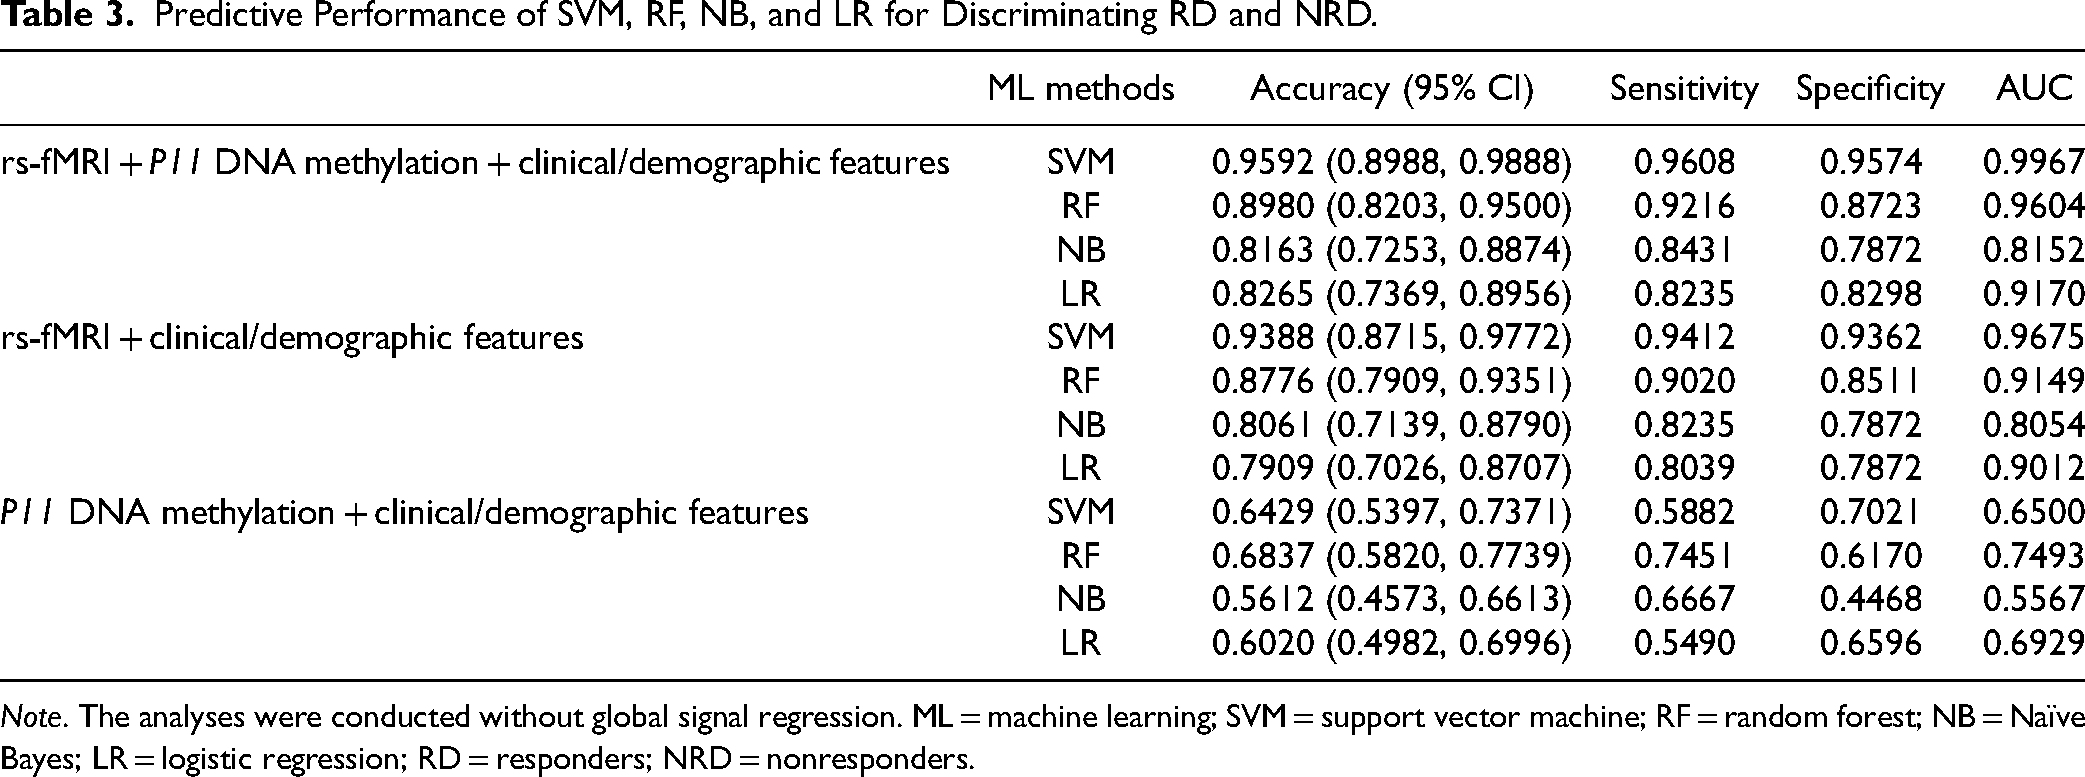
Note. The analyses were conducted without global signal regression. ML = machine learning; SVM = support vector machine; RF = random forest; NB = Naïve Bayes; LR = logistic regression; RD = responders; NRD = nonresponders.
In addition, the prediction performance based on other information categories is shown in Supplemental Table S2. Considering that the usage of GSR may influence the results, 30 we also analysed the data with GSR. The results showed that the selected predictive model features are the same with or without GSR through the same feature selection. The results of the analysis with GSR are shown in Supplemental Table S3. Similarly, the SVM model performs best, with 95.92% predictive accuracy and 0.9954 AUC, better than RF, NB, and LR models with GSR.
Discussion
In this study, an ML model based on multidimensional features of neuroimaging and epigenetics was constructed to predict the early antidepressant efficacy in MDD. rs-fMRI (including ALFF, ReHo, and FC) and P11 methylation data at baseline were used in ML algorithms to distinguish RD and NRD in early antidepressant treatment at baseline, which showed high predictive accuracy (95.92%). In addition, this study found that models based on multidimensional feature sets performed better than those constructed on incomplete data inclusions.
The SVM, RF, NB, and LR all obtained high prediction accuracy, and the corresponding AUC values were also quite robust. Among them, the method of SVM achieved the highest accuracy and AUC value. A systematic review of diagnostic classification and efficacy prediction of MDD concluded that SVM generally provides better classification performance (mostly above 85% accuracy) than other classifiers. 31 A single-photon emission computerized tomography imaging study showed that the SVM-based model (85% accuracy) could provide a better guide than LR (83% accuracy) for Parkinson's disease (PD) stage classification. 32 Zhang et al. 33 found that PD with depression could be distinguished from healthy controls with 100% accuracy using SVM, while the accuracy using RF was 0.90.
According to the resting-state hypothesis of depression proposed by Northoff et al. 34 and expanded by Gupta et al., 35 the abnormality in the resting-state brain activity is the core feature of MDD and one of the most consistent findings among the variety of different and in part contradictory findings in MDD. In this study, DMN, AN, VN, SMN, and cerebellar networks contributed the most to distinguishing RD and NRD. These networks were associated with the pathophysiology of MDD in previous studies and are also consistent with the resting-state hypothesis of depression. The feature selection process discerned the functional connection distinguishing RD and NRD in MDD, 17 brain regions covering DMN. DMN mainly includes mPFC, ACC, PCC, precuneus, hippocampus, parahippocampal gyrus, AG, thalamus, inferior parietal lobule, supramarginal gyrus, and inferior temporal gyrus. 36 DMN is the core of spontaneous cognition, self-referential processing, and emotional regulation. 7 The functional activity of DMN is abnormal in MDD patients. DMN is also important in predicting antidepressant efficacy. Pang et al. 37 found that baseline FC within DMN and between DMN and central executive network (CEN) could effectively predict the improvement of depressive symptoms after ECT treatment. Chin Fatt et al. 38 found that higher connectivity within DMN and between DMN and the CEN predicted better antidepressant efficacy of sertraline. In addition, we found that AG in DMN was involved in more functional connections (6 FCs), suggesting that AG may be important in distinguishing RD and NRD. Shen et al. 39 showed that subhubs of baseline functional brain networks were related to early improvement following 2-week pharmacological therapy for MDD, with AG showing 100% sensitivity and specificity. They suggest that DMN, notably AG, is an important biomarker in predicting antidepressant efficacy.
The features in AN include the amygdala, insula, pallidum, and temporal poles, which are mainly involved in emotional processing and regulation. 40 Generally, it was regarded that emotional abnormality in MDD is associated with functional dysregulation in AN. It was found that compared with healthy controls, MDD patients showed reduced FC within AN between the left amygdala and bilateral precuneus and right ACC. 41 Compared with nontreatment-resistant depression, FC alterations in AN were more abnormal in the patients with treatment-resistant depression. 42 Chen et al. 43 found that repetitive transcranial magnetic simulation treatment could enhance AN connectivity in MDD patients, which is closely linked to emotional improvement. These findings indicate that AN is involved in the pathophysiology of MDD and plays an important role in antidepressant efficacy.
There were 18 brain regions in the cerebellum highlighted. Traditionally, the cerebellum was considered to play a significant role in movement coordination. However, its crucial role in processing language, emotion, cognition, and behaviour has recently been found. 44 The cognitive and emotional control impairment of MDD patients is closely related to the changes in cerebellar activity. 45 Previously we found that voxel-mirrored homotopic connectivity in the bilateral cerebellum anterior lobe of the nonresponding depression was significantly reduced. 46 In addition, several studies have shown the role of the cerebellum in antidepressant treatment. After rapid antidepressant therapy with ketamine, global brain connectivity with GSR values was significantly reduced in the cerebellum. Loureiro et al. 45 found that the connectivity between the cerebellum and frontoparietal network and the SMN network was significantly reduced after ketamine rapid antidepressant treatment in MDD remitters. A meta-analysis found that medication-naïve patients with MDD had reduced ALFF and fractional ALFF in the left cerebellum, and antidepressant therapy promoted the recovery of cerebellar function. 47 It suggests that abnormalities in the cerebellar functional activity and FC may also be specific biomarkers for MDD and have significant value in predicting efficacy.
The feature selection process discerned the functional local activity (i.e., ALFF of the postcentral gyrus) and connectivity covering VN and SMN. Deficits in visual processing are reported in depression. 48 Luo et al. 49 found that compared with healthy controls, FC within the lateral visual VN was significantly decreased, and effective connectivity from VN to the parietal network and the cerebellum network was significantly enhanced in MDD patients. In addition, SMN also plays an important part in antidepressant efficacy. An fMRI study found that the synchronization of SMN with the attention network played an important role in predicting the efficacy of sertraline after 12 weeks of treatment in late-life depression. 50 Another study found that decreased FC in bilateral SMN and contralateral frontoparietal network at baseline was characteristic of the MDD who did not respond to escitalopram treatment. 51 These findings encourage further investigation into the value of VN and SMN in predicting the efficacy of MDD.
Besides these rs-fMRI findings, the present study also found some P11 methylation sites that help distinguish RD from NRD, consistent with previous findings. In animal experiments, Neyazi et al. 23 found that hypermethylation of the P11 promoter in the prefrontal cortex could predict a better response to electroconvulsive stimulation. They also found that hypermethylation of the P11 promoter in the peripheral blood of refractory patients with MDD could predict a better response to ECT. Previous research by our team found that the response to antidepressants was associated with the following interactions: the CTQ score and P11-3-185 site methylation, the CTQ PN score and P11-2-117 site methylation, and the CTQ EA score and P11-3-185 site methylation. 24 The DNA methylation sites identified in this study were P11-1-37, P11-1-85, P11-3-97, P11-3-150, and P11-4-132. These sites have a close spatial relationship (35–230 bp apart) with the sites we found earlier. It suggests that P11 methylation data can partially predict antidepressant efficacy.
There are some limitations to the present study. First, the sample size was relatively small in the current study, which limits the statistical power in revealing subtle effects. Second, although there was no significant difference emerged concerning the HAMD-17 reduction rate among all 3 treatment options (SSRIs, SNRIs, and NaSSAs), it is worth noting that there was a lack of standardized therapeutic drugs for the patients. In this study, fluoxetine equivalent dose conversion was used to minimize the drug differences between RD and NRD groups. Third, although cross-validation was used in this study to check the generalizability of the results, there needs to be an independent external validation cohort. Further validation of the results in a larger independent cohort is needed.
Conclusion
This study found that the multidimensional data features combining rs-fMRI (ALFF, ReHo, and FC), P11 gene DNA methylation, and clinical/demographic features can predict the early antidepressant efficacy in MDD. Comprehensive multidimensional data features have significant advantages and potential in predicting the efficacy of MDD and have specific reference values in clinical practice.
Supplemental Material
sj-pdf-1-cpa-10.1177_07067437231210787 - Supplemental material for Prediction of Early Antidepressant Efficacy in Patients with Major Depressive Disorder Based on Multidimensional Features of rs-fMRI and P11 Gene DNA Methylation
Supplemental material, sj-pdf-1-cpa-10.1177_07067437231210787 for Prediction of Early Antidepressant Efficacy in Patients with Major Depressive Disorder Based on Multidimensional Features of rs-fMRI and P11 Gene DNA Methylation by Tianyu Wang, Chenjie Gao, Jiaxing Li, Lei Li, Yingying Yue, Xiaoyun Liu, Suzhen Chen, Zhenghua Hou, Yingying Yin, Wenhao Jiang, Zhi Xu, Youyong Kong and Yonggui Yuan in The Canadian Journal of Psychiatry
Footnotes
Acknowledgments
We are sincerely grateful to all participants in this study.
Declaration of Conflicting Interests
The authors declared no potential conflicts of interest with respect to the research, authorship, and/or publication of this article.
Funding
The authors disclosed receipt of the following financial support for the research, authorship, and/or publication of this article: This study was supported by the National Natural Science Foundation of China (Nos. 81971277 and 82271570); National Natural Science Foundation of China-Youth Foundation Projects (No. 81901375); Jiangsu Provincial Key Research and Development Program (No. BE2019748).
Supplemental Material
Supplemental material for this article is available online.
References
Supplementary Material
Please find the following supplemental material available below.
For Open Access articles published under a Creative Commons License, all supplemental material carries the same license as the article it is associated with.
For non-Open Access articles published, all supplemental material carries a non-exclusive license, and permission requests for re-use of supplemental material or any part of supplemental material shall be sent directly to the copyright owner as specified in the copyright notice associated with the article.