
Abstract
Context
Assessing temporal changes in the recorded diagnostic rates, incidence proportions, and health outcomes of substance-related disorders (SRD) can inform public health policymakers in reducing harms associated with alcohol and other drugs.
Objective
To report the annual and cumulative recorded diagnostic rates and incidence proportions of SRD, as well as mortality rate ratios (MRRs) by cause of death among this group in Canada, according to their province of residence.
Methods
Analyses were performed on linked administrative health databases (AHD; physician claims, hospitalizations, and vital statistics) in five Canadian provinces (Alberta, Manitoba, Ontario, Québec, and Nova Scotia). Canadians 12 years and older and registered for their provincial healthcare coverage were included. The International Classification of Diseases (ICD-9 or ICD-10 codes) was used for case identification of SRD from April 2001 to March 2018.
Results
During the study period, the annual recorded SRD diagnostic rates increased in Alberta (2001–2002: 8.0‰; 2017–2018: 12.8‰), Ontario (2001–2002: 11.5‰; 2017–2018: 14.4‰), and Nova Scotia (2001–2002: 6.4‰; 2017–2018: 12.7‰), but remained stable in Manitoba (2001–2002: 5.5‰; 2017–2018: 5.4‰) and Québec (2001–2002 and 2017–2018: 7.5‰). Cumulative recorded SRD diagnostic rates increased steadily for all provinces. Recorded incidence proportions increased significantly in Alberta (2001–2002: 4.5‰; 2017–2018: 5.0‰) and Nova Scotia (2001–2002: 3.3‰; 2017–2018: 3.8‰), but significantly decreased in Ontario (2001–2002: 6.2‰; 2017–2018: 4.7‰), Québec (2001–2002: 4.1‰; 2017–2018: 3.2‰) and Manitoba (2001–2002: 2.7‰; 2017–2018: 2.0‰). For almost all causes of death, a higher MRR was found among individuals with recorded SRD than in the general population. The causes of death in 2015–2016 with the highest MRR for SRD individuals were SRD, suicide, and non-suicide trauma in Alberta, Ontario, Manitoba, and Québec.
Discussion
Linked AHD covering almost the entire population can be useful to monitor the medical service trends of SRD and, therefore, guide health services planning in Canadian provinces.
Introduction
In 2017, substance-related problems cost Canadians around $46 billion, with alcohol being the major contributor at $16.6 billion per year. 1 Administrative health databases (AHD) are critical to monitor substance-related disorders (SRD) as recorded in the Canadian medical system and to provide information useful for shaping health policy responses.2,3 AHD can complement epidemiological surveys because they have the advantages of covering nearly the entire population and are routinely updated.2,4
Substance use encompasses a wide range of phenomena, from use that does not cause harm to SRD. 5 SRD can further be divided into three categories: substance use disorders (SUD: abuse and dependence), substance-induced disorders (withdrawal, secondary psychoses, alcohol cirrhosis, etc.), and acute intoxication (bad trips, ethylic comas, etc.). 5 This categorization takes into account the ninth and tenth revision of the International Classification of Diseases (ICD) and the fourth and fifth edition of the Diagnostic and Statistical Manual of Mental Disorders.6–9
The most recent epidemiological survey in 2017 found that 4.1% of Canadians reported some form of non-alcohol substance-related harm, in the previous year. British Columbia had the highest rate (6.6%) and Manitoba (2.1%) the lowest. 10 The most recent national epidemiological data for specific SUD diagnoses (2012) noted that 21.6% of Canadians met Diagnostic and Statistical Manual of Mental Disorder, Fourth Edition diagnostic criteria for lifetime SUD (alcohol and drugs) and 4.4% for annual SUD. Interprovincial differences were also noted, with the lowest annual (3.9%) and lifetime (17.8%) prevalence rates in Quebec, and the highest in the Prairie provinces (5.2% and 28.5%, respectively). 11 These interprovincial differences highlight the need for policymakers to obtain specific regional data.
Previous international studies consistently report higher rates of mortality among individuals with SRD compared to the general population, although there are variations in causes of death as a result of differences in the method or timing of data collection.12–19 There is less information for Canada, particularly for the mortality rate gaps between individuals with and without recorded SRD. To address this gap, we compared temporal trends of recorded SRD diagnoses, recorded incidence proportions, and mortality rate ratios (MRR) by cause of death among Canadians by their province of residence. Although this research could not capture all cases of SRD, the aim was to allow a better understanding of gaps in data availability that might be barriers to a potential strong SRD surveillance system in Canada. These data could be relevant to other jurisdictions with similar AHD in informing public health.
Methods
Setting
All Canadian residents can receive free inpatient or outpatient treatment within the public health system, managed at the provincial level. Information concerning diagnoses and medical services is routinely compiled in health insurance registries that cover nearly the entire population of each province, and data can be linked using unique personal identifiers. 20 As the majority of clinical payments for general practitioners and medical specialists are billed using a fee-for-service system (94% in 2001–2002; 73% in 2017–2018), most medical contacts are therefore captured by AHDs.21,22 For instance, about 99% of physicians in Ontario and Québec, 91% in Alberta, 90% in Manitoba, and 63% in Nova Scotia received at least one payment through fee-for-service in 2017–2018. 22
Study Population
This study included all residents aged 12 years and older of Alberta, Manitoba, Ontario, Québec, and Nova Scotia who were registered for their provincial health insurance plan. This excludes individuals who are not permanent residents of the province (visitors and exchange students) or are absent from their residential province for at least half of the year. In some provinces, specific populations (e.g., refugees, inmates, and military officers) are also excluded. Five provinces were chosen to represent different regions of Canada (Western Canada/Prairies: Alberta and Manitoba; Central Canada: Ontario and Québec; Atlantic/Eastern Canada: Nova Scotia). This study, therefore, covered 79.2% of the total population of Canada (35,151,725 inhabitants). 23
Data Sources
All administrative data were linked using an encrypted unique identifier. Diagnoses from the physician billing databases were coded using ICD-9-CM in Alberta and Manitoba, and ICD-9 in Ontario, Québec, and Nova Scotia.24,25 Hospitalization discharge databases were updated from ICD-9 to ICD-10-CA diagnostic codes at a different pace across provinces: 2001 in Nova Scotia, 2002 in Alberta and Ontario, 2004 in Manitoba, and 2006 in Quebec; all allowed a five-digit coding and 25 codes per claim. 25 The transition to ICD-10-CA in Canada has not substantially changed coding practices but allowed for provincial variations in the average number of diagnoses recorded per hospitalization. 26 All vital statistics data used the four-digit ICD-10-CA coding throughout the study period to record the primary cause of death. 25
Case Definitions
To be considered a case of SRD, an individual aged 12 years and over had to receive at least one relevant ICD code in the physician claims database or the main diagnosis field in the hospitalization database in the fiscal year (April 1 to March 31) (see Supplemental Material for specific ICD codes).
Considering that some provinces only use the three-digit ICD-9 coding,24,25 an indicator for drug intoxication could not be developed, because these codes were not specific to psychoactive drugs. The use of an overall broad definition of SRD circumvents problems that may arise from changes in specific ICD codes or regional variations in recording practices. Case definitions are based on ICD codes used by previous studies which all used a single code as sufficient to classify an individual as having an SRD.27–31 These case definitions have been validated previously (specificity over 90%, sensitivity between 47% and 70%). However, considering that this study does not aim at assessing the overall prevalence of SRD, but rather estimating how many individuals have a recorded diagnosis of SRD, a single code was considered as a valid measure.
The study period spanned 2001–2002 to 2017–2018. For data concerning specific causes of death, the study period ended in 2015–2016 as some provinces had not completed their mortality data compilation beyond that fiscal year.
Analyses
Unless indicated otherwise, all results were age-standardized to the 2011 Canadian Census. Annual recorded diagnostic rates represented the number of individuals per 1,000 (‰ in the text) who met case definition criteria in that year. Cumulative diagnostic rates represented cases in that and previous years (once a case, always a case). Recorded incidence proportions represent the number of individuals (in ‰) who became cases in the previous 12 months. Annual mortality rates (also in ‰), that is, the number of deaths within a given fiscal year, were calculated among SRD cumulative cases. This outcome was an indicator of long-term burden, which did not always occur within the same year as the diagnosis. An annual mortality rate was also generated for individuals in the general population. Finally, MRRs were calculated between individuals with recorded SRD and individuals without diagnosed SRD for each specific cause of death.18,32 When MRR is greater than one, the mortality rate is higher among individuals with recorded SRD compared to the “general population.” MRR indicates an association and that individuals with a recorded SRD diagnosis are more likely to die from a given cause of death than individuals without it, probably because a recorded diagnosis is indicative of better detection due to higher medical needs as well as high comorbidity of SRD with other physical diseases and mental disorders. It should not, therefore, be interpreted as an attributable risk or that SRD is a causal factor.
The large sample sizes and almost complete coverage of studied populations allowed the use of non-overlapping 99% confidence intervals to reduce the possibility that clinically irrelevant differences between provinces were judged as significant. 33 Separate analyses according to sex are available upon request.
Ethics
The project was approved by the Institutional Review Board of the National Public Health Institute of Quebec and endorsed by the Information Access Commission of Québec. Aggregated data access was further authorized within each province by the appropriate Institutional Review Board.
Results
Annual Recorded Diagnostic Rates
The overall annual recorded age-standardized rate of recorded SRD increased from 2001–2002 to 2017–2018 in Alberta (8.0‰ [99% CI, 7.9 to 8.2] to 12.8‰ [99% CI, 12.6 to 12.9]); Ontario (11.5‰ [99% CI, 11.4 to 11.6] to 14.4‰ [99% CI, 14.3 to 14.5]); and Nova Scotia (6.4‰ [99% CI, 6.2 to 6.7] to 12.7‰ [99% CI, 12.4 to 13.1]), but remained stable in Manitoba (5.5‰ [99% CI, 5.3 to 5.7] to 5.4‰ [99% CI, 5.3 to 5.6]) and Québec (7.5‰ [99% CI, 7.4 to 7.6] to 7.5‰ [99% CI, 7.4 to 7.6]). Table 1 provides the annual recorded rates of SRD by sex and province. For all five provinces, males had significantly higher recorded SRD rates than females.
Age-Standardized Recorded Diagnostic Rate (per 1,000) of any Substance-Related Disorder by Sex and by Province.
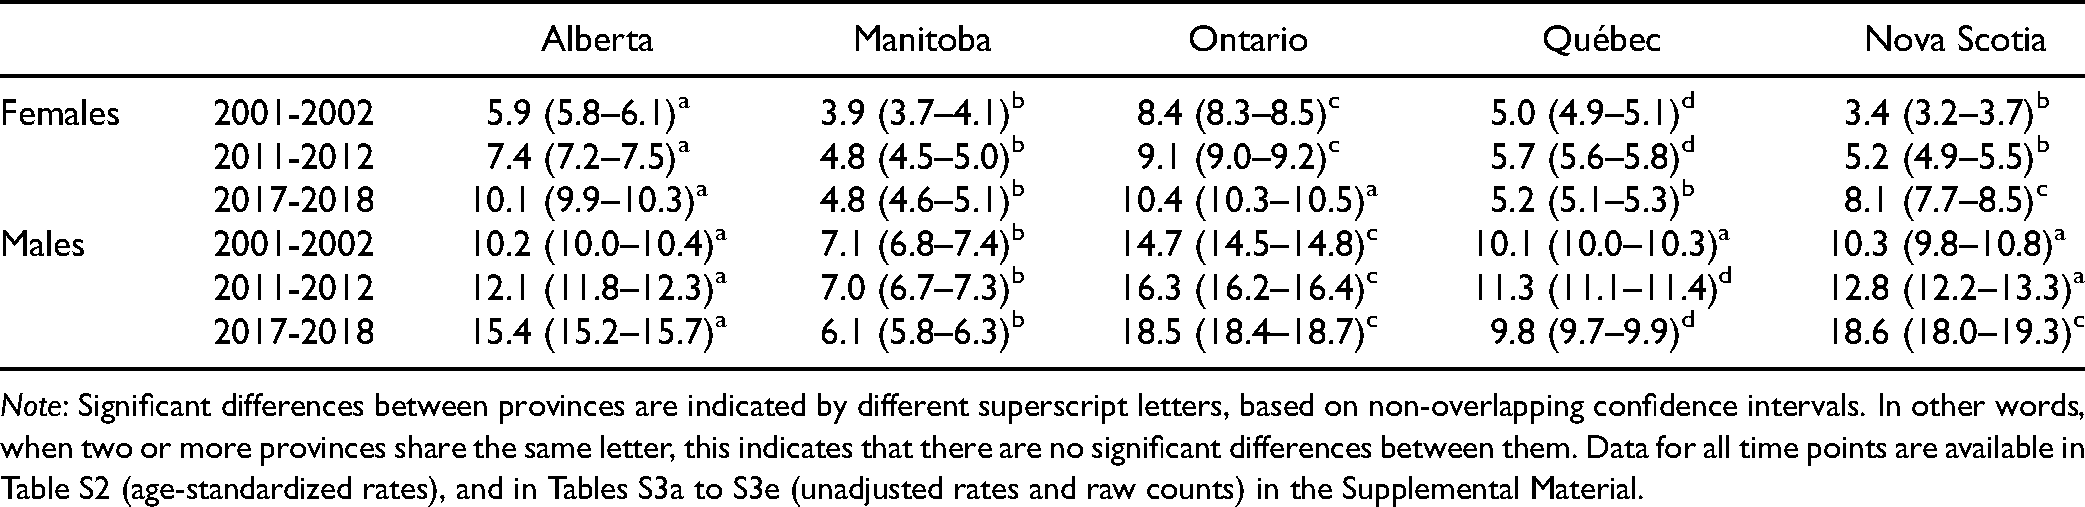
Note: Significant differences between provinces are indicated by different superscript letters, based on non-overlapping confidence intervals. In other words, when two or more provinces share the same letter, this indicates that there are no significant differences between them. Data for all time points are available in Table S2 (age-standardized rates), and in Tables S3a to S3e (unadjusted rates and raw counts) in the Supplemental Material.
Cumulative Recorded Diagnostic Rates
The cumulative recorded rates of any SRD (Figure 1) increased steadily from 2001–2002 to 2017–2018 in all five provinces. Ontario had the highest rate across the years (45.2‰ [99% CI, 45.0 to 45.4] in 2001–2002 to 84.0‰ [99% CI, 83.8 to 84.2] in 2017–2018). Alberta rose from the third-highest recorded rate in 2001–2002 (32.0‰ [99% CI, 31.7 to 32.2]) to the second-highest in 2017–2018 (65.1‰ [99% CI, 64.8 to 65.4]), overtaking Nova Scotia (44.8‰ [99% CI, 44.1 to 45.5] in 2001–2002; 61.0‰ [99% CI, 60.2 to 61.8] in 2017–2018). Québec (26.7‰ [99% CI, 26.6 to 26.9] in 2001–2002; 57.0‰ [99% CI, 58.8 to 57.2] in 2017–2018), followed by Manitoba (24.3‰ [99% CI, 23.9 to 24.7] in 2001–2002; 41.6‰ [99% CI, 41.1 to 42.2] in 2017–2018).
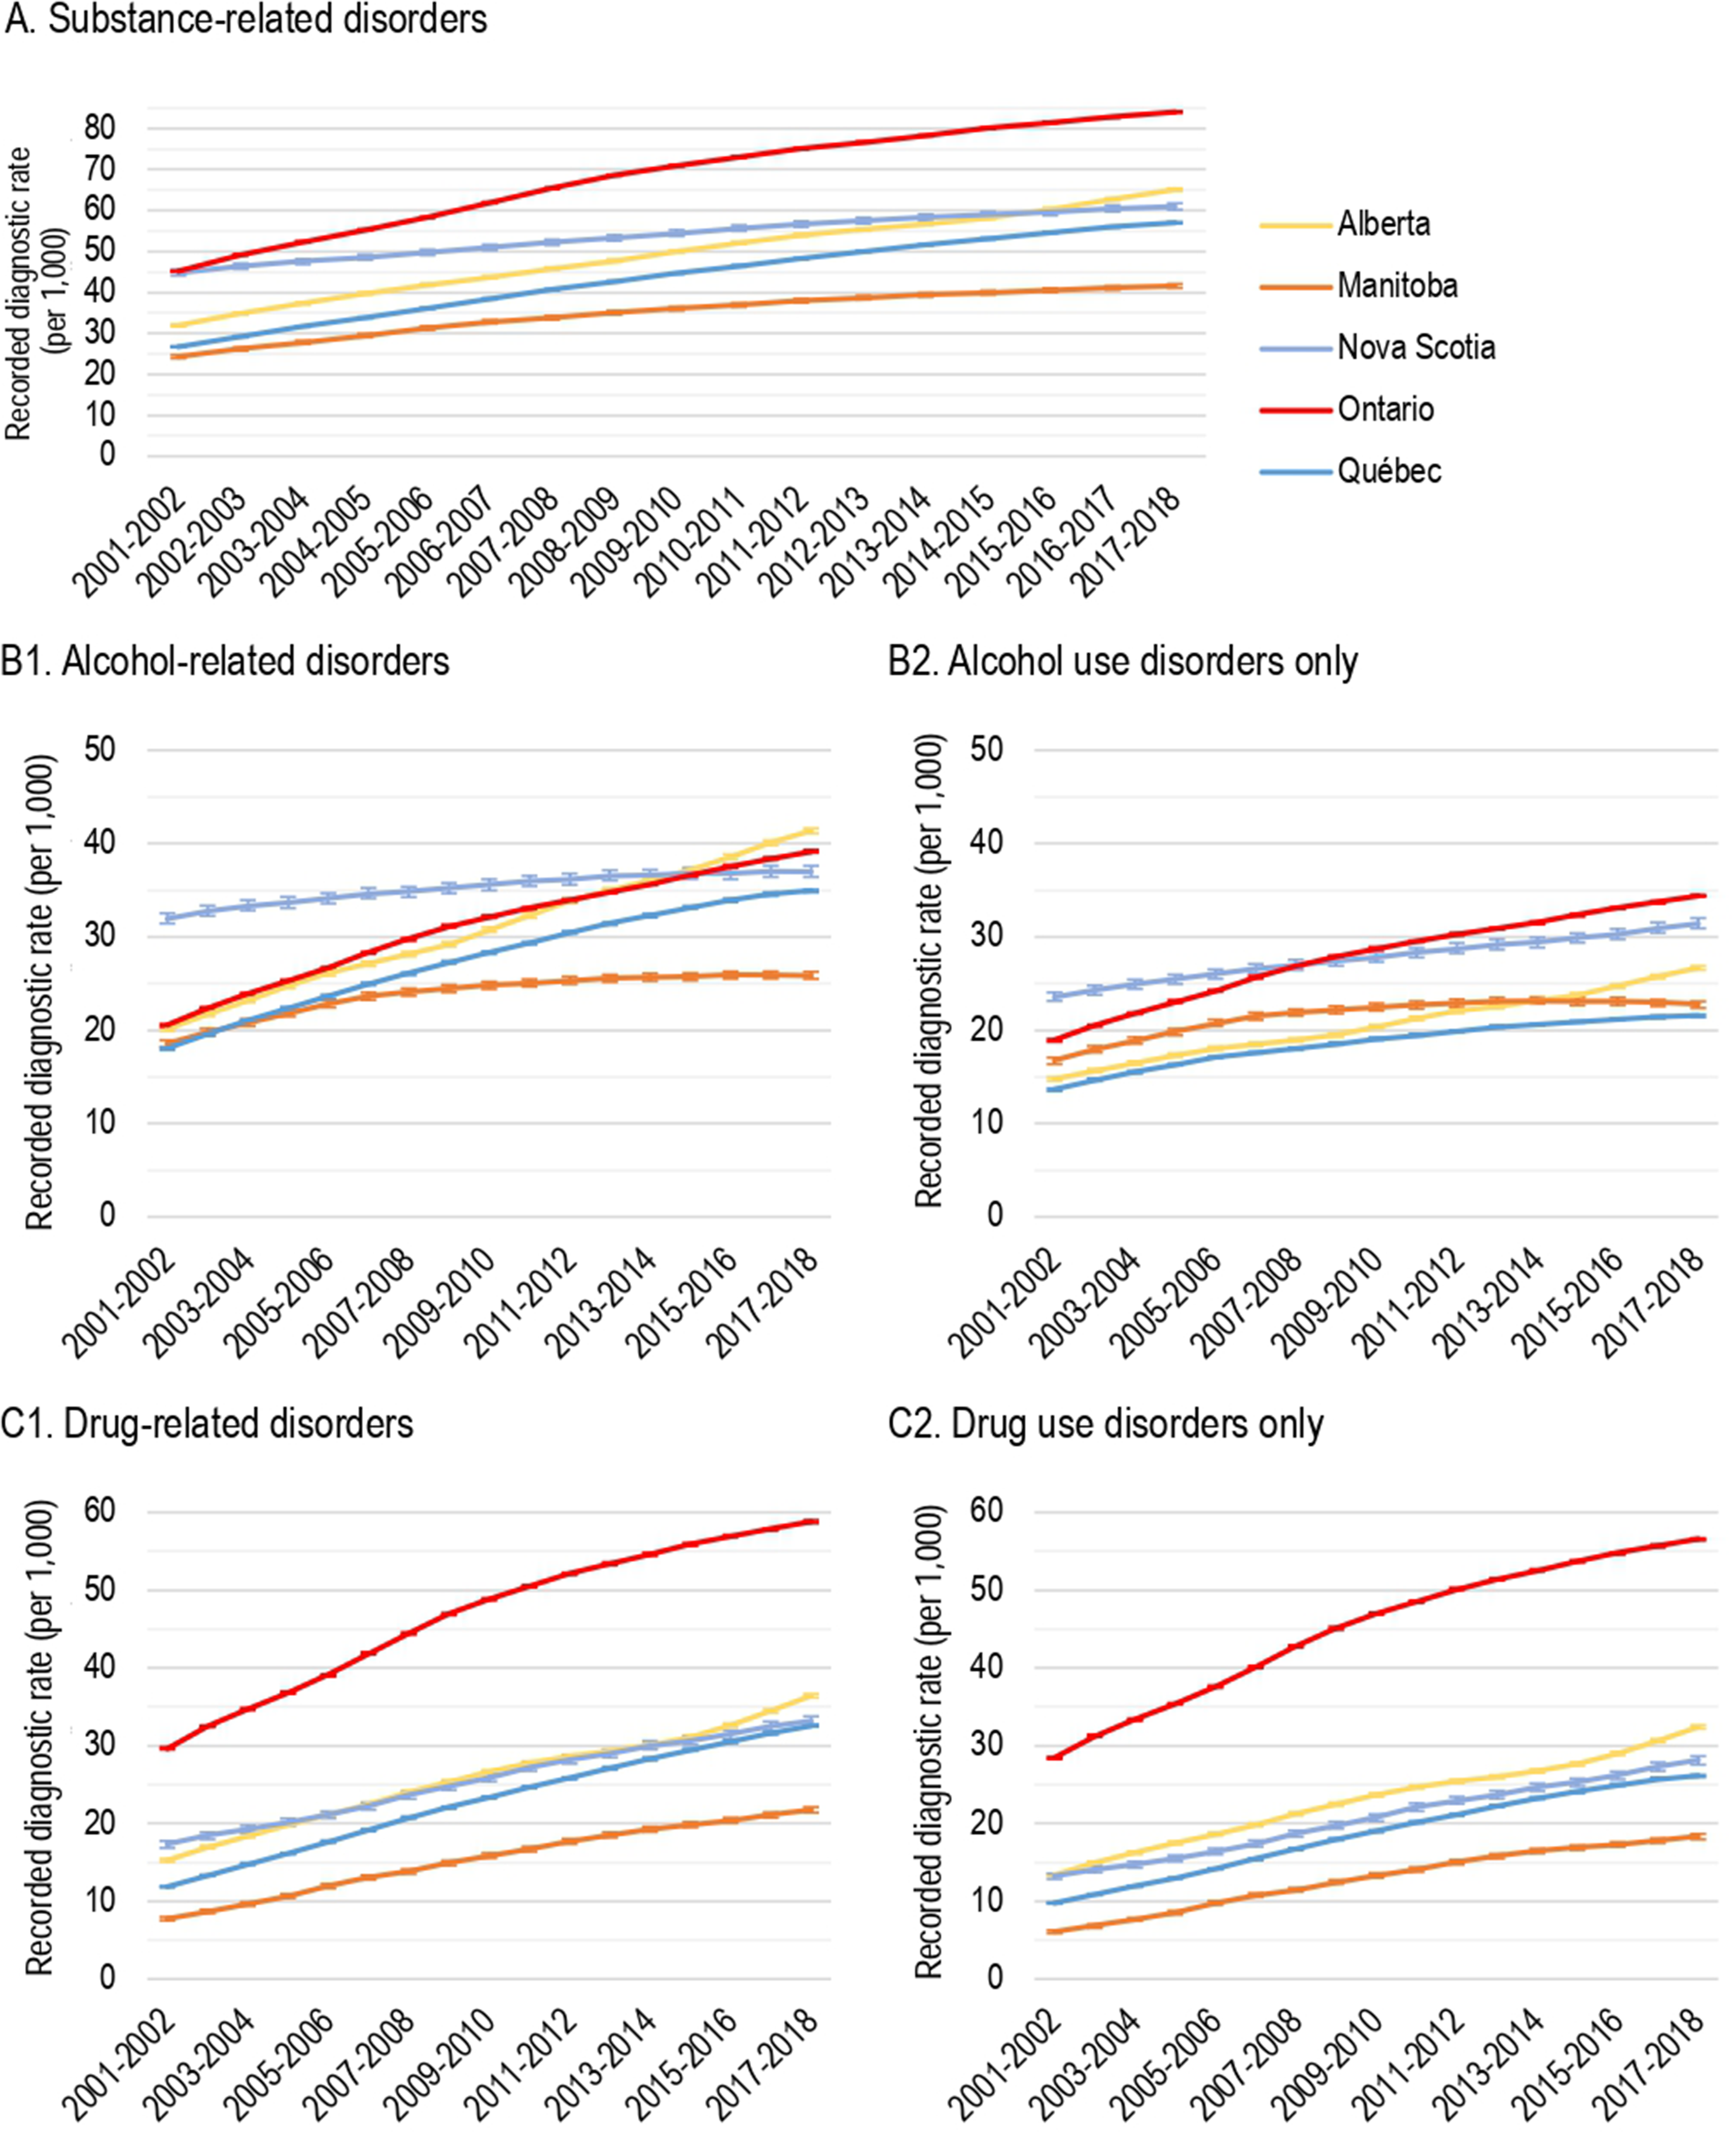
Age-standardized cumulative recorded diagnostic rates of substance-related disorders (SRD) by province, 2001-2002 to 2017-2018. (A) SRD. (B1) Alcohol-related disorders. (B2) Alcohol use disorders only. (C1) Drug-related disorders. (C2) Drug use disorders only.
Concerning overall alcohol-related disorders (Figure 1B1), Alberta had the highest cumulative rate of recorded diagnosis (41.4‰ [99% CI, 41.1 to 41.6] in 2017–2018; 20.1‰ [99% CI, 19.0 to 20.4] in 2001–2002), followed by Ontario (39.1‰ [99% CI, 39.0 to 39.3] in 2017–2018; 20.6‰ [99% CI, 20.4 to 20.7] in 2001–2002). The cumulative recorded rates of alcohol-related disorders increased from 18.6‰ [99% CI, 18.2 to 18.9] in 2001–2002 to 25.9‰ [99% CI, 25.5 to 26.3] in 2017–2018 in Manitoba, from 18.1‰ [99% CI, 17.9 to 18.2] in 2001–2002 to 35.0‰ [99% CI, 34.8 to 35.1] in 2017–2018 in Québec, and from 31.9‰ [99% CI, 31.4 to 32.5] in 2001–2002 to 37.0‰ [99% CI, 36.4 to 37.6] in 2017–2018 in Nova Scotia.
As shown in Figure 1B2, the high rate of recorded alcohol-related disorders in Alberta appeared to be attributable to diagnoses other than alcohol use disorders, for which Ontario had the highest recorded rate (34.4‰ [99% CI, 34.3 to 34.5] in 2017–2018; 19.0‰ [99% CI, 18.8 to 19.1] in 2001–2002), followed by Nova Scotia (31.4‰ [99% CI, 30.9 to 32.0] in 2017–2018; 23.5‰ [99% CI, 23.1 to 24.0] in 2001–2002), by Alberta (26.7‰ [99% CI, 26.5 to 26.9] in 2017–2018; 14.8‰ [99% CI, 14.6 to 15.0] in 2001–2002), by Manitoba (22.8‰ [99% CI, 22.4 to 23.1] in 2017–2018; 16.8‰ [99% CI, 16.4 to 17.1] in 2001–2002) and by Québec (21.6‰ [99% CI, 21.4 to 21.7] in 2017–2018; 13.7‰ [99% CI, 13.5 to 13.8] in 2001–2002).
As presented in Figure 1C1, Ontario had the highest cumulative rate of recorded diagnoses of drug-related disorders with a rate of 58.8‰ [99% CI, 58.6 to 59.0] in 2017–2018 (29.6‰ [99% CI, 29.5 to 29.8] in 2001–2002). Alberta had the second-highest cumulative recorded rate in 2017–2018 (36.4‰ [99% CI, 36.2 to 36.7]; 13.4‰ [99% CI, 13.2 to 13.6] in 2001–2002), followed closely by Nova Scotia (33.2‰ [99% CI, 32.6 to 33.8] in 2017–2018; 17.4‰ [99% CI, 16.9 to 17.8] in 2001–2002), Québec (32.5‰ [99% CI, 32.4 to 32.7] in 2017–2018; 11.9‰ [99% CI, 11.8 to 12.0] in 2001–2002), and Manitoba (21.8‰ [99% CI, 21.4 to 22.1] in 2017–2018; 7.8‰ [99% CI, 7.5 to 8.0] in 2001–2002).
Recorded Incidence Proportions
The recorded incidence proportion for overall SRD slightly, but significantly, increased from 2001–2002 to 2017–2018 in Alberta (4.5‰ [99% CI, 4.3 to 4.6] to 5.0‰ [99% CI, 4.9 to 5.0]) and Nova Scotia (3.3‰ [99% CI, 3.1 to 3.5] to 3.8‰ [99% CI, 3.6 to 3.7]). However, over the same period, a significant decrease for overall recorded SRD was observed in Ontario (6.2‰ [99% CI, 6.2 to 6.3] to 4.7‰ [99% CI, 4.6 to 4.7]), Québec (4.1‰ [99% CI, 4.1 to 4.2] to 3.2‰ [99% CI, 3.2 to 3.3]), and Manitoba (2.7‰ [99% CI, 2.6 to 2.8] to 2.0‰ [99% CI, 1.9 to 2.2]). Figure 2A presents the recorded incidence proportions from 2001–2002 to 2017–2018 for all five provinces for alcohol-related disorders (Figure 2B1), which include alcohol use disorders (Figure 2B2), and for drug-related disorders (Figure 2C1), including drug use disorders (Figure 2C2).
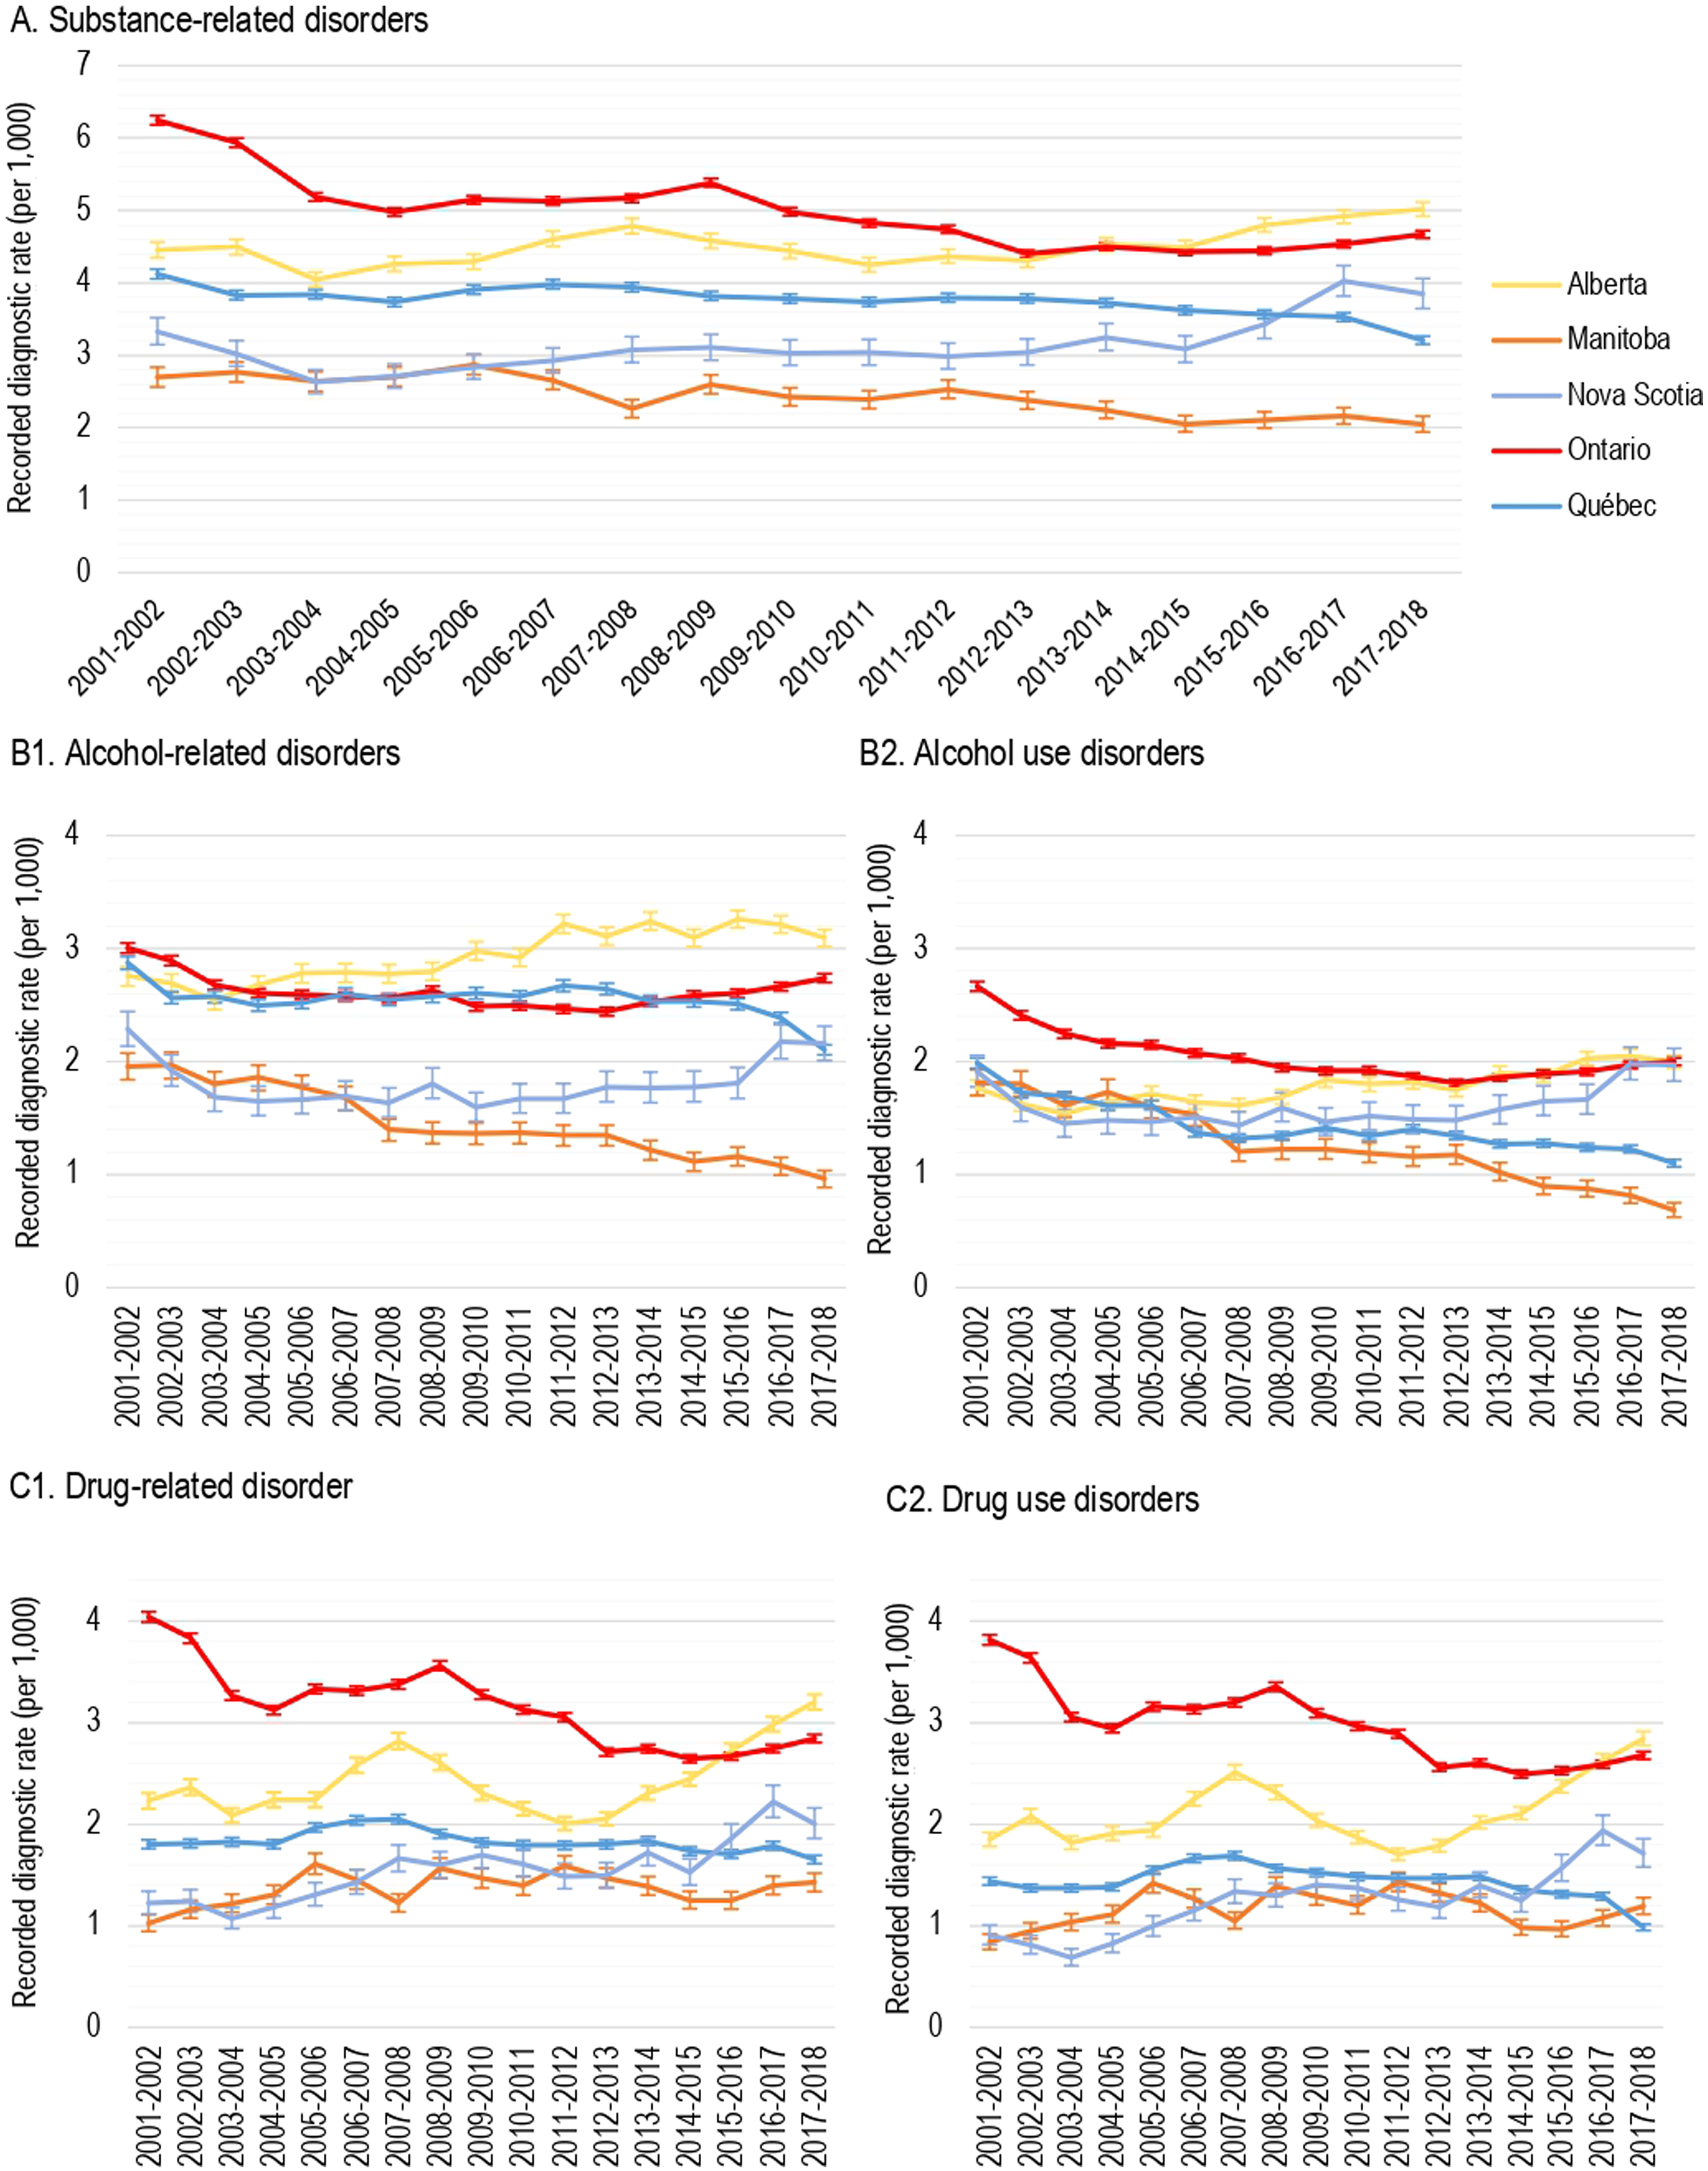
Age-standardized incidence recorded proportions of substance-related disorders (SRD) by province, 2001-2002 to 2017-2018. (A) SRD. (B1) Alcohol-related disorders. (B2) Alcohol use disorders. (C1) Drug-related disorders. (C2) Drug use disorders.
Mortality Rates and MRR
As shown in Figure 3A, the mortality rate in the general population decreased slightly in each province from 2001–2002 to 2017–2018. There was also a similar decrease within the SRD population for the following four provinces: from 28.4‰ [99% CI, 26.9 to 30.1] to 19.5‰ [99% CI, 18.8 to 20.2] in Alberta, from 28.0‰ [99% CI, 25.0 to 31.4] to 21.9‰ [99% CI, 20.1 to 23.9] in Manitoba, from 20.7‰ [99% CI, 20.1 to 21.3] to 17.7‰ [99% CI, 17.4 to 18.0] in Ontario, 31.3‰ [99% CI, 30.2 to 32.4] to 22.9‰ [99% CI, 22.3 to 23.4] in Québec. The exception was in Nova Scotia where the mortality rate in the SRD population increased from 10.3‰ [99% CI, 8.7 to 12.0] to 13.9‰ [99% CI, 12.6 to 15.3] over the 17 years. In each province, the SRD population presented a significantly higher mortality rate than in the general population. The profile trends for the other SRD categories in Figure 3B1, B2, C1, and C2 were similar to overall SRD (Figure 3A). Age-adjusted and unadjusted mortality rates by cause of death are presented in the Supplemental Material.
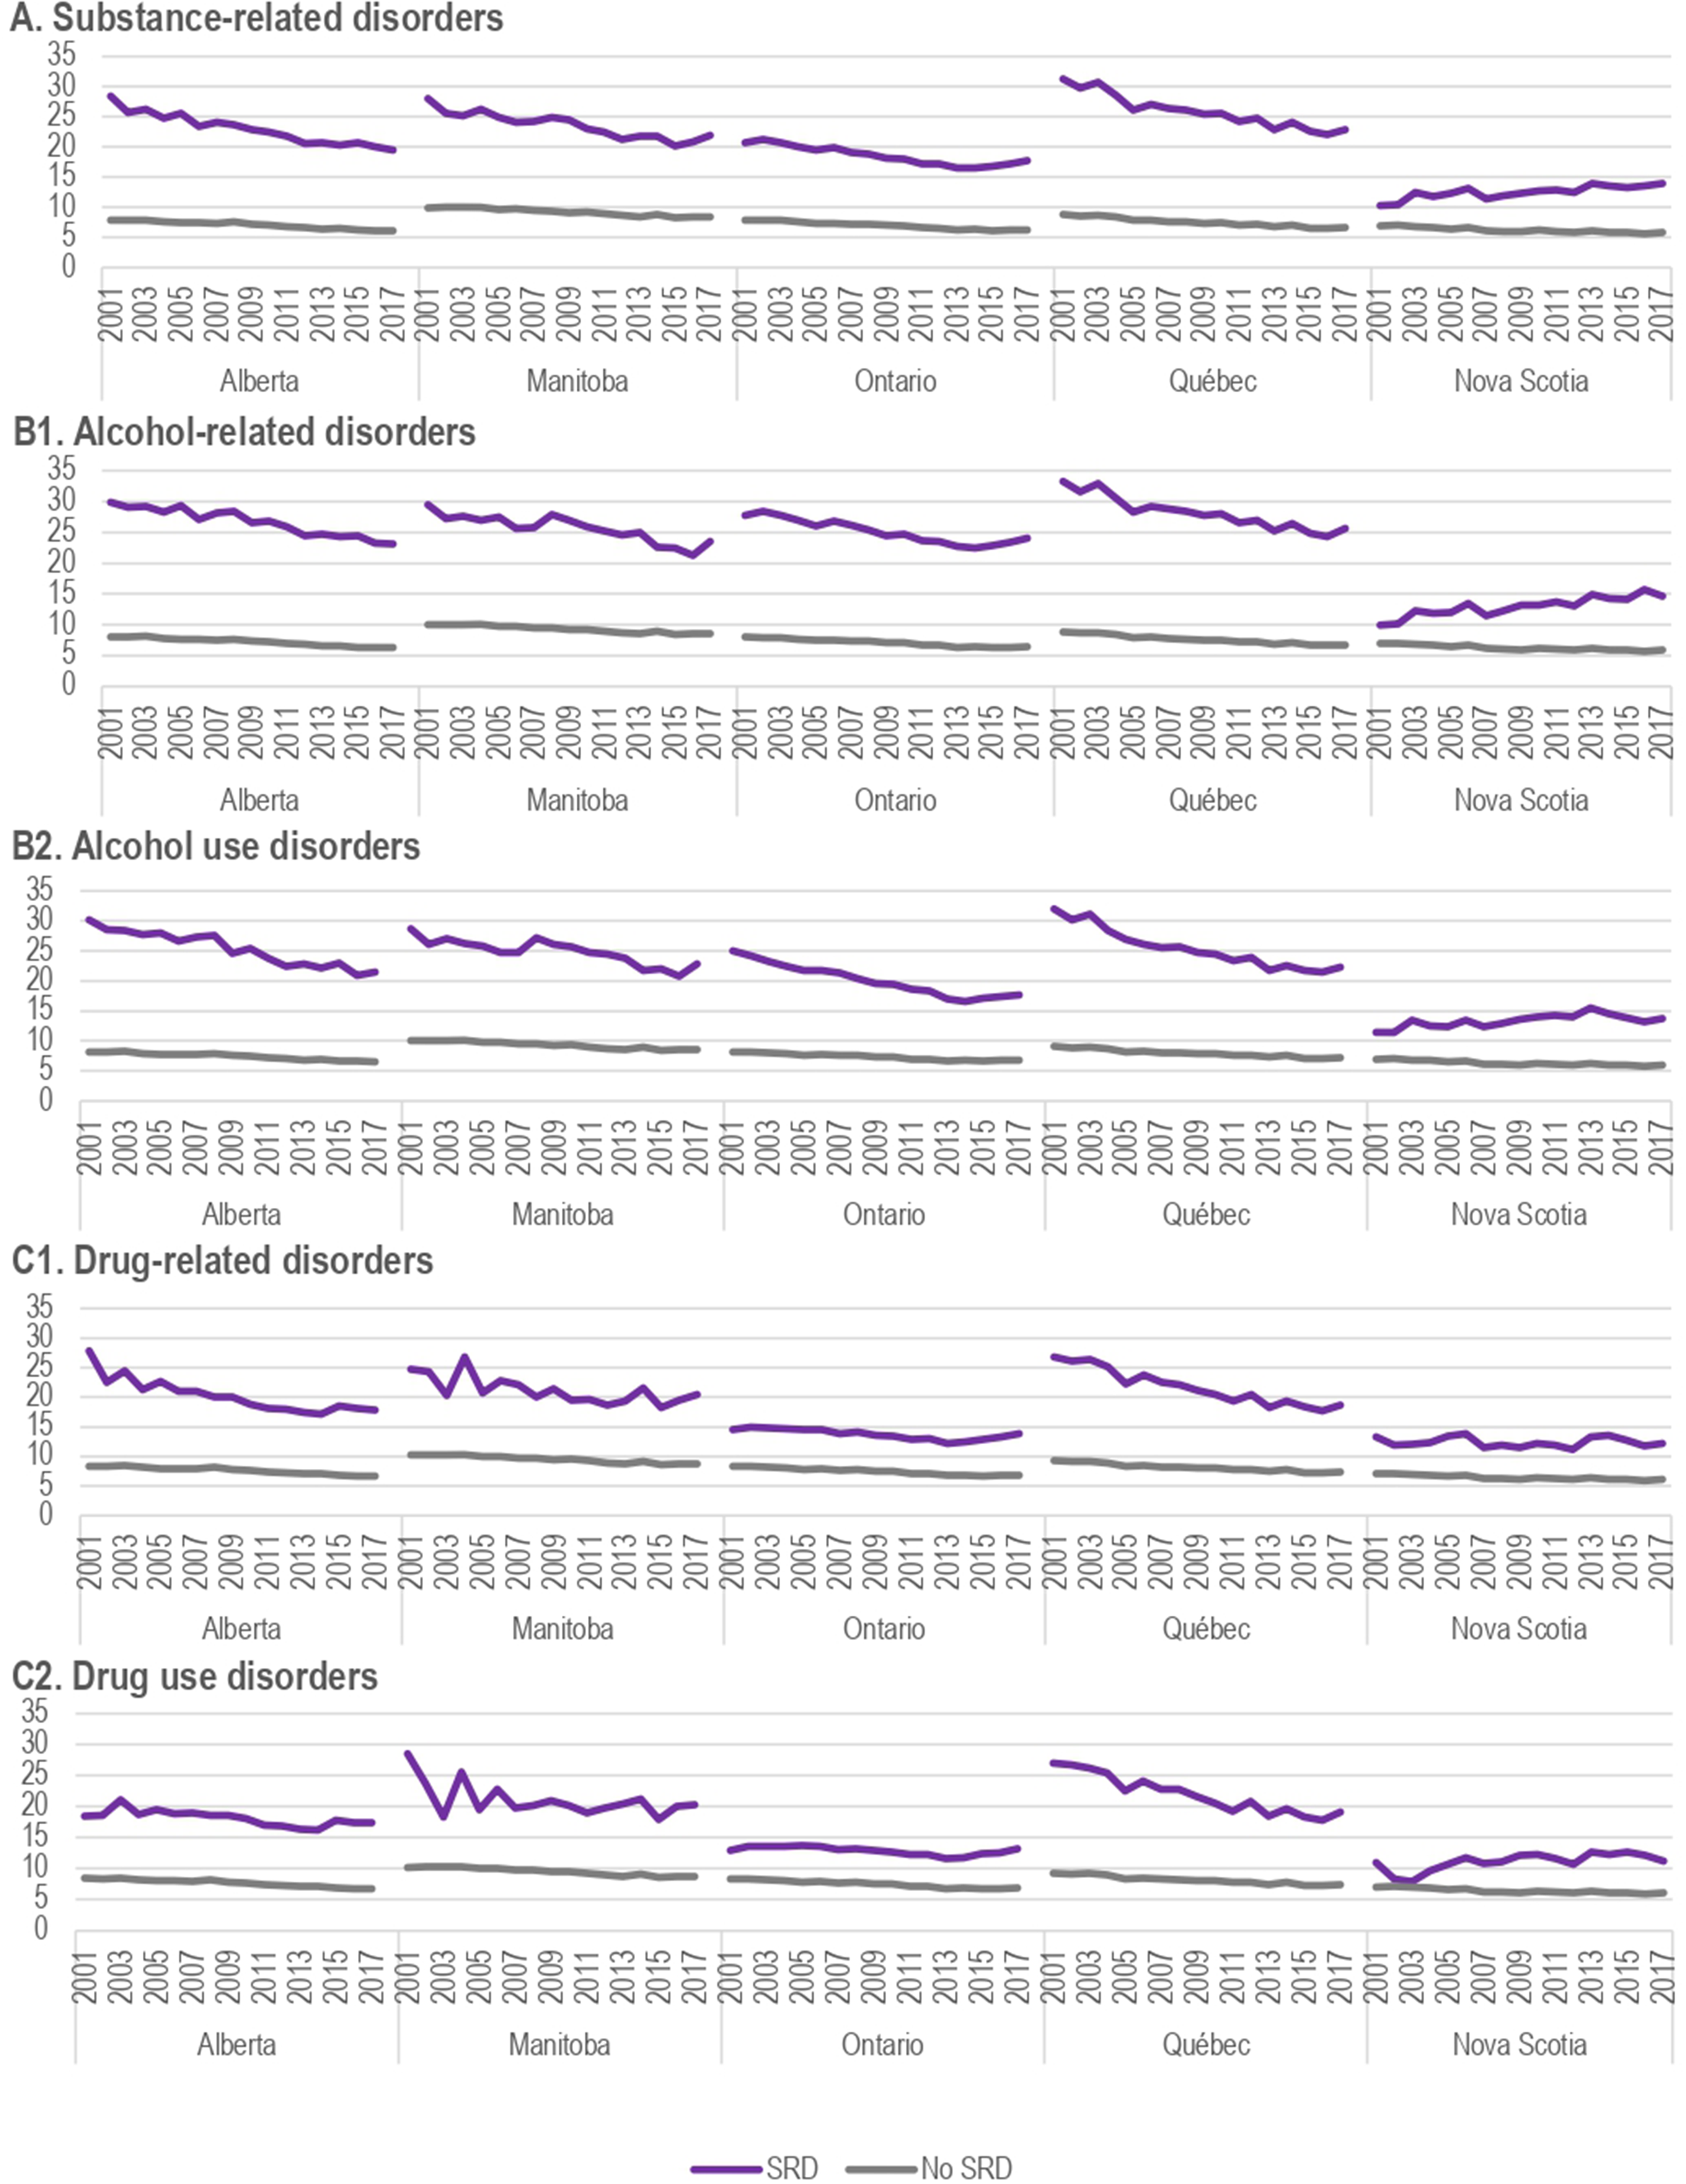
Annual mortality rates among cumulative cases. (A) Substance-related disorders. (B1) Alcohol-related disorders. (B2) Alcohol use disorders. (C1) Drug-related disorders. (C2) Drug use disorders.
Interprovincial comparisons of MRR by causes of death in 2015–2016 are presented in Table 2. In Alberta, Ontario, and Québec, individuals with a recorded diagnosis of SRD had a significantly higher MRR for all causes of deaths compared to those without SRD. Findings were similar in Manitoba, except for diseases of the nervous system, where no difference was detected between the two groups. In these four provinces, SRD was the cause of death with the highest mortality gap. Suicide, other trauma, and diseases of the digestive system were also among the causes of death with the highest MRR among individuals with recorded SRD. In Nova Scotia, higher MRR was found for diseases of the digestive system and other causes not classified elsewhere while significantly lower MRR was reported for neoplasms, infectious and parasitic diseases, as well as diseases of the nervous system.
Age-Adjusted Mortality Rate Ratios by Cause of Death among Cumulative Cases, 2015-2016.
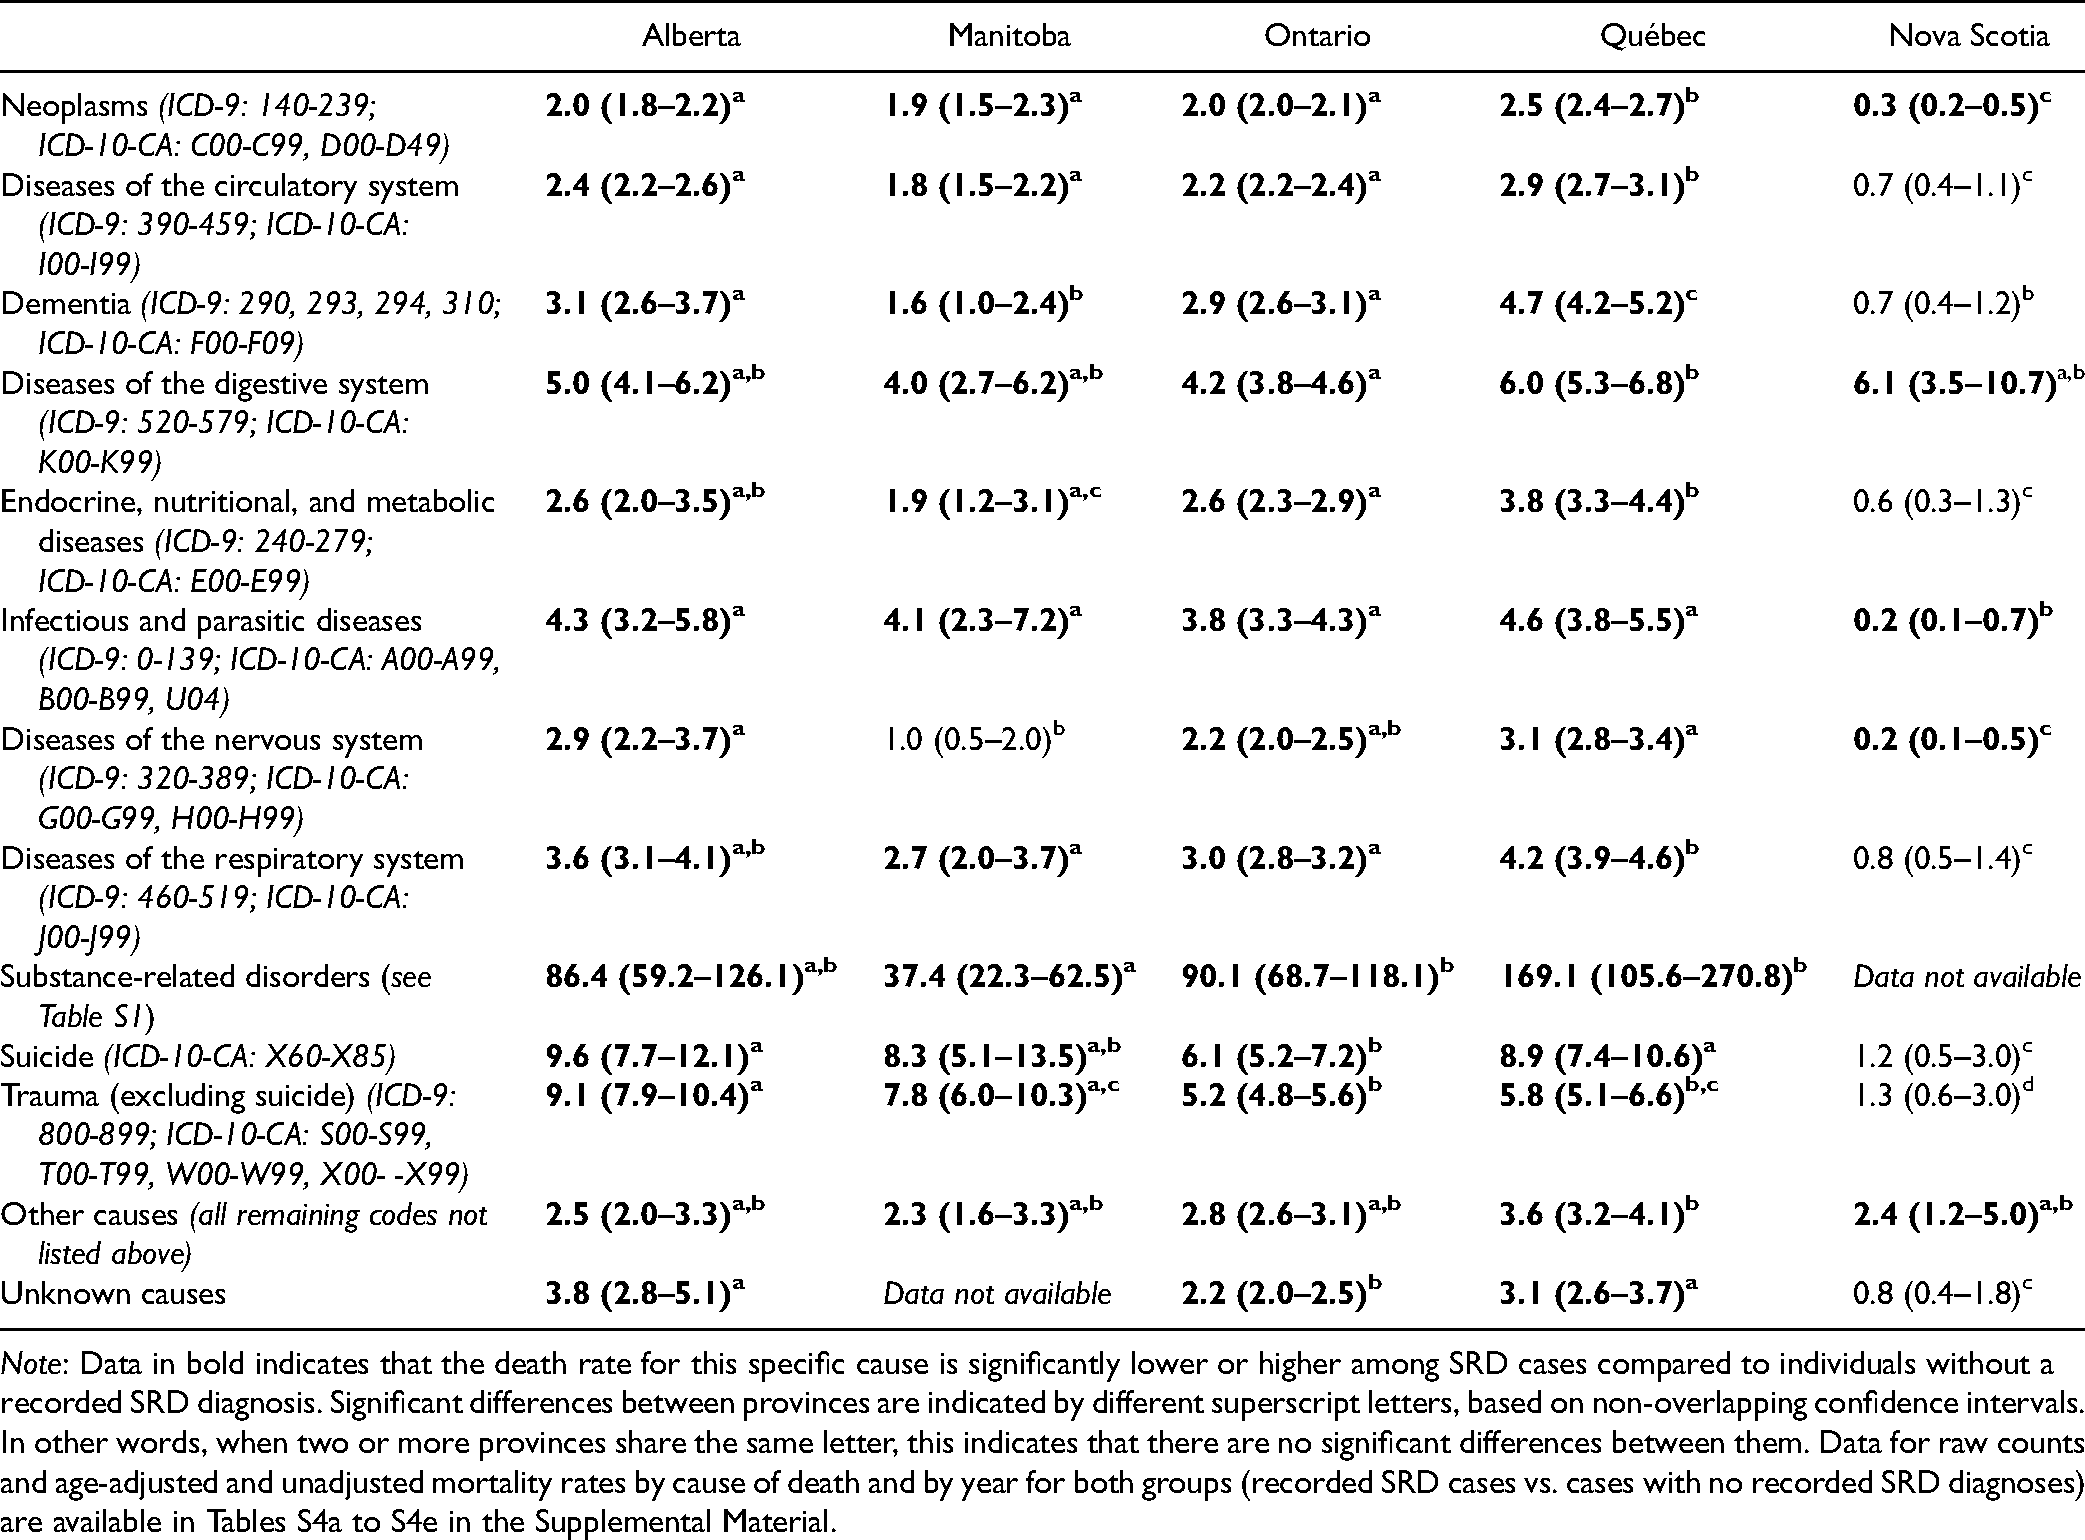
Note: Data in bold indicates that the death rate for this specific cause is significantly lower or higher among SRD cases compared to individuals without a recorded SRD diagnosis. Significant differences between provinces are indicated by different superscript letters, based on non-overlapping confidence intervals. In other words, when two or more provinces share the same letter, this indicates that there are no significant differences between them. Data for raw counts and age-adjusted and unadjusted mortality rates by cause of death and by year for both groups (recorded SRD cases vs. cases with no recorded SRD diagnoses) are available in Tables S4a to S4e in the Supplemental Material.
Discussion
Changes in substance use patterns following legislation (e.g., cannabis legalization), changes in treatment modalities, and the emergence of substance-related (e.g., opioid crisis) and non-substance-related (COVID-19 pandemic) occurrences necessitate the need to track health service utilization for SRD. In combination with other data sources such as epidemiological surveys, monitoring these trends may therefore inform service provision and risk factors for preventable mortality help health services better match availability and access to service with needs. These could be included in a Canadian Chronic Disease Surveillance System and may have implications for other countries with a similar linked AHD.
Given the public health focus, we used a broad definition of SRD rather than specific diagnoses. Broad categories also increased measurement accuracy by reducing the risk of errors and variability arising from AHD, for example, the use of a broad indicator such as “alcohol-related disorder” increased the chances a person would receive the same ICD code if two different physicians were doing the examination. If fine-grained analyses were performed, one physician might code for “alcohol acute intoxication,” while another for “alcohol dependence,” depending on whether the focus is on immediate care or the underlying condition. Overall annual recorded rates of SRD increased from 2001–2002 to 2017–2018 in Alberta, Ontario, and Nova Scotia, but remained stable in Manitoba and Québec. Like previous studies, emergency department visits related to SRD increased over time in Alberta or to alcohol problems in Ontario.34,35 Currently, Canadian epidemiological data on SRD cannot be used to provide consistent temporal trend information as the relevant surveys use different methodologies to assess substance abuse and dependence. 36 Our results thus provide relatively consistent data across time on the recorded diagnosis of SRD in five Canadian provinces.
In all provinces, the annual recorded rates of SRD were lower than self-reported SUD diagnoses in the Canadian 2012 epidemiological survey on addiction and mental disorders. 11 Epidemiological surveys aim to quantify the prevalence of SRD in the general population, while our data report on the rates of recorded SRD in the public medical system. Not everyone who meets diagnostic criteria for SRD will have immediate contact with medical services, and the interval may vary between provinces. This is particularly relevant for estimates of annual rather than cumulative prevalence. In addition, they may not present to services at all. For instance, according to the 2012 Canadian Community Health Survey - Mental Health (CCHS), only 17.2% of individuals with a single SUD diagnosis and 62.3% with comorbid mood/anxiety disorders had used professional mental health and addiction services in the previous year. Cumulative recorded SRD diagnostic rates also have the advantage of capturing long-term consequences such as cirrhosis or mortality. Cumulative recorded rates can, however, overestimate the long-term burden of diagnosed SRD, because individuals whose SRD has resolved will remain counted. On the other hand, up to 54% of individuals with SRD will be considered as “remitted” after an average follow-up period of 17 years. 37 Importantly, this overestimation is also inherent in the definition of lifetime prevalence, which includes individuals who also no longer fit the case definition.
These descriptive rates are not sufficiently informative to quantify the current disease burden of SRD. However, the data remain useful as they record annual and cumulative SRD diagnoses by physicians, mainly general practitioners. The annual recorded SRD diagnostic rates confirm epidemiological findings that SRD are under-detected and under-treated in primary care. Policies that would support better detection, patient engagement, and treatment at the primary care level in collaboration (and support) with specialist addiction services, could result in higher annual recorded SRD diagnoses, and possibly a lower eventual mortality gap.
This study also shows divergent rates and patterns across the five provinces. This observation was also reported in another study of hospitalizations related to alcohol in 2015–2016. 38 Many factors can explain these interprovincial variations: sociodemographic and socioeconomic composition of the population, different access to psychoactive substances, degree of implementation of various substance prevention programs, as well as availability and access to adequate health and psychosocial interventions. 39 Provision of harm reduction strategies such as needle exchange programs and supervised injection sites also vary. 40
The apparent decrease in mortality over time within the SRD population may be surprising in light of the opioid crisis. However, this obscures the annual increase in raw numbers of deaths within the SRD population and is explained by the greater increase in cumulative recorded rates of SRD when compared to annual deaths. The MMRs reported in this study were consistent with findings from the United States, 41 Denmark, 18 and Norway, 38 where accidents, injuries, overdoses, suicides, or homicides were the main causes of death among individuals with SRD, all of which were preventable. These deaths may have lowered the cancer MRR among individuals with SRD, as fatal trauma, suicide, and lethal overdose preceded any cancer diagnosis. Otherwise, the decline in mortality rate in the general population over the years was expected and had been previously explained to higher life expectancies due to better management of neoplasms and cardiovascular diseases in Canada. 42
Limitations
This study presents some limitations that need consideration when interpreting the results. First, AHD was originally conceived for administrative purposes, not for answering research questions. 43 Variables (e.g., socioeconomic status, ethnicity, quality of life, and psychosocial characteristics) that may be relevant for research objectives were not always available. Second, coding accuracy even for recorded diagnoses can potentially be impeded by clerical errors, limited coding possibilities (e.g., number of diagnoses that be recorded, level of precision of a given code [diagnostic clustering], etc.), diagnostic misclassification by physicians or coders, and omission because it was perceived as irrelevant for administrative purposes.43,44 Third, only the primary diagnosis is recorded in the physician's claim database in several provinces. If the main reason for consultation was not SRD, this diagnosis will not be recorded. Fourth, we mainly identified individuals who saw a physician remunerated using a service-for-fee system, but not individuals who only consulted physicians receiving alternative forms of payment or who attended exclusively addiction rehabilitation centres, community organizations, or psychosocial services. However, there is a high probability that an individual with an SRD will end up using billable medical services given the diverse health consequences of these conditions.45,46 The addition of existing databases on psychosocial services would allow better coverage of the SRD treated population. Future research should look at developing surveillance systems for specific communities (inmates, non-permanent residents, etc.) that are both adapted to their needs and can be incorporated into the larger Canadian surveillance system. Fifth, interprovincial variations in SRD definition, data availability, and coding practices limit the scope for comparing claims, hospitalizations, and vital statistics. For example, the extremely divergent MMRs in Nova Scotia compared to the four other provinces, suggest different procedures in recording mortality data, rather than a real variation in mortality pattern. To allow future interprovincial comparisons, standardized coding procedures should be considered. Nonetheless, because the purpose of public health surveillance is to make broad comparisons and identify high-level problems, information on general and global trends is preferred to fine-grained details.
Finally, rates were only obtained in five out of ten provinces and did not include the territories. However, the five provinces in this analysis represent 79% of the Canadian population. Linked AHD also has some strengths over other methodologies in that they allow long-term follow-up of cohorts with negligible attrition and give information on co-morbidities, medical treatments, and outcomes such as trauma. Recording bias is minimized because the provision of billing data is required for physician payment.
Conclusion
The ongoing opioid crisis and the legalization of cannabis in Canada, the United States, and elsewhere have led to increasing awareness of the need for data to inform health care about detection and treatment of SRD, including alcohol and other drugs. In both the United States and Canada, there is growing interest in establishing a national surveillance system for mental disorders and SRD. 47 Surveillance of SRD can be developed in Canada and ultimately help to prevent and control the associated burden. This study demonstrates that provincial data sources allow for monitoring SRD because they do capture the detection and treatment patterns of patients and thus have the potential to evaluate the impact of policies on health outcomes, such as mortality gaps. Analyses of temporal trends of services utilization, interventions, and health outcomes would allow assessing the impact of preventive measures that will increase greater awareness, detection, and treatment of SRD in jurisdictions where relevant linked AHD are available.
Supplemental Material
sj-docx-1-cpa-10.1177_07067437211043446 - Supplemental material for Measuring Substance-Related Disorders Using Canadian Administrative Health Databanks: Interprovincial Comparisons of Recorded Diagnostic Rates, Incidence Proportions and Mortality Rate Ratios
Supplemental material, sj-docx-1-cpa-10.1177_07067437211043446 for Measuring Substance-Related Disorders Using Canadian Administrative Health Databanks: Interprovincial Comparisons of Recorded Diagnostic Rates, Incidence Proportions and Mortality Rate Ratios by Christophe Huỳnh, Steve Kisely, Louis Rochette, Éric Pelletier, Kenneth B. Morrison, Shelley Li, Gareth Hopkin, Mark Smith, Charles Burchill, Elizabeth Lin, Mark Asbridge, Didier Jutras-Aswad and Alain Lesage in The Canadian Journal of Psychiatry
Footnotes
Acknowledgments
The authors thank Victoria Massamba, Simon Chen, Abigail Amartey, Kinwah Fung, and Sima Gandhi for their contribution to this study. The authors acknowledge the Manitoba Centre for Health Policy for use of data contained in the Manitoba Population Research Data Repository (HIPC#2018/2019-52). DJA holds a clinical scientist career award from the Fonds de Recherche du Québec (FRQS). Gareth Hopkin has previously worked at the Institute of Health Economics and has received grants from the Government of Alberta outside of the submitted work. The authors acknowledge the support of the Quebec Network on Suicide, Mood Disorders, and Associated Disorders through their services and public health platform.
Authors Note
The data provided by the different health jurisdictions cannot be publicly shared, because they contain confidential information. Individuals can potentially be re-identified through data triangulation if they present sufficient specific or unique sociodemographic and health characteristics. The results and conclusions are those of the authors and no official endorsement by the Manitoba Centre for Health Policy, Manitoba Health, or Manitoba Vital Statistics is intended or should be inferred. Data used in this study are from the Manitoba Population Research Data Repository housed at the Manitoba Centre for Health Policy, University of Manitoba, and were derived from data provided by Manitoba Health and Manitoba Vital Statistics. This study is based in part on data provided by Alberta Health. The interpretation and conclusions contained herein are those of the researchers and do not represent the views of the Government of Alberta. The Government of Alberta does not express any opinion in relation to this study.
Declaration of Conflicting Interests
The authors declared no potential conflicts of interest with respect to the research, authorship, and/or publication of this article.
Funding
The authors disclosed receipt of the following financial support for the research, authorship, and/or publication of this article: This work was supported by Health Canada’s Substance Use and Addiction Program.
Supplemental Material
Supplemental material for this article is available online.
References
Supplementary Material
Please find the following supplemental material available below.
For Open Access articles published under a Creative Commons License, all supplemental material carries the same license as the article it is associated with.
For non-Open Access articles published, all supplemental material carries a non-exclusive license, and permission requests for re-use of supplemental material or any part of supplemental material shall be sent directly to the copyright owner as specified in the copyright notice associated with the article.