
Abstract
Objective:
To document the rates of intentional self-harm and mental disorders among youths aged 13 to 17 years visiting Ontario emergency departments (EDs) from 2003-2017.
Methods:
This was a repeated cross-sectional observational design. Outcomes were rates of adolescents with (1) at least 1 self-harm ED visit and (2) a visit with a mental disorder code.
Results:
Rates of youths with self-harm visits fell 32% from 2.6/1000 in 2003 to 1.8 in 2009 but rose 135% to 4.2 by 2017. The slope of the trend in self-harm visits changed from –0.18 youths/1000/year (confidence interval [CI], –0.24 to –0.13) during 2003 to 2009 to 0.31 youths/1000/year (CI, 0.27 to 0.35) during 2009 to 2017 (P < 0.001). Rates of youths with mental health visits rose from 11.7/1000 in 2003 to 13.5 in 2009 (15%) and to 24.1 (78%) by 2017. The slope of mental health visits changed from 0.22 youths/1000/year (CI, 0.02 to 0.42) during 2003 to 2009 to 1.84 youths/1000/year (CI, 1.38 to 2.30) in 2009 to 2017 (P < 0.001). Females were more likely to have self-harm (P < 0.001) and mental health visits (P < 0.001). Rates of increase after 2009 were greater for females for both self-harm (P < 0.001) and mental health (P < 0.001).
Conclusions:
Rates of adolescents with self-harm and mental health ED visits have increased since 2009, with greater increases among females. Research is required on the determinants of adolescents’ self-harm and mental health ED visits and how they can be addressed in that setting. Sufficient treatment resources must be supplied to address increased demands for services.
Background
Self-harm is the deliberate attempt to injure oneself, regardless of intent. 1 Adolescents who self-harm are at risk for repeated self-harm or suicide. 2 –6 Adolescent emergency department (ED) visits with self-harm have been increasing in recent years in many jurisdictions, 7 –9 including Canada. 10 ED visits by adolescents for mental disorders have likewise been increasing in many countries, 11 –14 including Canada. 15,16 The increasing numbers of adolescents who access the ED following self-harm or for mental disorders are of concern because the ED is not an ideal setting for delivery of mental health care or for care of adolescents who have self-harmed. Studying population trends in visits for self-harm or mental disorders is also important because fluctuations in these trends may reflect significant changes in the social conditions affecting adolescent health and may provide direction for targeted interventions.
Hence, the objectives of this study were to examine temporal trends in rates of youths having self-harm and mental health ED visits in Ontario, a large Canadian province with centralized administrative records of all ED visits. Because sex effects are pronounced in adolescent self-harm 17,18 and mental health, 19 for both objectives, we fit models that permitted us to identify sex and sex by time effects.
Method
Study Design, Setting, and Participants
This is a repeated annual cross-sectional study of Ontario ED visits by youths aged 13 to 17 years (inclusive) between 2003 and 2017. We chose this age range because it falls clearly in adolescence, the period in which self-harming behaviors are believed to be the most common. 20 In a previous Canadian study of self-harm, 21 the mean age of onset of self-harm was 15.2 years. Participants were all such adolescents with an Ontario Health Insurance Plan number presenting to a provincial ED. This research was approved by the Children’s Hospital of Eastern Ontario Research Ethics Board.
Variables and Data Sources
Data on ED visits were obtained from the Canadian National Ambulatory Care Reporting System (NACRS) database from the Canadian Institute for Health Information, using the International Classification of Diseases, 10th Revision (ICD-10). 22 The data were accessed through health administrative databases at ICES (Toronto, Ontario). NACRS records are produced by coders who abstract the documentation generated by ED clinicians. 23 These records are subject to several forms of error, including inaccurate or incomplete documentation of problems by physicians and errors in coding and abstraction of data from clinical records. Gibson and her colleagues 23 studied the quality of NACRS data by carrying out reabstractions of charts at several Ontario EDs and found agreement rates for ICD-10 codes that ranged from 86% to 90%. Chart review studies indicate that some injuries and poisonings that are coded as having an undetermined cause are actually instances of intentional self-harm. 24,25 Moreover, NACRS coders may record only the main diagnostic code that led to the ED visit, meaning that a mental health disorder or a self-injury might be omitted if another medical problem took precedence. This means that estimates of the prevalence of diagnoses in the ED setting are likely biased downwards.
The Registered Persons Database was used to link ED youth records with demographic information including age, sex, rurality, neighborhood income quintile, and postal code. The Ontario population by year, age, and sex was obtained from the intercensal and postcensal population estimates for census divisions by Statistics Canada held by the Ontario Ministry of Health and Long-Term Care. These data sets were linked using unique encoded identifiers and analyzed at ICES.
In this study, self-harm visits had ICD-10 codes X7 or X80-X84 (self-injuries) or X6 (self-poisoning). Mental health visits had any ICD-10 F code.
Statistical Methods
Rates of youths with self-harm and mental health ED visits were calculated per 1000 adolescents in the population. For example, the dependent variable of rates of youths with at least 1 self-harm visit in year t was calculated for the years 2003 through 2017 as follows:
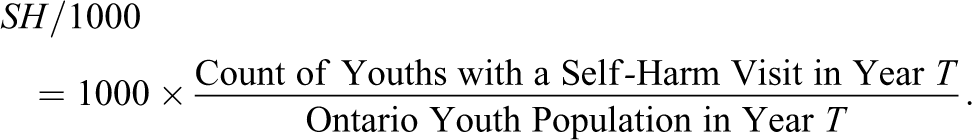
Rates of mental health visits were defined similarly.
Exploratory data analyses suggested that the trends in self-harm and mental health visits changed slope on or around 2009. To model this, we created 2 time variables:
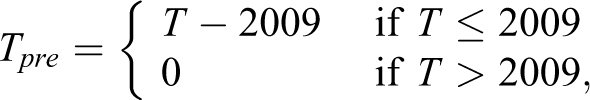
and
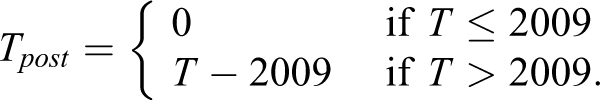
Models were fit using R 3.5.1. 27 All confidence intervals are 95%, and all P values are 2-tailed.
Results
Participants
From 2003 to 2017, an average of 190,384 (SD = 4662) Ontario adolescents visited Ontario EDs in a given year. Table 1 reports demographic characteristics for adolescents who had or did not have a self-harm visit in the years 2003, 2009, and 2017. Table 2 presents demographic characteristics for adolescents who had or did not have a mental health visit.
Ontario Adolescents with a Self-Harm Emergency Department (ED) Visit.
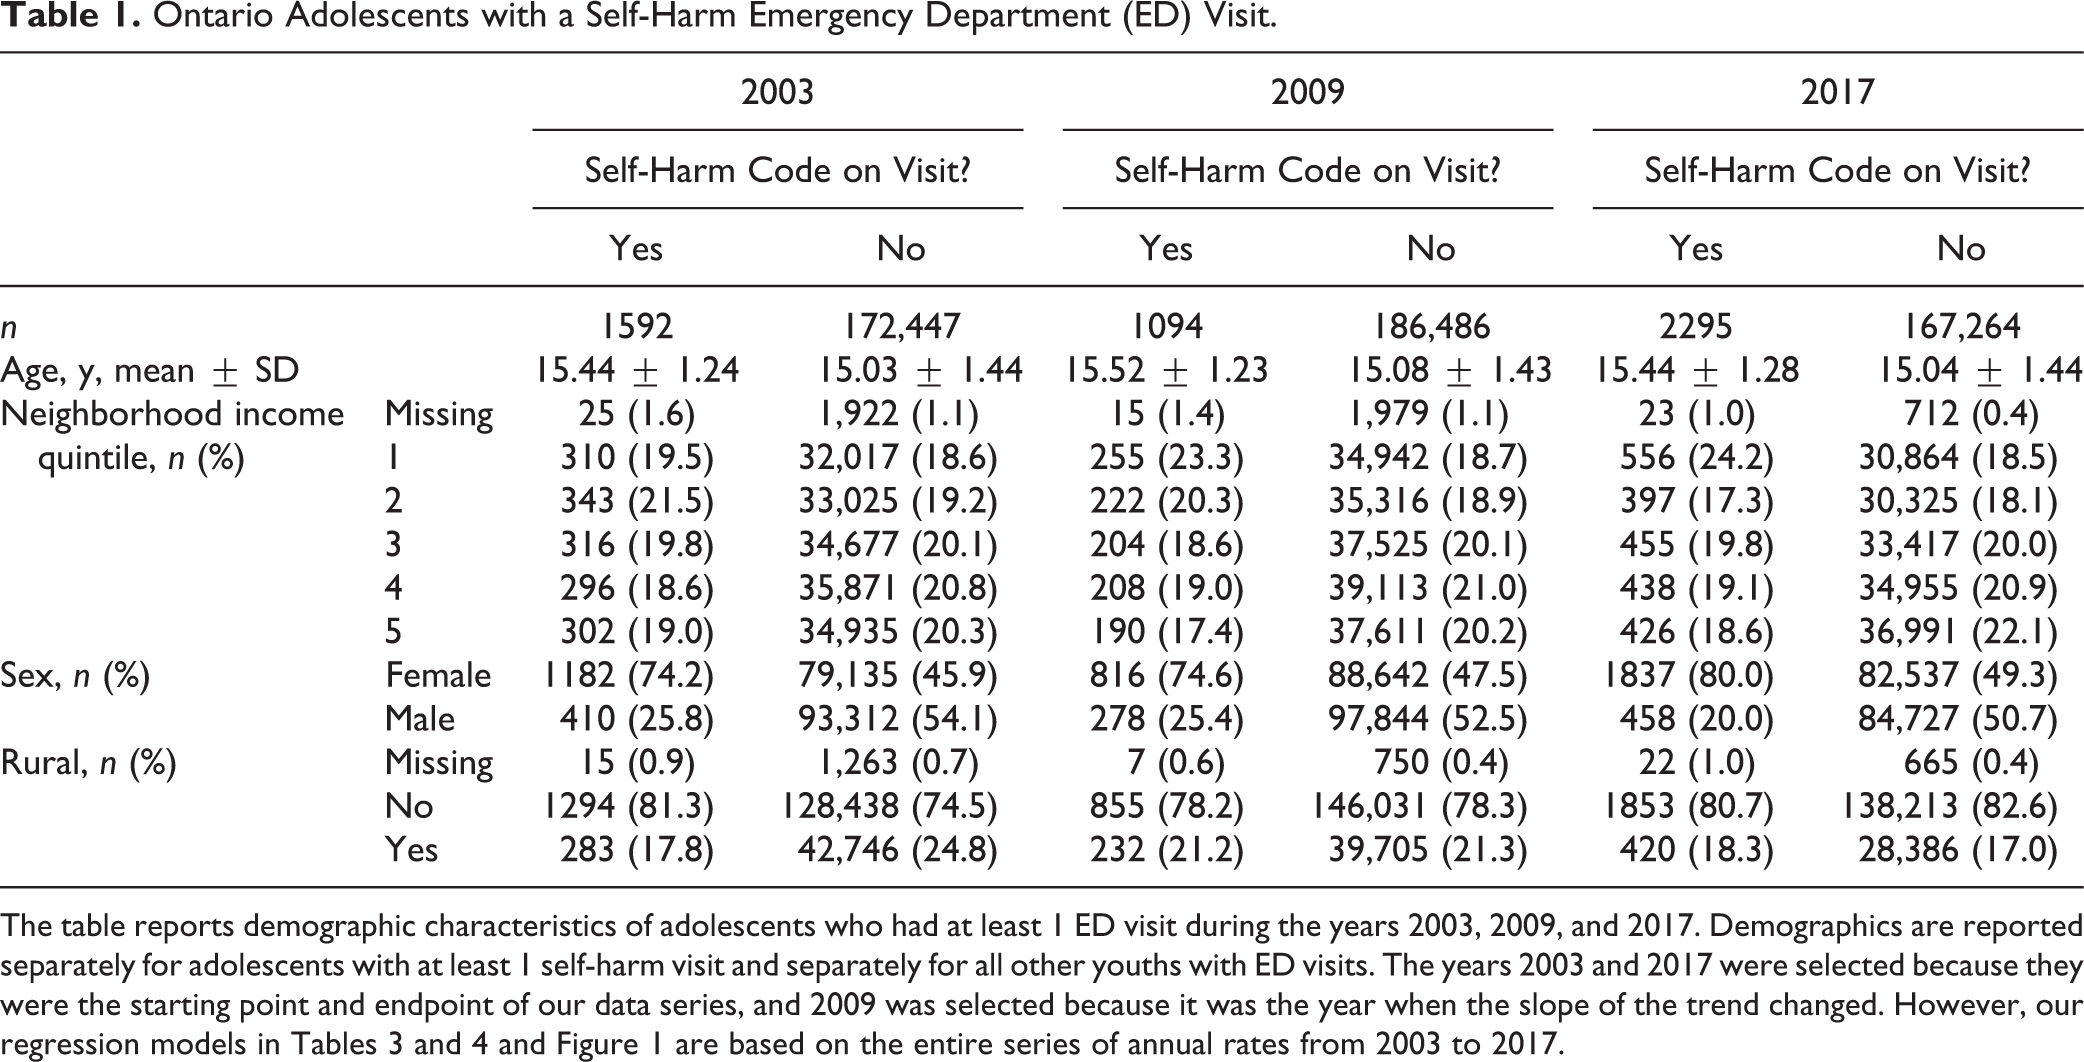
The table reports demographic characteristics of adolescents who had at least 1 ED visit during the years 2003, 2009, and 2017. Demographics are reported separately for adolescents with at least 1 self-harm visit and separately for all other youths with ED visits. The years 2003 and 2017 were selected because they were the starting point and endpoint of our data series, and 2009 was selected because it was the year when the slope of the trend changed. However, our regression models in Tables 3 and 4 and Figure 1 are based on the entire series of annual rates from 2003 to 2017.
Ontario Adolescents with a Mental Health Emergency Department (ED) Visit.
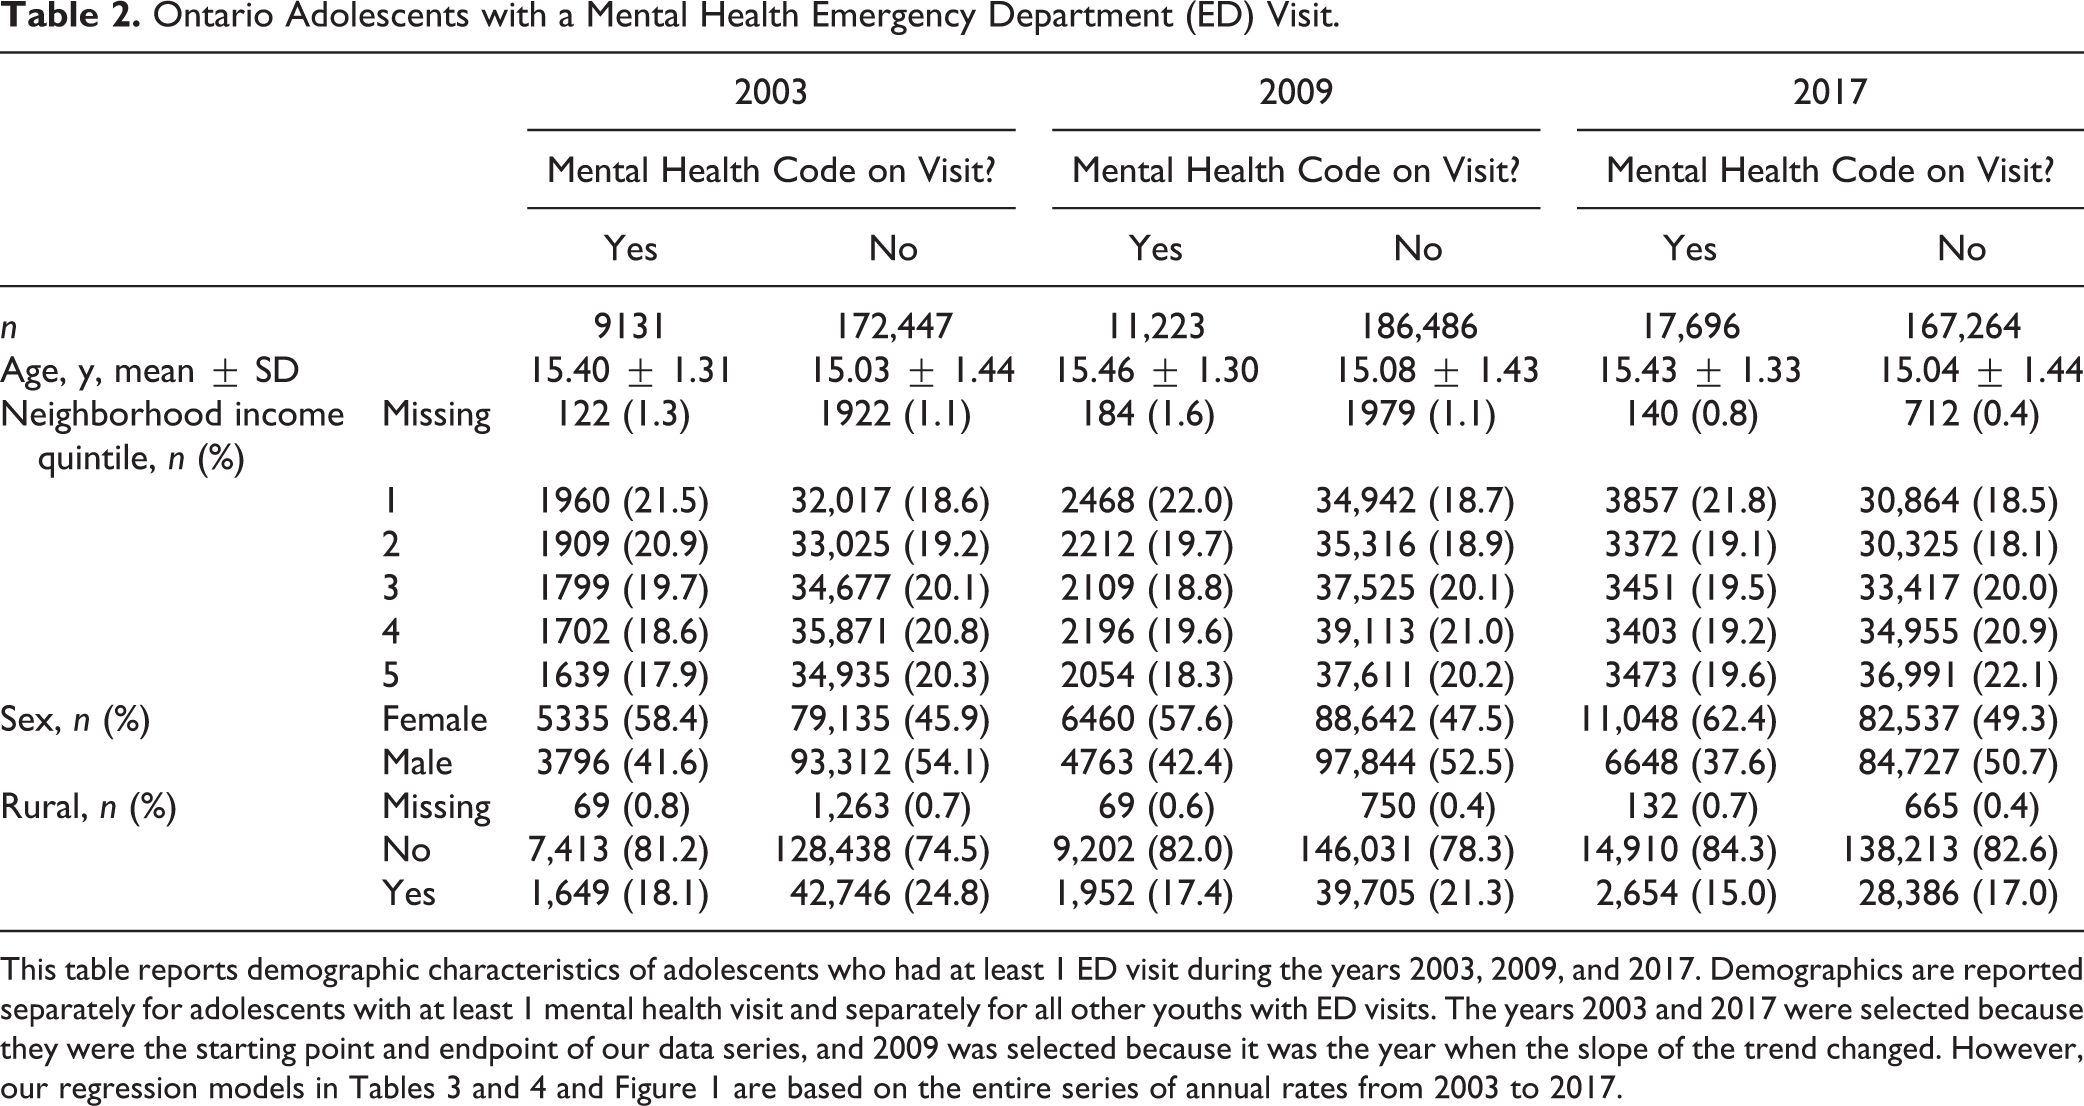
This table reports demographic characteristics of adolescents who had at least 1 ED visit during the years 2003, 2009, and 2017. Demographics are reported separately for adolescents with at least 1 mental health visit and separately for all other youths with ED visits. The years 2003 and 2017 were selected because they were the starting point and endpoint of our data series, and 2009 was selected because it was the year when the slope of the trend changed. However, our regression models in Tables 3 and 4 and Figure 1 are based on the entire series of annual rates from 2003 to 2017.
Self-Harm Visit Rates
Figure 1A shows the trends for rates of adolescents having at least 1 self-harm ED visit. From 2003 to 2017, in an average year, 2.7 adolescents/1000 had an ED visit with intentional self-harm (CI, 2.1 to 3.5). Rates of youths with self-harm visits fell 32% from 2.6/1000 youths in 2003 to 1.8/1000 youths in 2009 and then rose 135% to 4.2/1000 youths from 2009 to 2017. The “All Youths” column in Table 3 presents the results of a regression discontinuity model fit to these data. From 2003 to 2009, the rate of adolescents with self-harm visits declined by –0.18 youths/1000/year (CI, –0.24 to –0.13), whereas from 2009 to 2017, they rose by 0.31 youths/1000/year (CI, 0.27 to 0.35). The change in the slope at 2009 was 0.49 youths/1000/year2 (CI, 0.41 to 0.58; P < 0.001).
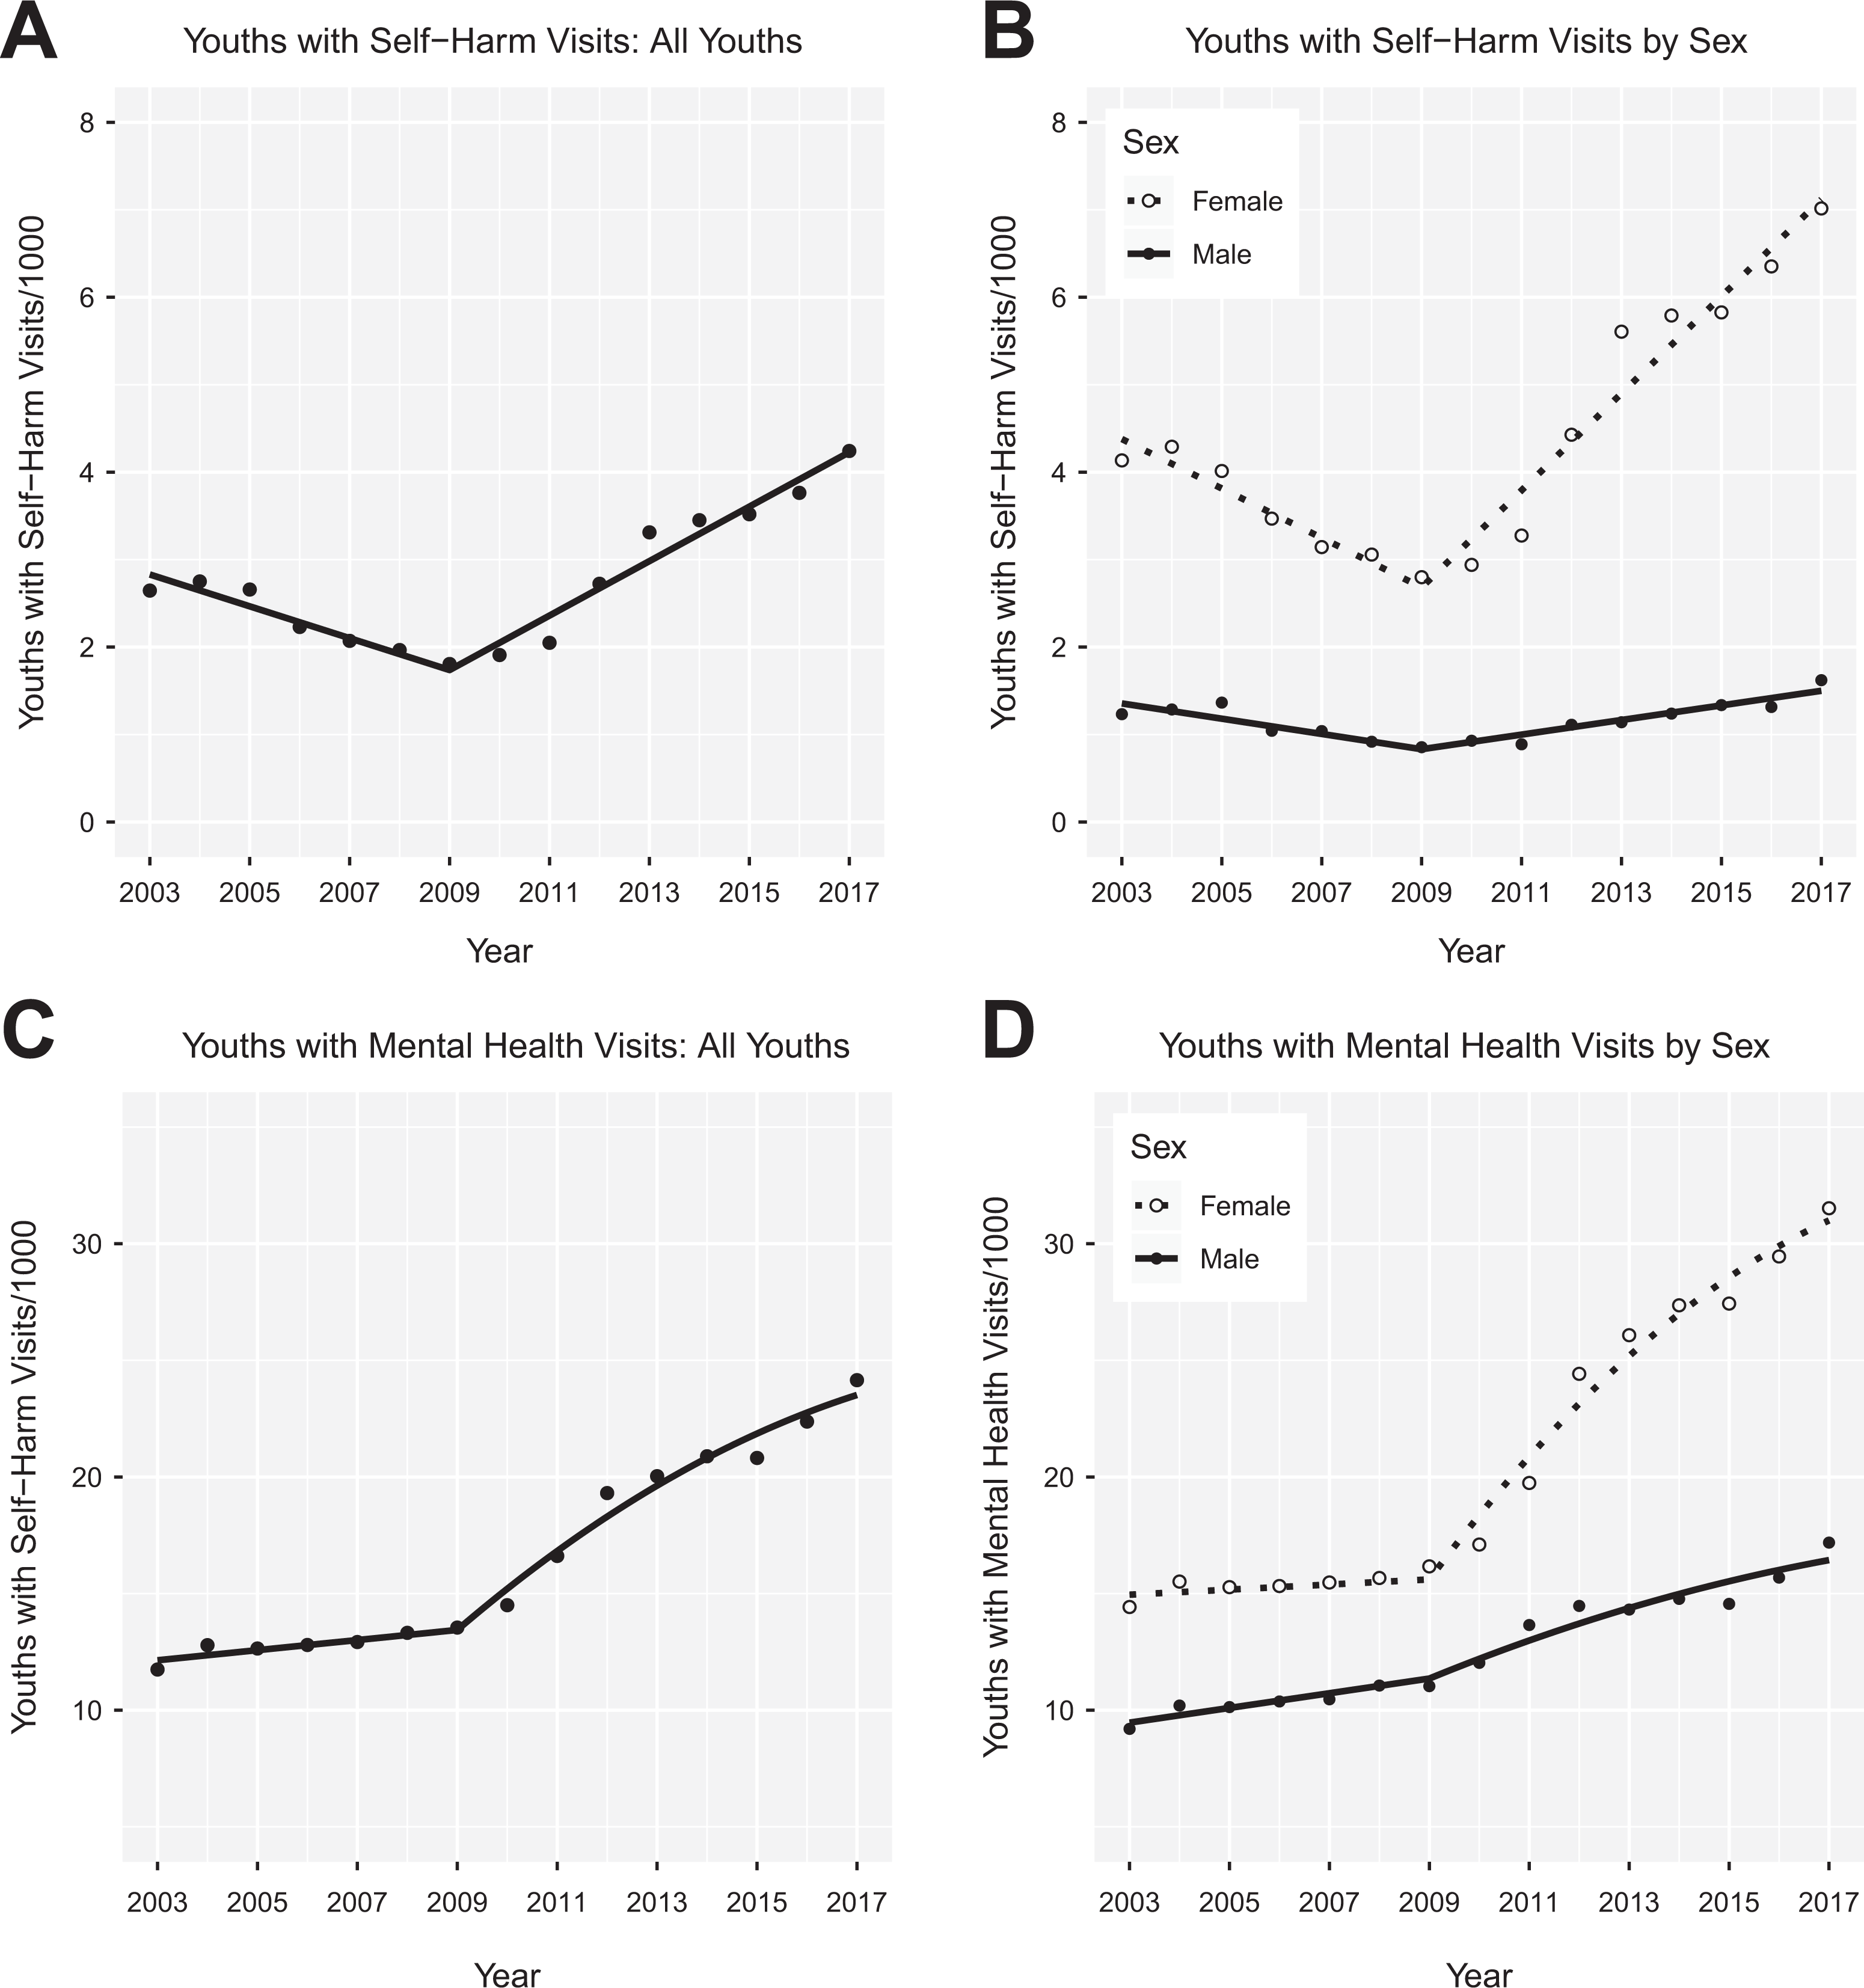
Rates of adolescents with self-harm emergency department (ED) visits: 2003 to 2017. (A) Rates of adolescents having a self-harm ED visit, per thousand adolescents in the population, as a function of time. The fitted lines are from the discontinuity regression reported in the “All Youths” columns of Table 3. (B) Rates of adolescents having a self-harm ED visit by sex. The fitted lines are from the regression reported in the “By Sex” columns of Table 3. (C) Rates of adolescents having a mental health ED visit. The fitted lines are from the regression reported in the “All Youths” columns of Table 4. A quadratic term is included in the regression model for mental health visits for year ≥2009. (D) Rates of adolescents having a self-harm ED visit by sex. The fitted lines are from the regression reported in the “By Sex” columns of Table 4.
Discontinuity Regressions for Rates of Youths with Self-Harm Visits.
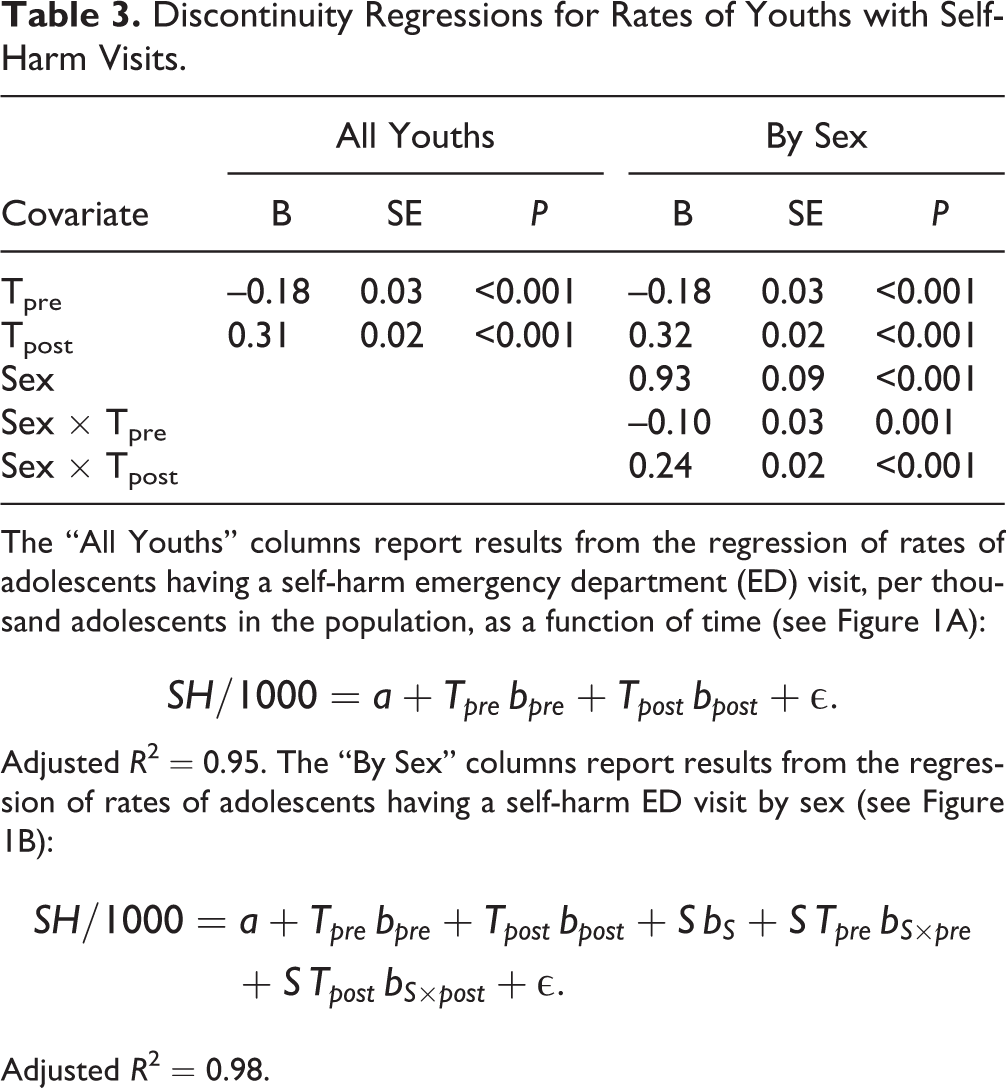
The “All Youths” columns report results from the regression of rates of adolescents having a self-harm emergency department (ED) visit, per thousand adolescents in the population, as a function of time (see Figure 1A):
Adjusted R
2 = 0.95. The “By Sex” columns report results from the regression of rates of adolescents having a self-harm ED visit by sex (see Figure 1B):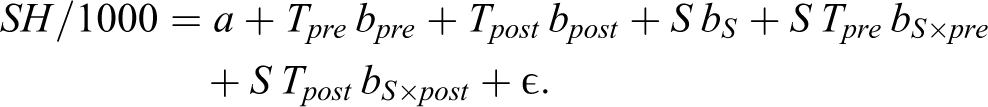
Adjusted R 2 = 0.98.
Figure 1B shows how the trends in youths with self-harm visits differed by sex. From 2003 to 2017, there were higher rates of females with at least 1 self-harm visit (mean = 4.4/1000; CI, 3.7 to 5.1) compared with males (mean = 1.2/1000; CI, 1.0 to 1.3). The difference between the rates of self-harm visits for females and males was smallest in 2009, when females had
Mental Health Visit Rates
In an average year, 16.6 adolescents/1000 had an ED visit with a mental health code (CI, 14.4 to 18.9). Rates of youths with mental health visits rose 15% from 11.7/1000 youths in 2003 to 13.5/1000 youths in 2009, then rose 78% to 24.1/1000 youths in 2017 (Figure 1C). For all adolescents, Table 4 shows that from 2003 to 2009, the rate of adolescents with mental visits increased by 0.22 youths/1000/year (CI, 0.02 to 0.42), whereas from 2009 to 2017, they rose by 1.84 youths/1000/year (CI, 1.38 to 2.30). The change in the slope at 2009 was 1.62 youths/1000/year2 (CI, 1.02 to 2.22; P < 0.001).
Discontinuity Regressions for Rates of Youths with Mental Health Visits.
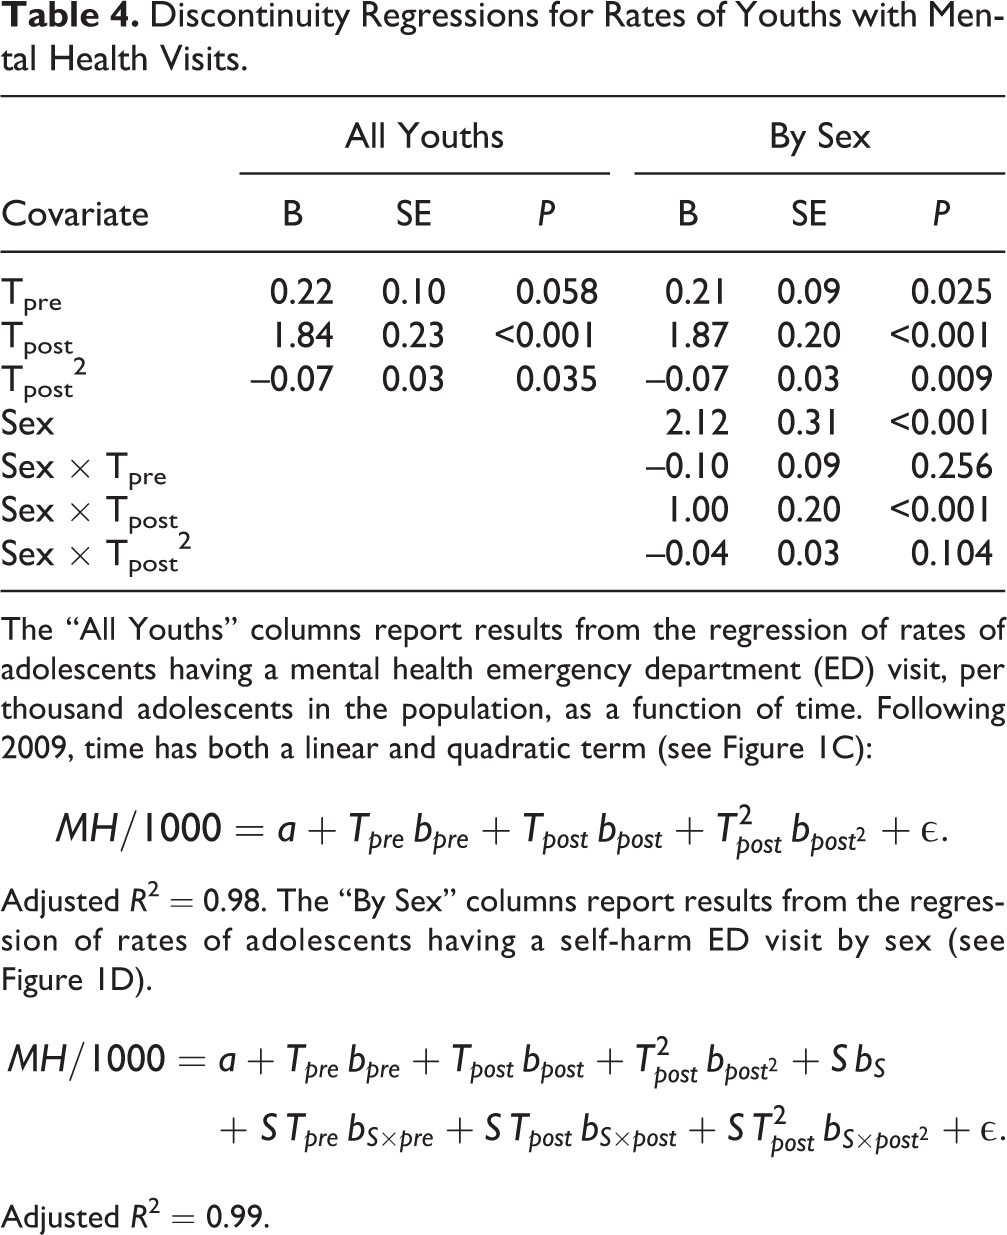
The “All Youths” columns report results from the regression of rates of adolescents having a mental health emergency department (ED) visit, per thousand adolescents in the population, as a function of time. Following 2009, time has both a linear and quadratic term (see Figure 1C):
Adjusted R
2 = 0.98. The “By Sex” columns report results from the regression of rates of adolescents having a self-harm ED visit by sex (see Figure 1D).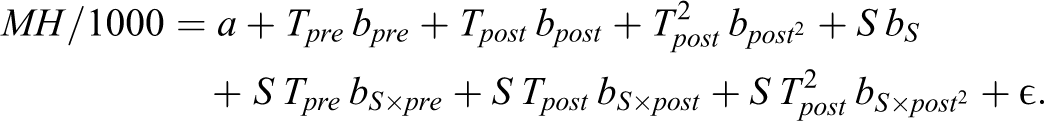
Adjusted R 2 = 0.99.
Figure 1D presents the rates of youths with self-harm visits by sex. From 2003 to 2017, rates of adolescents with at least 1 self-harm visit were higher for females (mean = 20.7/1000, CI, 17.5 to 24.0) than males (mean = 12.6/1000, CI, 11.3 to 13.9). The rates of females and males with mental health visits increased slowly (0.21 youths/1000/year; CI, 0.04 to 0.39; P = 0.025) and nearly in parallel before 2009 (i.e.,
Interpretation
This study examined parallel time series of rates of self-harm and mental health ED visits using methods that could identify discontinuous or nonlinear changes in rates of change, that is, accelerations or decelerations in rates. We found that from 2003 to 2009, rates of adolescents with self-harm visits declined for both sexes. Rates of adolescents with mental health visits increased only slightly. Starting in 2009, however, rates of adolescent ED visits for both self-harm and mental health concerns have increased rapidly in Ontario. These rates were higher and increased faster among females. These findings are consistent with extensive prior literature on adolescent ED visits for self-harm 2 –4,10 and mental health conceerns 11 –16 In particular, rates of suicidal attempts and suicidal ideation among US children and adolescents almost doubled over the period from 2007 to 2015. 28 Likewise, from 2011 to 2015, there was a 28% increase in psychiatric ED visits per 1000 youth in the United States. 29
So, what happened starting in 2009? Our data provide no evidence about this, but we see at least 2 non–mutually-exclusive explanations to be explored in future research. First, rates of self-harming behavior and mental disorders may have increased in the Ontario adolescent population. If more adolescents self-harmed or became mentally ill, then it is likely that more youths would visit the ED. There are 2 social factors starting about this time that might have increased the stress experienced by adolescents. On one hand, there might have been familial stress associated with the financial crisis of 2008. On the other hand, the iPhone first appeared in 2007, and the use of smartphones has increased greatly since that time. Engagement with social media could lead to increased rates of self-harm, at least for vulnerable adolescents, 30 in several ways: by normalizing it, by triggering it, by eliciting emulation of self-harming behaviors, or by exposing youths to cyber bullying. 31 –35 Conversely, social media may also benefit troubled adolescents by providing them with opportunities to mitigate social isolation and find encouragement for seeking treatment. 31,33,34,36,37
Second, independent of the population rates of self-harm and mental disorder, adolescents with these problems may have become more likely to visit the ED after 2009. Geulayov et al. 38 estimated that for each youth who presents at a hospital with self-harm, there are several hundred who self-harm but do not present. If so, even a small increase in the proportion of such youths who present at the ED would greatly increase rates of ED visits. There were intensive anti-stigma campaigns during this period. 39 These efforts to destigmatize mental illness might have helped adolescents seek care for mental health problems or helped families seek care for them, whether or not the adolescents sought it. 40,41 To the degree that increasing ED visits for these problems reflects increased care seeking for acute problems, the increased rate of youths visiting the ED could be viewed as positive, compared with the potential consequences of distressed youths not seeking care at all.
Implications
With these increasing rates of adolescents presenting to the ED for self-harm or mental disorders and the importance of ensuring they receive good care, we need to find better ways to connect adolescents to mental health and social services during or following their visit. 42 Possible solutions include integration of psychiatric emergency services into regional EDs 43 and/or better integration between ED and community mental health services. 44 Unfortunately, many hospitals do not have access to local mental health consultants, particularly in sparsely populated regions. 45,46 Therefore, some youths receive limited emergency mental health assessments and/or follow-up outpatient mental health care. 47 –49 This gap might be addressed by using videoconferencing technology to facilitate assessments in the ED setting by mental health specialists located in other settings. 50 Community mental health follow-up after self-harm has been associated with reduced likelihood of repeat self-harm, 51 but evidence on whether youths can be successfully connected to mental health services from the ED is mixed. 47,52,53 Efforts should be made to increase the supply and accessibility 42 of evidence-based treatments 54 –56 for adolescents who self-harm or have mental health problems and where possible to deliver these services to them before they present to the ED. The development and implementation of such intervention strategies should be informed by research on the specific care that youths with self-harm or mental health disorders received before, during, and following their presentations to the ED. Our results suggest that Ontario’s destigmatization campaigns may have succeeded in increasing adolescent ED access for self-harm and mental illness. This is a great accomplishment, but unfortunately, it is not clear that there was an adequate increase in mental health treatment capacities to accommodate the surge in adolescents presenting at EDs with self-harm or mental health disorders. Finally, the concurrence of the inflection points in both time series with the advent of internet-connected mobile devices should prompt increased research on the psychological impacts of social media.
Limitations
This was an observational study using administrative data, and it was subject to the weaknesses of such data. 57 Administrative records have limited information about many factors relevant to explaining self-harming behavior, including gender identification (as opposed to sex), sexual preference, fine-grained information about economic disadvantage, racial and ethnic affiliations, or scores on validated measures of mental disorders. Coders have less than perfect agreement in assigning ICD-10 codes to ED visits, and they likely undercount the prevalence of some problems. Likewise, these records lack information about the patient’s motivation for visiting the ED, in particular, whether the youth was seeking help or was brought unwillingly by others. In addition, many of the ICD-10 codes reported here have limited validation in the ED setting, particularly for this population, and therefore cases may be misclassified. Indeed, the codes for both self-harm and mental disorders likely undercount both problems in the ED population. 24,25,58,59 There could also have been variability over time in how ICD-10 codes for self-harm were used. If so, some of the historical changes in the rates of self-harming behavior may have reflected changes in the understanding of self-harm by ED personnel. In particular, destigmatization campaigns may also have affected ED physicians, raising their awareness of the prevalence of self-harm and mental health problems. It is possible that physicians may “see” and therefore code more self-harm or mental health problems. To our knowledge, no one has investigated how destigmatization affects physicians’ practice. Finally, the data are from Ontario and may not generalize to other jurisdictions. 60
Conclusions
Rates of adolescent ED visits for self-harm and mental disorders have more than doubled since 2009 in Ontario. More research is required on the factors that may promote the risks of self-harm and mental health disorders, including the social determinants of health. More research is also required to understand the factors affecting which of the many adolescents who self-harm or who suffer from mental disorders will present to the ED and the causes of sex differences in these uses of the ED. Finally, there is an urgent need for strategies to connect adolescents who visit the ED with appropriate treatments and services.
Supplemental Material
Supplemental Material, RECORD_Checklist_2019-04-28 - Changing Rates of Self-Harm and Mental Disorders by Sex in Youths Presenting to Ontario Emergency Departments: Repeated Cross-Sectional Study
Supplemental Material, RECORD_Checklist_2019-04-28 for Changing Rates of Self-Harm and Mental Disorders by Sex in Youths Presenting to Ontario Emergency Departments: Repeated Cross-Sectional Study by William Gardner, Kathleen Pajer, Paula Cloutier, Roger Zemek, Lisa Currie, Simon Hatcher, Ian Colman, Dayna Bell, Clare Gray, Mario Cappelli, Daniel Rodriguez Duque and Isac Lima in The Canadian Journal of Psychiatry
Footnotes
Data Access
Daniel Rodriguez Duque and Isac Lima had full access to the data in the study. The data set from this study is held securely in coded form at ICES. While data-sharing agreements prohibit ICES from making the data publicly available, access may be granted to those who meet prespecified criteria for confidential access, available at www.ices.on.ca/DAS. See ![]() for a discussion of how ICES handles data privacy. The R code used to model the aggregate rates is available from the corresponding author.
for a discussion of how ICES handles data privacy. The R code used to model the aggregate rates is available from the corresponding author.
Acknowledgements
We thank Paul Kurdyak, MD, for serving as the ICES scientist on this project. Parts of this material are based on data and/or information compiled and provided by the Canadian Institute for Health Information (CIHI). However, the analyses, conclusions, opinions, and statements expressed in the material are those of the authors and not necessarily those of CIHI.
Disclosure
The authors have no financial relationships with any organizations that might have an interest in the submitted work and no other relationships or activities that could appear to have influenced the research.
Declaration of Conflicting Interests
The author(s) declared no potential conflicts of interest with respect to the research, authorship, and/or publication of this article.
Funding
The author(s) disclosed receipt of the following financial support for the research, authorship, and/or publication of this article: This research was funded by a grant from the ScotiaBank Foundation. ScotiaBank had no role in the design and conduct of the study; the collection, management, analysis, and interpretation of the data; the preparation, review, or approval of the manuscript; or the decision to submit the manuscript for publication. This study was also supported by ICES, which is funded by an annual grant from the Ontario Ministry of Health and Long-Term Care (MOHLTC). The opinions, results, and conclusions reported in this article are those of the authors and are independent from the funding sources. No endorsement by ICES or the MOHLTC is intended or should be inferred.
Supplemental Material
Supplemental material for this article is available online.
References
Supplementary Material
Please find the following supplemental material available below.
For Open Access articles published under a Creative Commons License, all supplemental material carries the same license as the article it is associated with.
For non-Open Access articles published, all supplemental material carries a non-exclusive license, and permission requests for re-use of supplemental material or any part of supplemental material shall be sent directly to the copyright owner as specified in the copyright notice associated with the article.