
Abstract
Objective:
Past cross-sectional studies have reported that mothers from ethnic minorities experience higher levels of prenatal and post-partum psychosocial distress compared with mothers from ethnic majorities. However, no studies have examined how the pattern varies longitudinally in a Canadian population of heterogeneous ethnicity.
Methods:
We analyzed data from 3,138 mothers participating in the Canadian Healthy Infant Longitudinal Development (CHILD) Study, a longitudinal multi-center study incorporating 10 distinct waves of psychosocial data collection from pregnancy until the index child was aged 5 y. Maternal self-identified ethnicity was grouped as White Caucasian, First Nations, Black, Southeast Asian, East Asian, South Asian, Middle Eastern, Hispanic and mixed ethnicity. We performed a multi-level regression to determine whether mothers of specific minority ethnicities were more likely to experience higher levels of distress (i.e. depressive symptoms and perceived stress) compared to white Caucasian mothers.
Results:
Mothers self-identifying as Black or First Nations had consistently higher distress scores than mothers from other ethnicities across all data collection times. After adjusting for relevant variables (history of depression, education, household income, marital status, and social support), First Nations mothers had a 20% increase in the mean scores of depressive symptoms compared to White Caucasian Mothers.
Conclusions:
Increased levels of perinatal and post-partum distress were seen in only some ethnic minority groups. Studies should avoid collapsing all categories into ethnic minority or majority and may need to consider how ethnicity interacts with other sociodemographic factors such as poverty.
Introduction
Maternal depression is detrimental to the long-term health of both mothers and children. 1 –5 The prevalence ranges from 15% to 20% in developed countries, 6 with higher rates (up to 37%) in developing countries. 7 Depressive symptoms also vary in their prevalence and manifestations across cultures and ethnicities. 8,9 Recognizing these variations is essential to develop effective intervention strategies and to understand the mechanisms of depression within the population.
In Canada, a recent study from the All Our Babies (AOB) cohort found that pregnant mothers from ethnic minorities (identified as Asian, Arab, Other Asian, African, First Nations and Latin American) as a group were more likely to report higher psychosocial distress compared to White mothers. 10 Although this cross-sectional finding is consistent across various countries, 11,12 there have been fewer studies on how this disparity varies across the child’s life course. It is generally known that depressive symptoms tend to be higher during the prenatal period and decrease post-partum 13 –17 but it is less well-known if this pattern is consistent across ethnicities. Furthermore, even though social support, a history of depression, and socioeconomic status (SES) are significant risk factors for maternal depression, 12 it is unclear if these factors are sufficient to explain the observed disparity among ethnic minority mothers; stress, in particular, has received less attention. With the changing composition of ethnicity and rise in immigration in Canada (in 2016, 20.6% of Canadians were foreign-born), 18 this question cannot be answered using data from other countries. Addressing and understanding this health disparity may help guide public health policies to determine groups of mothers most susceptible to perinatal distress.
We have analyzed data from the Canadian Healthy Infant Longitudinal Development (CHILD) Study, a multicenter study that recruited pregnant women and has followed their children until 5 y. The primary objective of the current manuscript was to examine the self-identified ethnicities most susceptible to maternal psychosocial distresses (depressive symptoms and perceived stress) from pregnancy through to the child’s preschool years, in association with other relevant sociodemographic factors.
Materials and Methods
Participants
Beginning in 2009, 3,264 participants were recruited by multiple means (including antenatal clinics at participating hospitals, private obstetric practices, baby fairs, advertising, word of mouth) to the General cohort of CHILD across 4 Canadian study centers (Edmonton, Toronto, Vancouver, and Manitoba). 19 Apparently healthy singletons born without complications and born after 35 weeks’ gestation to parents with adequate English to be able to respond to the study questionnaires were eligible for participation. 20 Mothers were asked to complete sociodemographic information and depressive symptom and perceived stress questionnaires during recruitment in the second or third trimester. Follow-up information was requested with questionnaires at 36 weeks’ gestation, and when the babies were aged 6, 12, 18, 24, 30, 36, 48, and 60 months. Mothers of infants who were ineligible at birth (e.g., due to prematurity or major complications) were excluded from the current study. Mothers who did not complete a questionnaire at a particular time were invited to respond at later times, provided that they had not withdrawn from the study. The current analysis includes 3,138 mothers who provided information on their ethnicity (see Online Appendix 1) and completed 2 or more psychosocial distress questionnaires out of the possible 10 time points.
Measures
Depressive Symptoms
Depressive symptoms were measured using the Center for Epidemiological Studies Depression (CES-D), 21 a 20-item scale (total scores range from 0 to 60) measuring depressive symptoms that has been validated across individuals from various ethnic backgrounds; 22,23 although, the structure of the questionnaire varies for different ethnicities. 24 Example of items include: “I felt that everything I did was an effort” and “I had trouble keeping my mind on what I was doing”. Participants rated how often each statement described their feelings in the past week, with a range from “0 – none of the time or rarely” to “3 – most or all of the time”.
Perceived Stress
Perceived stress was measured using the Perceived Stress Scale (PSS), a 10-item scale (total scores range from 0 to 40) measuring the degree to which mothers perceived their life situation as stressful. 25 Examples of items include: “How often have you felt confident in your ability to handle personal problems” and “How often have you been able to control irritations in your life”. Participants were asked to rate how frequently they felt each item within the past month, with a range from “0 – never” to “4 – very often”. If a mother skipped more than 30% of the items in either questionnaire, their data were considered missing; otherwise, because items have a high internal reliability, the mean score for that period was used to impute the missing item. 26
Ethnicity
Mothers were asked to self-identify their ethnicity with a “check all that apply” question (see Online Appendix 2 for the range of options presented to participants). Given the number of ethnicities reported in the current dataset, we categorized ethnicities as: First Nations, Black, Southeast Asian, East Asian, South Asian, White Caucasian, Middle Eastern, Hispanic, and mixed ethnicity. Mothers who selected “other” and wrote in responses that can be classified into one of the categories were recoded accordingly (e.g. Africans were classified as Black). To avoid making any assumptions, those who wrote responses that were ambiguous or could not be classified into any of the categories (e.g., Brazilian, Trinidadian) and those who did not provide any other information were excluded (n = 4). Those who wrote Metis or Inuit were combined with those who selected First Nations. Participants who selected more than one non-overlapping ethnic categories were considered of mixed ethnicity, except for First Nations; those who selected this option were automatically classified as First Nations. Details are provided in Online Appendix 2.
Covariate Measures
Household income was self-reported and categorized into 5 levels. Perceived social support was measured by the Interpersonal Support Evaluation List (ISEL), a validated 12-item questionnaire designed to measure perceived social support, which was dichotomized into high and low, above or below the mean social support within the sample. 27,28 History of depression was self-reported during recruitment and categorized into “never”, “current” or “in the past”. Time living in Canada was self-reported by all mothers regardless of immigration status; this was categorized into “born in Canada”, “less than 5 y”, “5 to 10 y” and “more than 10 y”. Highest level of education, age and marital status were self-reported. Marital status at the 5-y follow-up was used, while all other covariates (such as income) were taken during baseline recruitment. If baseline measures were unavailable, reports at the next follow-up were used (see Online Appendix 3).
Statistical Analysis
We considered the CES-D and PSS score as the main outcomes in our statistical analysis. We began by plotting changes in the average scores of maternal distress across time using the Locally Weighted Scatterplot Smoothing (LOWESS) method. Due to the skewed nature of the outcome and the residual terms, CES-D and PSS scores were log transformed. Separated models were built for CES-D and PSS scores. 29,30 To account for the correlated nature of longitudinal data, hierarchical linear regression models (HLM) with a random intercept term were applied to account for the possible differences in the baseline levels of psychosocial distress of each mother. HLM allows the use of available data from all mothers, even if not every questionnaire was completed at all time periods. To examine if observed differences manifested as clinically significant depressive symptoms, a sensitivity analysis was performed dichotomizing the level of depressive symptoms using the typical cut-off score of 16. 22 Our analysis was not intended to build a causal model, because ethnic identity cannot be theorized as a potential cause for maternal distress; rather, such an association could have been mediated by a plethora of other social factors that might be measured or unmeasured in the current study (e.g., socioeconomic status, immigration, discrimination). Hence, rather than attempting to minimize confounders and identify a precise measure of effect of ethnicity on maternal distress, we examined how the inclusion of relevant sociodemographic factors described above may change the risk experienced by each ethnicity. Interactions between these multiple covariates and ethnicity is beyond the scope of the current paper. We applied a Holm-Bonferroni correction to the P values to account for comparisons of multiple ethnic categories. 31 All analyses were conducted using SAS 9.4 PROC glimmix. 32
Results
Sample Characteristics (Table 1)
Most mothers were Canadian born (75.2%). The most common ethnicities of participants were White Caucasian (73.4%), East Asian (5.9%), Southeast Asian (4.7%) and First Nations (4.2%); 3.8% were of mixed ethnicity, and over 80% of these included White with another ethnic group. Half of the mothers were of high SES, with income of $100,000 or higher and, over 70% had a post-secondary education or higher. Although only about 30% of mothers completed questionnaires at all opportunities, 2,605 (83.0%) mothers completed 5 or more CES-D questionnaires out the 10 data collection waves. On average, there were about 7.5 available PSS / CES-D scores for each mother. Important baseline demographic characteristics of these 2,605 mothers were not significantly different from the 3,138 mothers who provided data at 2 or more time points (Table 1).
Demographics of mothers included in the current study.
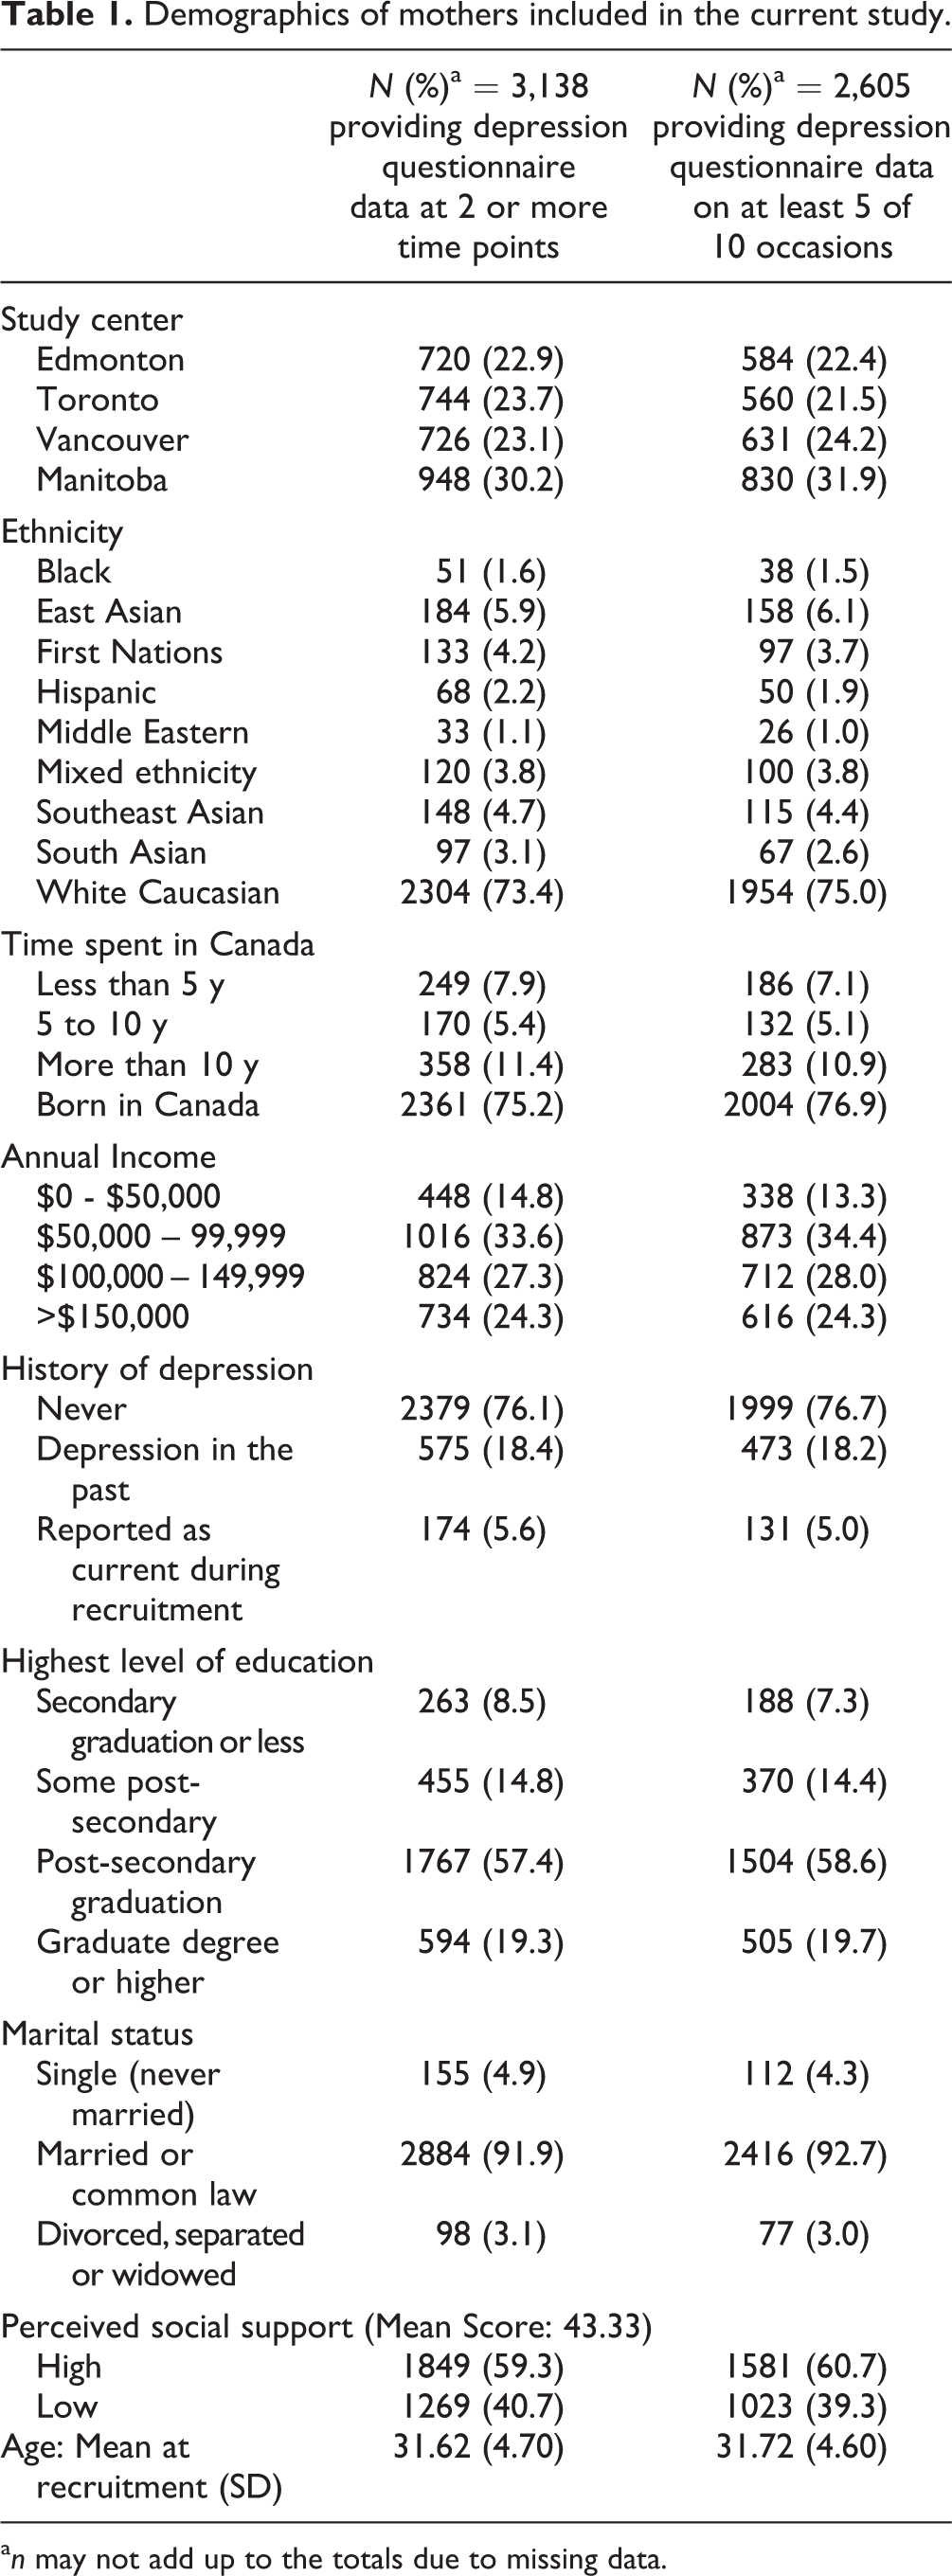
a n may not add up to the totals due to missing data.
Descriptive Trends Based on Lowess Curve
As shown in Figure 1a, CES-D scores were highest during pregnancy across all ethnicities; the score declined after the birth of the child but increased again around the time when the child reached age 1 y; this occurred at a slower rate and rarely exceeded the level measured during pregnancy. However, the levels of depression varied among ethnic groups; Black and First Nations mothers consistently had the highest CES-D scores compared to the overall study population and every other ethnicity; in particular, Black mothers on average started with CES-D scores of approximately 16 during the prenatal period, meeting the cut-off for significant depressive symptoms. 33 Middle Eastern and South Asian mothers also tended to have higher CES-D scores at all time points compared with the overall study population. East Asian, Southeast Asian, Hispanic, mixed ethnicity and White Caucasian mothers tended to have similar levels of CES-D, which were closer to the overall population. A similar trend was observed for PSS scores; across all ethnicities, levels of stress were highest during pregnancy, decreased post-partum and increased to a relatively steady level again after the child reached the age of 1 or 2 y. Black and First Nations mothers still consistently reported the highest stress levels compared with all other ethnicities, followed by Middle Eastern, South Asian and Southeast Asian mothers, who generally reported higher than the average scores of the overall cohort.
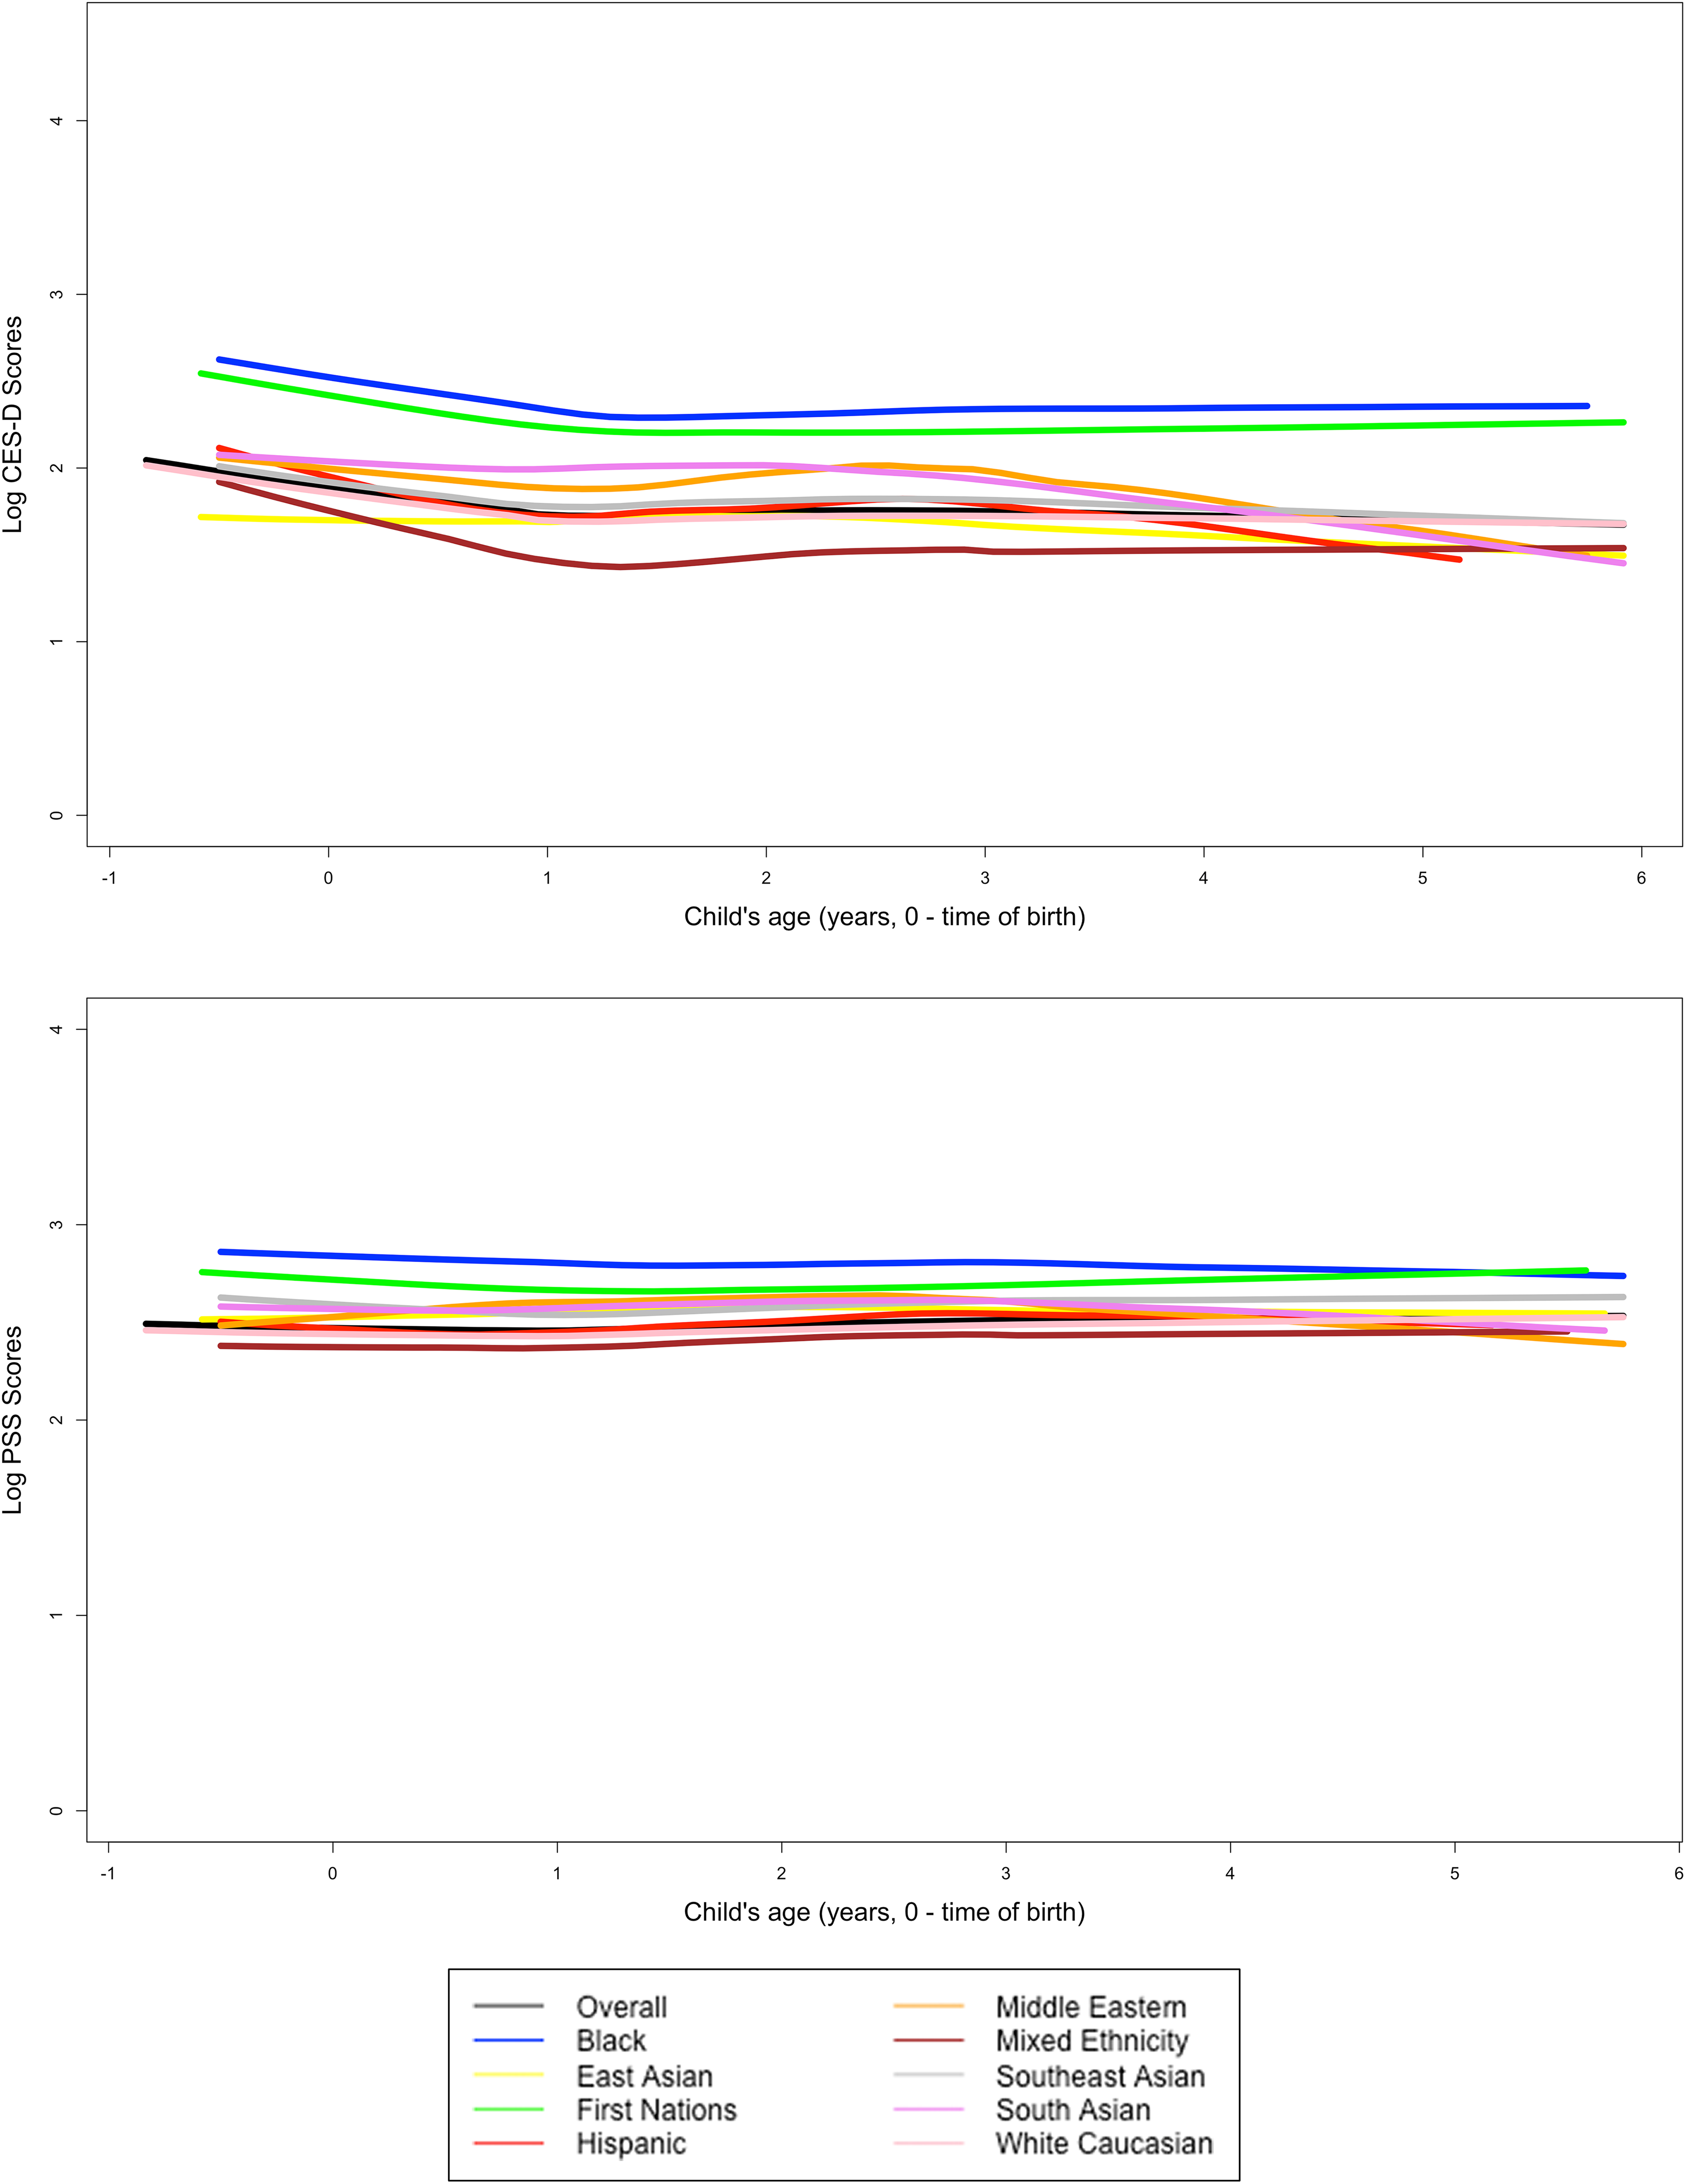
Trajectory of CES-D and PSS scores across the ages in the log scale, smoothed by Lowess curves, for the overall data by ethnicity*.
Depressive Symptoms
Compared to White Caucasian mothers, mean depressive symptoms scores were significantly higher by 1.67-times for Black mothers, and by 1.60-times for First Nations mothers. Among other ethnicities, there were no significant differences in the mean CES-D scores. All other demographics were also significantly associated with the mean CES-D scores. Specifically, being new to Canada, being divorced or single at the end of the follow-up time, and having a history of depression increased the likelihood of a higher mean CES-D score; on the other hand, higher education, level of social support and income reduced the likelihood of a higher mean CES-D score (Table 2).
Association between sociodemographic factors and psychosocial distresses based on multilevel models with random intercept and logarithmic transformation of CES-D and PSS scores.
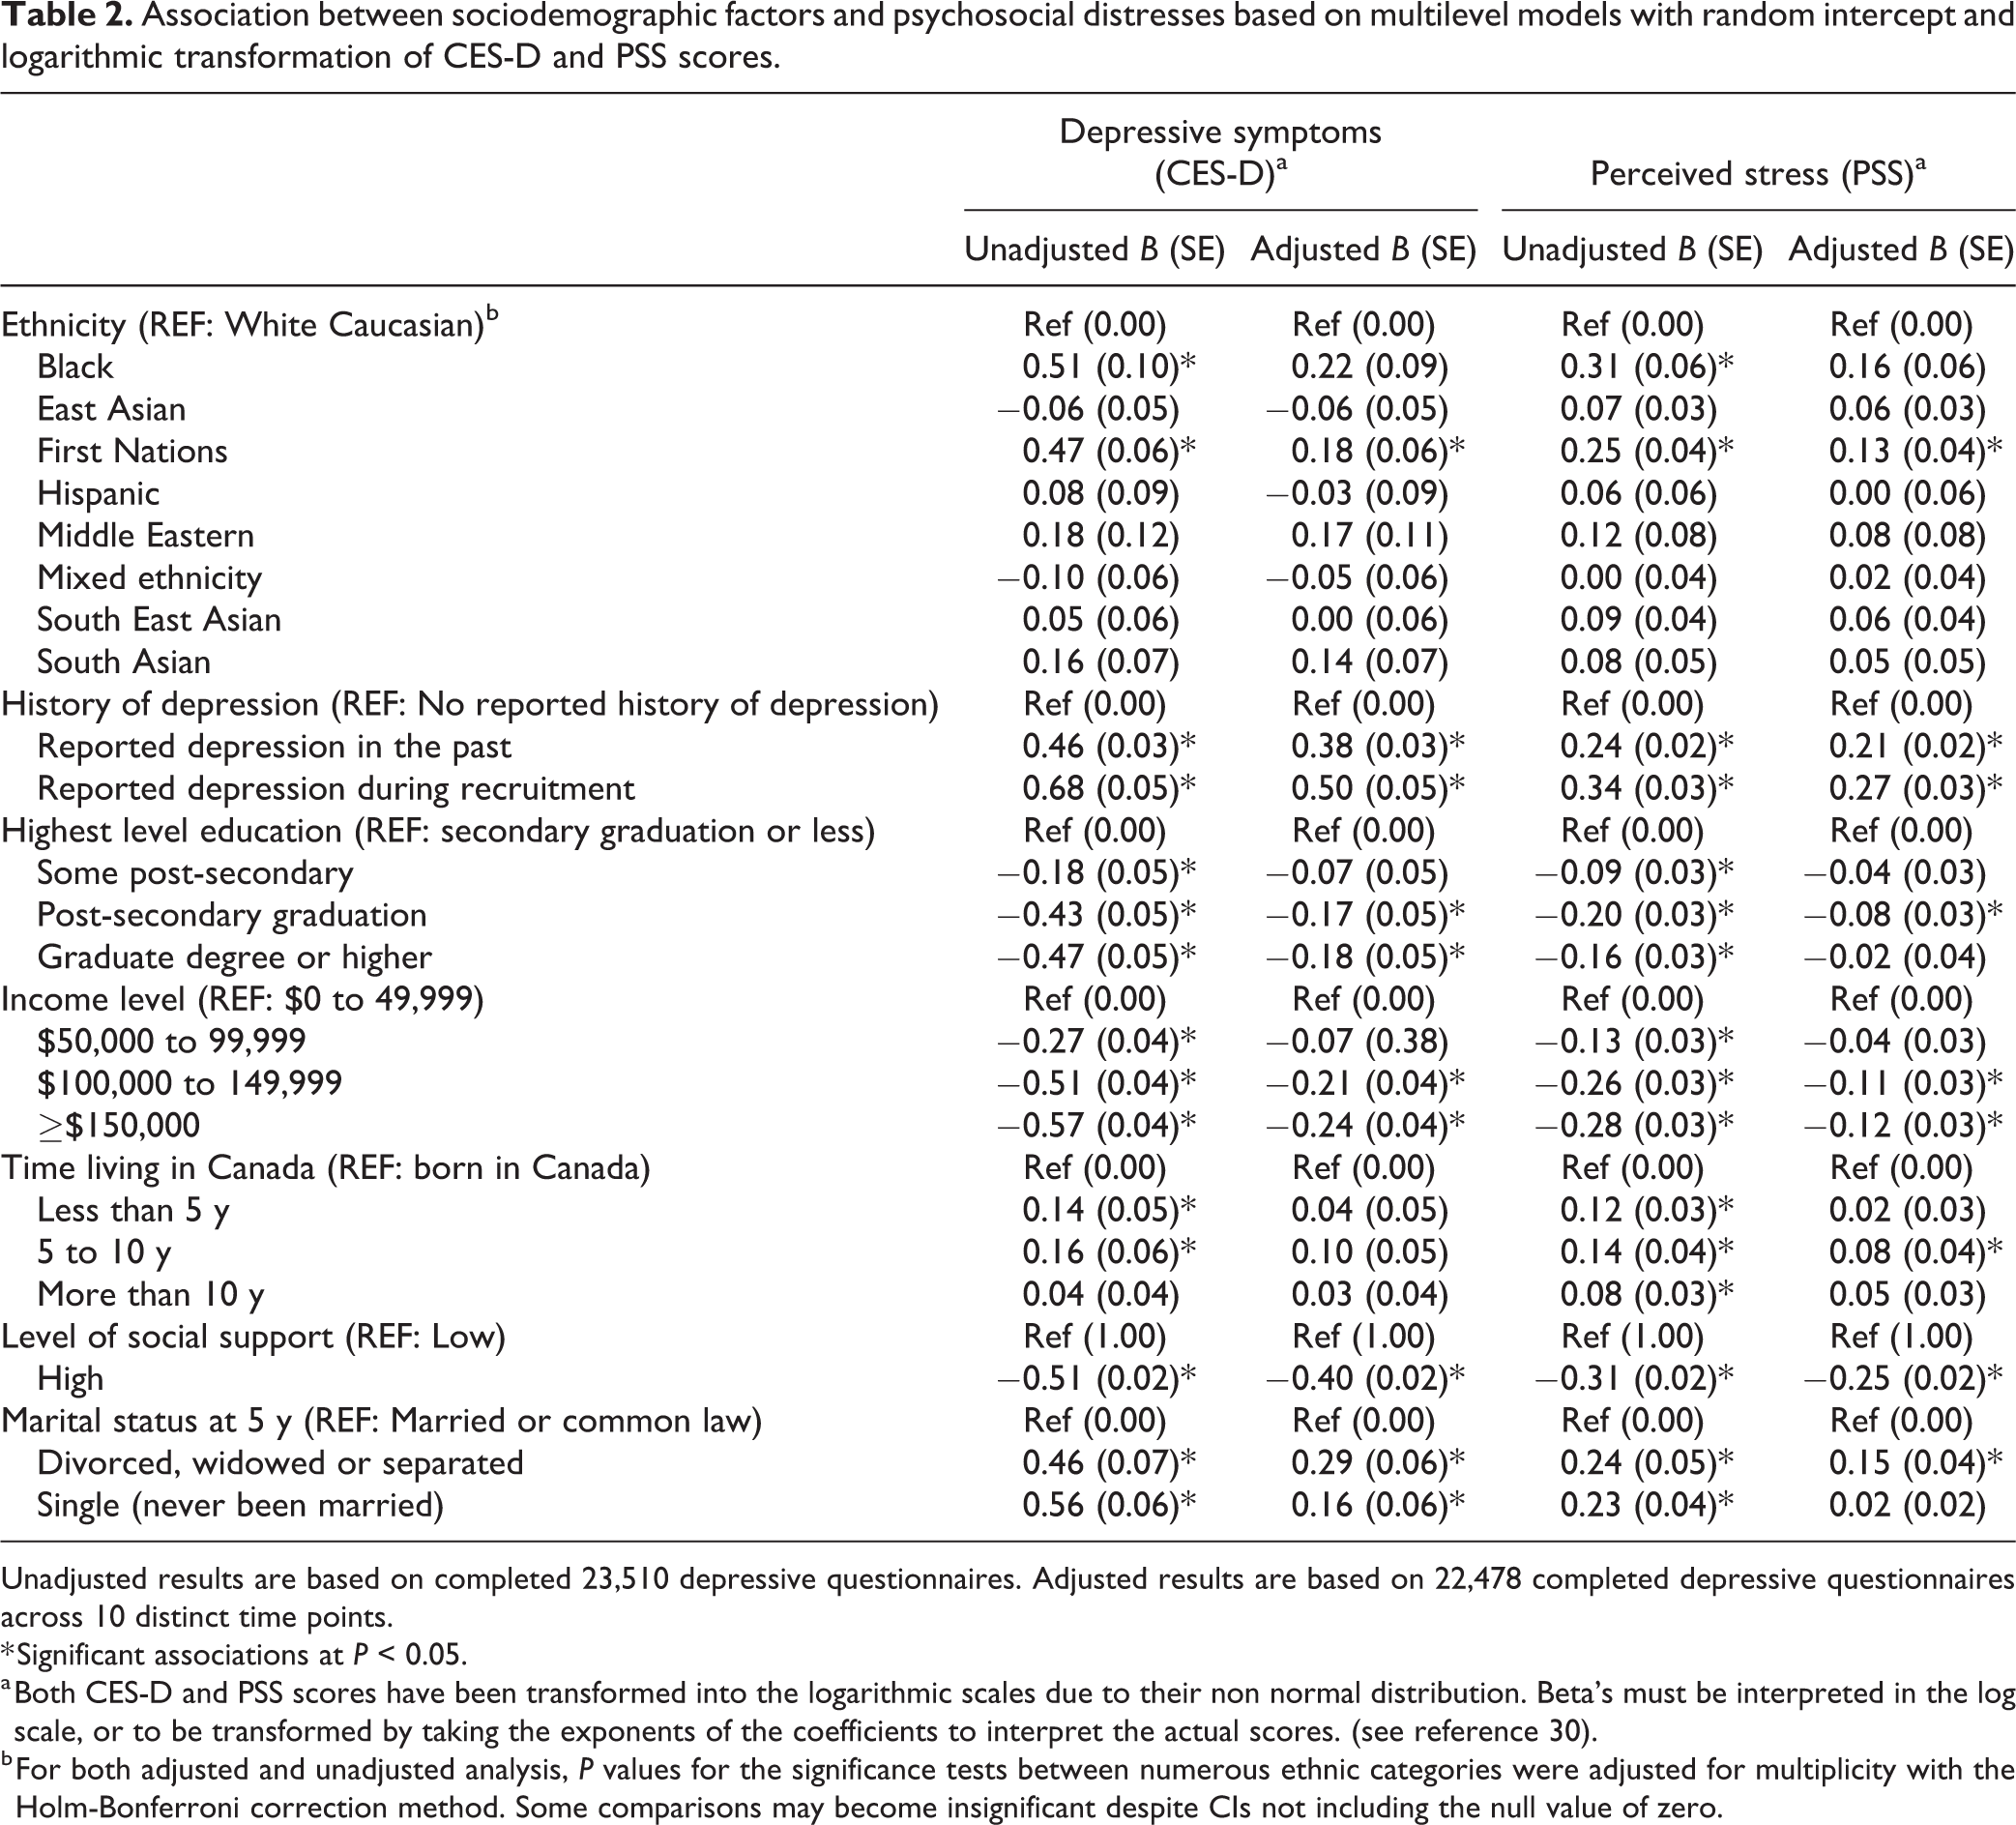
Unadjusted results are based on completed 23,510 depressive questionnaires. Adjusted results are based on 22,478 completed depressive questionnaires across 10 distinct time points.
* Significant associations at P < 0.05.
a Both CES-D and PSS scores have been transformed into the logarithmic scales due to their non normal distribution. Beta’s must be interpreted in the log scale, or to be transformed by taking the exponents of the coefficients to interpret the actual scores. (see reference 30).
b For both adjusted and unadjusted analysis, P values for the significance tests between numerous ethnic categories were adjusted for multiplicity with the Holm-Bonferroni correction method. Some comparisons may become insignificant despite CIs not including the null value of zero.
Perceived Stress
Similarly, compared with White Caucasian mothers, mean scores of perceived stress were significantly increased by 1.36-times for Black mothers, and by 1.28-times for First Nations mothers. There were no significant differences in the mean scores among other ethnicities. Other demographics were also significantly associated with the mean PSS scores in the same direction as noted for CES-D scores (Table 2).
Multivariable Analysis
Depressive Symptoms
Compared with White Caucasian mothers, mean depressive symptoms scores for First Nations mothers were significantly higher by 1.20-times when adjusted for other sociodemographic factors. Following P value adjustments, no other ethnicities were significantly more likely to have a higher CES-D mean score. Other sociodemographic factors remained significantly associated with CES-D scores in the full model; although, not all recent immigrants to Canada experienced higher depressive symptoms than mothers born in Canada (Table 2). When we dichotomized CES-D scores as the presence or absence of depressive symptoms, similar conclusions were reached (see Online Appendix 4).
Perceived Stress
Similarly, compared to white Caucasian mothers, the mean scores of perceived stress for First Nations mothers were significantly higher by 1.14-times when adjusting for all other sociodemographic factors. Following P value adjustments, no other ethnicities were significantly more likely to have a higher PSS mean score. Other factors remained significantly associated with PSS scores in the full model; although, time living in Canada did not increase the risk of a higher mean PSS score among recent immigrants. Compared with Canadian-born women, only those who had been in Canada for longer than 5 y were at an increased risk (Table 2).
Discussion
The current study has confirmed previous findings that mothers from ethnic minorities in Canada have a higher risk for psychosocial distress from pregnancy to when the child reaches the age of 5 y compared to White Caucasian mothers. However, we found that the pattern is more nuanced than what was reported in a previous Canadian cross-sectional study 10 ; in particular, only First Nations and, to a lesser extent, Black mothers were more likely to have higher distress scores compared to white mothers. Furthermore, we found that the overall longitudinal pattern of maternal distress is generally consistent across ethnicities, even though the levels vary by ethnicity.
There are a few possible reasons why this might be the case. One may hypothesize that SES could be a potential mediator for this relationship; for example, Blacks and First Nations households in Canada are more likely to have a lower SES (lower education, higher poverty) than other ethnic minority households (such as East Asians) based on 2011 Statistics Canada data. 34 However, the higher risk persisted after adjusting for SES, income, social support and education levels, suggesting that these effects alone are not sufficient to explain the disparities experienced by these ethnic groups. Studies have also shown that common social determinants of health identified in the general population do not always have the same impact within the First Nations population. 35 Factors such as perceived discrimination and unforeseeable events in the family are also possible unobserved factors that may explain these disparities; it is unlikely that these unexplained factors were due to genetic differences.
As previously reported from the same CHILD Study data, immigrant mothers who had lived in Canada for longer than 5 y were at risk for higher psychosocial distress, whereas more recent immigrant mothers were not at an increased risk. 36 Past cross-sectional research in this area however, has been mixed; 12,37 in fact, an analysis of the Canadian Community Health Survey (CCHS) data suggests that immigrants are less likely to experience depressive episodes than their non-immigrant counterparts. This has been attributed to the “healthy immigrant effect”, 37 where strict medical screening of immigrants only selects those who are healthy. As they acculturate into Canadian culture, they may experience more stressors from being away from their families; albeit, at a minimal value based on these data.
The strengths of the current study are the large sample size and the longitudinal nature of the data, from which we can elucidate the changing patterns of depressive symptoms with time across ethnicities. In addition, the current study included a wide range of ethnic groups, particularly mothers of mixed ethnicity, which were largely invisible in past longitudinal studies of depression in the US. 12 Mothers of mixed ethnicity are a growing population in Canada, where 42.1% of Canadians report more than one ethnic ancestry. 18 One major limitation is the small sample size for some ethnic minorities (particularly Middle Eastern and Black mothers); albeit, the distribution of ethnicity in the current study is similar to the Canadian population. 18 This prevents us from making firm conclusions on the risk of depressive symptoms as a dichotomous outcome. As our findings are largely based on continuous scores, statistically significant differences need to be interpreted with caution; although our exploratory analysis with dichotomizing CES-D scores suggests our findings are robust, a difference in one CES-D or PSS score may not translate to meaningful or significant manifestations. Our study may also underrepresent mothers with a lower income, a lower level of education, and mothers living in rural areas, which precludes us from assessing how these factors impact the association between ethnicity and maternal distress. External validity might also be limited to more affluent families who are more highly represented in our study. Our results also cannot be generalized to mothers of multiple births or those experiencing pregnancy-related complications, preterm births, or miscarriage, as these events were exclusion criteria for the CHILD Study. Inferences might also be limited by missing data, as only about 30% of mothers completed every single questionnaire at all time periods, even though over 80% completed at least 5 of the 10 questionnaires. Changes in the average distress scores depicted in Figure 1 need to be interpreted with caution, as not all mothers were included at every time point. There may be unknown selection biases that distinguish mothers who completed all questionnaires compared to those who did not; however, as shown in Table 1, there were no differences in the measured demographic variables between mothers who completed 5 or more questionnaires with the overall study population. Finally, it should be noted that self-reported depressive symptoms may not always translate to actual clinical depression; past Canadian studies have shown that this tends to lead to an overestimation of depression compared to a clinical interview. 38
Future studies may need to investigate the interactions among numerous sociodemographic variables in modifying the risks for maternal depressive symptoms in Canada (such as between poverty and ethnicity). Larger studies with higher numbers of ethnic minority mothers from a wider variety of SES would allow the use of more advanced models, such as structural equation modelling or latent trajectory analysis, which may further help us to elucidate trajectory patterns for mothers of different ethnicities. Finally, future studies should also include other important factors unavailable in our current analysis that may modify our observed associations, which may include experiences of discrimination, intimate partner violence, a non-English first language, medication usage, previous pregnancy complications, and places of residence. 39 Inclusion of such measures will also allow for mediation analysis to identify potential mediators of this observed association.
Conclusion
This study has shown that the pattern of health inequalities experienced by mothers from racial minorities in Canada is more nuanced than previously reported. A simple dichotomous classification of White vs. non-White without considering relevant sociodemographic factors, may obscure the underlying nature of the association. Despite the limitations of the current findings, health-care professionals working with Black and First Nations mothers may need to be aware of the higher risk for maternal distress experienced by these women. Ethnicity is not an intervenable factor but addressing the health disparities experienced by these groups is important to deliver more effective intervention strategies aimed at preventing maternal depressive episodes. Finally, future studies to support public health policies will need to determine if reducing factors such as poverty and stigma may assist in alleviating these risks.
Supplemental Material
Supplemental Material, Appendix_CJP_revised_final - Risk for Maternal Depressive Symptoms and Perceived Stress by Ethnicities in Canada: From Pregnancy Through the Preschool Years
Supplemental Material, Appendix_CJP_revised_final for Risk for Maternal Depressive Symptoms and Perceived Stress by Ethnicities in Canada: From Pregnancy Through the Preschool Years by Christoffer Dharma, Diana L. Lefebvre, Zihang Lu, Wendy Y. W. Lou, Allan B. Becker, Piush J. Mandhane, Stuart E. Turvey, Theo J. Moraes, Meghan B. Azad, Edith Chen, Susan J. Elliott, Anita L. Kozyrskyj, Malcolm R. Sears, and Padmaja Subbarao in The Canadian Journal of Psychiatry
Footnotes
Acknowledgements
We are grateful to all the families who took part in this study, and the whole CHILD team, which includes interviewers, nurses, computer and laboratory technicians, clerical workers, research scientists, volunteers, managers, and receptionists. We are particularly grateful to Vera Dai for statistical help and Melanie St. John for meticulous data checking. The Canadian Institutes of Health Research (CIHR) and the Allergy, Genes and Environment (AllerGen) Network of Centres of Excellence (NCE) provided core funding for CHILD. Additional support has been provided by Health Canada, Environment Canada, Canada Mortgage and Housing Corporation, the Sick Children’s Hospital Foundation, Don & Debbie Morrison, the Silver Thread Foundation and the Childhood Asthma Foundation. M Sears holds the AstraZeneca endowed chair in Respiratory Epidemiology. Funders had no role in the design and analysis of the study.
Data Access
Data are not publicly available due to confidentiality reasons in accordance to ethics approval given by all ethics boards from participating universities. Interested investigators may submit inquiries to the corresponding author.
Declaration of Conflicting Interests
The author(s) declared no potential conflicts of interest with respect to the research, authorship, and/or publication of this article.
Funding
The author(s) disclosed receipt of the following financial support for the research, authorship, and/or publication of this article: Canadian Institutes of Health Research (CIHR), Allergy, Genes and Environment Network of Centers of Excellence (AllerGen NCE, Inc.)
Supplemental Material
Supplemental material for this article is available online.
References
Supplementary Material
Please find the following supplemental material available below.
For Open Access articles published under a Creative Commons License, all supplemental material carries the same license as the article it is associated with.
For non-Open Access articles published, all supplemental material carries a non-exclusive license, and permission requests for re-use of supplemental material or any part of supplemental material shall be sent directly to the copyright owner as specified in the copyright notice associated with the article.