
Abstract
Objective:
To assess the prevalence of gambling and problem gambling in urban Aboriginals in the Canadian Prairie provinces and to determine the predictors of problem gambling.
Method:
In total, 1114 Aboriginals living in 15 cities in Alberta, Saskatchewan, and Manitoba were recruited via posters and direct solicitation at Native Friendship Centres, shopping malls, and other locations where Aboriginals congregated. They each completed a self-administered 5- to 10-minute survey.
Results:
Urban Aboriginals in the present sample were found to have a much higher level of gambling participation than the general Canadian public, especially for electronic gambling machines, instant lotteries, and bingo. Their intensity of participation in terms of number of formats, frequency of play, and gambling expenditure was also very high. This, in turn, is an important contributing factor to their very high rate of problem gambling, which was found to be 27.2%. Problem gambling was higher in males, unemployed people, and cities having the highest proportion of their population consisting of urban Aboriginals.
Conclusions:
Urban Aboriginal people appear to have some of the highest known rates of problem gambling of any group in Canada. This is attributable to having many more risk factors for problem gambling, such as a greater level of participation in gambling, greater participation in continuous forms of gambling (e.g., electronic gambling machines), younger average age, higher rates of substance abuse and mental health problems, and a range of disadvantageous social conditions (e.g., poverty, unemployment, poor education, cultural stress) that are conducive to the development of addictive behaviour.
North American Aboriginals have higher rates of gambling participation and much higher rates of problem gambling relative to non-Aboriginals. 1,2 The best estimate is that the current overall average rate of problem/pathological gambling is in the 10% to 20% range and is at least 4 times higher than found in non-Aboriginal populations. 2
A relatively understudied group is urban Aboriginals. Over the years, there has been a gradual migration of Aboriginals to urban centres. In 2011, 56% of Canadian Aboriginal people reported living in urban areas, with urban residency being highest among Non-Status Indians (75%) and Métis (71%) and lowest among Registered Indians (42%) and Inuit (43%). 3,4 (Note: A Non-Status Indian is a First Nations person who is not registered with the federal government.) Furthermore, Aboriginals increasingly make up a significant portion of the Canadian urban population, as they are the fastest growing demographic segment in Canada. In 2011, they represented 4.3% of the Canadian population, up from 2.8% in 1996. 3 Within this group, 60.8% are First Nations (76.5% Registered Indian, 23.5% Non-Status Indian), 32.3% are Métis, 4.2% are Inuit, and 2.7% report being of mixed or other identity.
The present study is a large-scale investigation of urban Aboriginal gambling. Although there have been a couple of previous investigations of this population, they have either focused on a specific community 5 or more broadly assessed North American Aboriginals without any subanalysis of Canadian urban Aboriginals. 2
Face-to-face recruitment is the most practical way of assessing this population, because of their relatively low rates of telephone landline and online connectedness 6,7 combined with their relatively low prevalence in the general population. To make the project logistically feasible, a decision was made to sample Aboriginal adults living in 15 urban centres in the provinces of Alberta, Manitoba, and Saskatchewan, as the majority of Canadian Aboriginals live in urban centres in Western Canada. We only surveyed Aboriginals who resided in these urban centres, as they constituted the large majority of the sample, and we felt this would shed light on this relatively understudied population who increasingly represent the normative residential profile of Aboriginal Canadians.
The specific research questions guiding the present research are as follows: What is the current prevalence of gambling and problem gambling among urban Aboriginals? What are the predictors of gambling and problem gambling among urban Aboriginals?
Method
Study Area and Research Sites
The Canadian provinces where the study took place as well as the geographic location of the 15 cities where data were collected are depicted in Figure 1.
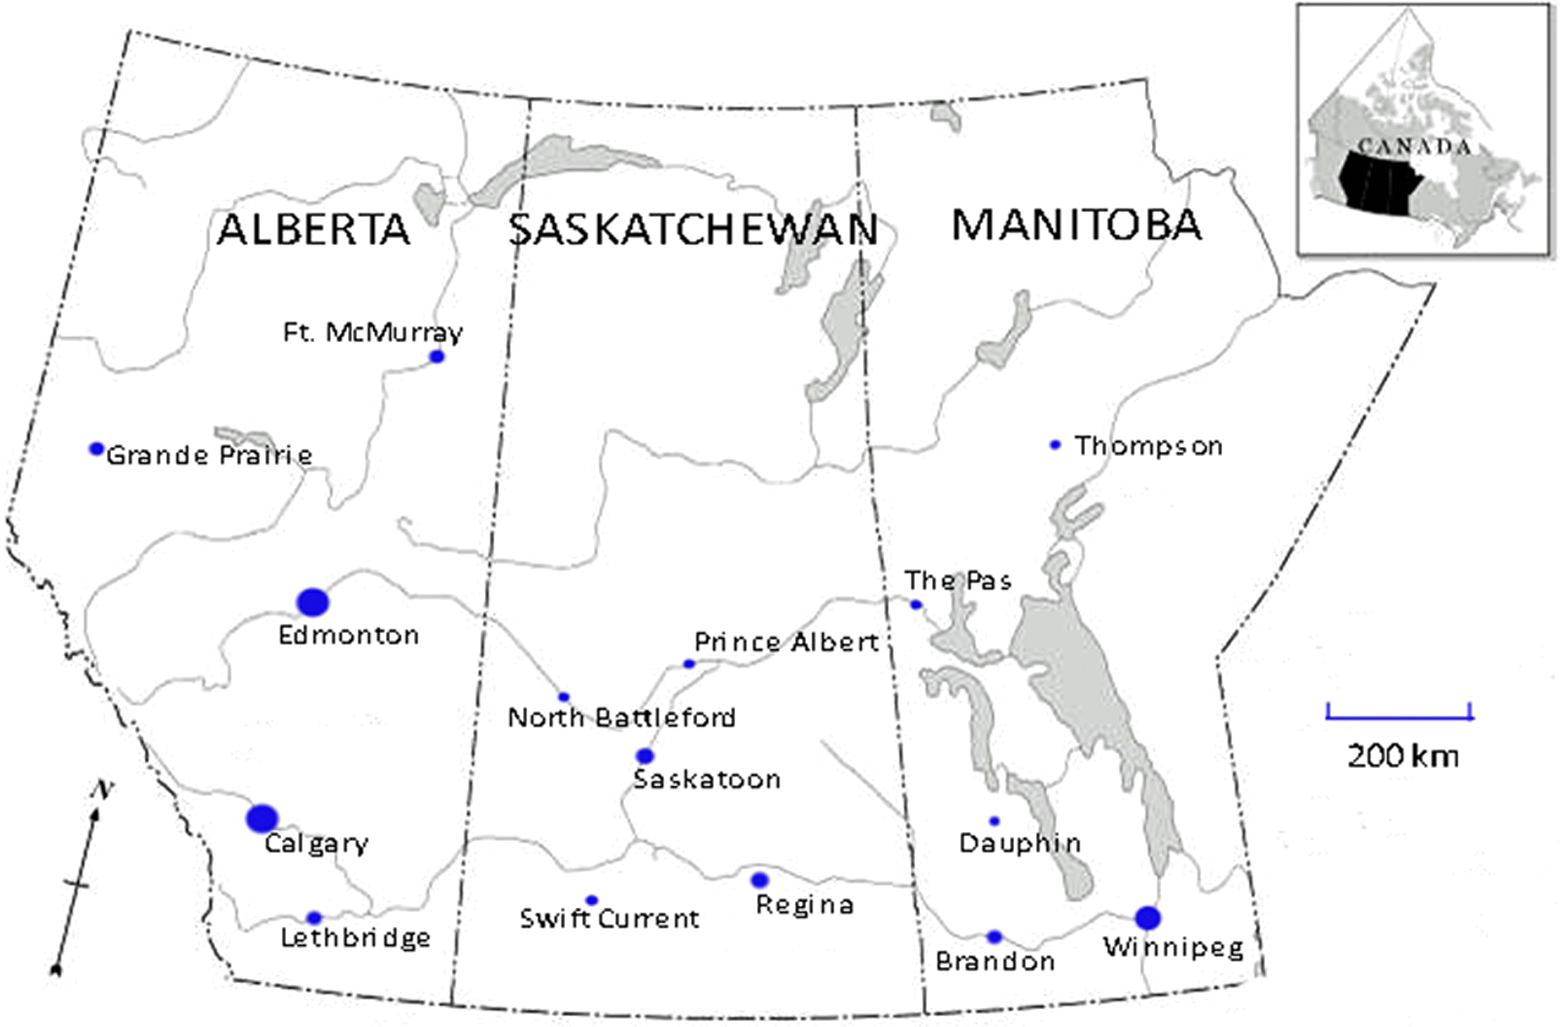
Research sites in Canadian Prairie provinces of Alberta, Saskatchewan, and Manitoba.
Five cities were chosen in each of the 3 provinces (Table 1). For each province, the capital city was chosen, the province’s next largest centre after the capital, a smaller midsized city, and 2 smaller, geographically removed centres. As can be seen in Table 1, each of these cities has a significant Aboriginal population, but with significant variation in the proportion of the population that is Aboriginal.
Fifteen Research Sites and Their Characteristics.
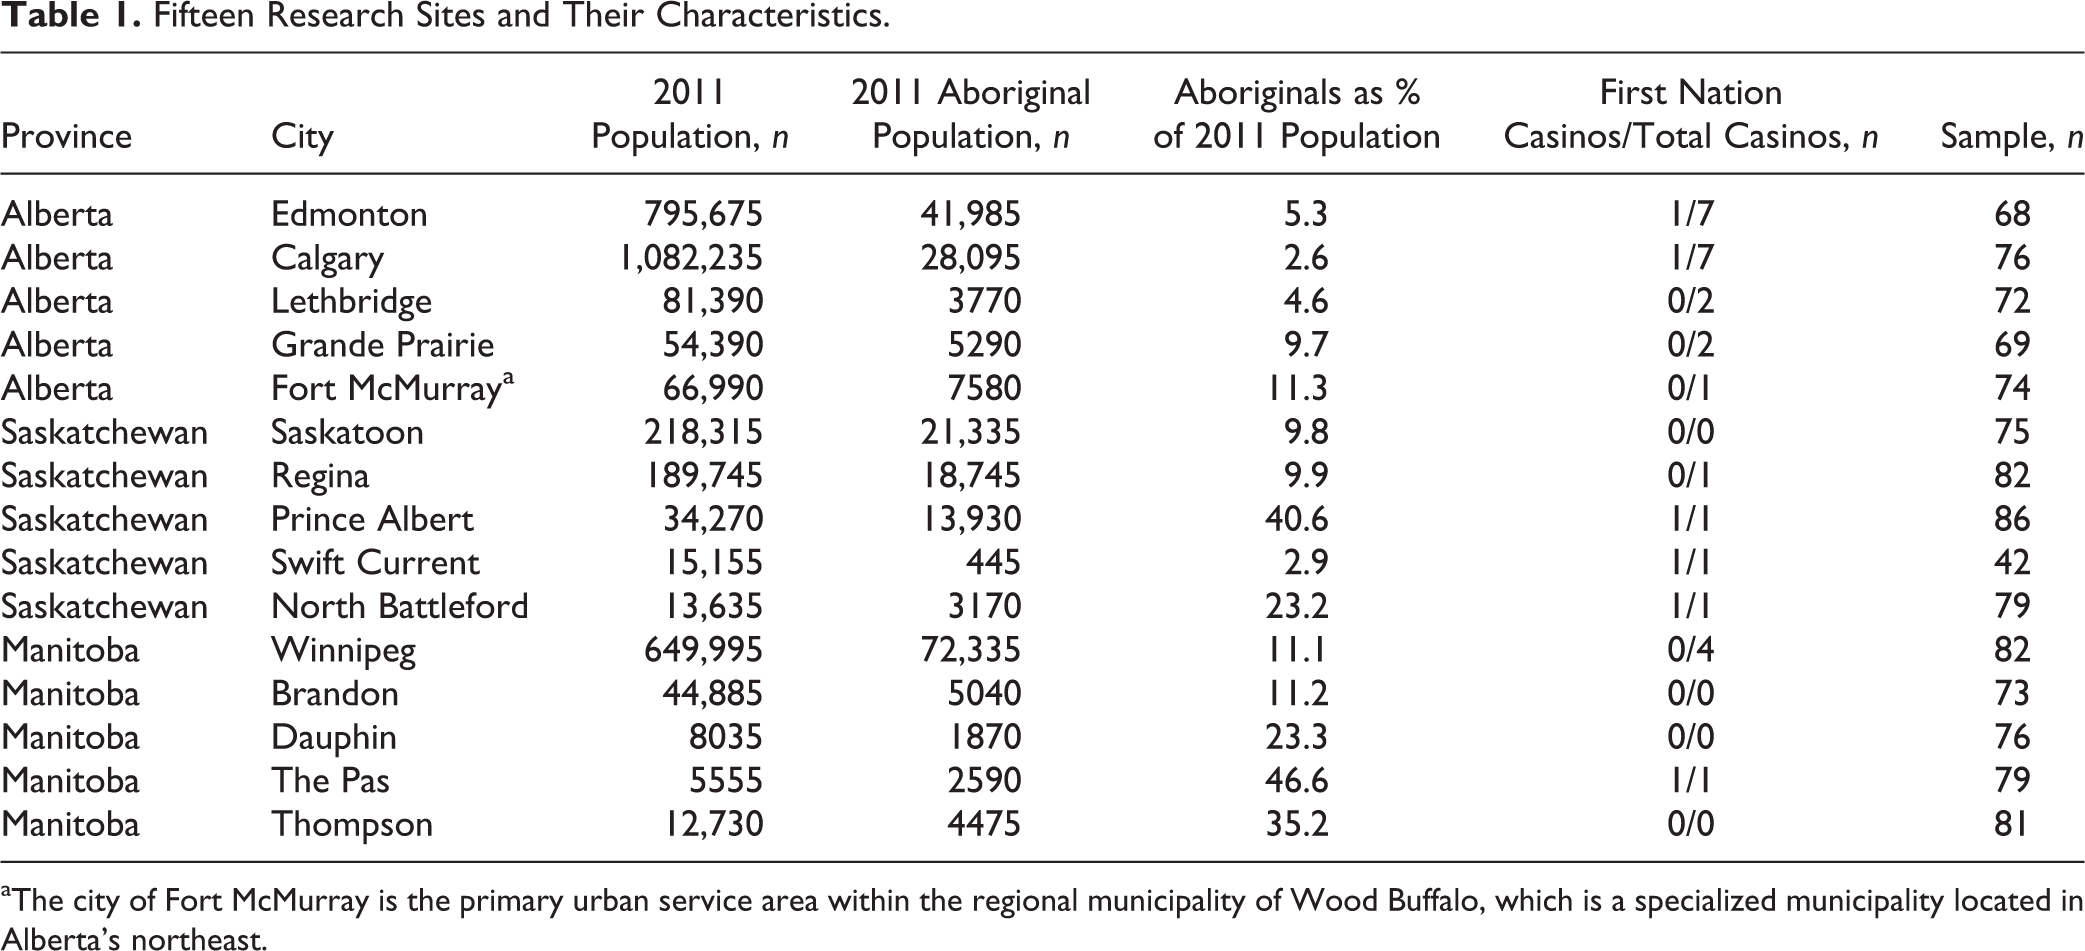
aThe city of Fort McMurray is the primary urban service area within the regional municipality of Wood Buffalo, which is a specialized municipality located in Alberta’s northeast.
Legal gambling opportunities are pervasively available in urban centres in these provinces in the form of lotteries, instant lotteries, and sports betting at retail outlets (e.g., petrol stations, convenience stores); bingo halls; horse race betting (on track and/or via teletheatre betting); casinos; and stand-alone electronic gambling machines (slot machines and video lottery terminals) in bars, casinos, and horse race tracks. 8 As seen in Table 1, most of these cities have casinos, with several of these cities having First Nation’s owned casinos. 1,9 All Canadians are also able to legally access out-of-country online gambling sites. In addition, the province of Manitoba provided an online gambling site to Manitoba residents beginning in 2012.
Recruitment
Participants were self-recruited via posters and word of mouth and by direct approach. Posters were put up in the local Aboriginal Friendship Centre, shopping malls, and other areas where Aboriginal people congregated. The poster indicated that the University of Lethbridge in partnership with [name of venue/organization] would pay participants $5 to complete a survey on “certain health and recreational activities” (the nonspecific description of the survey was to avoid overrecruiting heavy gamblers and problem gamblers, as typically occurs when surveys are described as “gambling surveys” 10 ). The date(s) and location(s) the surveys would be administered were also indicated. Most locales, with the exception of shopping centres, provided the research assistant with a private area to conduct the survey. To be eligible, it was explained that the participants needed to be 18 years or older, resident within city limits, and to consider themselves to be Aboriginal, First Nations, Métis, or Inuit. These eligibility questions were asked again when people approached the research assistant to take the survey and/or when the research assistant directly solicited recruitment. Stratified sampling was used such that in each of the 15 cities, no more than 50% of people would be recruited from Friendship Centres, at least 40% of the surveys needed to be conducted with males, and 50% of the surveys needed to be conducted with people younger than age 40 years and 50% with people 40 years and older (as 40 was the median age of the Aboriginal adult population in 2011 3,4 ). Anyone who agreed to participate was required to read and sign an informed consent form. Ethical approval for this study was granted by the University of Lethbridge Human Research Ethics Committee.
Survey
The self-administered paper survey was written in English and took between 5 and 10 minutes to complete. All questions had fixed response options. Participants had the option of having the questionnaire read to them, and a total of 4.2% accessed this option. The survey asked questions concerning demographic characteristics (gender, age, Aboriginal group, educational attainment, employment status, income), past-year gambling behaviour for 12 different types of gambling, and problem gambling behaviour using the Problem and Pathological Gambling Measure (PPGM). 11,12 The 14-question PPGM has superior sensitivity, specificity, and classification accuracy compared to other problem gambling assessment instruments and shows excellent classification accuracy for non-Western populations. 11,12 It classifies people into nongamblers, recreational gamblers, at-risk gamblers, problem gamblers, and pathological gamblers.
A total of 1114 surveys were administered between October 24, 2012, and March 15, 2013. A research assistant (SYP) administered the surveys over this time frame, moving from city to city. As seen in Table 1, an average of 74 surveys were administered in each city (range, 42 to 82). In terms of location, 41.5% of the surveys were administered in Friendship Centres, 24.6% in shopping malls, and 33.9% in other locales (Salvation Army, Great Plains College, Métis Centres, homeless shelters, etc.).
Results
Sample
The specific Aboriginal group that people reported belonging to was as follows: 54.8% Cree, 16.1% Métis, 10.0% Ojibwa, 7.3% Blackfoot, 3.9% Dene, 2.3% Dakota, 1.9% Saulteaux, and 3.6% other. Sixty-five percent of the sample reported that they had lived in the city more than 5 years, 15.6% between 1 and 5 years, and 19.3% less than 1 year. A total of 49.6% of the sample was female. Age ranged from 15 to 84 years (10 people were younger than 18), with an average age of 40.4. Table 2 provides the full demographic profile of the sample relative to the 2011 general Aboriginal population. 4 Although the age and gender distribution of the sample is a reasonable match to the Aboriginal population, it is evident that marital status, educational attainment, employment status, and household income are not. More specifically, the sample contains disproportionately more single people, individuals with lower educational attainment, unemployed people, and individuals with lower household incomes. This sampling bias, in turn, is probably due to the fact that Aboriginals who are employed and/or with better integration into urban centres are less likely to be found at Friendship Centres and other places where Aboriginals congregate and the $5 survey payment being more attractive to people in financial need.
Comparison of the Obtained Sample Relative to the 2011 Canadian Aboriginal Population.

Gambling Involvement
A total of 89.8% of the sample reported some form of past-year gambling participation. As seen in Figure 2, the highest rates of participation were with electronic gambling machines (47.6%), lottery tickets (46.4%), and instant win tickets (44.5%), and the lowest rates of participation were with stock market activities (1.9%), horse racing (5.3%), and online gambling (8.4%). Only 11% reported any past-year participation in traditional First Nations games.
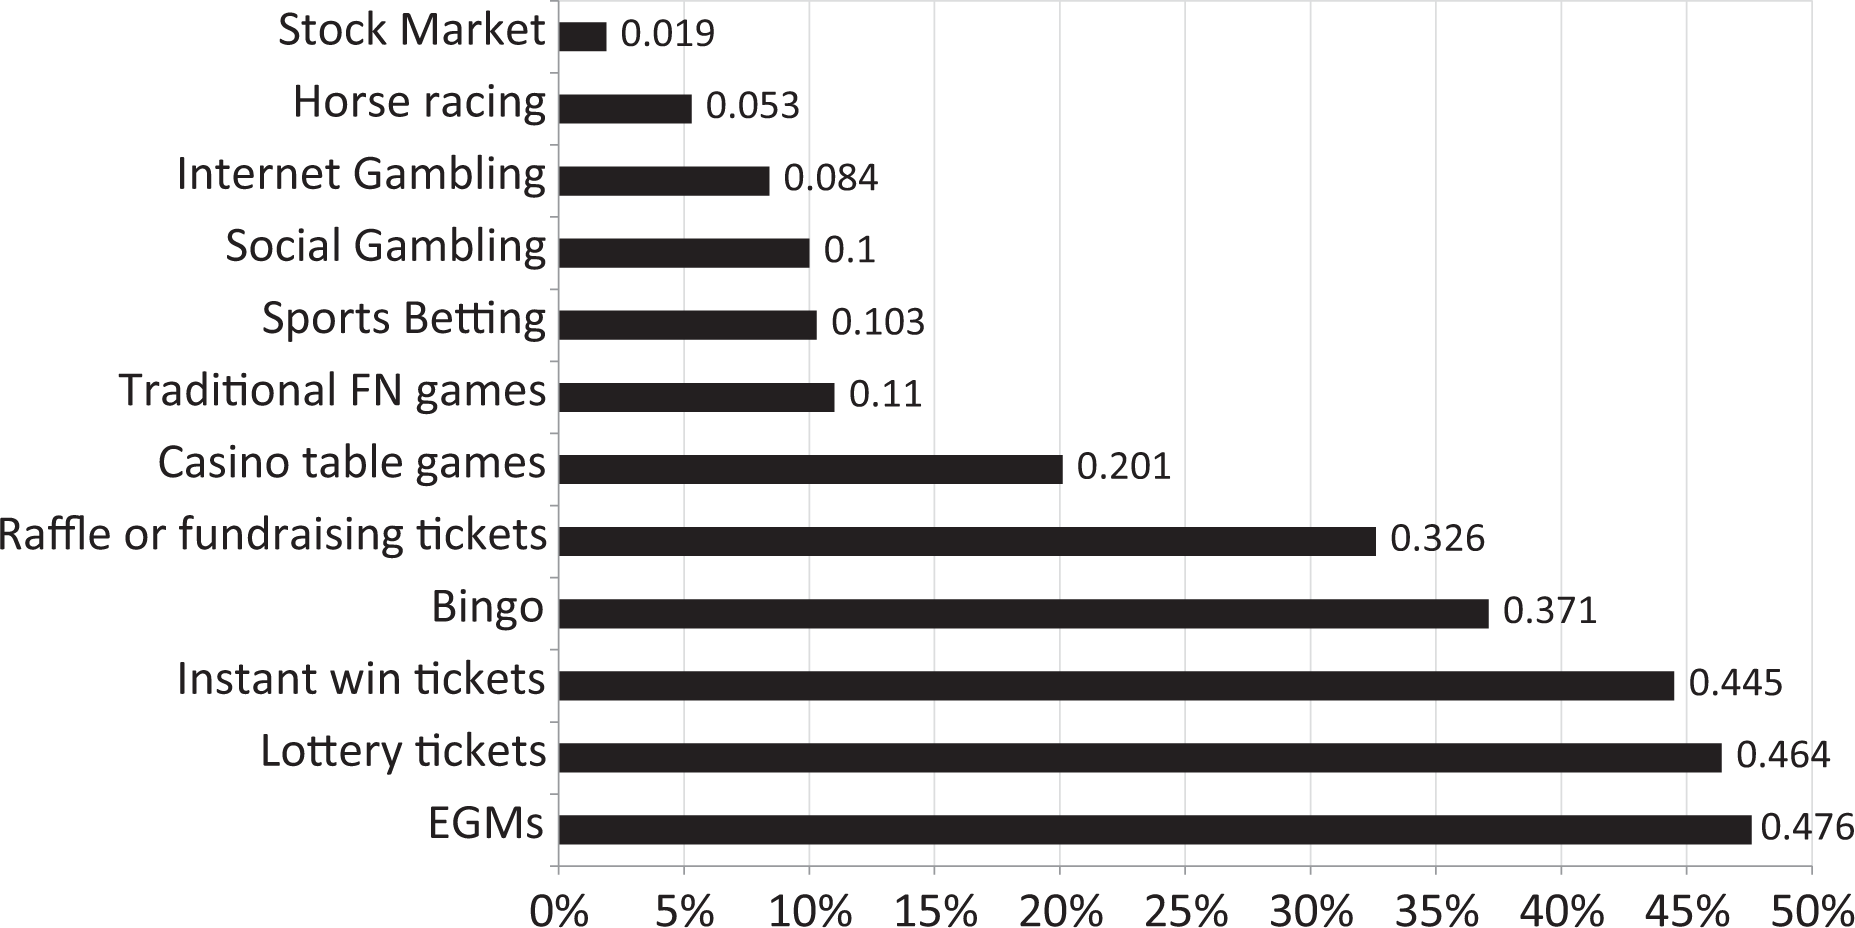
Past year participation rates for each type of gambling.
Binary logistic regression investigated characteristics differentiating people who gambled in the past year versus people who did not. Seven predictor variables were used: city, Aboriginal group, gender, age, educational attainment, employment status, and income. All nominal variables were dummy coded. Entry of the variables into the equation was simultaneous. A test of the full model with all 8 predictors against a constant-only model was not statistically significant, χ2 (36) = 45.0, P = 0.15, indicating that the 8 predictors, as a set, could not distinguish between the gamblers and nongamblers. The variance accounted for was also very low, with Nagelkerke R 2 = 8.5%.
Level of Gambling Involvement
For gamblers, the average number of formats engaged in was 3.1 (median, 3; mode, 1), and the average net monthly gambling expenditure was $188.27 ($40, median; $20, mode). As seen in Figure 3, the modal frequency of gambling was a few times a year, and the median frequency was once a month, but 13.8% of the sample reported gambling a few times a week or more.
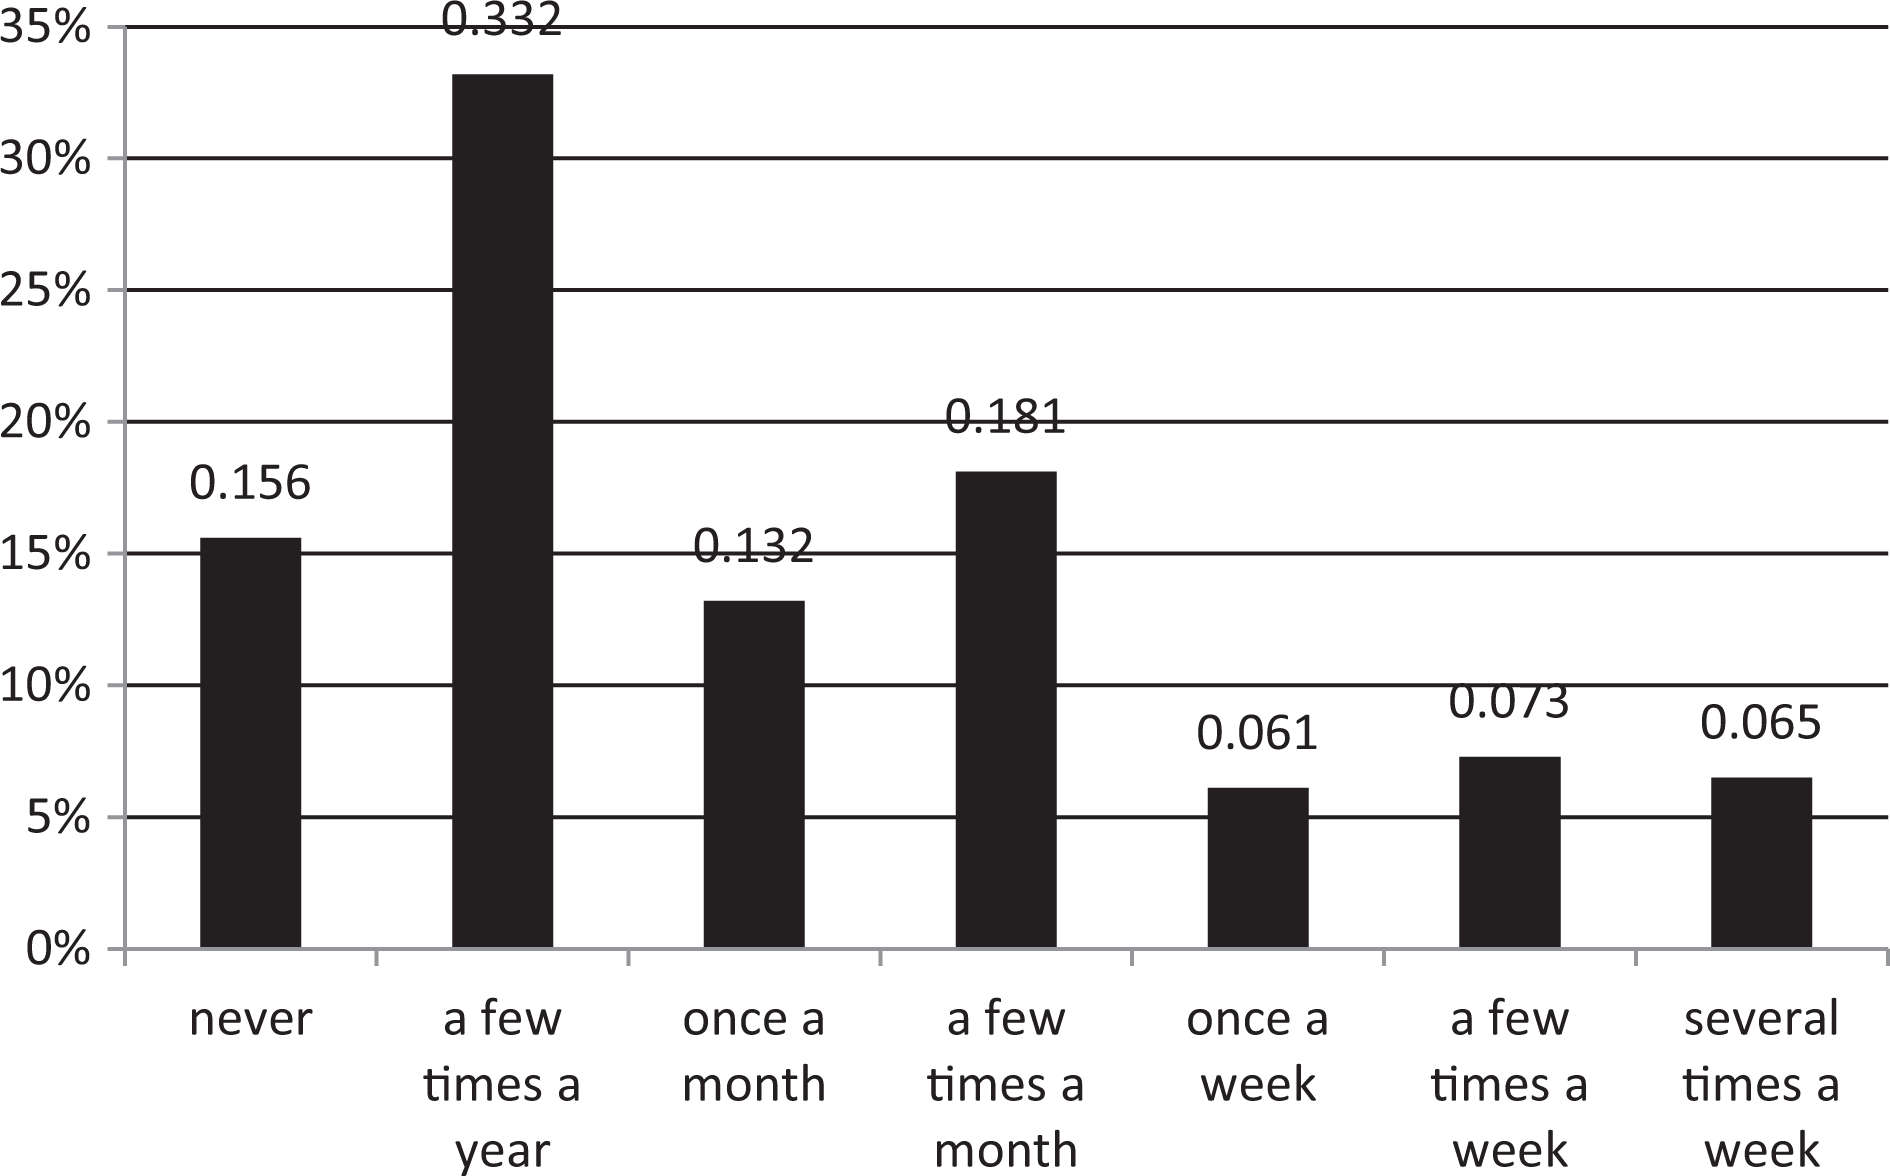
Frequency of gambling in the past year.
Problem Gambling
Figure 4 illustrates that a total of 17.2% of the sample met PPGM criteria for pathological gambling, and an additional 10.0% met criteria for problem gambling, for a total rate of problem and pathological gambling of 27.2%. An additional 15% were categorized as at-risk gamblers. The most commonly reported problems for problem and pathological gamblers were financial problems (71.5%), mental health problems (65.9%), relationship problems (54.6%), work or school problems (36.1%), health problems (21.5%), and illegal activity (22.5%).
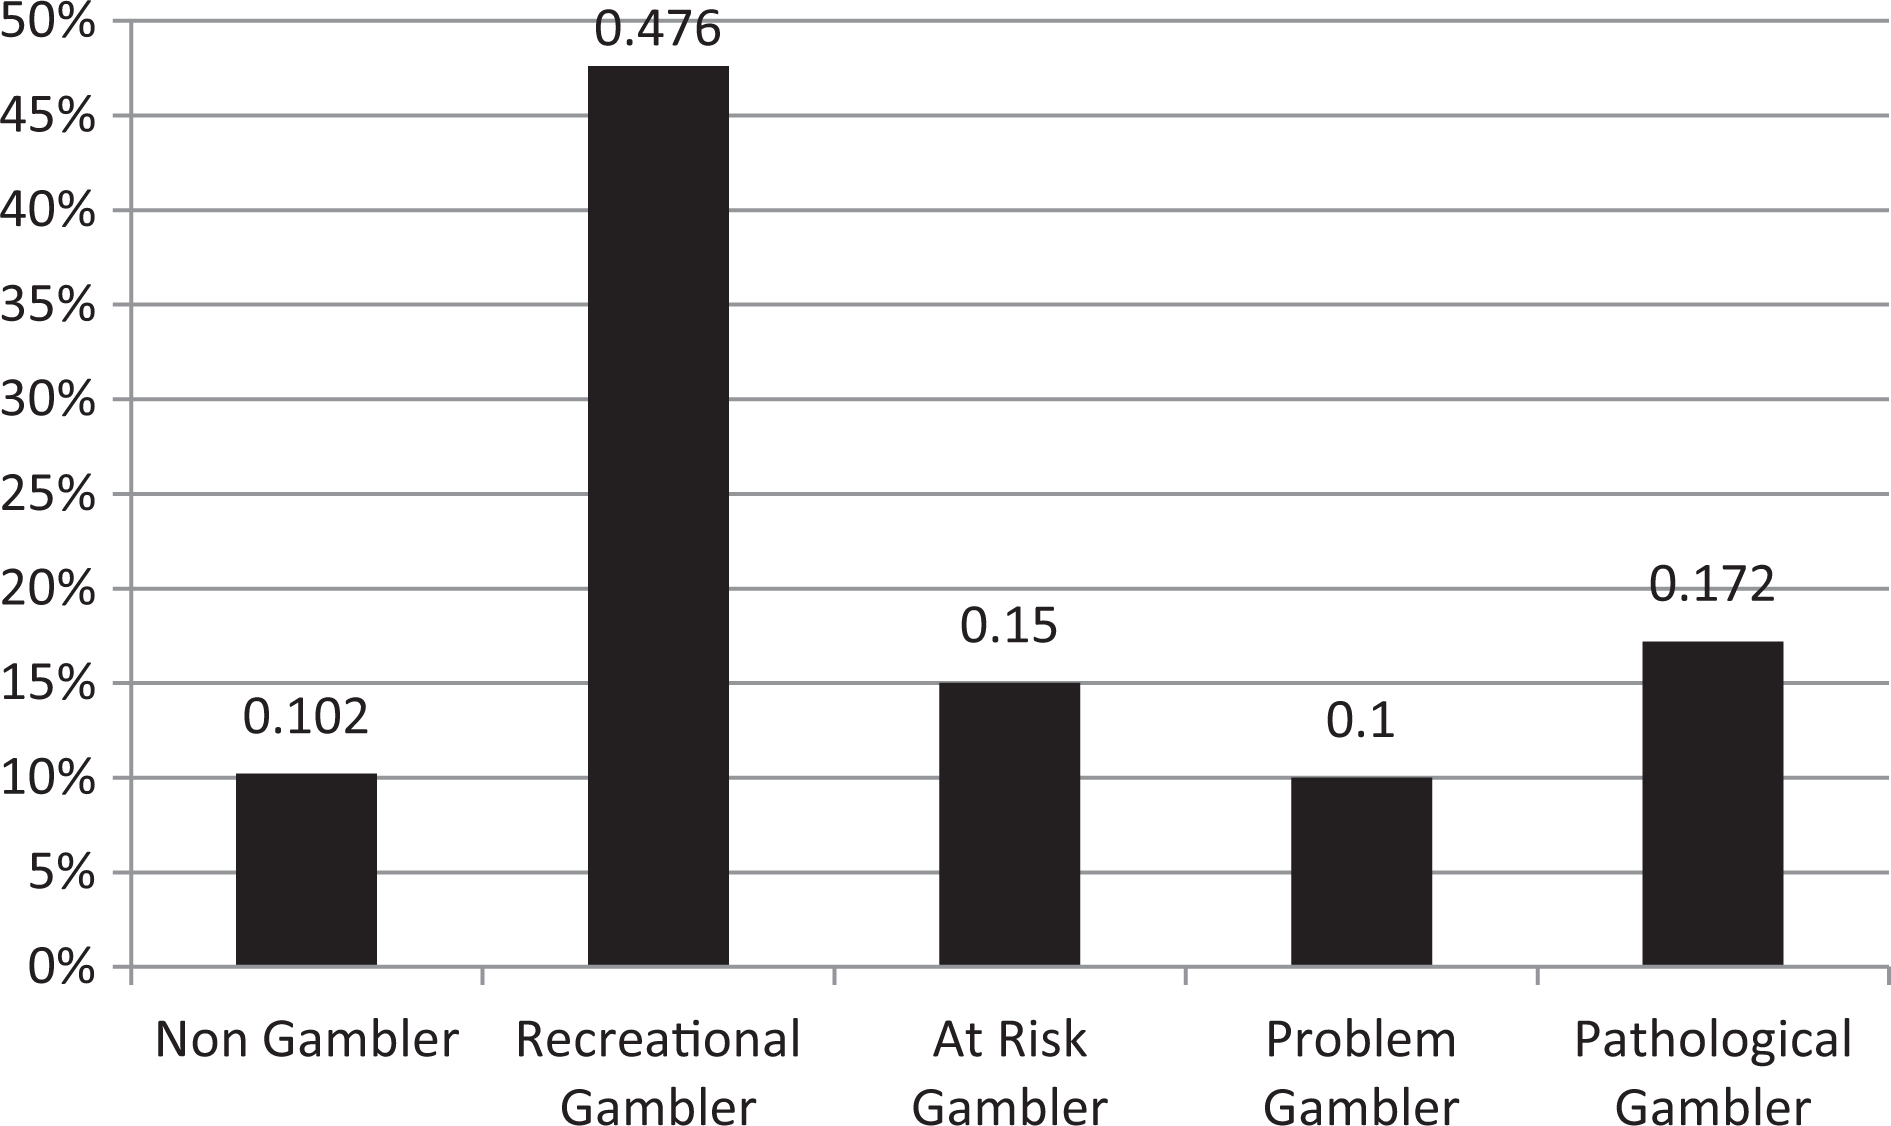
Prevalence of each gambling category on the Problem and Pathological Gambling Measure (PPGM).
All problem and pathological gamblers were asked whether there was a particular type of gambling that had caused more problems than others. Only 25.5% indicated that there was. For those who did indicate a particularly problematic form, the most commonly identified was slot machines (62.0%), video lottery terminals (12.7%), and bingo (11.3%).
A total of 67.7% of problem/pathological gamblers indicated they were aware of the treatment services that were available for problem gambling in their local area. However, only 10.3% had sought help for gambling problems in the past year.
Binary logistic regression investigated characteristics differentiating people who were nonproblem gamblers (i.e., recreational and at-risk gamblers) from people who were problem or pathological gamblers using the same procedures as before. A test of the full model with all 7 predictors against a constant-only model was statistically significant, χ2 (36) = 128.3, P < 0.001. The variance accounted for was fairly low, however, with Nagelkerke R 2 = 17.4%. In order of importance, the variables that significantly predicted problem and pathological gambling status were city, gender, and employment status. The prevalence of problem/pathological gambling was significantly higher in the cities of The Pas (50.7%), Thompson (47.6%), Prince Albert (39.6%), Regina (37.8%), and Winnipeg (32.9%) compared to Swift Current (9.5%), Grande Prairie (14.4%), Edmonton (14.7%), and Calgary (14.9%). Note: There was no significant difference in the prevalence rate in cities having First Nations casinos (26.2%) versus cities that did not (26.0%). The rate among males (32.6%) was significantly higher than the rate for females (21.8%). Unemployed people (36.6%) and homemakers (33.3%) had significantly higher rates than students (16.3%).
Discussion
The purpose of the present study was to understand the gambling behaviour of urban Aboriginals in Canada’s Prairie provinces of Alberta, Saskatchewan, and Manitoba. In terms of gambling participation, 89.8% of the sample had gambled in the past year, which is significantly higher than is typically found in the Canadian population or Western countries more generally. 8,13 However, it is consistent with what has been found in other North American Aboriginal populations. 2 The pattern of gambling involvement observed is also similar to what has been found in other Aboriginal populations and is somewhat distinct from what is typically seen amongst non-Aboriginals. Participation in traditional First Nations games is obviously unique to Aboriginals, but only a small minority (11%) reported engaging in them (similar to the low rate found in other studies). 2 In terms of Western forms, urban Aboriginals have an unusually high level of past-year involvement with electronic gambling machines (47.6%), instant lotteries (44.5%), and bingo (37.1%). By comparison, the most recent prevalence studies in the Canadian Prairie provinces indicate the past-year adult participation rate for electronic gambling machines (EGMs) to range from 15% to 28%, with 28% to 42% for instant lotteries and 5% to 13% for bingo. 8 Bingo’s popularity may be attributable to the fact that historically, Western churches (particularly the Roman Catholic and Anglican) spent considerable time with Aboriginal people in their efforts to convert them to Christianity. Because these same religions routinely used bingo for fund-raising, they also introduced large numbers of Aboriginal people to one of the few legal forms of gambling that existed prior to the modern era of gambling expansion. 1,9 The reason for the higher rate of EGM and instant lottery play among Aboriginals is less clear, although EGM patronization may also be partly due to familiarity and exposure, as many bands now commercially provide this form of gambling. It also may be relevant that these forms of gambling can also be engaged in with a minimal amount of social interaction.
As was found in a previous study, 2 level of gambling involvement among urban Aboriginals in the present study also tends to be high relative to the non-Aboriginal population, with the average number of formats engaged in being 3.1, the average net monthly gambling self-reported expenditure being $188.27, and the median frequency being once a month (with 13.8% reporting gambling a few times a week or more). (It should be expected that expenditure data will be less reliable than the other self-reported data in this study.)
This high level of gambling involvement translates into a very high level of problem gambling, with 17.2% of the sample meeting criteria for pathological gambling and an additional 10.0% meeting criteria for problem gambling. Not only is the prevalence quite high, but so is the level of severity. It is unusual to have lower rates of problem gambling relative to pathological gambling, as the latter requires a greater number and range of problems relative to problem gambling. 13 The obtained prevalence rate is also markedly higher than the 13.9% found for North American Aboriginals in a previous study 2 but very similar to the rates found in another study 5 for urban Aboriginals in Edmonton, Alberta. It is also markedly higher than the rates found in most Western countries, which average 2% to 3%. 13 These higher rates of problem gambling are not likely due to living in an urban setting, as previous research has found off-reserve First Nations people to have somewhat better physical and mental health compared to on-reserve First Nations people. 14 –16
Most problem gamblers (74.5%) did not indicate there to be a particular type of gambling that had caused more problems than others. This is consistent with what is typically found in other studies 17 as problem gamblers tend to be versatile, involved in many different types of gambling (averaging 4 in the present study). Although 67.7% of the sample indicated they were aware of the treatment services that were available for problem gambling in their local area, only 10.3% of problem and pathological gamblers had sought help for their gambling problems in the past year.
Males had significantly higher rates of problem and pathological gambling (32.6%) relative to females (21.8%), which is consistent with other research on this issue. 13 Unemployment and/or being a homemaker was also predictive of being a problem or pathological gambler. Unemployment is commonly associated with higher rates of problem gambling, 13 which is likely due to unemployment creating greater financial needs. 18,19 There was significant variation in the prevalence of problem and pathological gambling between cities, with the rates being significantly higher in The Pas (50.7%), Thompson (47.6%), Prince Albert (39.6%), Regina (37.8%), and Winnipeg (32.9%) relative to Swift Current (9.5%), Grande Prairie (14.4%), Edmonton (14.7%), and Calgary (14.9%). The basis for these differences is somewhat unclear as the availability of gambling does not differ significantly between these communities. However, these rates are strongly correlated with Aboriginals as a percentage of the city population (as seen in Table 1): r = .82, P < 0.001. Thus, one possible mechanism is that the presence of a high percentage of heavily involved Aboriginal gamblers in a community may normalize and facilitate problematic levels of play. Another observation is that most of the larger cities (with lower rates of problem and pathological gambling) tend to have much larger overall Aboriginal populations. This, in turn, may promote greater social capital and social cohesion. These larger cities also have greater access to more diverse forms of treatments (although it is important to note that the correlation between city size and problem gambling rates was nonsignificant: r = –.27, P = 0.18).
This high rate of problem gambling among Aboriginals is likely attributable to having many more risk factors for problem gambling, such as a greater level of participation in gambling, greater participation in continuous forms of gambling (e.g., electronic gambling machines), different historical cultural beliefs about the forces influencing gambling (i.e., that supernatural forces influenced the outcome and that engaging in gambling activated and promoted the gathering of these forces), 20 –22 younger average age, higher rates of substance abuse and mental health problems, and a range of disadvantageous social conditions (e.g., poverty, unemployment, poor education, cultural stress) that are conducive to the development of addictive behaviour. 2,23 –26 The basis for the especially higher rate among urban Aboriginals in the present study is due to the lower level of educational attainment, income, and employment of the sample relative to the general Aboriginal population.
Although the current emphasis on culturally specific prevention and treatment initiatives and groups likely facilitates better overall engagement and treatment retention, it is not clear from the present results that culturally specific messages or interventions are also needed. Rather, addressing the same generic risk factors would appear to be more important, in particular, the disadvantageous social conditions that are especially prominent among Canadian Aboriginals. 23,27 –29
Footnotes
Declaration of Conflicting Interests
The author(s) declared no potential conflicts of interest with respect to the research, authorship, and/or publication of this article.
Funding
The author(s) disclosed receipt of the following financial support for the research, authorship, and/or publication of this article: This study was funded by a research grant from the Alberta Gambling Research Institute.