
Abstract
We investigate the association of the Child Tax Credit (CTC) program with food insufficiency and related anxieties among families with incomes below $35000. Analyzing the US Census Bureau’s Household Pulse Survey data, our xtprobit specification and estimation reveals the disparate impact of the CTC across demographic and racial divides, a departure from previous work. Subgroup analyses reveal that the final two CTC installments disproportionately benefited Hispanic households and those earning under $25000/year while producing no significant decrease in food insufficiency for black households or those earning $25000–$35000/year. The study indicates that the expanded CTC’s reduction of low-income households’ food insufficiency persisted across the program’s duration. Thus, the expansion achieved its intended purpose by helping to buffer low-income families against the fallout of the disrupted pandemic economy—an important result to keep in mind as policy makers continue to consider modifications to the CTC that improve efficacy and equity.
Keywords
Introduction
The Child Tax Credit is a federal tax benefit in the United States that provides financial assistance to families with children. It has a long history, with several key legislative changes impacting its design and impact on food insufficiency over the years. In this introduction, we offer a brief summary of the history of the CTC and its impact on food insufficiency.
The CTC has its roots as a non-refundable tax deduction in the 1950s. It provided a modest tax reduction for families with dependent children but was not sufficient to address food insufficiency issues directly. From the 1950s to the 1980s, various welfare programs like food stamps and school meal programs were the primary means of addressing food insecurity among low-income families.
The Tax Reform Act of 1986 introduced significant changes to the tax code, including an expansion of the CTC. The CTC became partially refundable, meaning that if the credit exceeded a family’s tax liability, they could receive a portion of the credit as a cash refund. This made it more beneficial for low-income families and contributed indirectly to reducing food insufficiency by providing additional income.
In the late 1990s and throughout 2000s, the CTC underwent further expansions and enhancements. For example, the Economic Growth and Tax Relief Reconciliation Act of 2001 increased the maximum credit amount, and the American Recovery and Reinvestment Act of 2009 temporarily made the credit more generous.
The recent American Rescue Plan Act of 2021 passed during the COVID-19 pandemic stands out as landmark legislation that made even more significant changes to the CTC. The maximum credit amount was increased, and the credit became fully refundable for the year 2021. This meant that even families with little or no income tax liability could receive the full benefit. The credit was distributed in advance monthly payments to eligible families, providing a regular source of income (Internal). These changes were designed to help alleviate financial stress, including food insufficiency, for millions of families affected by the economic challenges of the COVID-19 pandemic. This meant that for the first time, the federal government instituted a quasi-universal child benefit scheme between July and December 2021, delivering advance, regular monthly checks to most households with children.
There is strong evidence that the program proved effective in reducing child poverty (Parolin et al. (2021), and child benefits have become the subject of several legislative proposals recently (Representative Rashida Tallib (2023), Mitt Romney (2021)) and the object of significant political debate (Hammond and Orr, 2021 and Bruenig (2021)). Research on these payments has revealed that the payments decreased recipients’ food insufficiency (Parolin et al. (2021); Shafer et al. (2022)) as families used their newly increased income to purchase food items (Karpman et al. (2021)). This body of work, though, has focused primarily on the program’s first two installments, with later payment cycles thus far going unaddressed in the literature.
The American Rescue Plan Act was expected to have a positive impact on reducing food insufficiency. By providing additional income to families with children, it aimed to alleviate economic hardship and improve the ability of families to afford nutritious meals. By becoming more generous and refundable, low-income families would be able to afford basic necessities, including food. However, research and studies are needed to confirm the real-world effects of such policy changes given all available data. This study, therefore, seeks to ascertain whether the expanded CTC affected low-income recipients’ food insufficiency following the program’s final two installments now that the data are available for that time period. Controlling for a variety of factors including marital status, age, and education level, the analysis also examines the expansion’s effects on various subgroups to determine how its impacts diverged among different racial and income categories. This information may help improve the distribution mechanisms of a permanently expanded CTC and, more generally, to evaluate how households respond to repeated child benefit payments.
The remainder of the paper is organized as follows. Section 2 provides a look into the literature on this subject. Section 3 provides a brief explanation of the theoretical foundations for the research. The data and their sources are the subject of section 4. Section 5 covers the description of the methodologies used, and section 6 presents and discusses empirical findings. In section 7, we offer concluding remarks.
Literature Review
Research on the various impacts of this most recent, expanded version of the CTC is still in its nascent stages, given the program’s age. Much of this recent but growing literature has appeared as working papers in the National Bureau of Economic Research’s archives.
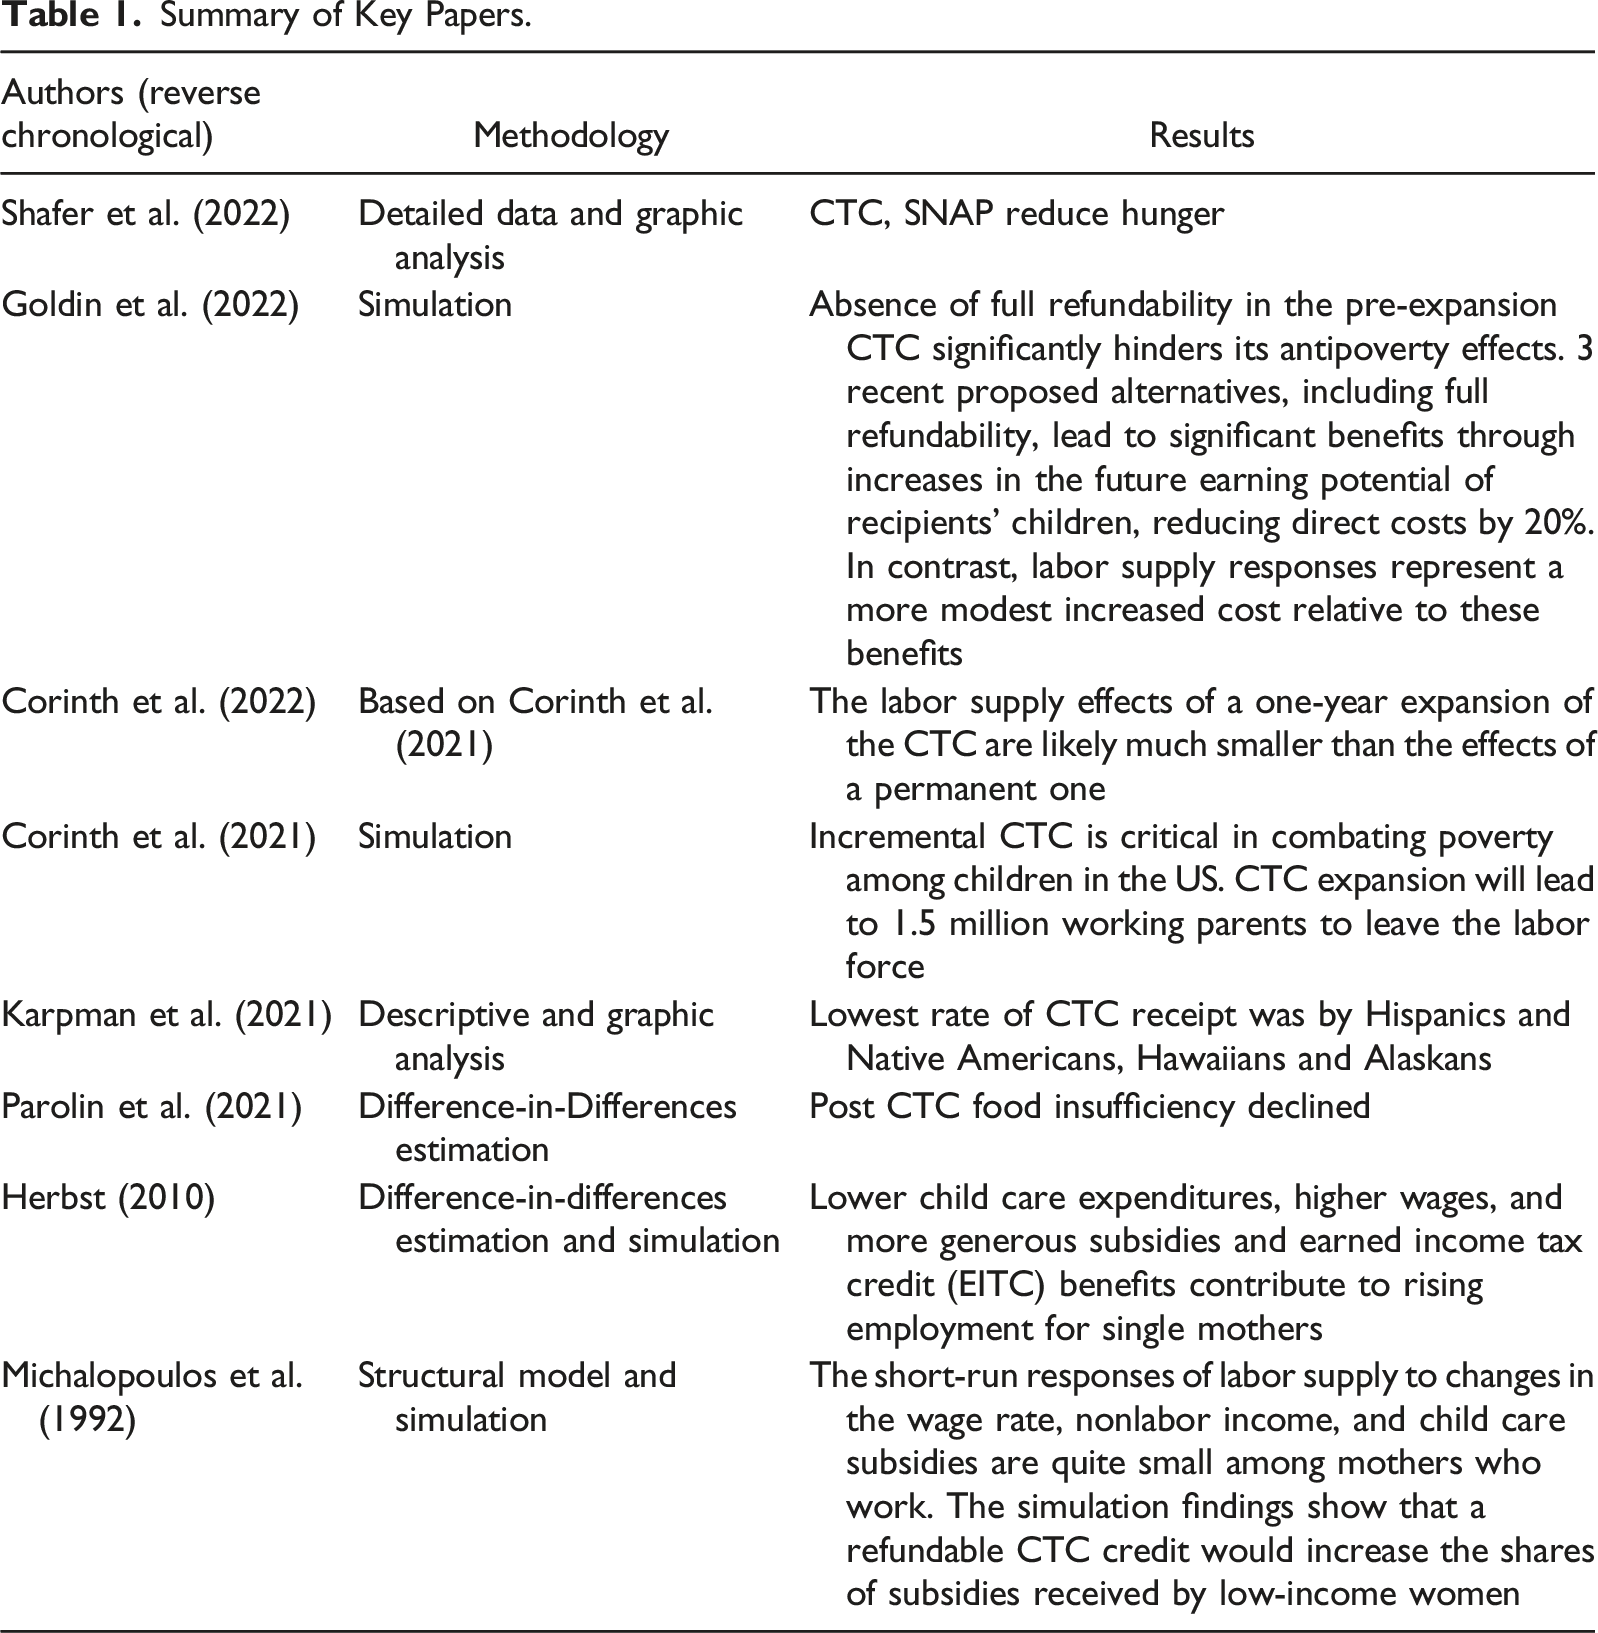
The first area of this literature has focused on the expansion’s effects on labor supply, where results have proved thus far inconclusive (Corinth and Meyer (2022); Ananat et al. (2022)). The two channels by which the expansion could provide negative inducement to employment are the additional income it provides and its transition to full refundability. Using projections derived from work participation elasticities associated with the Earned Income Tax Credit, Corinth and Meyer (2022) found that if made permanent, the CTC expansion would reduce long-run labor supply by 1.46 million workers (almost entirely via the refundability channel). This decline in labor participation would almost entirely eliminate the expanded CTC’s reduction of deep child poverty and diminish its reductions of child poverty generally. The paper’s simulation-based methods imbue it with a useful long-term perspective but also divorce it from the evidence accrued during the program’s real-world implementation. This is an issue rectified by Ananat et al. (2022), whose paper found no significant effects on labor supply when analyzing the program’s effects with evidence from the Current Population and Household Pulse (HPS) surveys, though they acknowledge the limitations of the available data, given the short-term nature of the expansion.
Research prior to this has investigated the relationship between both hypothetical and actual earlier versions of the CTC and labor supply, often zeroing in on female labor supply decisions. In an early paper, Michalopoulos et al. (1992) estimated a structural model of labor supply and child care demand and predicted the effects of a refundable CTC. They found that the short-run responses of labor supply to changes in the wage rate, nonlabor income, and child-care subsidies are quite small among mothers who work and purchase child care. Using the estimated model, their simulation results showed that a refundable credit increases the shares of subsidies received by low-income women, thus increasing their expenditures on market child care. Labor supply also increases, but less so than child care expenditures. The primary benefit of more generous subsidies is that they allow users of high-quality free care to purchase slightly higher quality market care.
Averett et al. (1997) examined the impact of child care costs and the CTC on the labor supply decisions of women with young children. The sample of 749 women between ages of 21 and 29 are from the 1986 wave of the National Longitudinal Surveys of Labor Market Experience of Youth (NLSY). The wage and income variables pertaining to the 1986 calendar year are from the 1987 wave of the NLSY. Incorporating the cost of child care into a structural model of labor supply, they explicitly accounted for the piecewise linear nature of the budget set created by the presence of the CTC and the federal income tax system. Deploying this method, they simulated the effects of policy changes to the CTC. They found that government subsidies to child care increase labor supply. Their policy simulations showed that an increase in the value of the CTC would have a much larger effect on labor supply than other indirect policies like an increase in the annual expenditure limits of the subsidy.
Herbst (2010) investigated the association of child care expenditures and wages with the employment of single mothers. His empirical findings based on the data from the Current Population Survey (CPS) and the Survey of Income and Program Participation (SIPP) for the time suggested that lower child care expenditures, higher wages, and more generous subsidy and earned income tax credit (EITC) benefits contribute to rising employment in this segment of the population. Findings also showed that the employment effects of child care subsidies and EICTCs are not homogeneous. The supply of labor by mothers with higher child care costs showed higher sensitivity to child care subsidies, while EITC has the largest labor supply effects for mothers with lower wages.
The primary area of research around the expanded CTC, though, has been attempts to evaluate its effects on various measures of recipients’ material well-being (Parolin et al. (2021); Shafer et al. (2022)). Such a focus is warranted, given that the principal aim of the program was to alleviate the pandemic’s anticipated negative impact on families’ financial security. Even Corinth et al. (2021) and Ananat et al. (2022) place their work on labor supply in an antipoverty context, with the principal conclusion of the former paper being that the expanded CTC’s negative inducement to work would drastically reduce its antipoverty effects, and the principal conclusion of the latter paper being the opposite.
Recent analysis of the US Census Bureau’s Household Pulse Survey (HPS) has yielded more granular information about the effect of the now expanded, fully refundable CTC on outcomes like food insufficiency, rent, and general expenses. Both Parolin et al. (2021) and Shafer et al. (2022) used this pandemic-era survey to demonstrate that the expanded CTC reduced household food insufficiency over its first two payment installments. Parolin et al. (2021) examined difficulty with rent and general expenses as well, finding that the expanded CTC had no significant impact on either of these financial difficulties. Our work builds on these contributions, centering on food insufficiency. We aim to estimate the expanded CTC’s effects on food insufficiency during the later payment cycles which have not yet been studied, in this way providing another check as to whether the payments indeed reduced food insufficiency and evaluating whether these reductions, if present, persisted throughout its duration.
The expanded CTC takes place in the context of prior scrutiny of the impacts of earlier versions of the CTC (Goldin et al. (2021)) and possible replacements (Goldin et al. (2022); Corinth et al. (2021)). In an early survey paper centered on improving efficiency and equity in the distribution of US child care benefits, Robins (1990) noted that few low-income families were eligible for tax-based subsidies under the 1980s version of the CTC. Given this and the relative growth during that period of tax-based subsidies like the CTC over direct subsidies, this caused growing inequity in the distribution of federal child care benefits in the aggregate. He noted no less than 20 federal programs providing child care assistance at the time, often overlapping and fragmented, but also the relative decline of the more direct subsidies benefiting lower income families, including funds directly provided to providers of child care services. In his analysis four basic principles for an ideal child care system are discussed: flexibility, equity, simplicity, and target efficiency. Robins proposed a two-tiered system that foreshadows recent developments, particularly through its centerpiece: a redesigned, more progressive, fully refundable CTC that is made available monthly, rather than annually at tax time. His simulation analysis revealed that the approach has a similar cost to other child care bills in contention at the time.
Several early papers on the evolving early iterations of the CTC focused on tax incidence to understand the distribution implications of the credit itself. To determine regressivity of the CTC in the early 1980s, Dunbar and Nordhauser (1991) applied three measures of tax progressivity to a sample of taxpayer data, looking specifically at the time period 1979-1986. This was in part to address lasting perceptions that the credit was regressive, despite a 1981 modification that attempted to make the tax credit more progressive. Their analysis, which utilized annual income to measure ability to pay, found that the credit as utilized was in fact progressive over the entire period, becoming more so after the 1981 modification. This finding does not refute the general point that many of those in the lower income quintiles at the time were not actually able to use the credit.
Using a slightly broader range (1979–1988) of the same tax data, Altshuler and Schwartz (1996) built on Dunbar and Nordhauser (1991) by calculating incidence measures using both annual and “time exposure” income to measure ability to pay. They argued that annual snapshot income can be misleadingly high or low given transitory fluctuations in income flows in given years for a family, and that time exposure income—an alternative to hard-to-collect lifetime income data—can partially control for this. Both the income and the time exposure approaches indicated that the benefits of the credit are progressively distributed. Replacing annual with time exposure income increases the proportion of the credit received by lower income taxpayers and yields a more even distribution of benefits across middle-and upper-income taxpayers. In an aside in an analysis of 1983 income taxes, they noted that virtually all taxpayers with dependents in the lowest decile and more than 50% of taxpayers in the second decile had no tax liability and thus were not able to use the credit, pointing out that a refundable tax credit might increase utilization in these deciles but also noting that parents must work to enable this. Their general results indicated that the 1980s CTC does provide some relief to working families with low average income, with average effective credit rates decreasing monotonically with time exposure income.
Summary of Key Papers.
In the next section we cover a brief explanation of the theory behind our empirical model.
Theoretical Foundations
In this section, we apply the consumer behavior theory to examine an individual’s decision-making process regarding the consumption of goods which includes leisure as a component and employment which influences income levels. While the discussion in this section is concise, we encourage interested readers to delve into Varian (1992 and 1996) for a more comprehensive exploration of these concepts. Our primary objective here is to methodically demonstrate how the CTC theoretically may influence the consumption of goods including food and labor supply within families.
A family’s utility function can be expressed as a function of employment labor and consumable goods including leisure. Denoting consumable goods as G and employment labor as L the utility function is written as
The household’s budget constraint consists of two parts. Labor income of the family as well as an initial endowment that may be zero for some households. Assuming that P is the price of the consumable goods including leisure, L is the hours of employment outside of the home, W is the wage rate per unit of employment labor supplied by the household, and E is the initial endowment of available resources, equation (2) is the household budget constraint.
The maximum amount of labor income is W*LM, where LM is the maximum number of hours per week available for employment or leisure. The time that a household devotes to leisure in lieu of employment labor, costs the household lost income, which is the opportunity cost of leisure. This amount is W*(LM-L). Therefore, equation (2) may be re-written as equation (3).
Equation (3) means that the maximum amount that the household can spend on the consumable goods G is bound by the initial endowment E and the household labor income. However, E/P = GO, which is the amount of consumable goods G that the household can have without any employment. Thus, equation (3) can be written as equation (4).
Equation (4) can be manipulated and written in terms of G and LM-L to enable us to formulate the constrained optimization problem, that is, maximizing the household utility subject to the budget constraint.
Reorganizing equation (4), the resource constraint for a household may be written in terms of consumable goods and leisure (LM-L) as equation (5).
Equation (1) can be re-written as a function of leisure (LM-L), that is, LR and consumable goods as equation (6).
The optimal choice of G and LR occurs when the marginal rate of substitution between LR and consumable goods G is equal to the ratio of wages and price, W/P, that is, real wages.
The demand for LR by a household is a function of the opportunity cost or price of leisure W. Our focus is on the consumable goods including food. As the price of consumable goods changes, there are substitution and income effects. For instance, if the real price of consumable goods, including food falls as a result of CTC, the substitution effect signals a rise in the household demand for food because of the substitution effect. As food and other consumable goods are expected to be normal goods, the income effect is expected to reinforce the substitution effect. Consequently, the quantity demanded of consumable goods including food rises as CTC reduces the effective food prices for families. The Slutsky equation formalizes this as follows:
The first term in equation (7) is the substitution effect. The second term is the income effect.
Confirming the association between CTC and the food consumption of families (within G) as predicted by equation (7) is the subject of the empirical section of this paper. CTC is expected to reduce effective prices paid by consumers, which, in turn, should improve access to food and alleviate food insufficiency among needy families. However, CTC may also be considered as a boost to wages. Thus, the effect of CTC on the demand for leisure can be derived by considering the substitution and income effects of changes in W on leisure, as given by equation (8).
Equation (8) shows that as CTC raises W, the substitution effect (the first term in equation (8)) leads to a reduction in the demand for leisure at a higher opportunity cost of leisure. However, the income effect induces households to consume more leisure because it is a normal good. Therefore, the net effect on leisure demand, and consequently on labor supply, depends on the relative magnitude of the substitution and income effects. For instance, if the absolute value of the substitution effect exceeds that of the income effect, the demand for leisure would fall, and household labor supply would increase, and vice versa. These theoretical predictions can be corroborated by empirical research. In the following sections of the paper, we summarize our data, methodology, and empirical results in detail.
Data Summary
The data in this study are drawn from the US Census Bureau’s Household Pulse Survey, an initiative which began near the pandemic’s beginning (the first wave began recording responses on April 23, 2020) to quantitatively track Americans’ experiences during the COVID-19 era. Administered as a 20-min online questionnaire, it includes questions on such pandemic-related topics as attitudes toward vaccination, economic well-being, and COVID-19’s impacts on child care, work, and education.
We use publicly available HPS microdata from two time periods. First are the last two survey waves conducted before payments of the expanded CTC began on July 15th: Week 32 (conducted June 9–21) and Week 33 (June 23–July 5). Second are the last two survey waves conducted within a month after payments of the expanded CTC ended on December 15th: Week 40 (December 1–13) and Week 41 (December 29–January 10). Though Week 41 was administered after payments ended, it was conducted sufficiently early to be entirely before the next payment would have been distributed had the program continued, and thus the impacts of the December 15th payment should still be in effect.
We combined these four files into a unified dataset, dropping many survey questions in the process in order to shrink the file to a size appropriate for Stata. There are additionally two important differences between the surveys’ questions themselves. Weeks 32–33 asks only for gender generically (“male” or “female”), whereas Weeks 40–41 asks about both genders assigned at birth (“male” or “female”) and gender identity (where “transgender” and “none of the above” are added to the options). To avoid the addition of categories not present in Weeks 32–33, gender assigned at birth rather than gender identity is used for the “gender” category in the unified dataset. Additionally, Weeks 32–33 do not ask whether respondents received CTC payments (because no payments had yet been delivered). This question is manually added in the unified dataset, with all responses set to indicate nonreceipt of CTC payments during Weeks 32–33.
Percentage of Households Reporting CTC Receipt (Weeks 40–41).
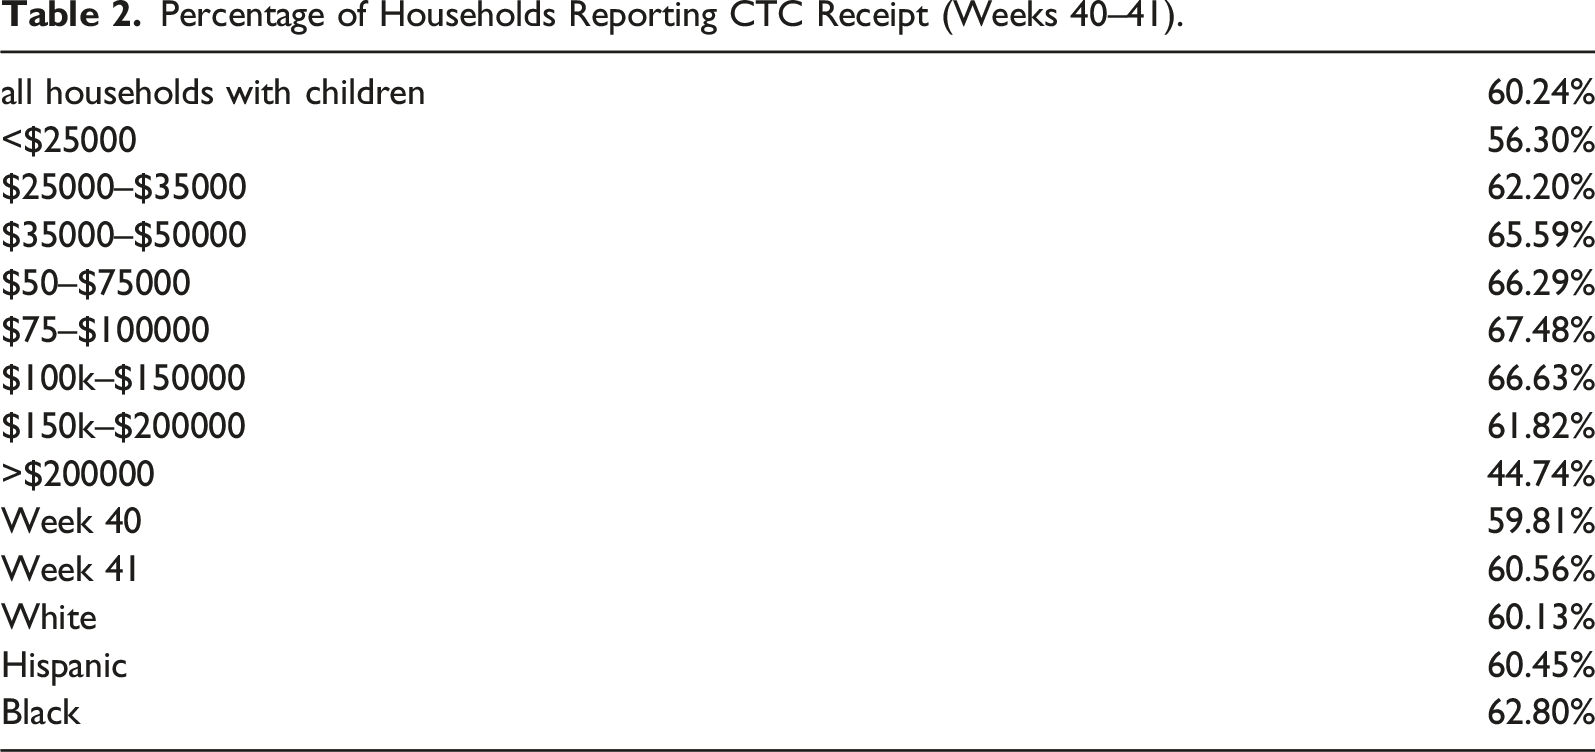
Reported percentages are smaller among the lowest- and highest-earning households, likely a result of low interaction with the IRS and general instability among the former group and of ineligibility for the payments among the higher group. Those making above $200k are particularly unlikely to report receipt, at 44.74%–11.56% lower than the next-lowest group (those making under $25000). There is also no substantial difference between reported receipt in Week 40 (59.81%) and Week 41 (60.56%), allaying concerns that the CTC’s effects may have receded by the time of the Week 41 survey, which was conducted after the last payments were distributed. Last, surveyed blacks (62.80%) are marginally more likely than whites (60.13%) or Hispanics (60.45%) to report receipt.
Demographic Characteristics of HPS Respondents.
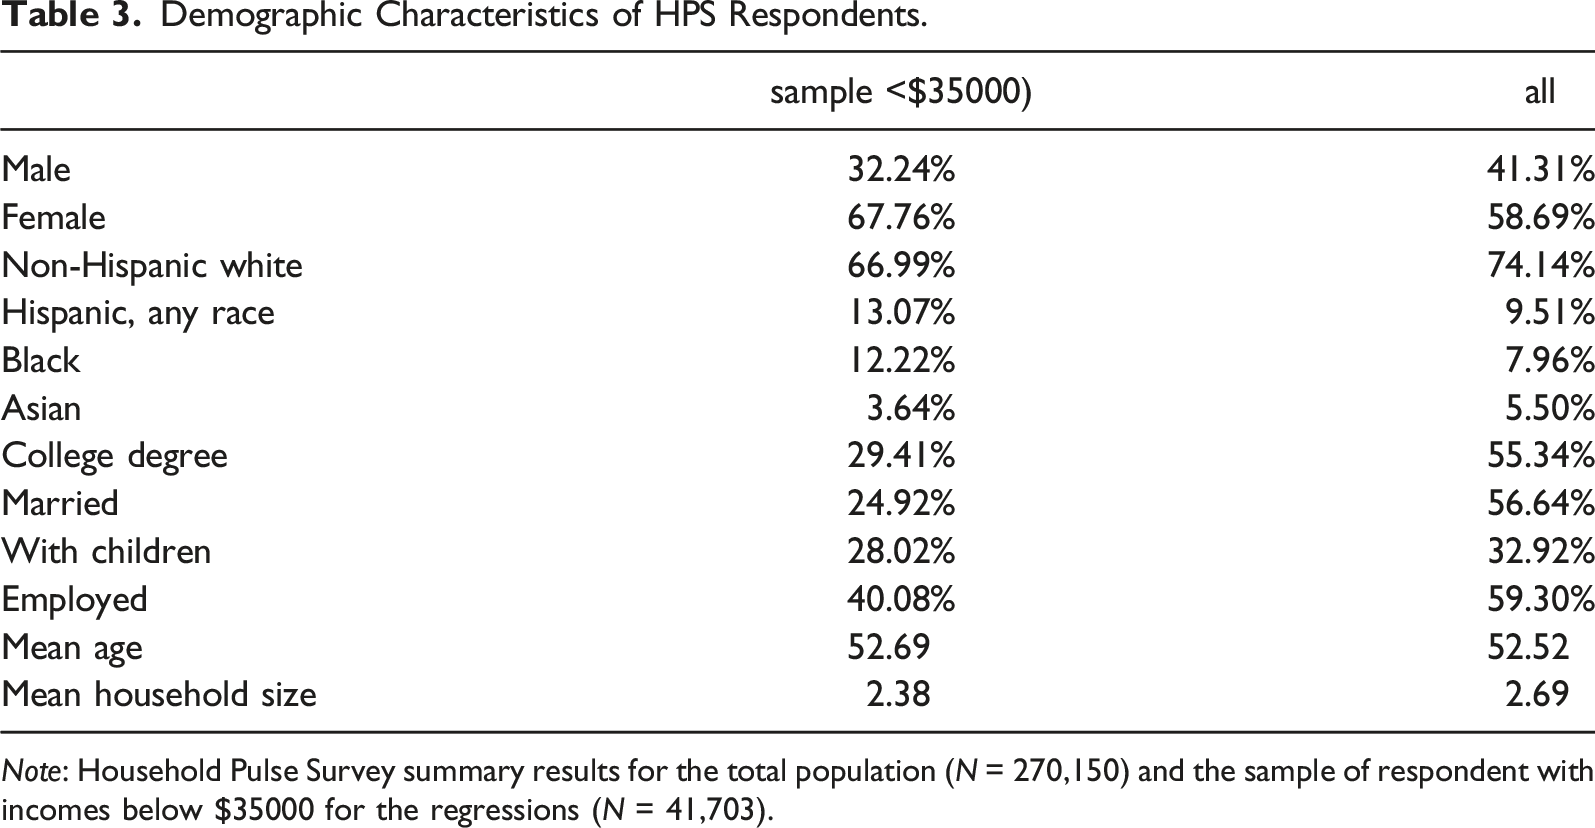
Note: Household Pulse Survey summary results for the total population (N = 270,150) and the sample of respondent with incomes below $35000 for the regressions (N = 41,703).
Most categories additionally contain significant differences between the sample—again restricted to low-income households that have no missing values for variables included in the model—and the general HPS population. Compared to the general population, the sample includes far fewer males (41.31% vs. 32.24%), whites (74.14% vs. 66.99%), and Asians (5.50% vs. 3.64%), and far more Hispanics and blacks (9.51% vs. 13.07%; 7.96% vs. 12.22%), where the first number denotes the population and the second sample fractions, respectively. Similarly, stark contrasts can be drawn with educational attainment (55.34% in the general population have a bachelor’s degree or higher compared to 29.41% in the sample), marital status (56.64% being married vs. 24.92%), and employment status (59.30% having worked for pay in the last seven days vs. 40.08%). Sample households are smaller than population (2.69 vs. 2.38) and less likely to have children (32.92% vs. 28.02%) but are nearly identical in respondents’ age (52.52 vs. 52.69).
We create several variables in order to conform our model to that employed by Parolin et al. (2021) as closely as possible. First is a binary identifier of each response’s temporal location vis-á-vis the CTC; this variable separates responses compiled before CTC payments began (Weeks 32–33) from those compiled after they ended (Weeks 40–41). Next is a binary interaction variable which identifies each respondents’ CTC eligibility; this variable separates respondents eligible for the CTC (those with children in their household surveyed during Weeks 40–41) from those ineligible (those for whom either of the above conditions do not apply). Last are binary indicators of food insufficiency and difficulty with expenses. Responses indicating that households “sometimes” or “often” didn’t have enough to eat or had a “somewhat” or “very” difficult time paying usual household expenses over the last seven days, respectively, are separated from those indicating otherwise.
In accordance with Parolin et al. (2021) study, the regressions focus on low-income households, with their populations limited to respondents who indicate pre-tax income below $35000. After further narrowing the population to exclude responses which do not indicate their household’s income, food insufficiency, marital status, and/or employment status, the sample size is 41,703 (across all four weeks combined), drawn from 270,150 possible observations.
Methodology
Model Variables.
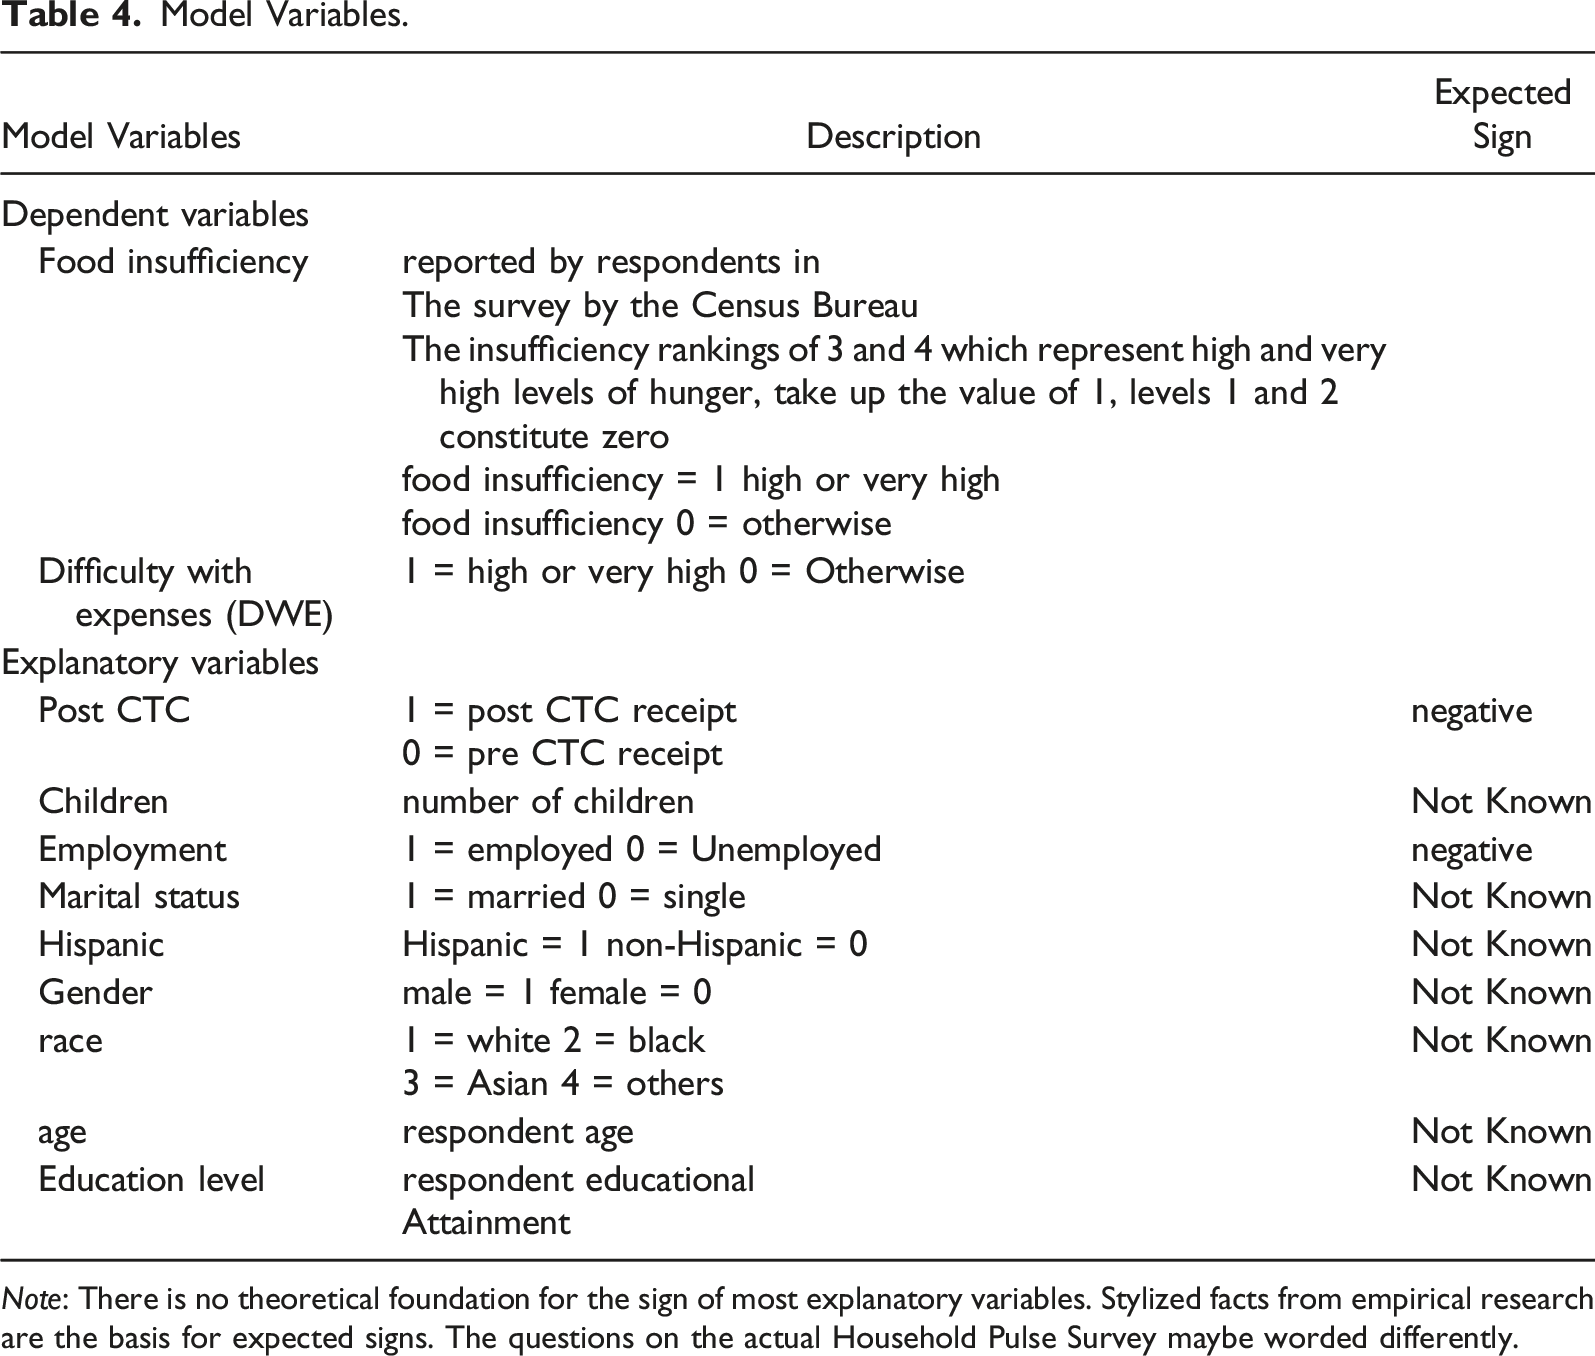
Note: There is no theoretical foundation for the sign of most explanatory variables. Stylized facts from empirical research are the basis for expected signs. The questions on the actual Household Pulse Survey maybe worded differently.
The implicit regression model to be estimated is given by equation (9).
Equation (9) and its variations are the basis of the empirical results reported in Tables 6-10.
We employ difference-in-difference methodology (see STATA manual) to capture the effects of the CTC expansion over time, with the dependent variables being the binary indicators of material hardship. The treatment group is specified with an interaction variable indicating whether the respondent’s household both a) contains children and b) was surveyed after the expansion. This treatment definition captures only the intent-to-treat effect, failing to account for reported receipt of the payments. CTC receipt as reported in the HPS, however, is certainly far below its actual level.
Several subgroup analyses are conducted within the primary treatment model. To estimate the CTC’s effects on different racial groups, we run three additional regressions in which the population is restricted to low-income non-Hispanic white, Hispanic, and black respondents, respectively. While the HPS also included categories for Asian and other/mixed respondents, the sample sizes for these regressions would have been too small to rigorously account for state-level random effects. To estimate the CTC’s effects on different income subcategories, we run two additional regressions in which the population is restricted to respondents making under $25000 and those making between $25000 and $35000. The Parolin et al. (2021) study also contains regressions measuring the CTC’s impact on other indicators of material hardship. While this paper is primarily concerned with food insufficiency, we run a final regression in which the indicator of difficulty with expenses replaces the indicator of food insufficiency as the dependent variable; no subgroup analyses are conducted for this specification.
Xtprobit models are used for nearly all the analyses described above, given the binary nature of the dependent variables and the categorical nature of the independent variables. We control for state random effects, setting respondents’ state residencies as panel data. Parolin et al. (2021) use respondents’ age, gender, and education level as independent control variables; these controls are replicated here, with education level measured on a 7-point categorical scale ranging from “less than high school” to “graduate degree.” Five additional controls are added in the primary regression. Race, categories of which included black, white, Asian, and mixed/other; ethnicity, a dummy variable indicating whether the respondent is Hispanic; marital status, a dummy variable indicating whether the respondent is currently married; household size, ranging from 1 to 10 people; and employment status, a dummy variable indicating whether the respondent has worked for pay within the last week. The race and ethnicity controls are dropped for race-specific sub analyses.
The regression measuring the impacts of reported receipt, meanwhile, is run with probit rather than xtprobit, since its observations are not time sensitive. It does not control for random effects, though it maintains the same eight control variables described above. The use of probit and xtprobit models, while appropriate to the data, unfortunately restricts our ability to draw conclusions about the degree to which the expanded CTC affects the dependent variables. We discuss the empirical findings of the paper in the next section.
Empirical Results
Variance Inflation Factors Among Independent Variables.
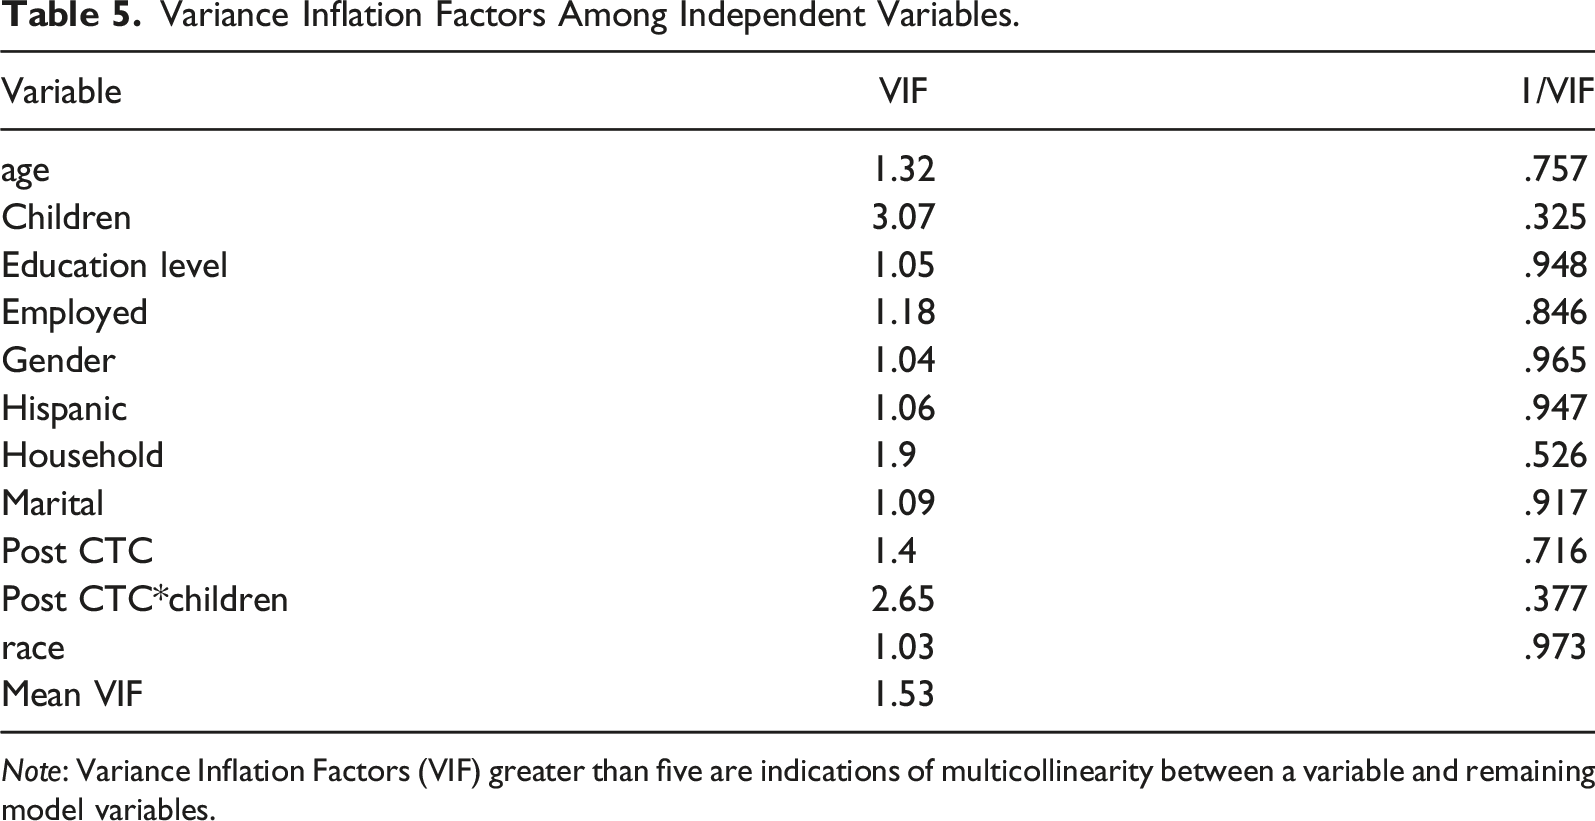
Note: Variance Inflation Factors (VIF) greater than five are indications of multicollinearity between a variable and remaining model variables.
Much like Shafer et al. (2022) and Parolin et al. (2021), we find a negative association between eligibility for the expanded CTC and reported food insufficiency, with Table 6 showing that the primary variable of concern (post CTC*children) is negative and significant (p < .01). These findings are consistent with those reported in Parolin et al. (2021) Tables 2 and 3. Given differences in our sample periods and regression models with those of Parolin et al. (2021), we conclude that our findings are corroborated by their estimation results.
Food Insufficiency Among Households Making <$35000.
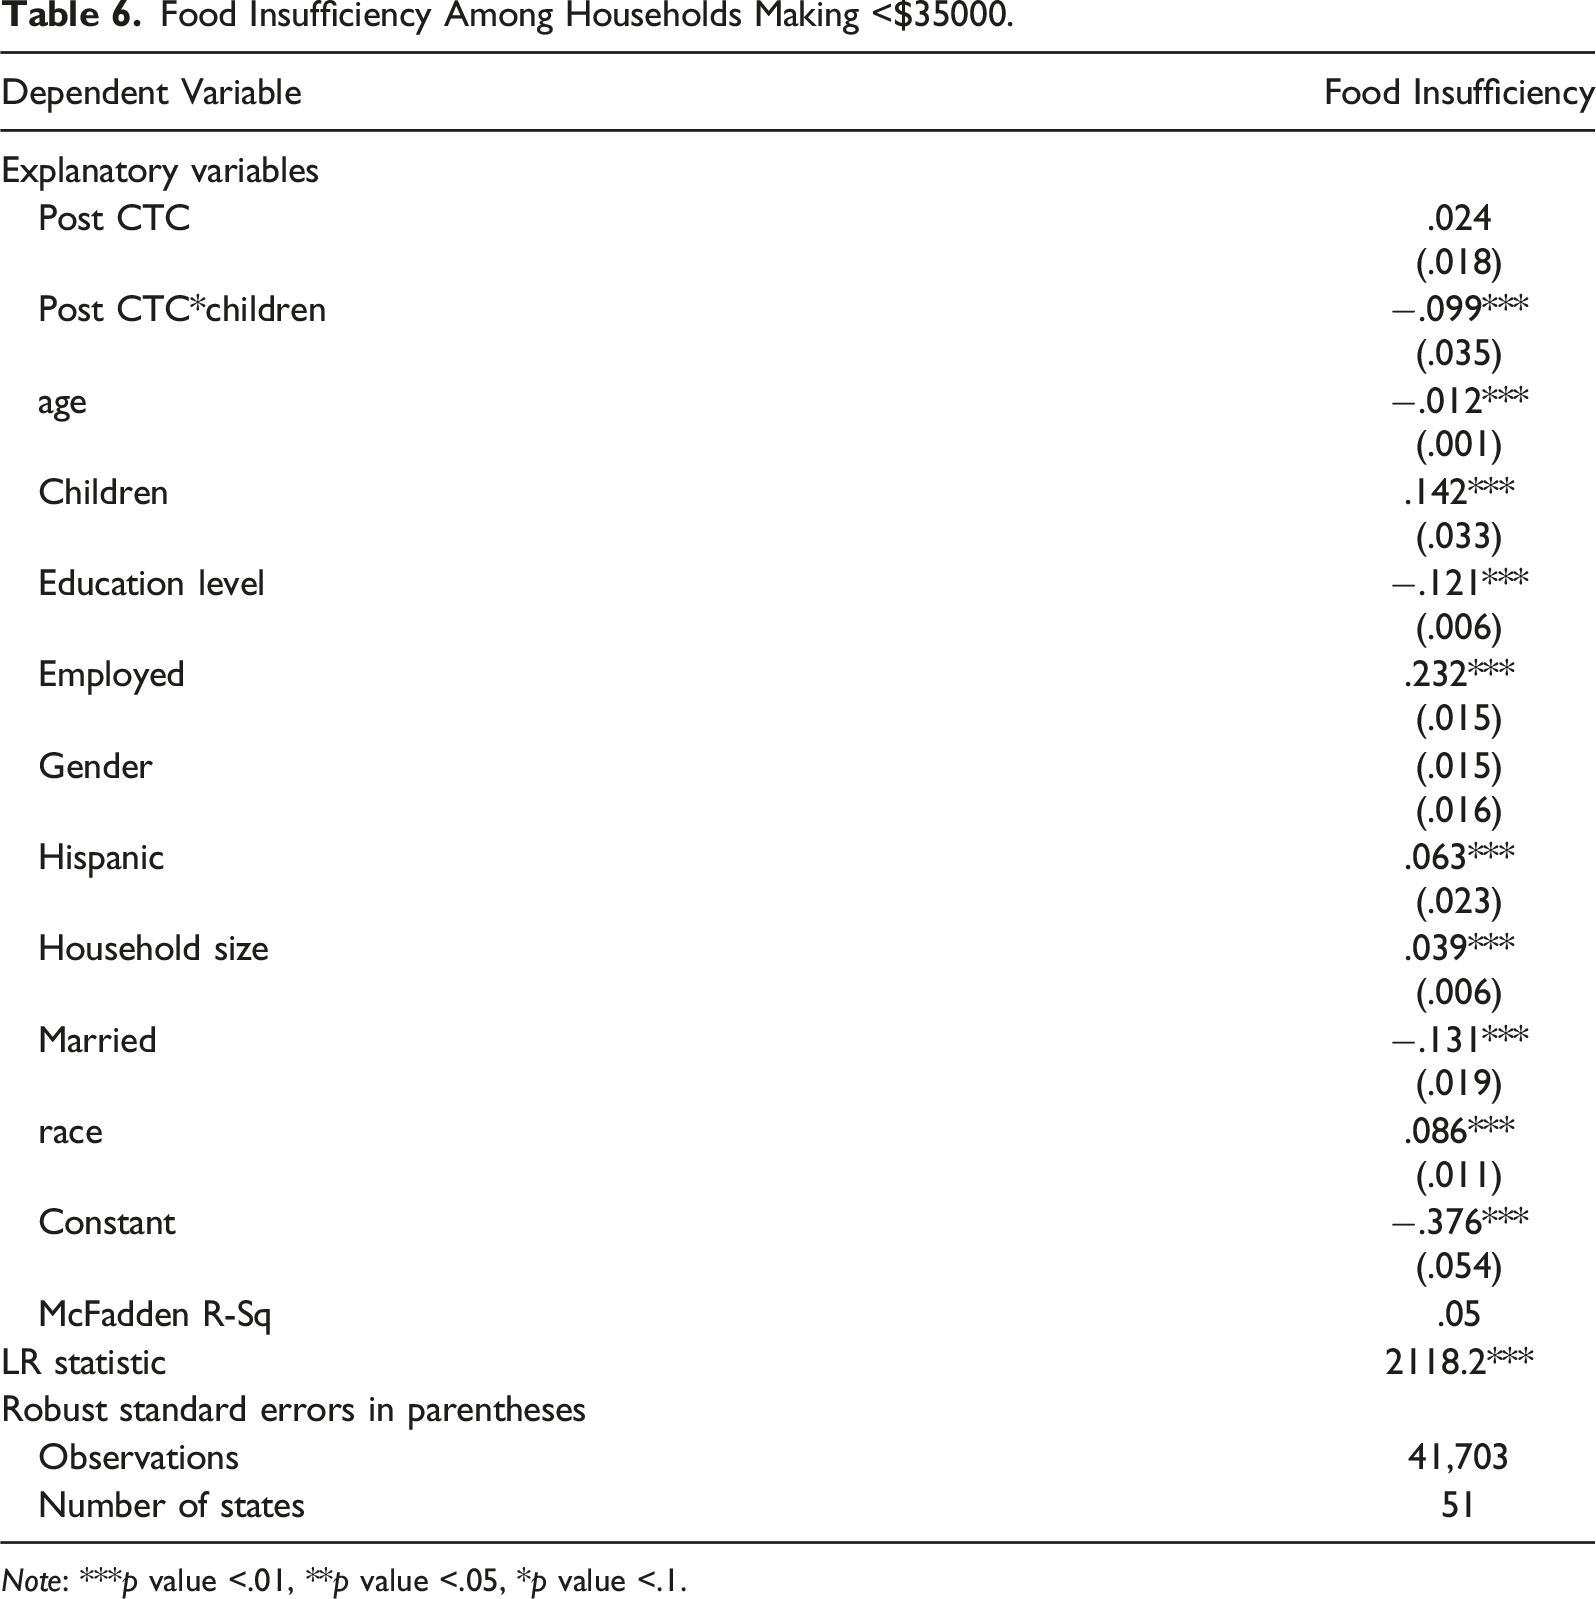
Note: ***p value <.01, **p value <.05, *p value <.1.
We compute the change in the probability of families with income <$35000 experiencing food insufficiency (FI), or the marginal probability with respect to changes in CTC status(
For instance, using the fact that the derivative of the cumulative normal probability with respect to standard normal variable (z) is the standard normal density function we have:
Reported Household Food Insufficiency by Week Among Households Making <$35000.
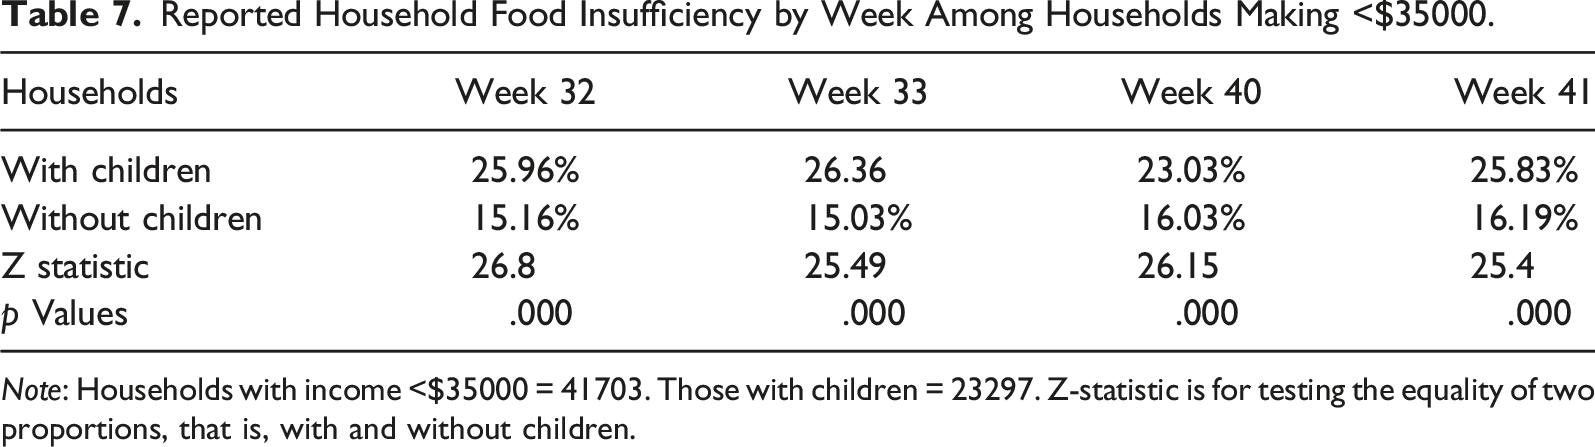
Note: Households with income <$35000 = 41703. Those with children = 23297. Z-statistic is for testing the equality of two proportions, that is, with and without children.
Food Insufficiency Among Eligible Households by Reported CTC Recipients Income <$35000.
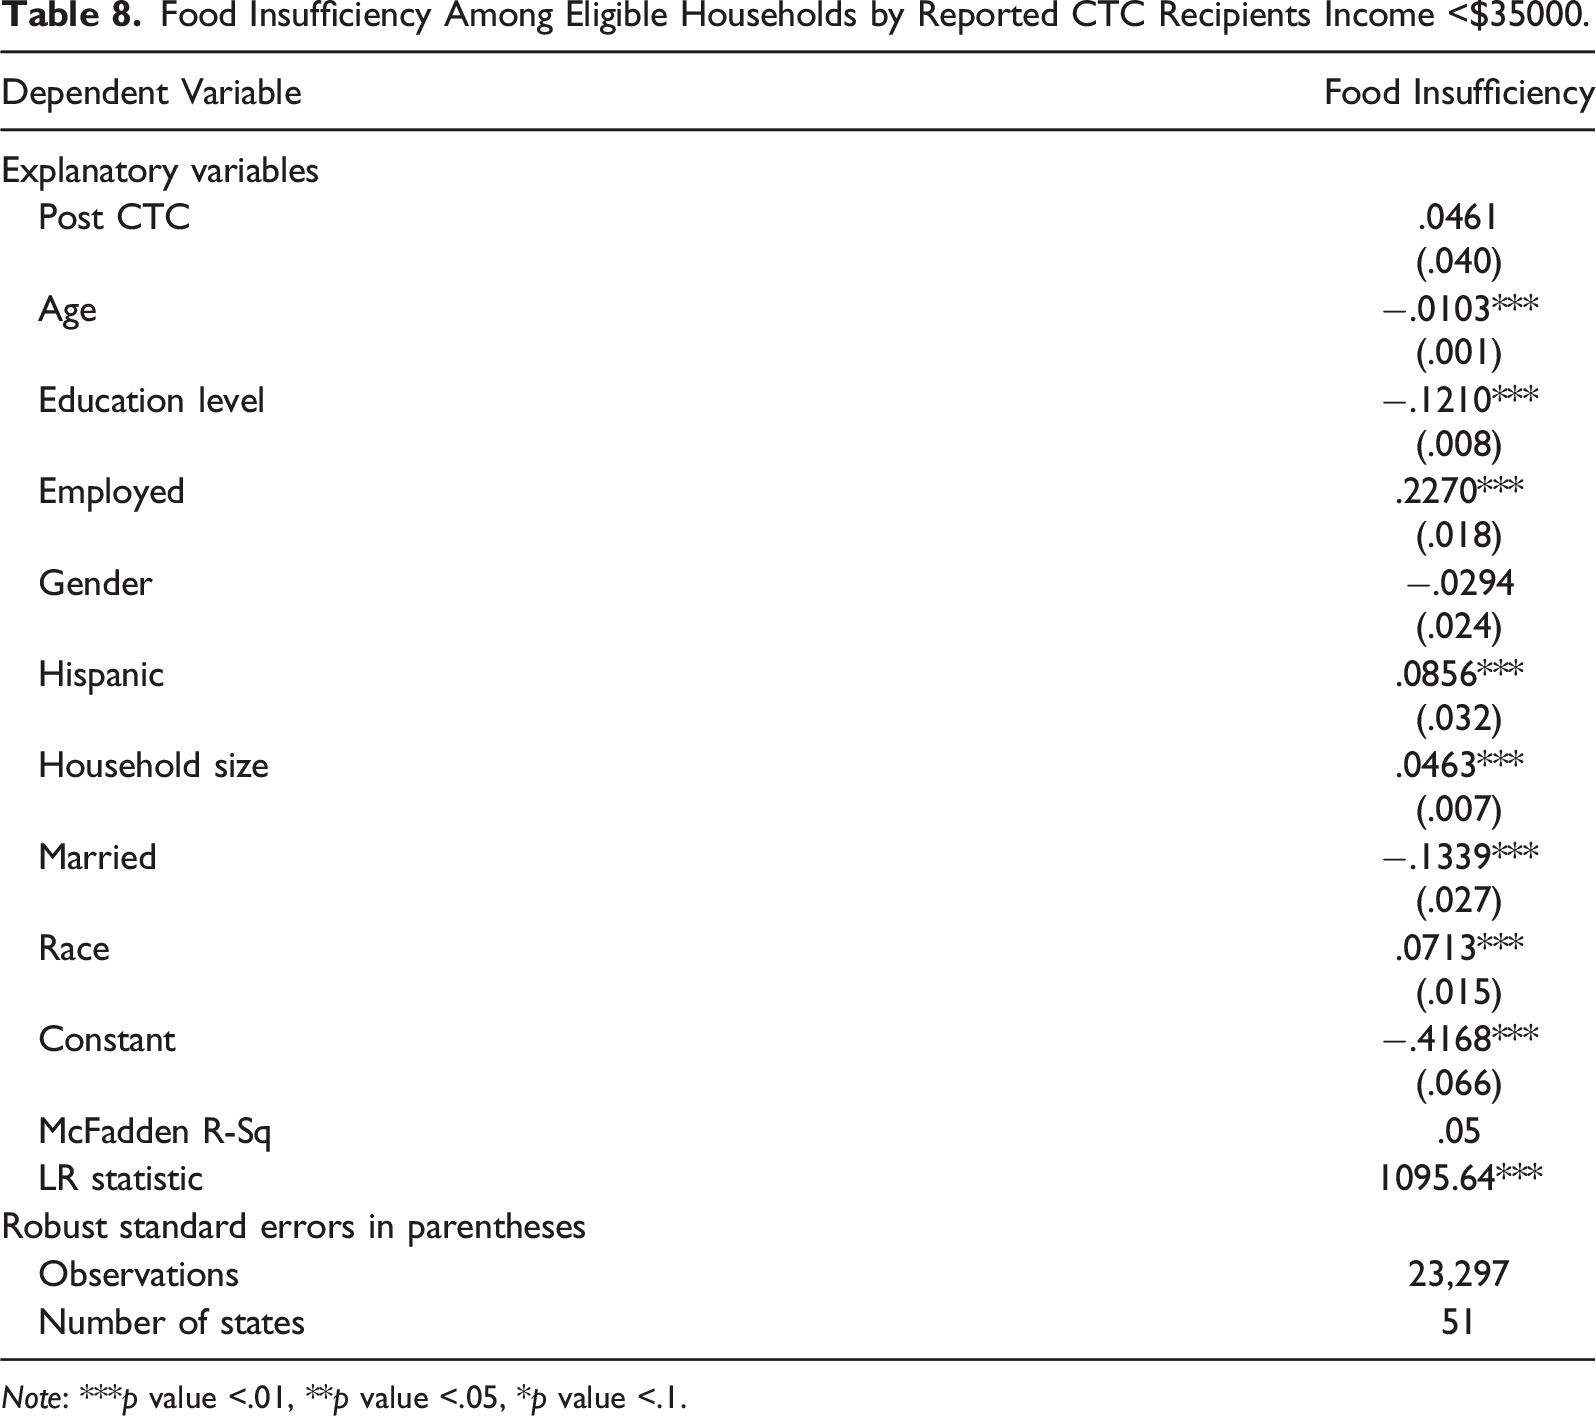
Note: ***p value <.01, **p value <.05, *p value <.1.
Parolin et al. (2021), unlike Shafer et al. (2022), focus more narrowly on low-income (<$35000) households and find much larger effects: a 7.5% decline among eligible households and a 14% decline among eligible households reporting receipt. This large difference between treated and merely eligible groups conflicts with the evidence presented in Table 8, which finds no significant relation between reports of the CTC and food insufficiency among eligible households. However, the regression from Table 8 is more rudimentary than that used by Parolin et al. (2021), as it restricts the sample to only eligible low-income households and is therefore not a difference-in-difference model.
Food Insufficiency Among Income and Race Subgroups.
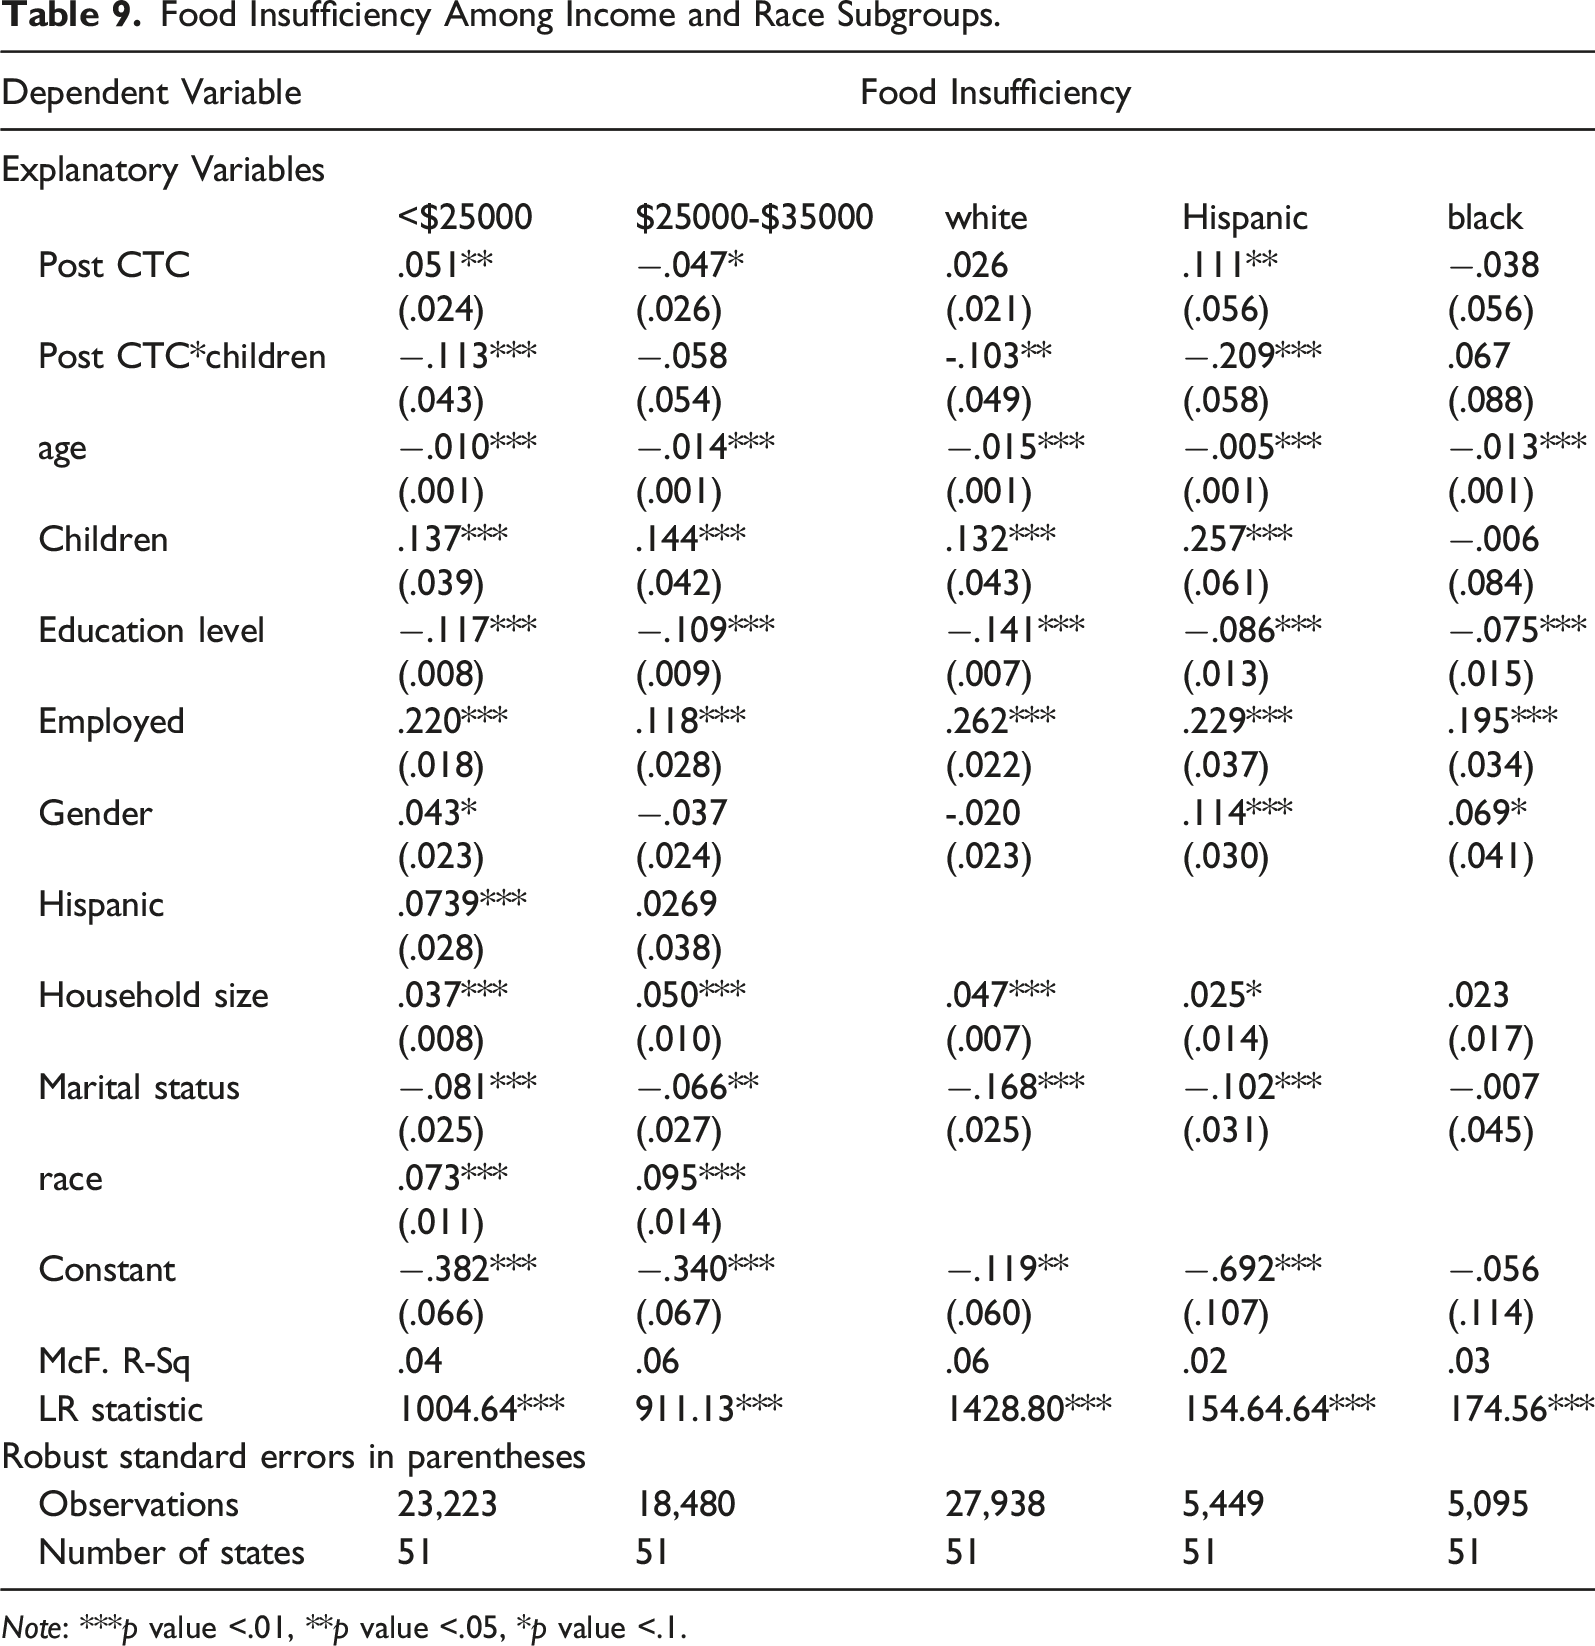
Note: ***p value <.01, **p value <.05, *p value <.1.
The findings suggest that the CTC’s benefits on food insecurity are concentrated among specific demographics, a result that is somewhat at odds with previous research and with the near-universal distribution of the benefit. While both Parolin et al. (2021) and Shafer et al. (2021) also find that Hispanics’ food insufficiency drops most precipitously among racial groups, their analysis reveals that all groups are significantly affected by the program, including blacks.
Hardy (2022) highlights that when we focus on individuals with lower incomes, the volatility in employment for black individuals becomes more pronounced. For instance, these disparities can be as significant as 10 percentage points or more when comparing black and white household heads at the 25th and 10th percentiles of their respective income distributions. Moreover, in lower income brackets, families typically possess fewer savings and higher levels of debt. These findings are likely applicable to other subgroups of families living in poverty as well. It can be argued that the incremental impact of the CTC on incomes below $25,000 may be more substantial, as the CTC constitutes a larger percentage of family income. For instance, with a fully available maximum CTC funding of $3000 (or $3600 for children below the age of 6) in 2021, this would represent a 12% increase in family income. In contrast, at higher income levels around $35,000, this amount would equate to roughly 8.5%, diminishing the program’s effectiveness significantly.
This observation suggests the need to adjust the CTC to account for its relative impact on the available resources of households. However, it is important to acknowledge that such an adjustment would require additional administrative resources and available funds. The experience with the CTC during the pandemic years of 2020 and 2021 has proven its effectiveness. It has been recently reported that, since the termination of the CTC program in 2021, child poverty in the US has risen from 5.3% to 12.4%.
Our findings support the hypothesis that families with children benefit the most from CTC programs and face food insufficiency without the program. The case of black families is an anomaly that may require further sociological investigation into the black family structure. One potential explanation may be the role of extended relatives and grandparents. This subject is beyond the scope of the current research.
The positive sign of post CTC for families with incomes of less than $25000 is plausible as this level of income is roughly equivalent to the poverty income level in the US. The CTC program may not improve food adequacy at around the poverty line. Therefore, further measures and additional programs are needed to combat food insufficiency for families with incomes around the poverty line. As in previous findings, age, education level, and being married reduces food insufficiency among families in this income category.
The LLR in all cases in Table 8 are statistically significant and the MFR values show that the estimated model shows adequate explanatory power in the cross-sectional sample in the study.
The last regression is a brief investigation into the CTC’s effects on households’ difficulty with expenses.
Difficulty With Expenses (DWE) Among Households Making <$35000.
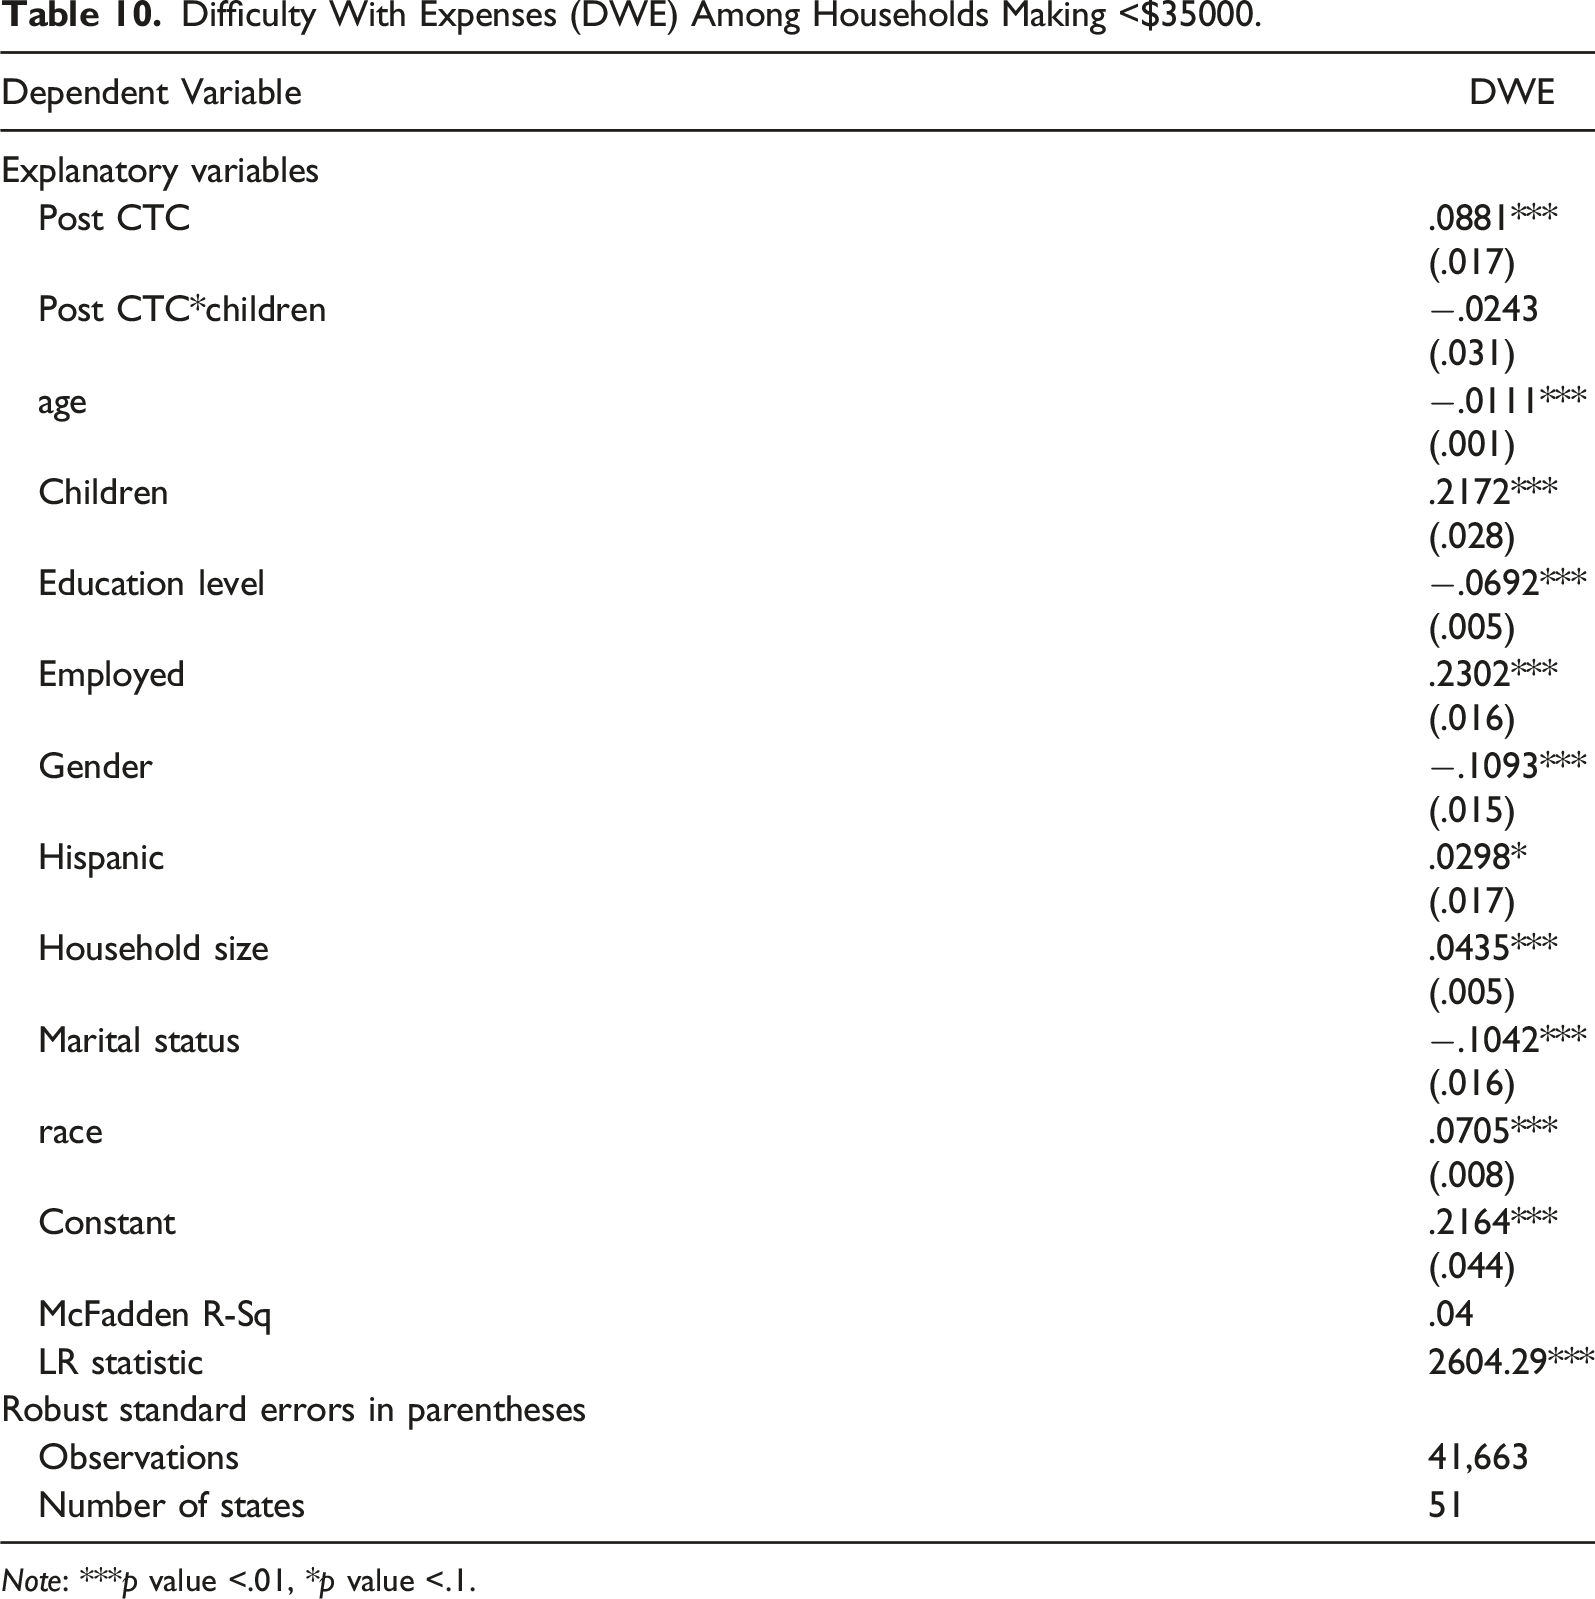
Note: ***p value <.01, *p value <.1.
Results support previous findings that family size and having children raise the degree of difficulty that these households face in meeting expenses. The findings support the hypothesis that families with children benefit the most from CTC programs and face less difficulty in meeting expenses with the program. The positive sign of post CTC for families with incomes of less than $35000 is plausible as this level of income is only slightly above the poverty income level in the US.
As in previous findings in this work, age, education level, and being married reduce problems regarding meeting expenses among families in this income category. The LLR statistic, as in other cases, is significant and MFR values show that the estimated model shows adequate explanatory power in the cross-sectional sample in the study.
Summary and Conclusion
We investigate the association of the CTC program with food insufficiency and related anxieties among families with incomes below $35000. The results of the study broadly comport with previous research on the expanded CTC, revealing a significant negative relationship between eligibility for payments and food insufficiency. The xtprobit specification and estimation reveals the inconsistent impact of CTC across demographic divides, a departure from previous work. Subgroup analyses reveal that final two CTC installments disproportionately benefited Hispanic households and those earning under $25000/year while producing no significant decrease in food insufficiency for black households or those earning $25000–$35000/year.
Despite these subgroup disparities, though, the study indicates that the expanded CTC’s reduction of low-income households’ food insufficiency persisted across the program’s duration. This conclusion has important policy implications, suggesting that the expansion achieved its intended purpose by helping to buffer low-income families against the fallout of the disrupted pandemic economy. This knowledge may guide officials in deciding whether to revive universal payments during future periods of crisis, or even impel them to institute a child benefit program permanently. While we find that the payments had varying impacts for different racial and income groups, it does not attempt to explain the reasons for these disparities. Thus, ascertaining why these discrepancies exist—and determining how to remedy them—should be a topic of interest for economic policymakers and needs investigation.
The popular media, including National Public Radio on 9/22/2023), reported that child poverty more than doubled from 5.3% in 2021 to 12.4% in 2022, just one year after the termination of the CTC program in 2021. Parolin et al. (2022) confirm these findings. Expanding the program is crucial to shield children from the detrimental effects of poverty. Clearly, reviving the CTC, perhaps even with the addition of some work requirements, would be a beneficial investment in the future of the labor force and economic growth in the United States. Other potential policy recommendations as follows may also be considered.
One straightforward approach is to increase the amount of the CTC. This can be done by raising the maximum credit available per child or expanding the income threshold for eligibility. A higher benefit amount directly provides more financial support to low-income families.
Currently, a portion of the CTC is refundable, meaning that even families with no federal income tax liability can receive a partial credit. Making the CTC fully refundable ensures that even the poorest families can benefit from it.
The CTC has traditionally been a lump sum payment at tax time. Implementing monthly payments can provide a steady source of income throughout the year, helping families with immediate expenses. Linking the CTC to inflation ensures that its value keeps pace with the rising cost of living, preventing its erosion over time. Expanding eligibility to include more low and middle-income families can broaden the program’s reach and impact. Investing in outreach and educational efforts to inform eligible families about the CTC can help ensure that those who need it most are aware of and able to access the program.
Tailoring the CTC to address specific vulnerabilities, such as households with young children, can be effective. For example, some proposals have suggested providing a larger credit for children under a certain age. Simplifying the application and verification process can reduce administrative burdens for families and increase program participation.
Coordinating the CTC with other social safety net programs, such as SNAP (Supplemental Nutrition Assistance Program) and Medicaid, can create a more comprehensive approach to addressing child poverty. Regularly evaluating the effectiveness of the CTC in reducing child poverty and making adjustments based on empirical evidence ensures that the program remains impactful.
These policy suggestions can help extend and enhance the CTC program to better support families and reduce child poverty and food insufficiency. The specific approach taken may vary depending on the political climate and societal priorities. Further research into the expanded CTC might seek to continue exploring how its effects changed across socio-economic divides and the program’s existence, especially during the middle (third and fourth) payments. With the recent expiration of the expansion, researchers should also seek to find whether the absence of payments has produced a corresponding increase in food insufficiency among previously eligible populations. Last, continued examination of the program’s impacts on different populations is warranted, given the dramatic subgroup disparities found here.
Footnotes
Acknowledgments
We are indebted to three anonymous reviewers and the editor, Carlos Asarta, for their invaluable and constructive comments. Remaining errors are solely the responsibility of the authors.
Declaration of Conflicting Interests
The author(s) declared no potential conflicts of interest with respect to the research, authorship, and/or publication of this article.
Funding
The author(s) received no financial support for the research, authorship, and/or publication of this article.