
Abstract
This study explains how economics instructors can incorporate pretest and posttest assessments into their economics courses to make testing and related teaching more dynamic and interactive with students. Such assessments allow the correct and incorrect responses to pretest and posttest items to be used by instructors to create four learning scores that reveal different pathways of student learning—positive, retained, negative, and zero. Learning scores provide more insights into learning progression among students during an instructional unit or a course than is possible with the typical posttest only assessment. The study explains how learning scores can be used by economics instructors to analyze classroom or group learning, to diagnose individual student understandings or misunderstandings, and assess how each test item contributes to student learning. It discusses the practical applications and extensions of learning score analysis that make it realistic for economics instructors to use and addresses measurement concerns.
Introduction
The distinction between a stock and a flow is fundamental to measurement in economics. For example, the amount of capital investment is a stock measured at a point in time whereas economic growth is a flow measured over time. The stock-flow distinction also is important to research and instruction in economic education (Siegfried & Fels, 1979). 1 A learning outcome, such as economic understanding or achievement, is a stock that is measured after the completion of instruction. A learning progression is a flow that assesses what has been learned over time, which requires testing before and after instruction. 2
Most tests given in economics courses are stock or summative assessments as they are administered to students after instruction. Economics teachers then use these posttest results in combination with data from other course requirements to assign course grades. Stock assessments, however, provide little information about learning progression during a course as little is known about the starting point for students before a course or an instructional unit begins. Flow assessments, by contrast, are powerful because they collect more data on what students apparently understand or do not understand before and after instruction, and those before and after data can be used to assess learning progression.
This study explains how economics instructors can incorporate flow or formative assessments into their economics courses using learning scores that are derived from response patterns to pretest and posttest items. They reveal four pathways of learning—positive, retained, negative, and zero. The four learning scores, either separately or together, provide more insights into learning progression among students during a course than is possible with a stock assessment administered only after the completion of economics instruction. Although learning scores were originally developed and used in regression research studies as alternative measures of student outcomes (Emerson & English, 2016; Happ et al., 2016; Walstad & Wagner, 2016), what have been overlooked are the practical applications of learning scores for course assessments and economics teaching, and they are the focus of this study.
What follows is an explanation of how learning scores can be used by economic instructors to improve testing and learning in economics courses to make it more dynamic and interactive. The first section introduces the idea of a measurement paradox with a total test score and explains how the four learning scores from a flow assessment offer learning insights hidden within total test scores. The second section provides a practical example of learning score analysis using data from a principles of economics course. It explains the process for how an economics instructor can use learning scores to: (1) analyze classroom or group learning; (2) diagnose individual student understandings or misunderstandings; and (3) assess how each item on a test contributes to student learning. The third section broadens the potential applications of learning scores by relaxing conditions related to the equivalence of matched items, the frequency of testing, the use of testing formats beyond multiple-choice, and the test conditions. The fourth section considers measurement issues, such as motivation or guessing, and offers a practical perspective for considering such concerns. The concluding section presents further implications for course testing and economics instruction.
A Measurement Paradox Revealed by Learning Scores
Economics instructors often administer a multiple-choice (MC) test to students in their principles of economics courses as part of a course assessment (Walstad & Miller, 2016; Watts & Schaur, 2011). 3 Student responses to each MC item are scored as correct or incorrect and then the correct item scores are summed to create a total test score for each student. This scoring process, however, creates a measurement paradox. It arises because students with the same total score may have different sets of correct responses to the test items. Although from a total score perspective, the learning outcome of students with the same score is the same, the total score masks individual differences in the learning progression of students. The differences are revealed with four learning scores extracted from the correct and incorrect item responses when a MC test is administered as a pretest and a posttest (Walstad & Wagner, 2016). 4
Learning Scores Defined.
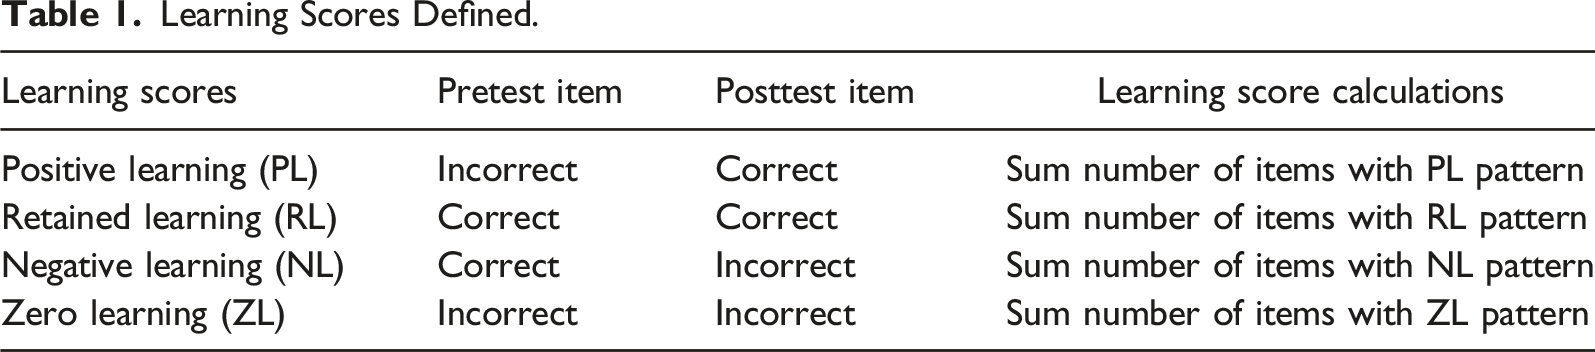
The other two response patterns provide information about what students apparently did not learn or understand. With the third pattern, students give correct answers to items on the pretest but then give incorrect answers on the posttest. It indicates a possible loss in understanding from pretest to posttest, so in contrast to previously described PL and RL outcomes, it suggests negative learning (NL). The fourth pattern shows items with incorrect pretest and posttest responses, and accordingly is labeled zero learning (ZL).
The four response patterns for items can be used to construct four learning scores (PL, RL, NL, and ZL) for each student by assigning a 1 for a correct response or a 0 for an incorrect response to the same items on the pretest and posttest and then summing the scores across all test items. This disaggregation of the total test score creates a set of PL, RL, NL, and ZL scores that represent different pathways of students’ learning over time related to the test item content. 5
Relationship Between Total Test Scores and Learning Scores.
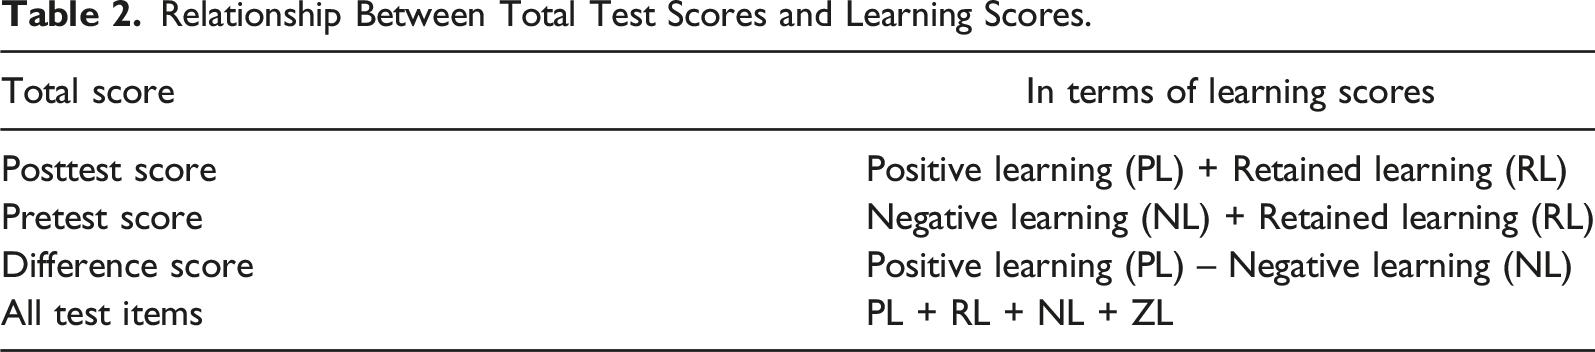
The learning scores show trade-offs for assessing learning progression. The total number of test items equals the scores for PL + RL + NL + ZL. This additive relationship means that each one affects the others. For the posttest, the number correct is PL + RL and the number incorrect is NL + ZL. For any given level of NL + ZL, a larger RL means less PL and vice versa. A similar trade-off is evident in the pretest, but in this case, the number correct is RL + NL and the number incorrect is PL + ZL. For any given level of PL + ZL, the more RL, the less NL and vice versa.
In general, what the relationships show is that both RL and ZL will have a major influence on the amount of PL shown by students at the posttest. 6 If RL is extremely high as a percentage of all test items, the test is too easy as students give correct answers to most items on the posttest and pretest. By contrast, if ZL is extremely high as a percentage of all test items, the test is too hard as students give incorrect answers to most items on the posttest and pretest. PL falls between these extremes as incorrect answers are given on the pretest, but correct answers are given on the posttest. Thus, for a test to show higher levels of PL requires more moderate levels of RL and ZL.
Learning score analysis also reveals a major problem with using a difference score (PL – NL). It requires an assumption that the two learning scores (PL and NL) are the same constructs with opposite meanings. NL, however, might be more affected by motivation, guessing, or other measurement issues such as confusing test items. PL alone can serve as a better indicator of the improvement in student understanding as it is not confounded by the subtraction of NL. Thus, it is better practice to consider each learning score separately and not manipulate them to create a total score with questionable interpretations. 7
A Practical Example: A Re-take Exam
The pedagogical uses for learning scores are numerous and the analysis is relatively easy to conduct as explained with the following example. In a principles of economics course, a MC exam was administered to students to assess their understanding of economic concepts at the completion of each of the three units taught in spring 2020. At the end of the semester, students had the option to re-take one unit exam that had been administered during the semester. A higher score on the re-take exam would replace the score on the unit exam in the calculation of student grades. Students who chose to do a re-take exam were typically ones who showed poorer understanding of course content on the unit exam and would likely benefit most from a second chance to show economic understanding with a re-take exam.
Each of the 60 items on the re-take-exam was written to match a corresponding item on the unit exam. Although the paired test items were not identical, each covered the same economic content and numerical items differed only in the numbers included for the calculations. The item characteristics, therefore, made it possible to conduct a learning score analysis. In essence, student responses to items on the unit exam served as the pretest and student responses on the re-take exam served as the posttest. In preparation for the re-take exam, students were encouraged to go online and review the test items and their answers from the unit exam as the re-take items would be similar in content.
A learning score analysis was conducted with the unit exam and re-take exam. The analysis involves producing three types of valuable assessment information for instructors. The first one is the average scores for the group of students who took the unit and re-take exams. It helps instructors to understand how learning progression and learning outcomes vary for the group. The second one is the individual scores for students. It provides instructors with insights about individual differences in exam scores and the measurement paradox. The third one is item scores that show instructors the different learning patterns across test items in the exams. What follows is a brief explanation of each type of information from a learning score analysis with data from the unit and re-take exams.
Analysis of Group Averages
Scores on Re-Take and Unit Exams (60 Items; 48 Students).
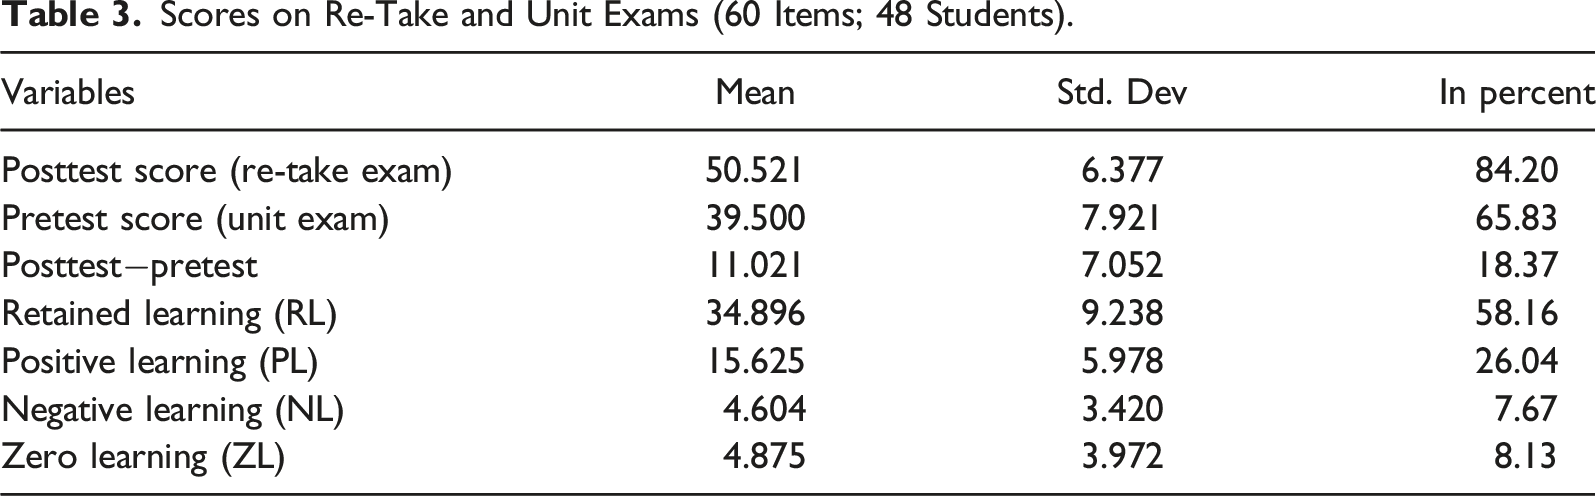
The average learning scores are of interest as they show their contribution or noncontribution to the posttest score. The posttest average can be divided into two learning components, RL (34.9) and PL (15.6), which means that the posttest score is 69% RL and 31% PL. A high RL would be expected with a re-take exam as students have previously been taught and tested on this economic content. Nevertheless, 31% of the posttest score reflects substantial positive learning by students as many incorrect answers given on the pretest were converted to correct answers to items on the posttest.
The difference score (11.02) is the gap between its two learning components, PL (15.63) and NL (4.60). The calculation shows that the total gain is reduced by a total loss in understanding of 30% [(4.60/15.63) x 100]. As previously discussed, the meaning and outcomes for PL and NL are best considered separately in a learning score analysis as PL and NL can be different constructs and not two sides of the same construct. The PL average alone shows a substantial improvement in understanding by students on the test (+15.63). That learning progression shown by the PL score should be focused on by economics instructors and not a difference score with a questionable interpretation.
Analysis of Individual Students
Total and Learning Scores for Students: Re-Take and Unit Exams.
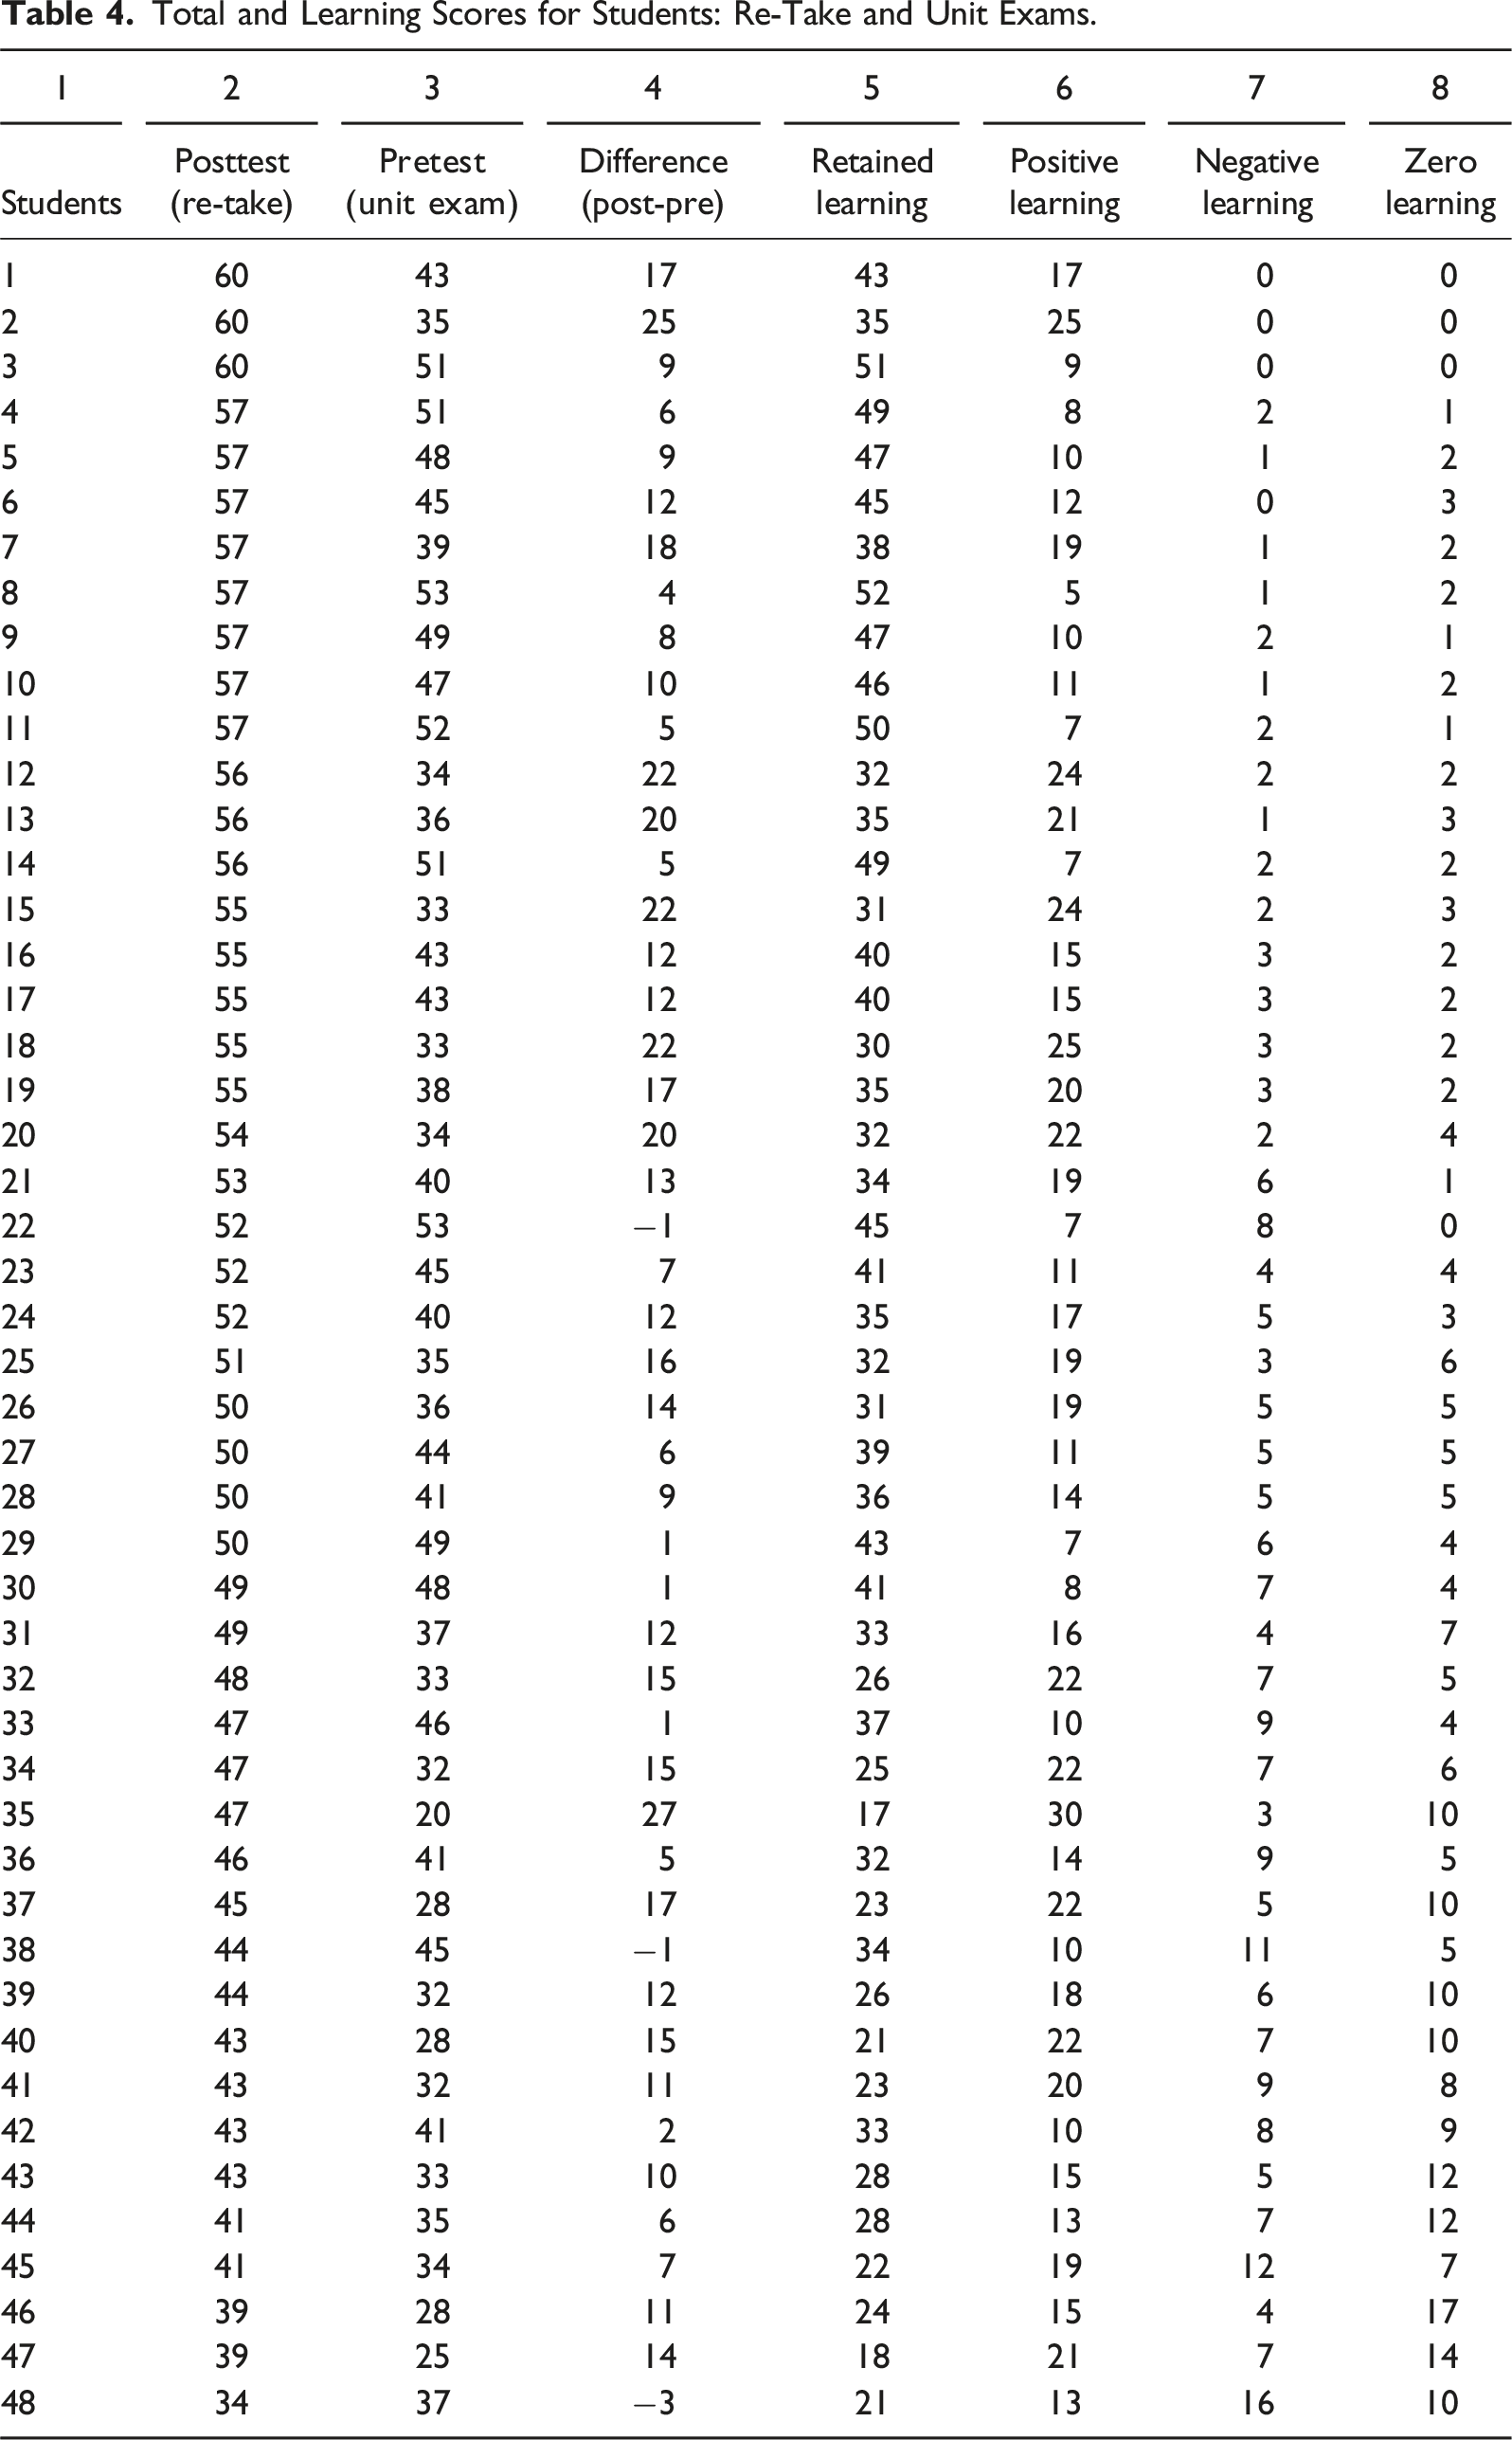
This learning score analysis should be useful for economics instructors to diagnose what economic content each student apparently learned (PL), already understood and retained (RL), changed from perhaps understanding (NL), and did not show to have learned (ZL). The caution for economics instructors is that comparisons of learning scores across students must be carefully interpreted as they will differ based on each student’s responses. For example, two students (#12 and #15) have high PL scores of 24 on the re-take exam but which test items show the PL response pattern will differ by student. Learning scores, however, provide indicators that are useful to economics teachers for providing individual feedback to students and to better target current or future course instruction to enhance student learning.
Analysis of Test Items
Item Results for Total Scores and Learning Scores on Re-Take and Unit Exams (in Proportions).
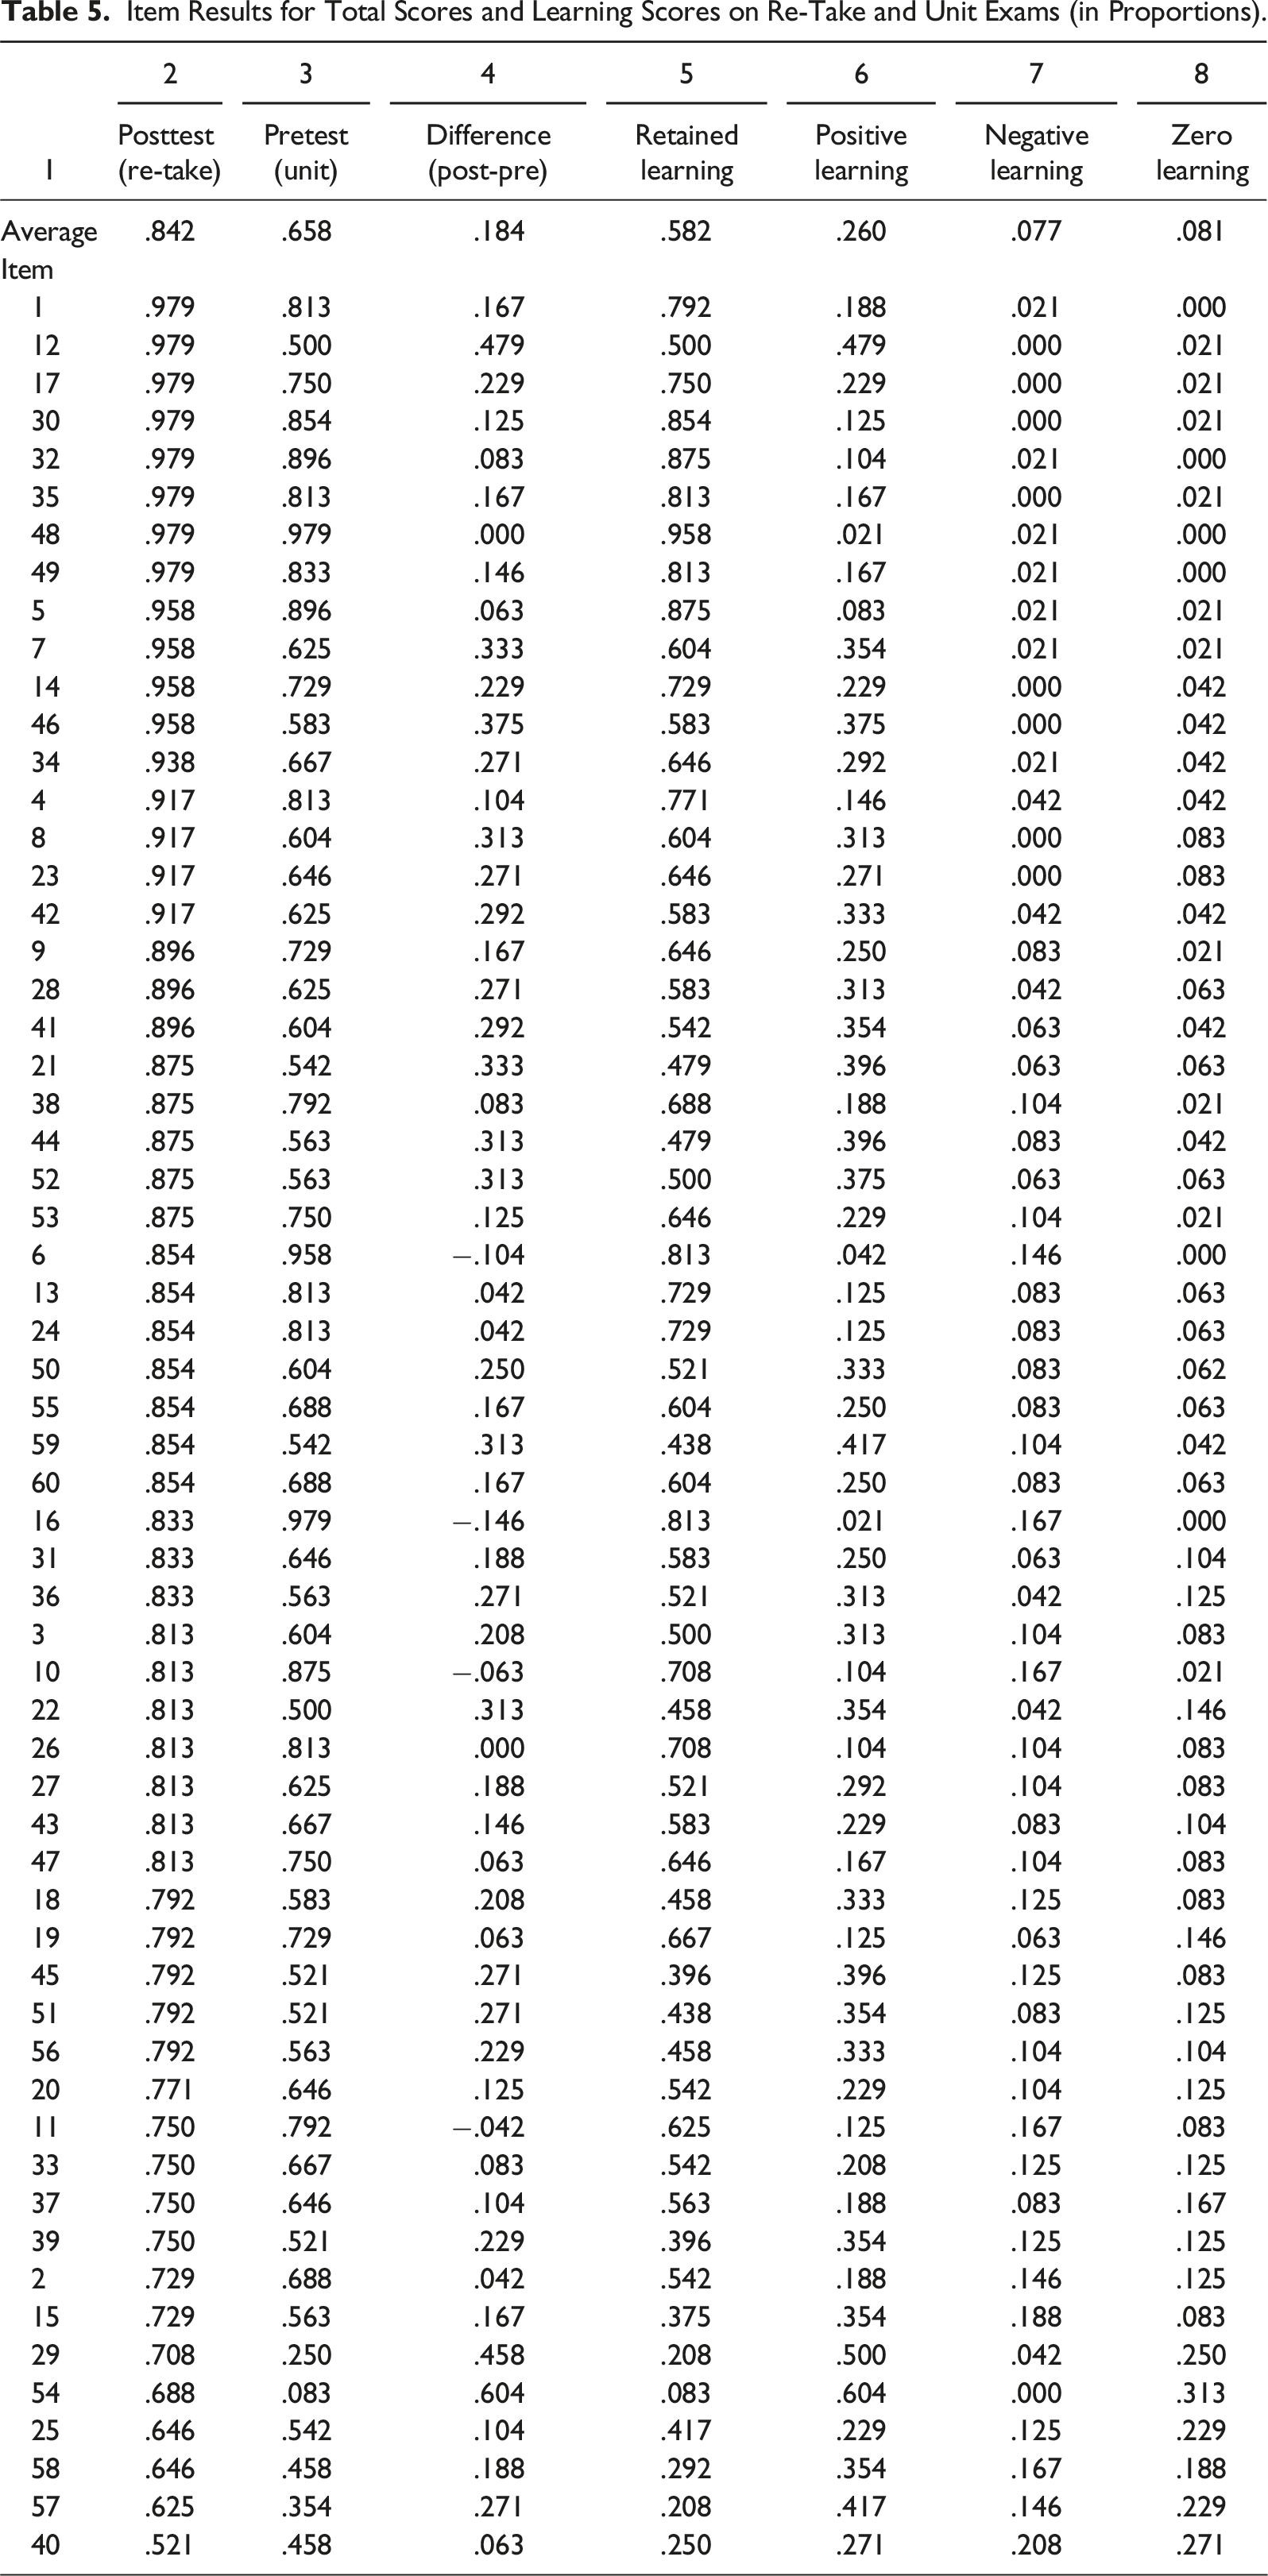
The item proportion data can be used to calculate the percentage of correct responses that PL accounts for on the posttest [(column 6/column 2) x 100]. It averages 31%, but across items varies from a low of 4.9% (item 6) to a high of 87.8% (item 54), indicating that some items elicit more PL responses than others. Similarly, the percentage RL constitutes of correct responses for the posttest score [column 5/column 2) x 100] averages 69, but it too ranges substantially across items.
The item data from the learning score analysis can be studied from the perspective of incorrect rather than correct responses. In Table 5, the proportion incorrect for items on the posttest is the combination of NL + ZL (column 7 + column 8). The results from the learning score analysis show that incorrect responses average 15.8% across posttest items. Although this average is about equally split between ZL (8.1%) and NL (7.7%), there is extensive variation in the split across items.
Other Applications and Extensions
Several conditions for learning score analysis can be relaxed to increase its practical applications and pedagogical value for economics instruction. These modifications are worth discussing because the purpose of the analysis is not to grade students at the end of a course or unit of instruction. Instead, it is to give instructors information on what concepts students demonstrated their understanding of or lack of understanding. Instructors can use this information to give feedback to students about their learning. In addition, learning scores give economics instructors insights about contributions to students’ learning from test items that can be used to evaluate scores from current tests or to improve future assessments.
The first condition to relax is that students do not have to take the exact same items on the pretest and posttest. The reason for this less restrictive stance is that the major purpose of a test item is to assess whether students understand an economic concept. If test items can be matched for content coverage and are of similar perceived difficulty, but are not the exact same items, then they can be used to create two equivalent forms of a test, one as a pretest and the other as a posttest. Subtle differences in the matched test items are likely to have minimal influence on pretest and posttest scores. Evidence to support this assertion comes from the Test of Economic Literacy (Walstad et al., 2013, p. 304). It has two forms that were constructed using items matched only for their conceptual content and perceived level of difficulty. The average scores for the two forms show insignificant differences. The basic point is that if students understand an economic concept, they should be able to correctly answer similar items testing understanding of that same economic concept (as shown in the re-take example).
The second condition to relax is that a pretest is only given at the beginning of a course and a posttest only at its end. In fact, for the learning score analysis to be most useful for students and instructors, a pretest and posttest should be administered multiple times during a course, such as before and after each major unit of instruction within a course. In contrast to the total score that students usually receive after an exam, their learning scores indicate those items and economic concepts that they had difficulty understanding. The use of learning scores can help students identify r economic misconceptions early in an economics course that affect their learning later in the course or in subsequent economics courses.
Consider the situation where an instructor divides a course into three units of instruction. At the beginning of each unit, the instructor administers a pretest and at the end a posttest with matched items. The pretest results can be shared with students to indicate what they need to know by the time of the posttest. The pretest results may also help the instructor identify those concepts being taught that have been shown either to be difficult or easy for students. At the end of the unit, the posttest is administered and the learning score analysis can be conducted to identify what concepts individual students understand and provide students with individual feedback. Similarly, for the other two units of instruction during a course, a pretest and posttest are also administered. This multiple testing procedure provides instructors with ample test data to use for course instruction and equips them with test information to provide individual guidance to students to support their learning. 8
The results from the pretest and posttest administered for each instructional unit also are valuable for preparing a final comprehensive exam if it is administered. Some of the items selected for that exam can be ones on unit tests that showed the highest levels of NL or ZL to check that students have mastered those items that many students responded to incorrectly on unit tests. If instead of giving a final exam, an instructor allows students to re-take a unit exam, and have the new score replace the old score if it is higher, then the individual results from the from the unit exams will be useful for students in preparing for a re-take exam on the same content (as shown in the re-take example).
The third condition to relax is the test format. So far it has been assumed the learning score analysis only applies to a MC test. More generally, learning score analysis applies to any test for which there are multiple test items that can be binarily scored, such as correct or incorrect, pass or fail, meets the threshold or does not meet it, or some other zero and one scoring scheme. For example, an instructor could administer a test composed of multiple items that require computations and written short answers. If the instructor can binarily score each computation or short-answer items on the test, then the learning score analysis can be applied. The number of test items could be minimal, but more items would enrich the learning score analysis. The pair of items on the pretest and posttest could be the same or they could be slightly different and matched for content coverage.
A fourth condition to relax is that a learning score analysis does not necessarily require many students, many test items, or much time. The student sample size can be small, perhaps as few as 15 students. In fact, most principles of economics courses, and even intermediate economic courses, contain enough students to conduct such analyses. In addition, smaller samples of students make it easier for instructors to report results to a class of students or to provide specific feedback to individual students. 9 Also, the number of test items for a learning score analysis can be as few as 10 or 15 depending on its format (quiz or exam) and the time available for testing. Students often like regular feedback and a learning score analysis with a pretest and posttest can provide it.
Measurement Issues
Several measurement issues can affect the interpretation of learning scores. The first one is that learning scores do not explain why students selected the responses to pretest and posttest items. For example, motivational factors such as student effort or interest in the subject matter could affect pretest and posttest responses (Allgood et al., 2015). It may be that student preconceptions may cause confusion for students (Busom et al., 2017). More positively, responses could be influenced by instruction or assignments that improve student understanding (Balaban et al., 2016; Miller & Schmidt, 2021). Although learning scores only show the pattern of what students select on test items, they open new possibilities for why research on the possible reasons for student outcomes (Emerson & English, 2016; Happ et al., 2016; Schmidt et al., 2020; Walstad & Wagner, 2016). Many reasons are worth investigating if data are available to probe the minds of students and discover the specific reasons for selecting their item responses. 10
For instance, self-confidence in acquired economic knowledge and guessing are likely to influence how students answer pretest and posttest items. Students could feel less confident and guess more on the pretest than the posttest, feel more confident and guess more on the posttest than the pretest, or do a mixture of the two, making it especially difficult to evaluate their separate or combined influence on test scores. Although these concerns are valid, no widely accepted standard exists for detecting or correcting for guessing and self-confidence on MC tests. Any proposed method depends on the available test data, testing circumstances, and assumptions about student responses to items (e.g., Bush, 2015; de Ayala, 2022; Smith & Wagner, 2018). In economics courses, however, most instructors do not adjust student test scores for guessing or self-confidence as it is not practical to do so, and it will differ for each student. Thus, in practice the influence of guessing or self-confidence may be a minor cost that most instructors are willing to bear given the benefits using of MC tests for testing understanding of economic concepts. 11
Another measurement concern is test-retest or memory effects if the same MC items are administered as a pretest and posttest. Over a short period (one week), research on memory effects on with university students finds mixed results (positive and negative) on student knowledge (Fazio et al., 2010; Roediger & Marsh, 2005), indicating that it may not be known what the exact effects will be. Over longer periods (many weeks or a semester), however, memory effects are less of an issue as students are not likely to remember test item content (Adams & Wieman, 2011; Happ et al., 2016; Schmidt et al., 2020).
None of the above measurement issues invalidate the use of learning scores. They also are not unique to learning scores as they may affect total test scores used by economics instructors for grades. The general point is that given course constraints and the practicalities of teaching, it may not be possible for an economics instructor to adjust test scores for students in an economics course to account for such measurement issues even if there was strong consensus on what should be done. This work on measurement issues is best left to test or psychometric specialists and other researchers. What learning scores do for economics instructors is provide them with timely information about the pattern of student responses to test items. Probing the reasons for those responses should stimulate conversations between students and instructors. Those conversations should give instructors the opportunity to provide helpful insights to students about their current achievement and what they still need to learn. 12
Implications and Conclusion
Course testing in economics needs to be a dynamic and formative process that measures the flow of learning rather than a static event that only measures the stock of understanding. Learning scores make that goal achievable by giving economics instructors useful data about individual students or a student group to increase economic understanding and make teaching more efficient and satisfying. The results from the pretest cue students as to what they are expected to learn. The posttest results can be analyzed to identify those items where students show learning and need the most improvement. This test information can be used by students to better prepare for assessments and by instructors to better target instruction.
These desirable outcomes are made possible by learning scores, or at least they give instructors more practical tools from testing to achieve those desired outcomes. Learning scores enable economics instructors to know how much change in individual or group scores is positive learning (PL) (incorrect to correct), retained learning (RL), (correct to correct) negative learning (NL) (correct to incorrect), or zero learning (ZL) (incorrect to incorrect). Economics instructors can use this analysis to find out how much a posttest score is PL or RL, and how much of the pretest score is RL or NL.
Calculating and understanding learning scores makes it possible to extract insights about student understanding or achievement that would not be evident from total test scores. For example, consider a measurement paradox that students with the same total test score correctly answer a different set of test items. If only the total test score is considered, students with the same total score are viewed as showing the same learning or achievement. Learning scores, however, show that students with the same total score are not the same because the total test score is the combination of RL and PL. This relationship means that some students will show more RL on the total test, or already knew the content at the pretest, while other students show more PL, or will have improved their understanding of course content since the pretest.
Incorrect responses can be studied from a learning score perspective. Students or test items with high NL can be studied to discover why correct answers were given on the pretest and incorrect answers on the posttest. Perhaps it is because students guessed, or it is because they misunderstood the concept, or the test item was poor. In addition, the incorrect responses from pretest to posttest can be analyzed for what students consistently do not understand (ZL). Perhaps these items are too difficult for students, or an instructor needs to do a better job of teaching the economic concepts tested by these items.
Instructors can use course averages from learning score on a posttest to improve future tests. The averages can show a higher or lower mix of RL and PL on a posttest, so instructors will have to decide what mix they want to see on that test in the future. A learning score analysis of the test items reveals the extent to which they measure PL and RL, and this information can be useful in selecting items to keep or delete. If the purpose of the test is to measure the increase in learning, then items with more PL would be desired. If the purpose is to assess retention over time, then more RL items would be desired.
This study suggests that there needs to be more interaction between testing in economics courses and economics instruction. They should not be viewed as separate and discrete activities. Learning scores facilitate that interaction by giving economics instructors more insights about the learning progression of students and their learning outcomes.
Footnotes
Declaration of Conflicting Interests
The author(s) declared no potential conflicts of interest with respect to the research, authorship, and/or publication of this article.
Funding
The author(s) received no financial support for the research, authorship, and/or publication of this article.