
Abstract
This lecture examines the lessons learned from the fiscal policy response to the Covid-19 pandemic. For each lesson, it discusses how the pandemic experience corroborates or contradicts earlier evidence on the efficacy and optimal design of fiscal policy. It also considers whether the lessons from the pandemic are likely to carry over to future recessions.
Keywords
The Covid-19 pandemic was a shock unlike any we have seen in my lifetime. As just one indicator, initial claims for unemployment insurance in late March and early April of 2020 were more than six times larger than the previous record. The pandemic affected both aggregate demand, as consumers and businesses became afraid to spend, and aggregate supply, as firms shut down because of virus fears and the government imposed widespread lockdowns. These developments threw millions of workers out of their jobs.
The fiscal policy response to the pandemic was similarly unprecedented. In 2009, when the Obama administration worked with Congress to pass the American Recovery and Reinvestment Act, the resulting $800 billion fiscal stimulus was viewed as enormous. The Coronavirus Aid, Relief, and Economic Security (CARES) Act passed under the Trump administration in March of 2020 came in at a whopping $2.2 trillion—all paid for by borrowing.
Figure 1 shows the size of the early fiscal packages across a sample of OECD countries. OECD countries are typically relatively advanced economies with democratic governments. David Romer and I put together these data from a variety of secondary and primary sources, trying to be careful to only count deliberate fiscal actions, not endogenous responses or easy-to-exaggerate measures like loan guarantees. The figure shows that the early fiscal response to the pandemic was a larger share of GDP in the United States than in any other OECD country. The initial U.S. fiscal response was 12% of GDP. The United States also took a number of additional actions as the pandemic dragged on, including the $1.9 trillion American Rescue Plan Act early in the Biden administration. All told, the United States has spent more than $5 trillion on its fiscal response to the pandemic. Early Pandemic Fiscal Packages in OECD Countries. Notes: The data are for fiscal packages legislated by the end of July 2020. Source: The sources for the estimates are described in the online appendix to Romer (2021).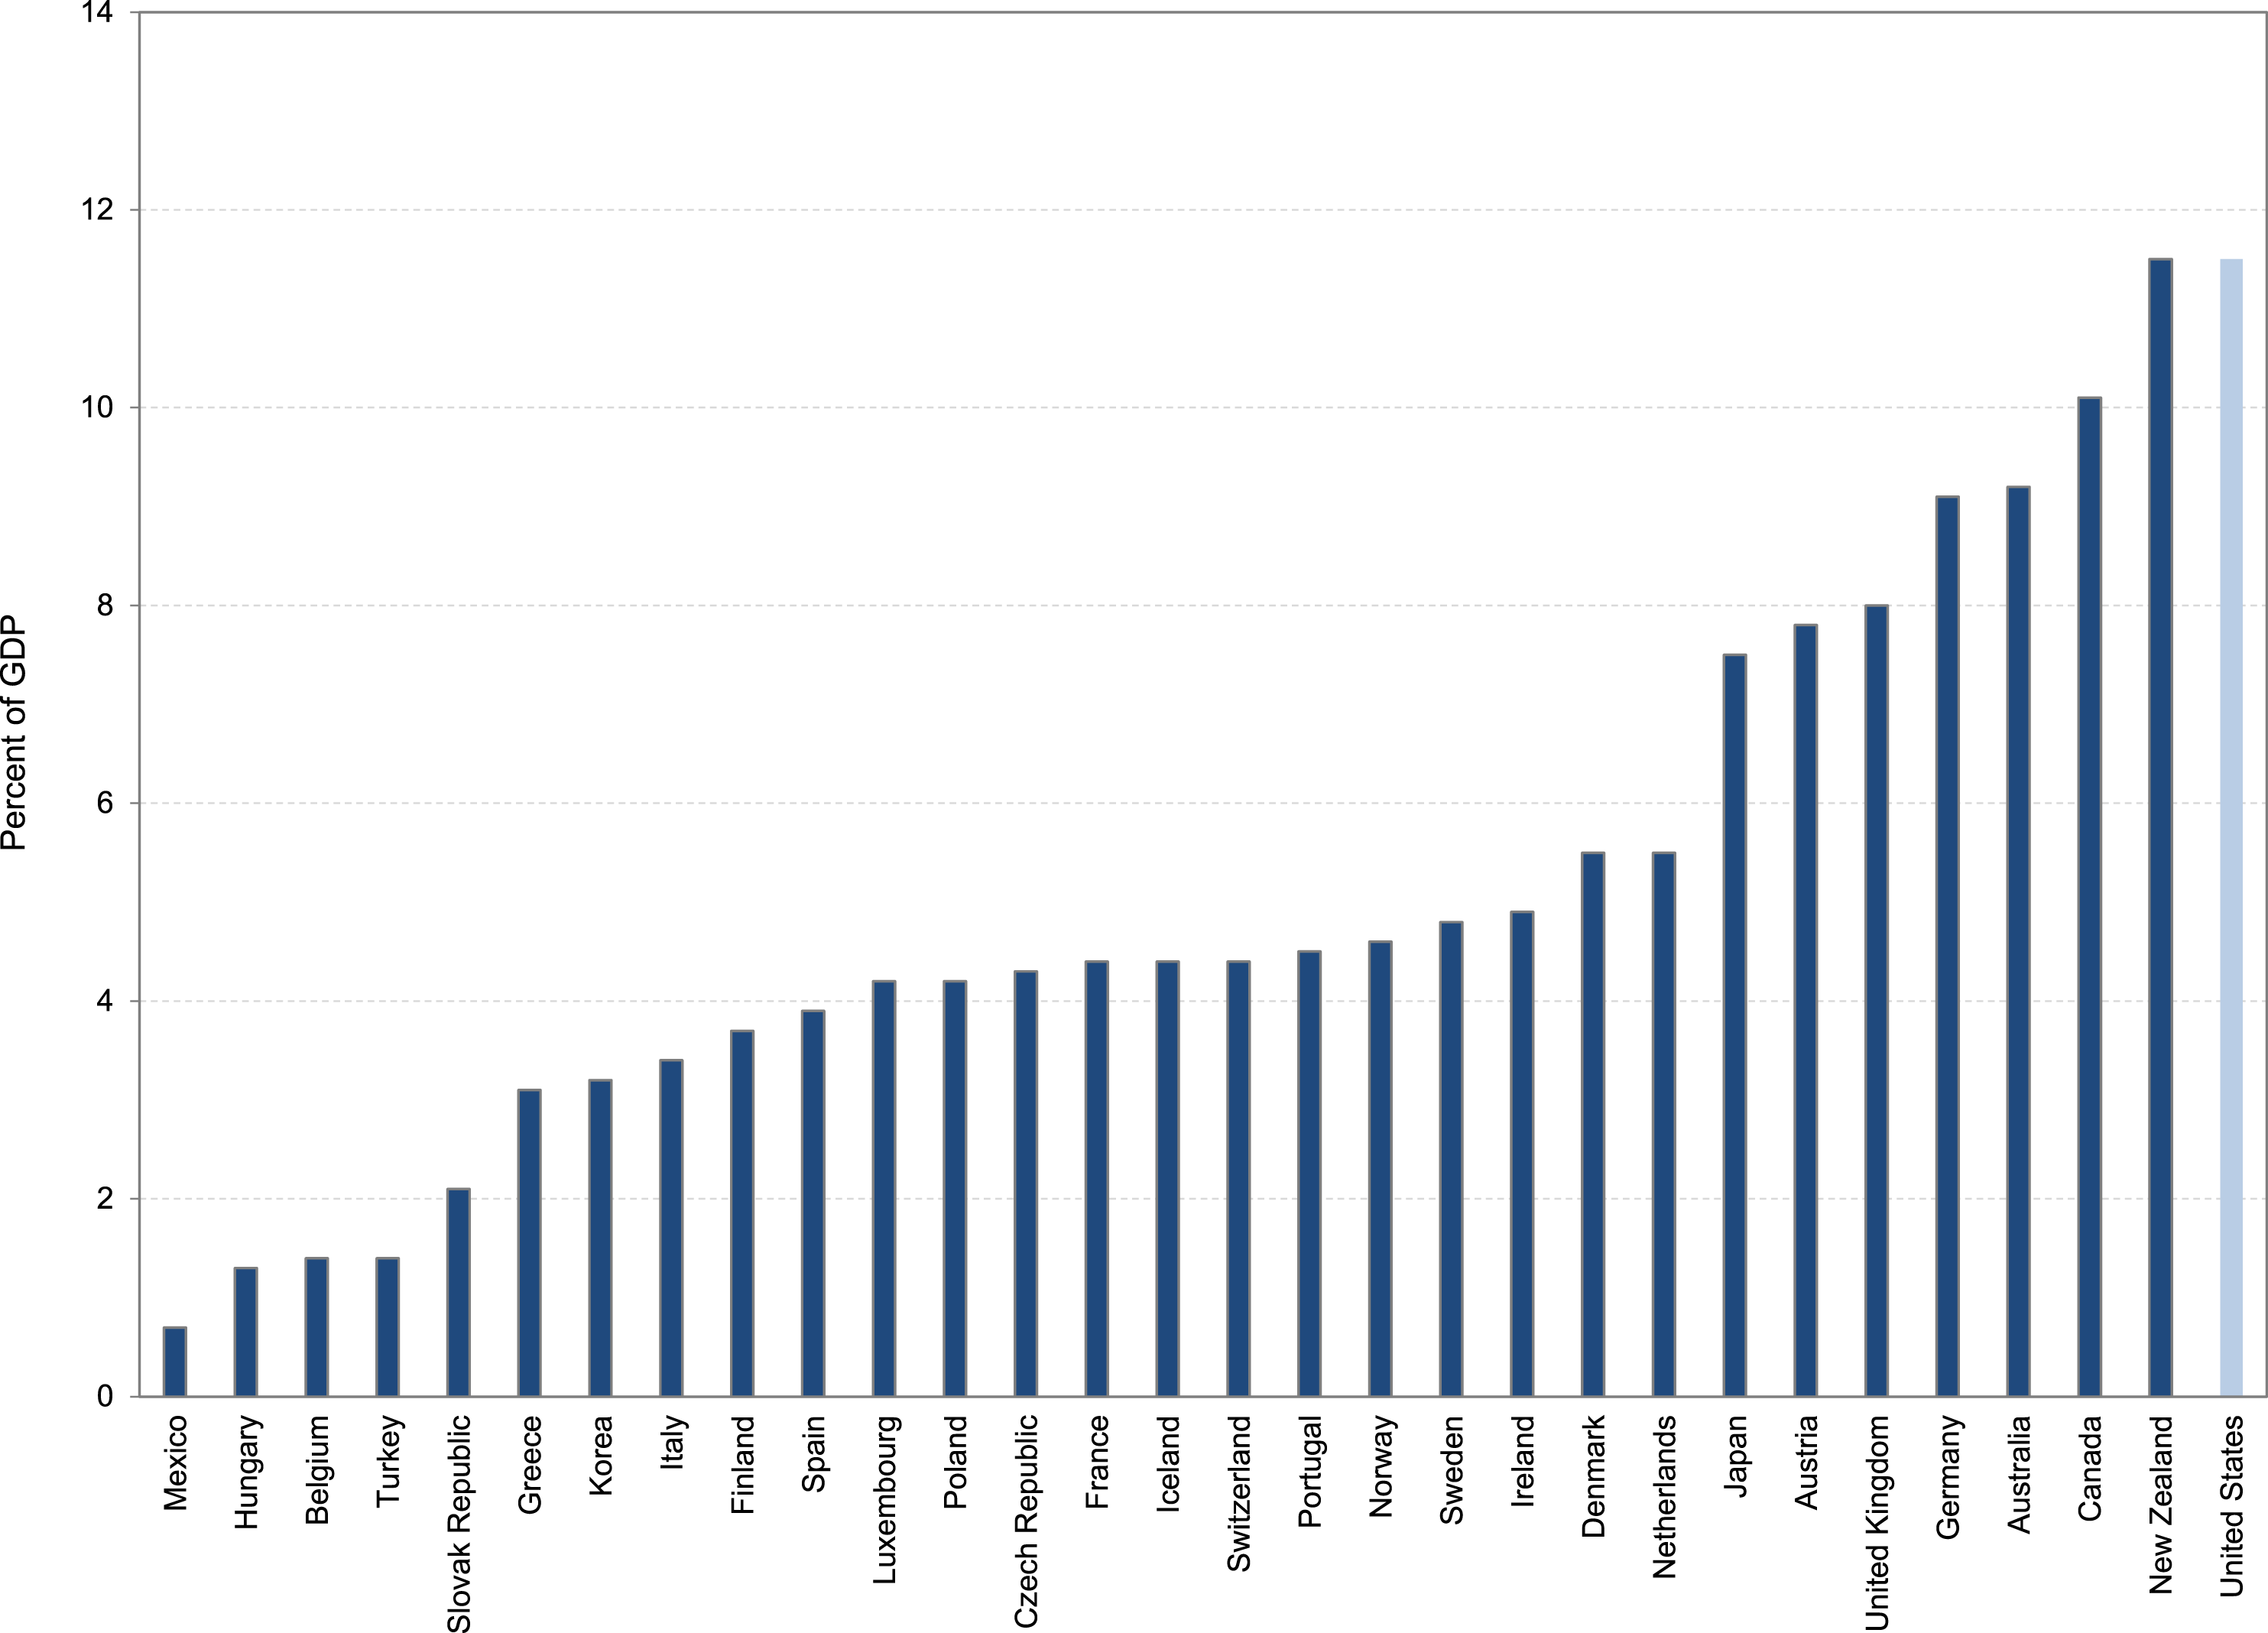
Like many economists, I have spent a lot of time trying to figure out what we have learned from the pandemic experience. I am particularly interested in what this extraordinary experiment in fiscal expansion in response to a crisis has taught us about fiscal policy. Are there lessons from the pandemic about the effects and limits of fiscal policy? Do these lessons carry over to more ordinary recessions?
Fiscal Stimulus Stimulates
The first and perhaps most fundamental thing that we learned from fiscal policy in the pandemic is that fiscal stimulus does indeed stimulate spending and help to heal a depressed economy.
Prior Evidence
Now, this is something that we already knew. Careful studies of particular episodes in the past have shown that this is the case. For example, Hausman (2016) showed that the 1936 Veterans’ Bonus led recipients to buy cars and build houses, and by doing so, stimulated production and employment in the Great Depression. Chodorow-Reich and coauthors (2012) found that the state fiscal relief in the 2009 American Recovery and Reinvestment Act led states to spend more, and states that got more of these funds for relatively exogenous reasons had higher output and employment. Studies across time that try to account for the endogeneity of some fiscal actions also show that fiscal stimulus stimulates. For example, Ramey (2011) found that increases in military spending lead to increases in output. Romer & Romer (2010) found that tax changes in the post-World War II period taken for reasons unrelated to other forces affecting the economy change output both rapidly and substantially.
Evidence from the Pandemic
The experience of the pandemic confirms the essential finding that fiscal stimulus stimulates. One heartening development of the last two terrible years has been the outpouring of economic research on the behavior of the economy and the effect of pandemic relief programs. Researchers have shown incredible creativity in marshaling new, high-frequency sources of data, and devising credible empirical tests.
One unusual component of the early pandemic fiscal package in the United States was an across-the-board increase in unemployment insurance checks of $600 per week. A study by Ganong et al. (2021) finds that the enhanced unemployment benefits increased spending strongly. The authors use individual-level bank account data to compare the spending of people who remained employed throughout the pandemic and those who became unemployed (and thus received the expanded benefits). They find that the spending of the two groups evolved very similarly before the pandemic. However, when the pandemic hit, the spending of those who became unemployed actually rose above pre-pandemic levels, while the spending of those who remained employed fell. Moreover, the study goes on to use a comparison of unemployed workers who received the enhanced benefits quickly to those who faced delays to suggest that the effects on spending were not just coincidental, but causal.
This is stark evidence that fiscal stimulus stimulates spending. And it does so under very daunting circumstances. Recall that in the first few months of the pandemic, many businesses were closed, there were shortages of essential goods, and the fear was palpable. And yet, the people most directly affected clearly responded to the infusion of public spending.
Another well-known component of the pandemic fiscal response in the United States were a sequence of stimulus payments to households. The CARES Act sent payments of $2400 per married couple to most American households, with additional payments for each child. There was another stimulus payment in late 2020, followed by yet another in the Biden legislation in March 2021.
A study by Chetty et al. (2020) looks at the effects of the stimulus payments in April 2020. They use very high-frequency data on consumer spending from one company that tracks debit and credit card transactions and from another that tracks cash expenditures. They examine whether there was a discontinuity in the behavior of consumer spending around the day when most households received the electronic deposit of the first stimulus payment. They find that there was. Perhaps even more interesting is the finding that the size of the effect differed substantially by income. The discontinuity in spending for households in the lowest income quartile of zip codes was about three times larger than the discontinuity for households in the highest income quartile of zip codes.
A study by Baker et al. (2021) uses a different transaction-level household spending dataset and finds very similar effects. Like Chetty and others, they find that there was a consumption response to the stimulus payments, and that the response was negatively related to household income and liquidity. Thus, one crucial sub-lesson from the pandemic is that the stimulating impact of fiscal policy depends substantially on who it goes to. Importantly, while Baker and coauthors find a stimulating effect of the stimulus payments during the pandemic, they emphasize that the overall impact of these payments was noticeably smaller than the effect of similar actions in 2001 and 2008.
This finding of a muted effect is consistent with survey evidence analyzed by Coibion and others, 2020. They find that U.S. households reported having spent only about 40% of their stimulus payments on average. The rest was saved or used to pay down debt.
The evidence that the fiscal actions taken early in the pandemic swelled spending at least somewhat, is consistent with the rapid recovery of the U.S. economy. Figure 2 shows the level of real GDP in the United States over the past two decades. What is remarkable about the pandemic is just how quickly the U.S. economy started to spring back. Real GDP fell at an annual rate of 31% in the second quarter of 2020. It rose at a rate of 34% in the third quarter of that same year. Real GDP since 2000. Notes: The data are quarterly, seasonally adjusted, and at an annual rate. The shaded gray areas denote NBER recessions. Source: Bureau of Economic Analysis, downloaded from FRED, 2/3/2022.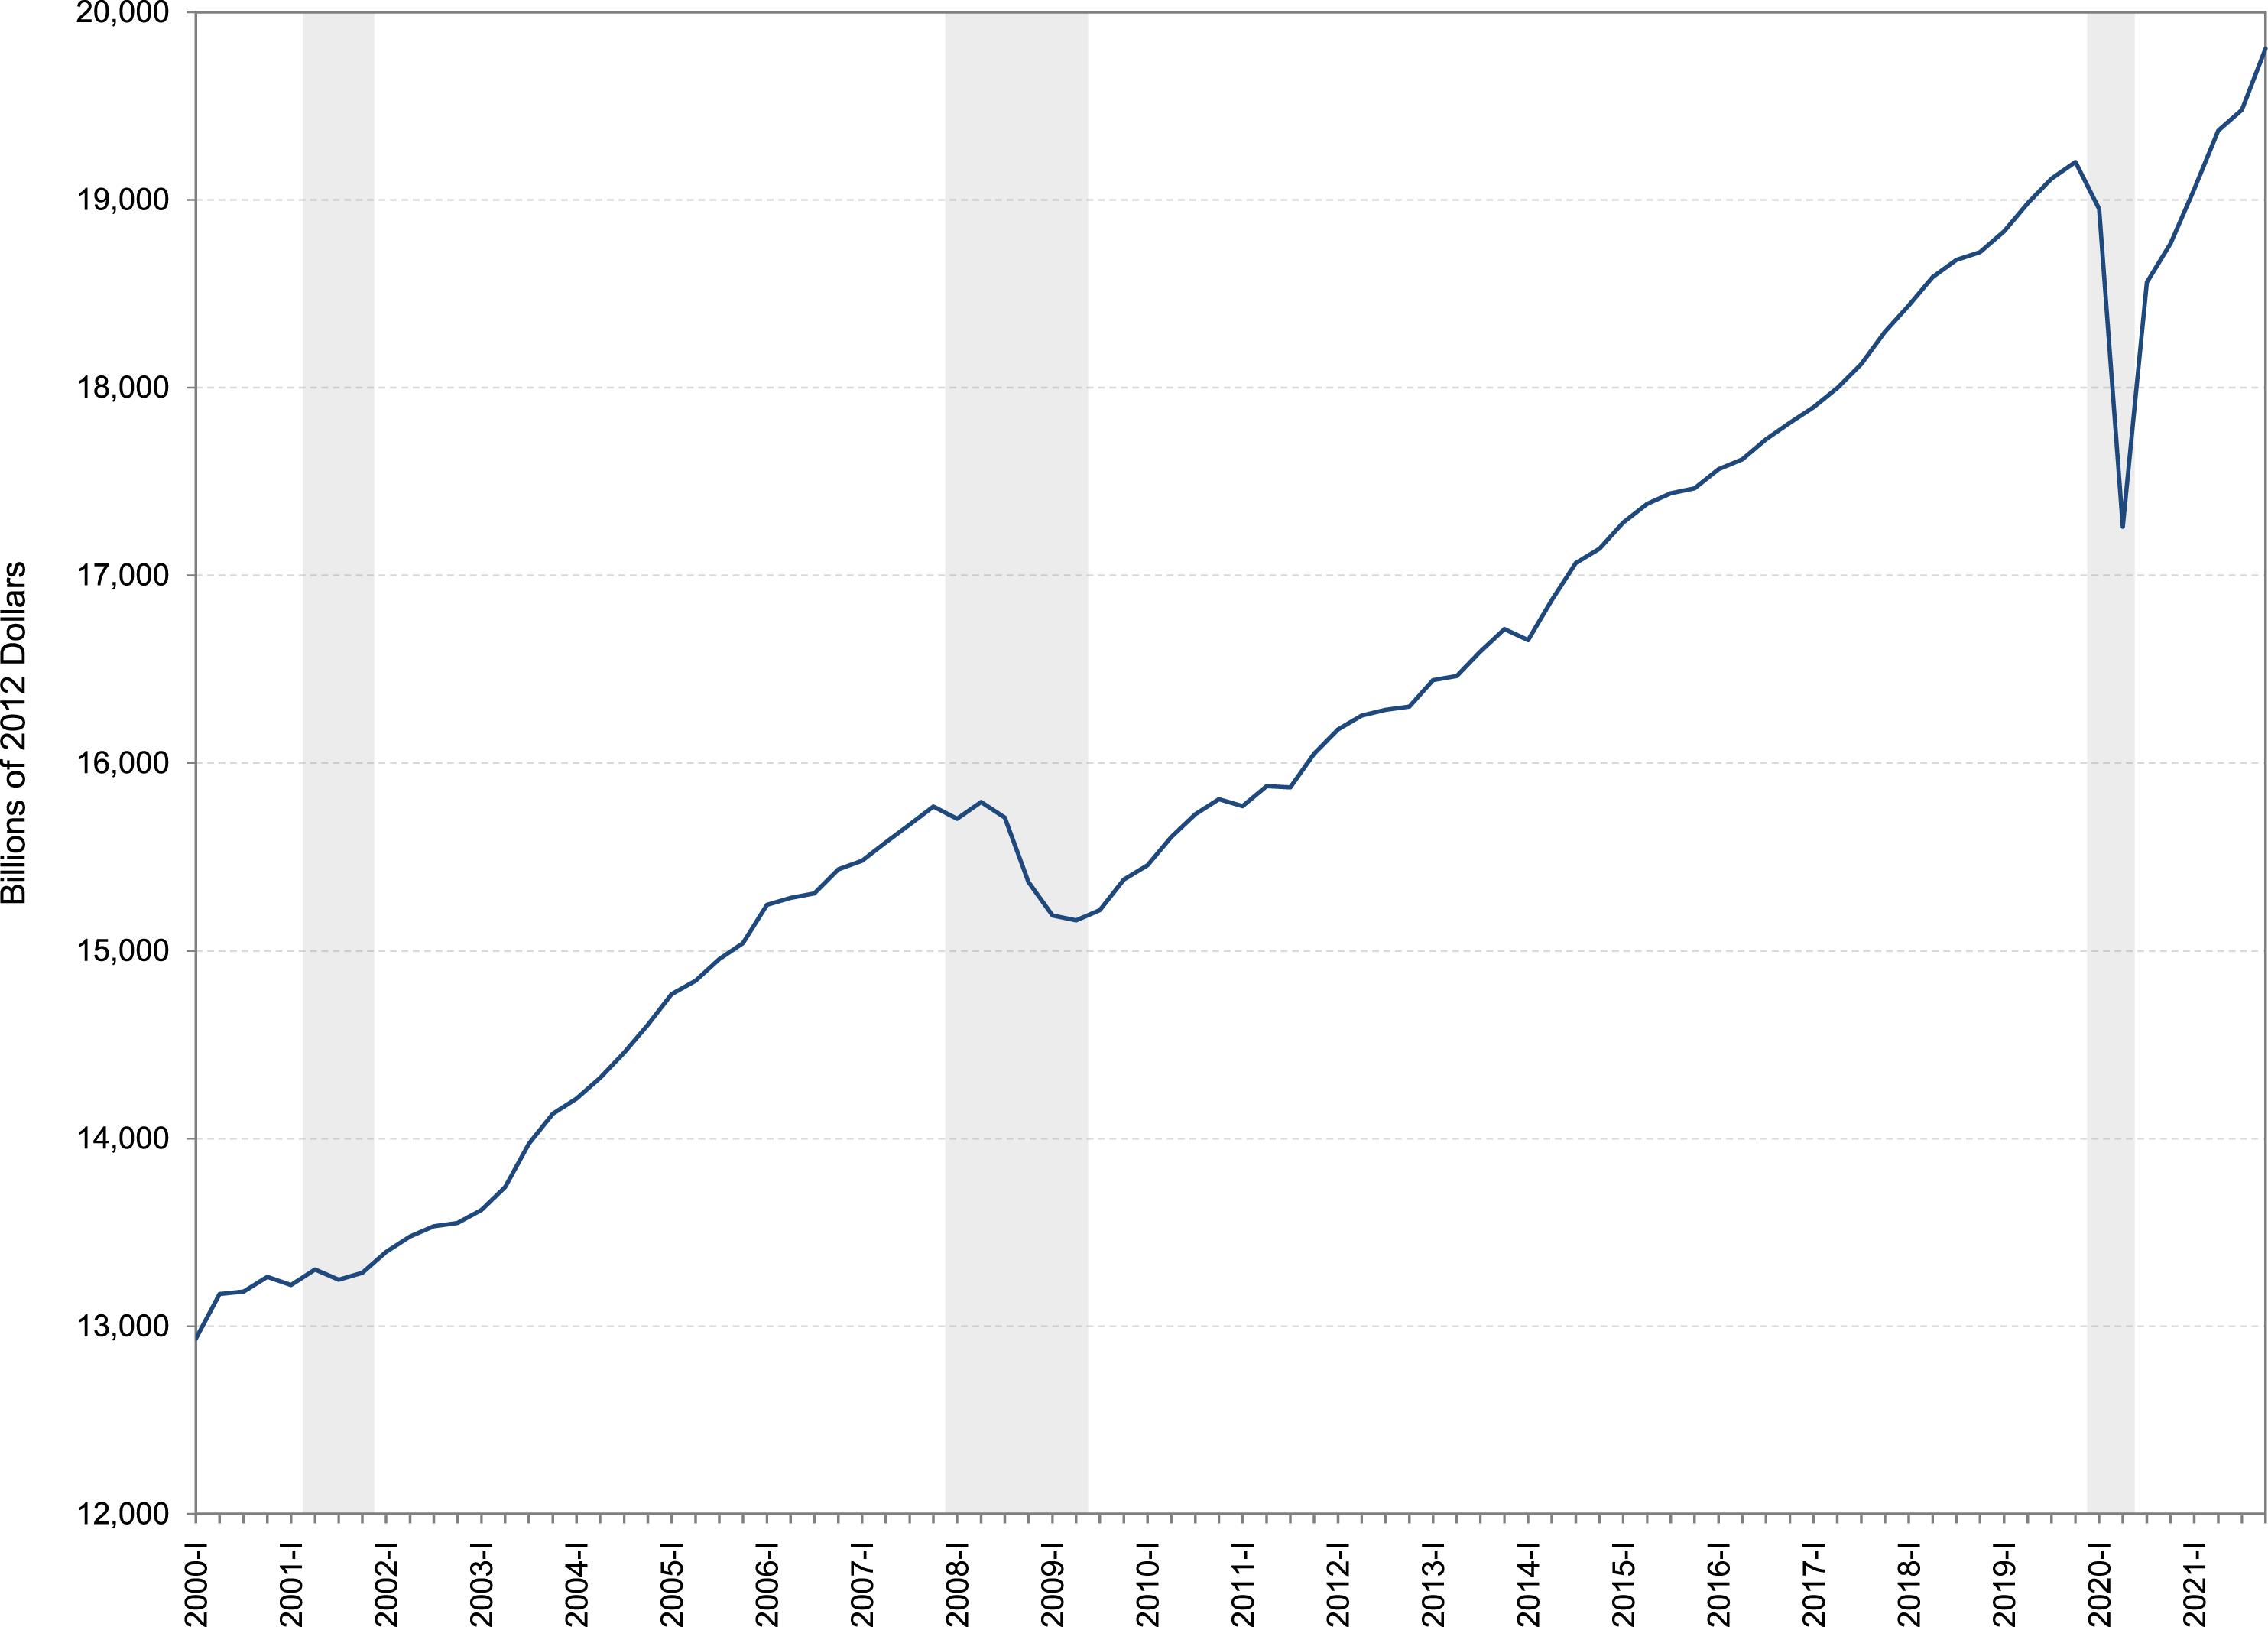
Implications for Other Recessions
The lesson that fiscal stimulus stimulates is one that most definitely carries over to other episodes. Indeed, it is almost surely more relevant to other recessions than to the pandemic recession.
Most recessions are caused by a decline in aggregate demand. The 2008 recession was triggered by a financial crisis that caused a drying up of credit. Without credit, firms couldn’t invest and consumers couldn’t buy cars or houses. The 2001 recession was caused by the collapse of the tech bubble, which destroyed a substantial amount of wealth and depressed investment. The Great Depression of the 1930s resulted from a terrible confluence of demand contractions—uncertainty after the 1929 stock market crash inhibited consumer spending; repeated financial crises raised real interest rates and sank investment; and a misguided tax increase in 1932 further depressed consumption.
The obvious remedy to recessions caused by a contraction in aggregate demand is government action to stimulate demand. That unemployment insurance payments, stimulus payments, and direct government spending increased demand even under the terrible conditions of Spring 2020 means that such fiscal policy actions can be very helpful in conventional recessions. If low demand is the problem, fiscal stimulus is a potent answer.
The fact that payments to unemployed workers or low-income workers have a larger impact on spending than payments to higher-income workers is also something that will likely carry over to other recessions. It suggests that targeting fiscal aid to households with low income and low liquidity is likely to have a much larger bang for the buck. That is, it can achieve the desired aggregate demand stimulus at a lower cost to the government.
Bigger Is Not Always Better
The first lesson for fiscal policy from the pandemic was that fiscal stimulus stimulates. The second lesson is a little less positive. It’s that when it comes to fiscal policy, bigger is not always better.
Prior Evidence
One striking feature of the discussion of the fiscal response to the pandemic was the agreement that it should be very large. Some of this surely reflected the sense that Covid-19 was a serious threat to both public health and the economy. A natural (and often helpful) response to a frightening crisis it to hit it with all we’ve got. But I don’t think that was all of it.
There was also a substantial element of fighting the last war. The recovery from the 2008 financial crisis was painfully slow. Most economists and policymakers now agree that one reason for this slow recovery was that the fiscal response was too small. It is clear in retrospect that the financial crisis had a larger impact on consumer spending and investment than almost anyone anticipated. As a result, more fiscal stimulus could have helped to put people back to work sooner.
Many policymakers explicitly cited the 2009 experience as their rationale for why the fiscal response to the pandemic should be large. For example, Gene Sperling, who is overseeing the implementation of the Biden rescue package, had an op-ed in the Financial Times in February 2021. He wrote: “But the financial crisis also teaches us another lesson. Rather than trying to tailor the response to one’s best guess of the precise size of today’s crisis, go big enough to buy insurance for economic recovery efforts with the recognition that things might go wrong and might already be worse than expected” (February 8, 2021).
Evidence from the Pandemic
As I have described, the stimulus was very large. The CARES Act and the Biden stimulus measure were each more than twice as large as the 2009 Recovery Act. Ironically, however, the unique characteristics of a pandemic recession meant that going big was not necessarily a good idea in this particular case. Pandemics thrive on human contact and so on many types of economic activity. To save lives, certain activities need to be curtailed for a while. So, in contrast to most other recessions, the goal during a pandemic recession should not be to try to bring the economy back to full employment as quickly as possible. Doing so could lead to more disease and more deaths. Rather, the goal should be to encourage only the production and employment that is either essential or can be done safely.
Related to this, stimulating dangerous activities can backfire. If policy encourages interaction and thereby makes the pandemic more widespread or deadly, this could ultimately be bad for demand. Nothing is as bad for consumer spending as widespread fear. It is possible that some of the fiscal measures aimed solely at increasing demand during the pandemic were unnecessary and even counterproductive. Going big may have caused some problems rather than solved them.
Here, I can’t help but mention a fiscal program that will surely go down as one of the most misguided in pandemic history. It comes from Britain rather than the United States. In August of 2020, Britain put in place a large-scale government subsidy aimed at getting people to eat out more—because that is just what you want people to do during a pandemic. It was called “Eat Out to Help Out.” A very nice paper by Fetzer (2020) shows that Covid-19 cases rose substantially during and right after the program. Fetzer goes on to look at the exact timing of the program, and how weather caused differences across areas in the attractiveness of eating out. This difference-in-difference specification finds clear evidence that the program led to a substantial number of new Covid-19 infections. This is dramatic evidence that fiscal programs that encourage risky behavior are deeply counterproductive in a pandemic.
Finally, going bigger can cause problems beyond the effects on public health. The United States is currently suffering a decided bout of inflation. Though there are many causes, one is that the expansionary effects of the last fiscal stimulus, the American Rescue Plan Act, hit the economy at the same time that supply was being constrained by bottlenecks around the world and low labor force participation in the United States. The result was demand in excess of available supply, which tends to push up inflation.
Implications for Other Recessions
The lesson from the pandemic that bigger fiscal stimulus is not always better is likely to be valuable in other recessions. Even in conventional recessions, it is often very hard to predict how much aggregate demand will fall or how quickly it will come back. As a result, it is very hard to know how much fiscal stimulus is appropriate. The answer to this problem should not be to just turn on the fiscal tap full blast whenever there is a downturn. That is a recipe for overstimulating the economy and running up government debt unnecessarily.
A much better answer is to devise fiscal stimulus programs that turn off when certain triggers are met. For example, unemployment benefits could be extended not until some pre-specified date, but for as long as the unemployment rate is above some threshold. Or taxes could be reduced until output is above its previous peak. One could even imagine setting up fiscal policies that both turn on and turn off automatically. For example, economists have suggested that transfers from the federal government to states could be designed to kick in whenever there is a significant rise in unemployment, and kick off when conditions normalize. Such automatic fiscal policy is a smart alternative to purely discretionary policy.
The lesson from the pandemic may also be relevant in another way. Fundamentally, the reason that bigger wasn’t better in the pandemic is because output was lower in part for reasons unrelated to low demand. It needed to be lower to control the virus. As a result, fiscal stimulus couldn’t really solve the problem of low output. This notion that some recessions cannot be solved by aggregate demand stimulus is one that is likely to carry over to at least some other episodes.
The 1970s is a classic example where such a lesson would have been very valuable. It is well known that the oil supply shock in 1973 played an important role in the initial rise in both inflation and unemployment. But the fact that policymakers responded to the supply shock by increasing demand through deliberate fiscal stimulus and monetary expansion made the situation worse. Figure 3 shows overall inflation (the dark blue line) and the price of oil (the light blue line) in the 1970s. One thing that stands out in the graph is the fact that the high inflation following the 1973 oil price shock was actually resolving in late 1975 and 1976. However, in early 1977, the Federal Reserve started on a very aggressive monetary expansion to deal with lingering unemployment. The result was that inflation rose again, even as oil prices were fairly well behaved. Inflation and Oil Prices in the 1970s. Notes: The inflation measure is the Consumer Price Index for All Urban Consumers: All Items in U.S. City Average, percent change from year ago, monthly, not seasonally adjusted. The oil price measure is the spot price for West Texas Intermediate Crude, in levels, monthly, not seasonally adjusted. The shaded gray areas denote NBER recessions. Sources: Bureau of Labor Statistics and Federal Reserve Bank of St Louis, downloaded from FRED, 2/4/2022.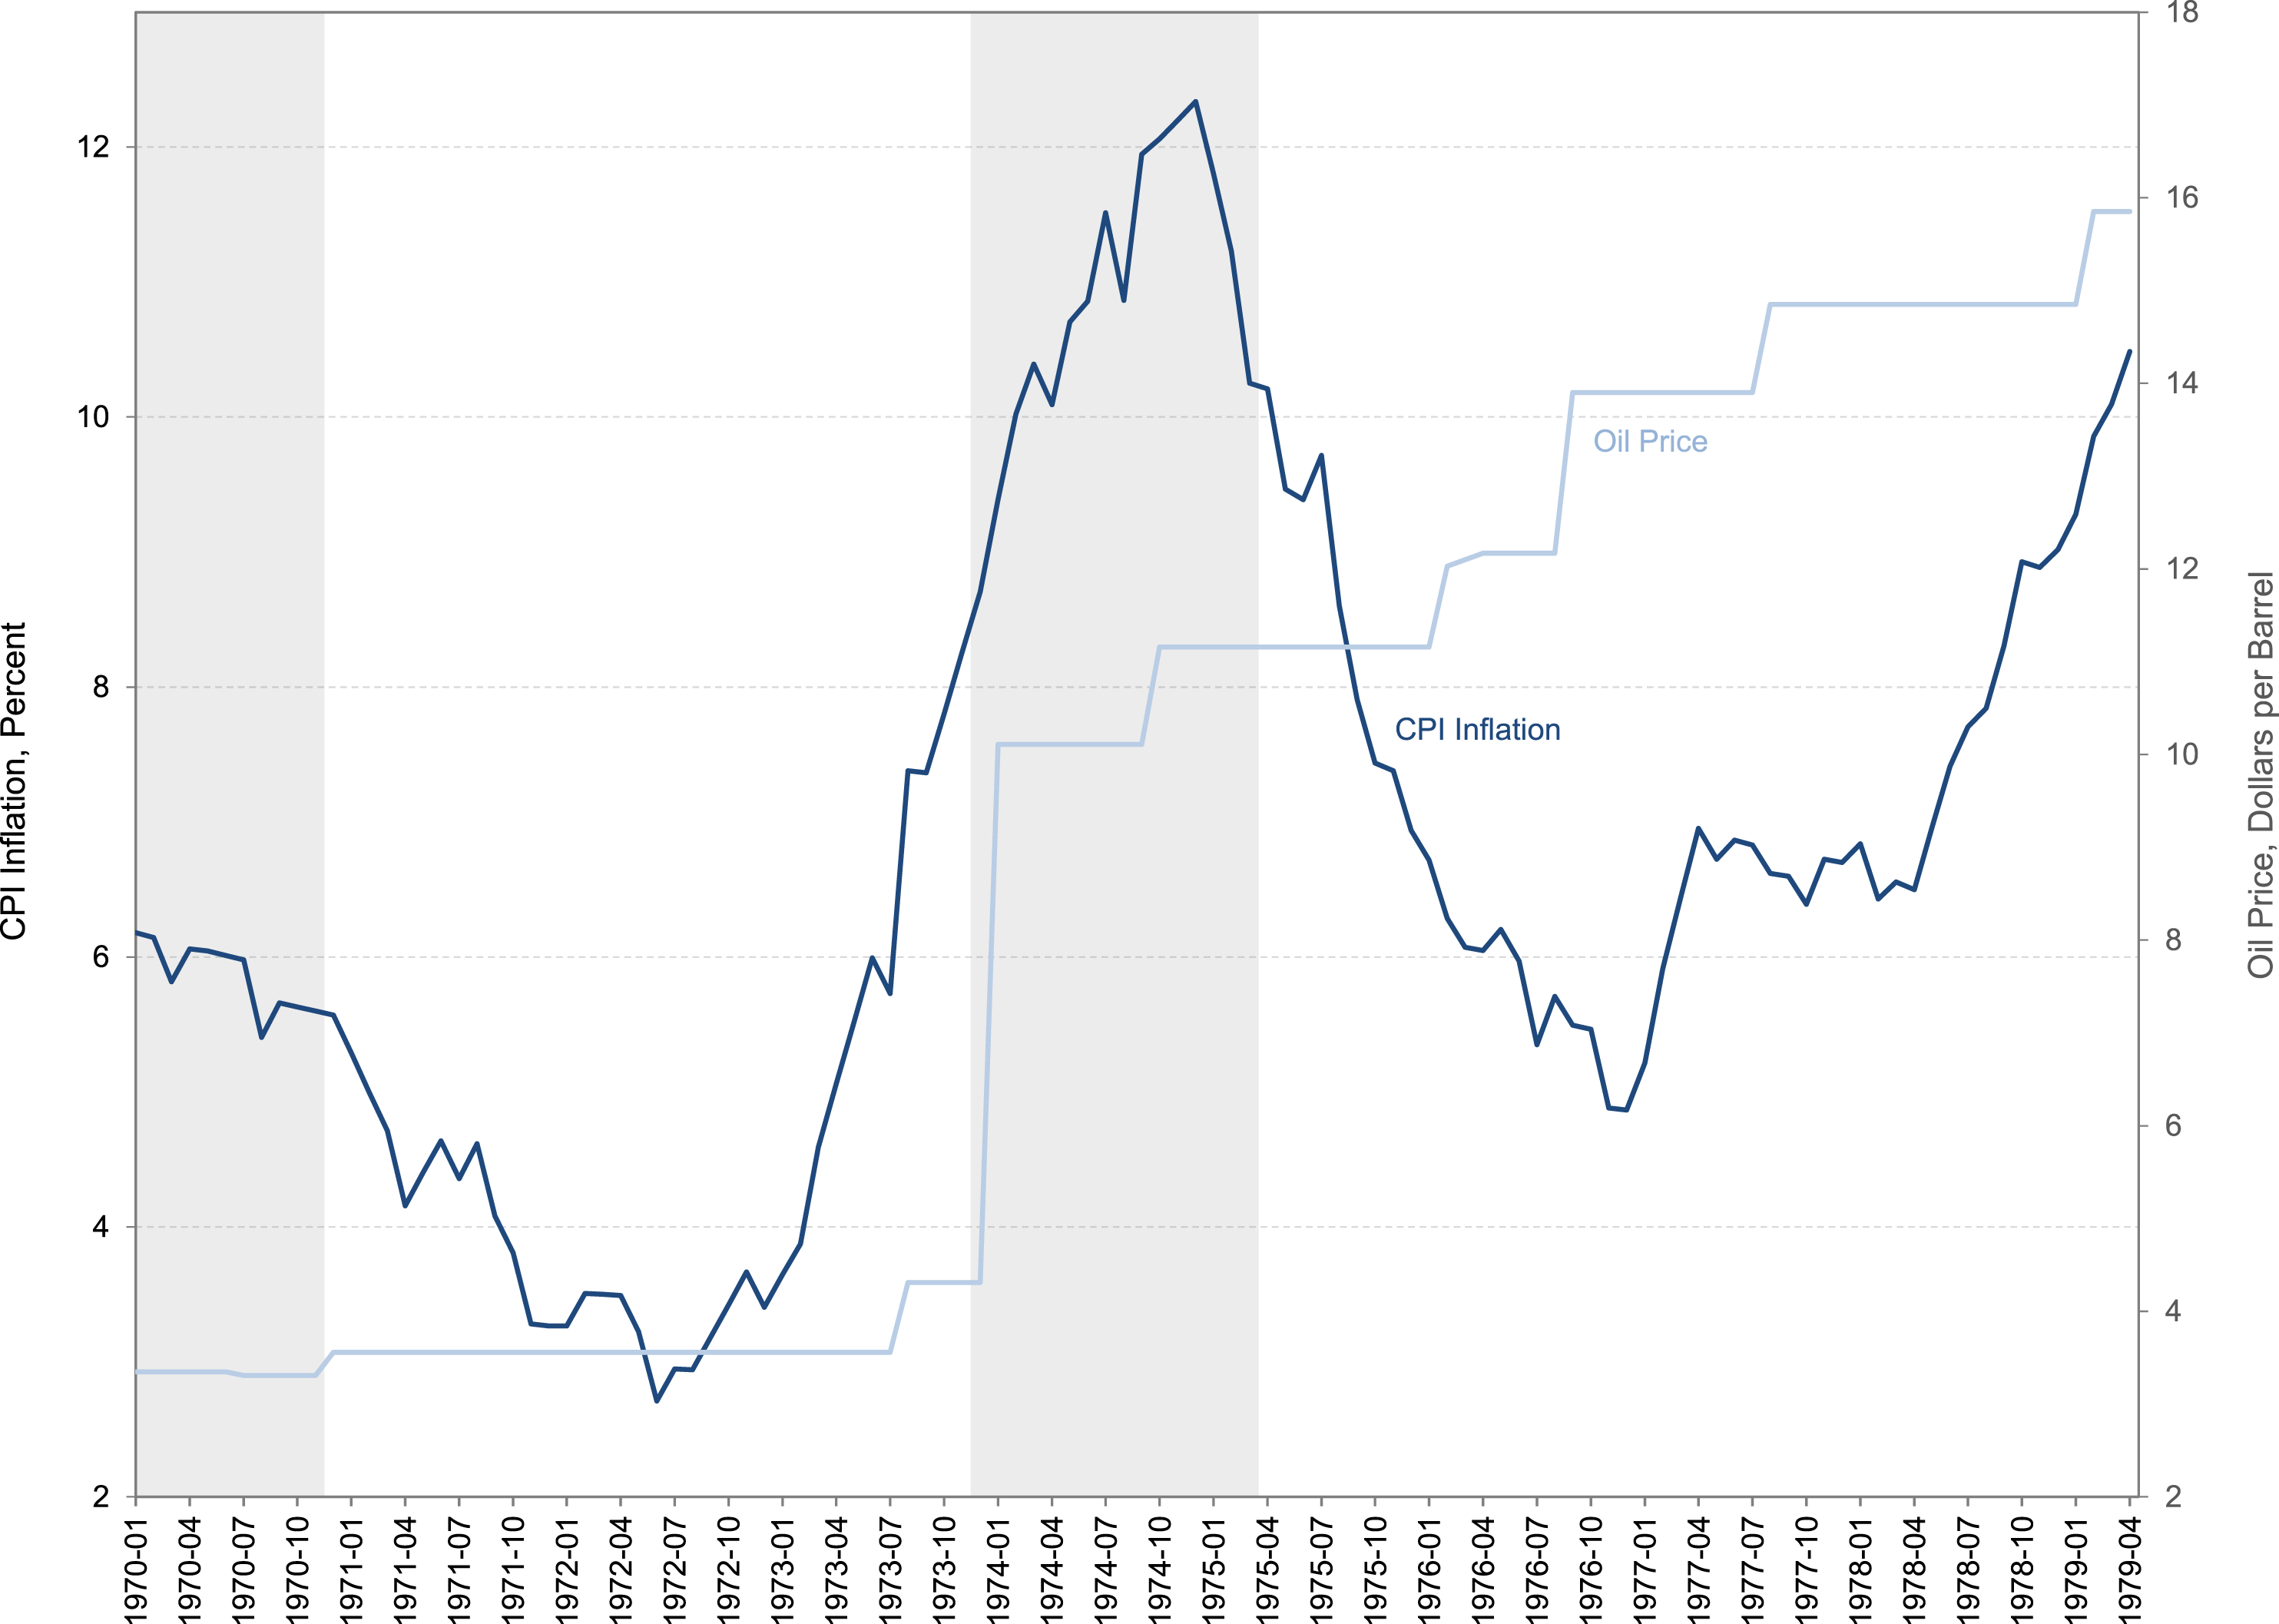
Anytime policymakers are confronted with a decline in output, they should begin by asking themselves what is causing it. If it is not a fall in aggregate demand, fiscal and monetary stimulus are likely to result in inflation and do little to raise output.
A Social Insurance Perspective Is Valuable
A third lesson we learned during the pandemic is that it is valuable to think of fiscal policy in terms of social insurance.
Prior Evidence
For much of the last 70 years, economists and policymakers have tended to think of fiscal policy in largely Keynesian terms. The focus has often been on the impact of fiscal policy on aggregate demand, and less on just what exactly the tax and spending changes actually were. This is reminiscent of John Maynard Keynes’s storied view that it is fine to dig ditches and fill them in, as long as it has the desired impact on aggregate demand.
A focus on social insurance returns to an older view of fiscal policy. This is the idea that taxes and government spending should be used to help smooth out shocks to economic well-being for households. Fiscal policy can provide the insurance against life’s vicissitudes that people wish they had, but that wasn’t available or that people hadn’t thought to buy before it was needed.
Evidence from the Pandemic
A social insurance perspective on fiscal policy is particularly appropriate in a pandemic. In an ordinary recession, fiscal stimulus doesn’t have to go initially to the people who are unemployed or the sectors where demand is low. Raising demand anywhere in the economy will eventually flow throughout the economy. For example, if the recession started with a decline in construction, it isn’t necessary for the government to direct spending to construction. If it gives people a tax cut, that will cause income and employment to rise, which will eventually raise demand for housing and construction.
In a pandemic recession, an increase in aggregate demand doesn’t flow throughout the economy in the same way it does in a more ordinary recession. When certain sectors are shut down because of government orders or because consumers are afraid to venture out, broad fiscal stimulus won’t be able to reach the most affected workers. If all restaurants are closed, a modest stimulus check to households can do little to help unemployed waiters and cooks. The fact that broad stimulus measures can’t rescue workers in industries that are closed for health reasons means that government help needs to be targeted to those directly impacted by the closures.
In a paper recently published in the Journal of Economic Perspectives (Romer & Romer, 2022), David Romer and I develop an analytical framework for thinking about what a social insurance perspective implies for optimal fiscal policy in a pandemic. We start with a very simple set-up. There are two sectors, one that can operate safely in a pandemic and so can remain open, and one that must close. We assume that people have the normal diminishing marginal utility, and so they want to smooth their consumption across states of the world. They also get disutility from working. We also assume that it is hard for people to change the sector they work in, so if something shuts down their sector, their income falls dramatically. We then work through what insurance people would have liked to have, had they contemplated the possibility that a pandemic could shut down some sectors, and what government fiscal policies would replicate that desired insurance.
In the simplest case, where there are no issues of fairness or difficulty in identifying who could work and who couldn’t, people would want insurance that provides income support if their sector shuts down because of a pandemic, and would be willing to fund such support for others. This outcome can be mimicked by a government program that provides unemployment insurance payments, and funds them by taxing those who remain employed.
Variations of the baseline simple case provide more nuanced implications. For example, how generous the unemployment payments should be depends on notions of fairness and whether the government can observe whether someone qualifies. The model implies that concern about fairness would lead to less consumption for unemployed workers than for those who remain employed, because only the employed have the disutility of working.
Another nuanced version of the model considers what insurance people would have liked to have if there were three sectors rather than two. Suppose that in addition to a closed sector and an open sector where it is safe to keep operating, there is a risky sector that stays open because it is essential—for example, medical care or public transportation. We show that in plausible cases, the insurance people would wish to have not only provides for income if their sector shuts down, but also for extra pay if they keep working in a hazardous essential occupation. This outcome could be achieved by the government if, in addition to unemployment insurance, it provides hazard pay to essential workers in risky occupations.
In the paper, we then evaluate how closely what was actually done with fiscal policy in the pandemic in the United States matches what a social insurance perspective would recommend. We find that the expansions in unemployment insurance included in the CARES Act and extended in subsequent legislation were highly desirable. At the time they were first passed, proponents fondly referred to this as “unemployment insurance on steroids.” Unemployment benefits were expanded to include many people who had not been covered before, such as self-employed workers, workers in the gig economy, and new labor force entrants who had had their accepted job offers revoked. Figure 4 shows the recipiency rate for unemployment insurance in the United States. The data show that close to 100% of those unemployed during the pandemic received unemployment benefits—which was a dramatic increase from the less than 50% or so that are typically covered by these programs. The length of time over which people could receive benefits was also extended as the economic effects of the pandemic dragged on. Both of these expansions in unemployment benefits are exactly what a social insurance perspective suggests is desirable. The aid is targeted toward the workers who were most directly affected by the pandemic. Unemployment Insurance Recipiency Rate. Notes: The recipiency rate is calculated as the ratio of continuing claims for unemployment insurance (monthly and seasonally adjusted) to the number of unemployed (again, monthly and seasonally adjusted). It is multiplied by 100 to express it as a percent. Sources: U.S. Employment and Training Administration and Bureau of Labor Statistics, downloaded from FRED, 2/4/2022.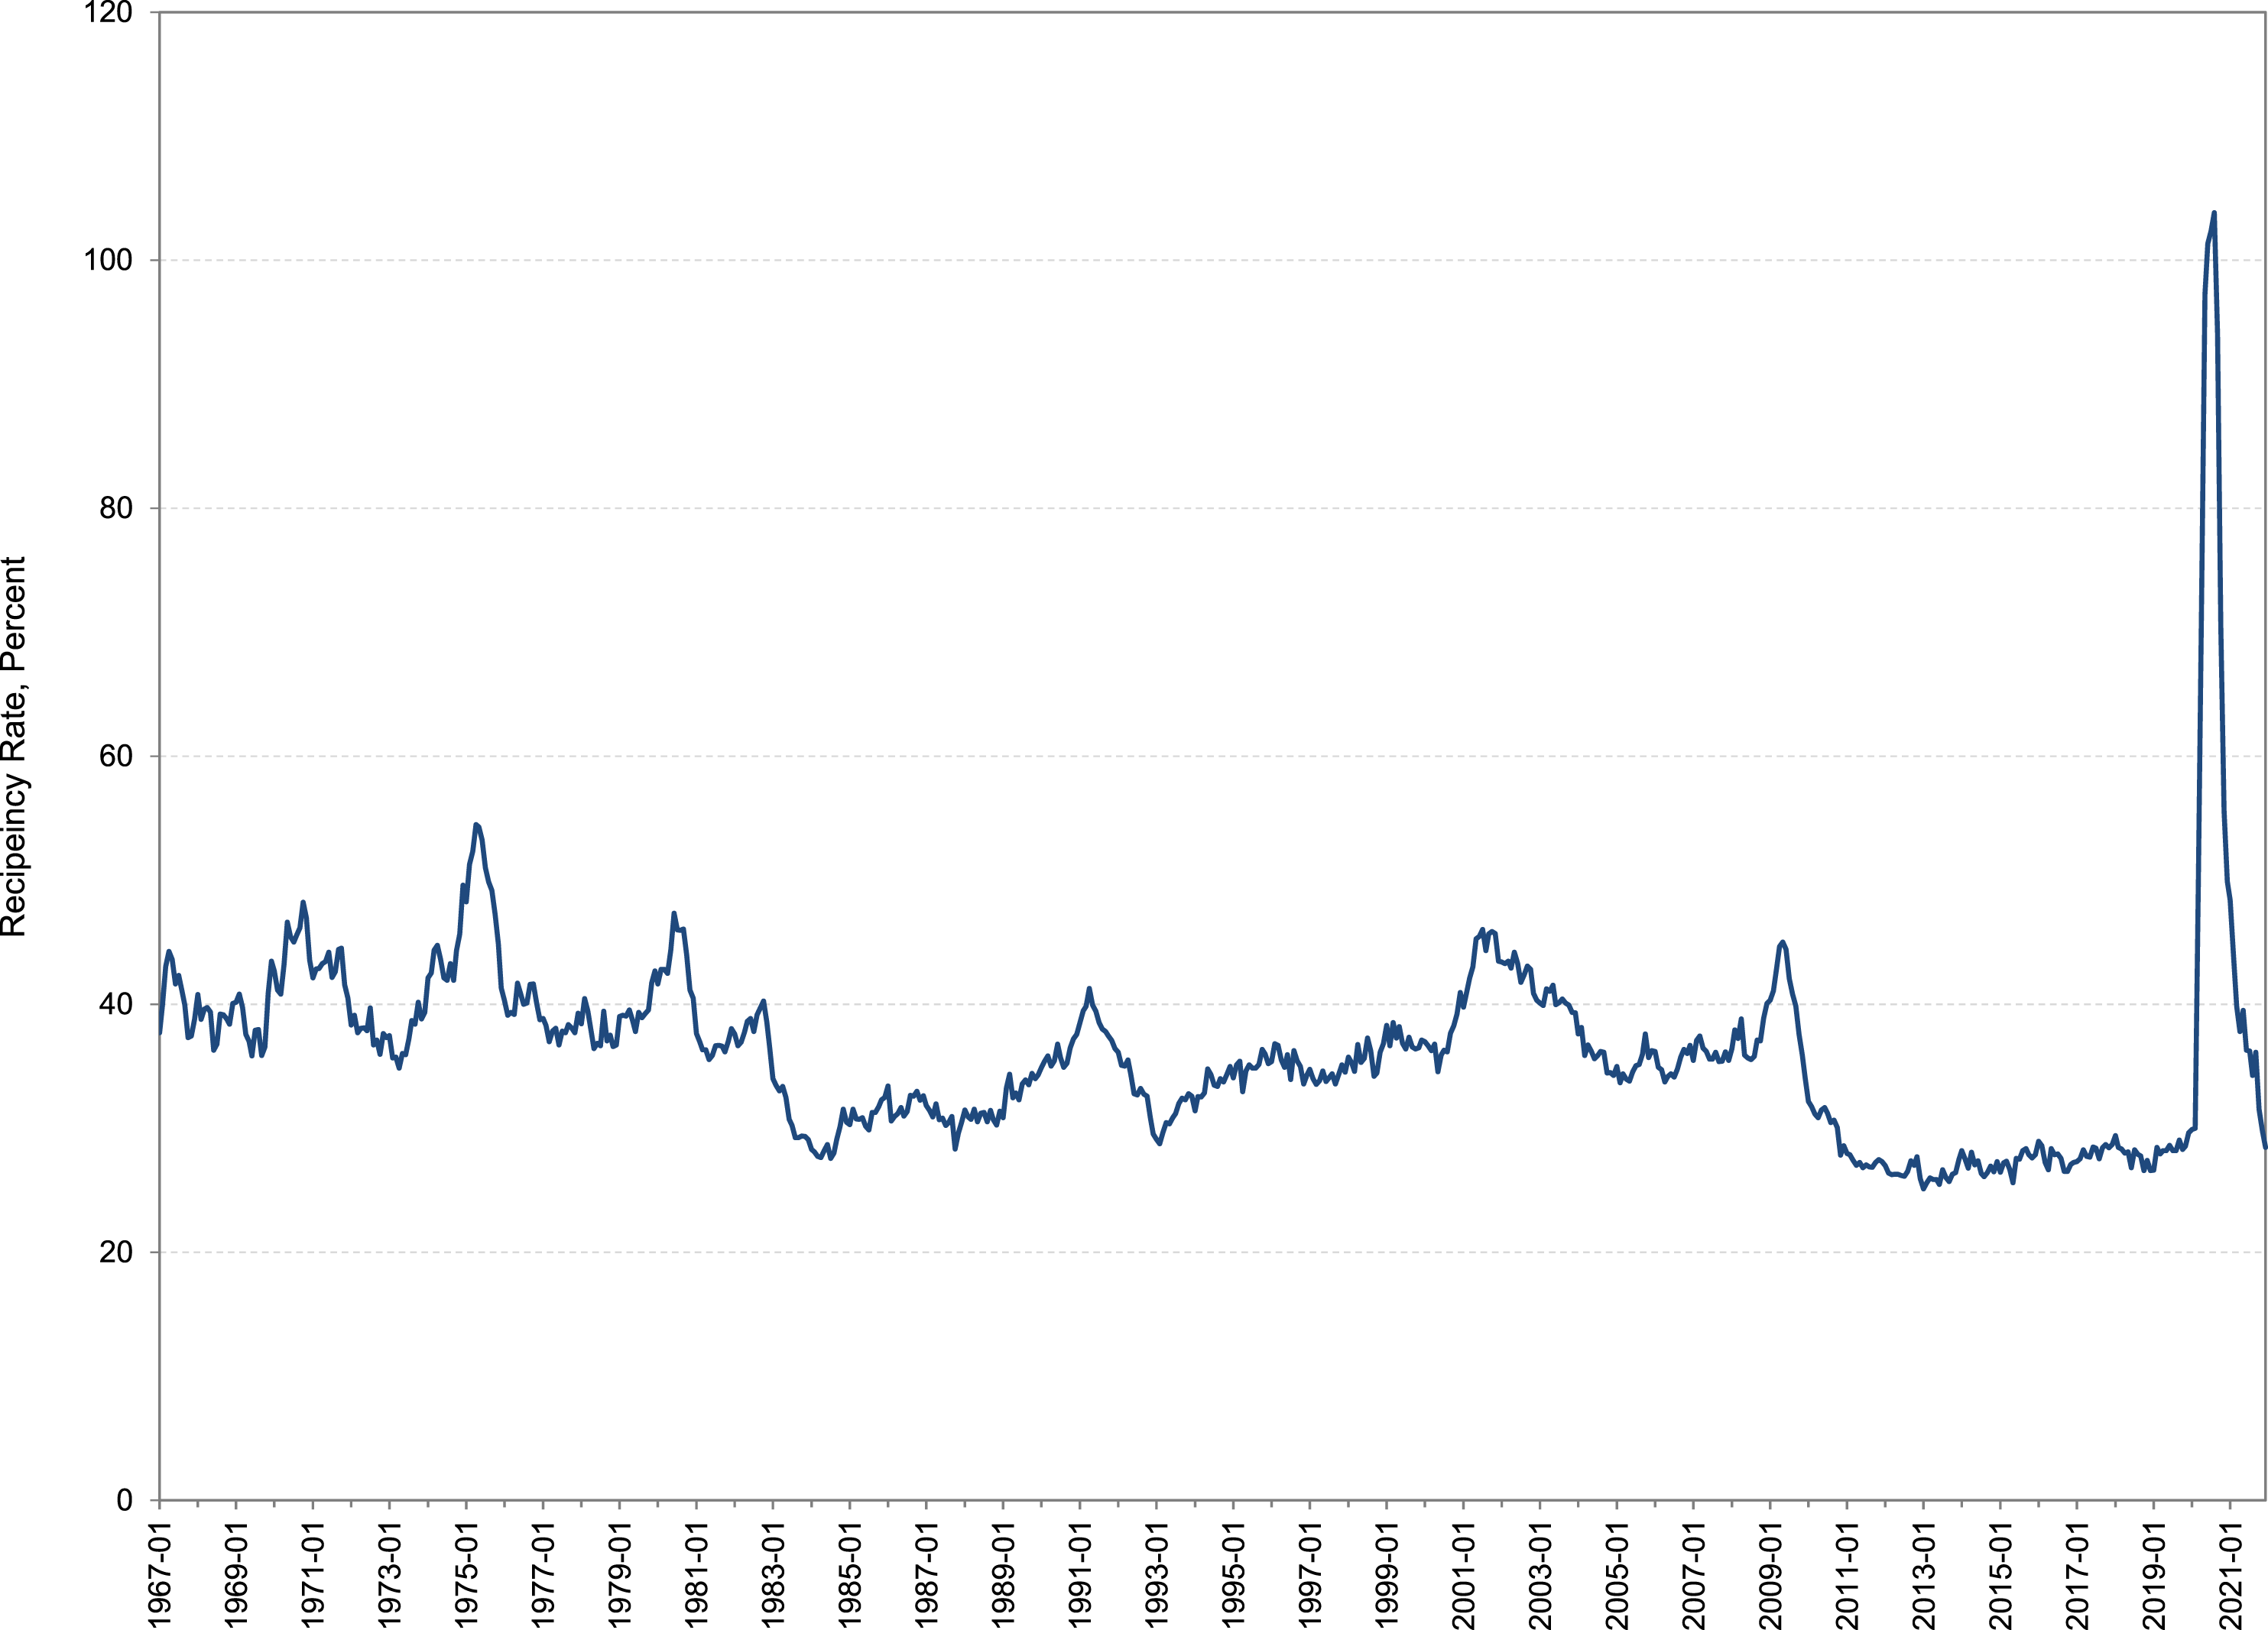
In addition to making unemployment insurance more widely available, the pandemic fiscal response also made the benefits much more generous. As discussed above, weekly benefits were increased early in the pandemic by a flat $600 for all recipients. This increase pushed the fraction of wages replaced by benefits to over 100% for a large number of low-wage workers (Ganong et al., 2020). While such high replacement rates were surely desirable on equity grounds and helped ease the pain of the pandemic recession for many families, they are not consistent with a social insurance perspective. They don’t mimic the insurance people would have purchased for themselves if they had had the opportunity and foreseen the pandemic.
In contrast to what a social insurance perspective suggests, very few hazard pay programs were adopted during the pandemic. There were a few state programs that were funded through the CARES Act. For example, Pennsylvania had a program that paid low-wage essential workers in a number of industries a bonus of $3 per hour for a limited time period. And, there were a couple of proposals for a federal program that didn’t make it to law. For example, the Health and Economic Recovery Omnibus Emergency Solutions (HEROES) Act, which passed the House but not the Senate, called for hazard pay of $13 per hour for a wide group of essential workers.
We show that many of the proposed hazard pay programs were broader and more generous that a data-driven social insurance perspective would support. The actual elevation in Covid-19 risk was fairly small for most workers in essential industries. Only a few groups, such as medical workers and public transit workers, faced substantial risk of infection from their jobs. And our calculations suggest that the dollar value of the additional risk for such workers was likely closer to the $3/hour in the Pennsylvania program than the $13/hour in the federal proposals. But, it remains the case that policymakers missed a chance to have a fiscal program that would have both compensated essential workers for the hazards they were facing and encouraged such workers to continue doing necessary jobs.
Implications for Other Recessions
Though looking at fiscal policy through the lens of social insurance is essential in a pandemic, it could be useful more generally. Even ordinary recessions have highly unequal effects on people. Most people keep their jobs, but a fraction experience a potentially devastating loss of employment. Thinking in terms of social insurance may lead to fiscal stimulus that accomplishes multiple goals. Spending and tax cuts that are targeted to those most affected can both stimulate demand and have a larger welfare impact than more broad-based stimulus measures.
It is also possible that future recessions may share the feature of the pandemic recession that fiscal stimulus cannot flow easily through the economy. For example, climate change may lead to extreme weather events and fires that shut down only certain regions of the country or certain types of economic activity. If such regional or sectoral shocks are large enough, they could cause business-cycle-sized falls in aggregate output. But, a national tax cut or infrastructure spending would do little to help those most directly affected. More targeted aid and hazard pay would likely be much more effective in healing the economy and improving social welfare.
The Timing of the Effects of Fiscal Stimulus Can Be Unpredictable
A fourth lesson that we learned from the pandemic is that the timing of the effects of fiscal stimulus on the economy can be unpredictable.
Prior Evidence
Once again, this was something that we already knew, though some may have forgotten. There have certainly been times in the past when fiscal policy hit the economy at just the wrong time. One example is the 1964 tax cut, which was first proposed in the summer of 1962. Though it was not explicitly countercyclical, a strong motivation for the tax cut was a desire to raise the normal rate of economic growth and lower normal unemployment. Figure 5 shows that by the time it became law in late February 1964, unemployment was already headed down and inflation was rising. The tax cut ended up fueling an inflationary boom. Inflation and Unemployment around the 1964 Tax Cut. Notes: The inflation rate is the Consumer Price Index for All Urban Consumers: All Items in U.S. City Average, percent change from year ago, monthly, not seasonally adjusted. The unemployment rate is monthly and seasonally adjusted. The vertical line denotes the date of passage of the Revenue Act of 1964. Sources: Bureau of Labor Statistics, downloaded from FRED, 2/4/2022.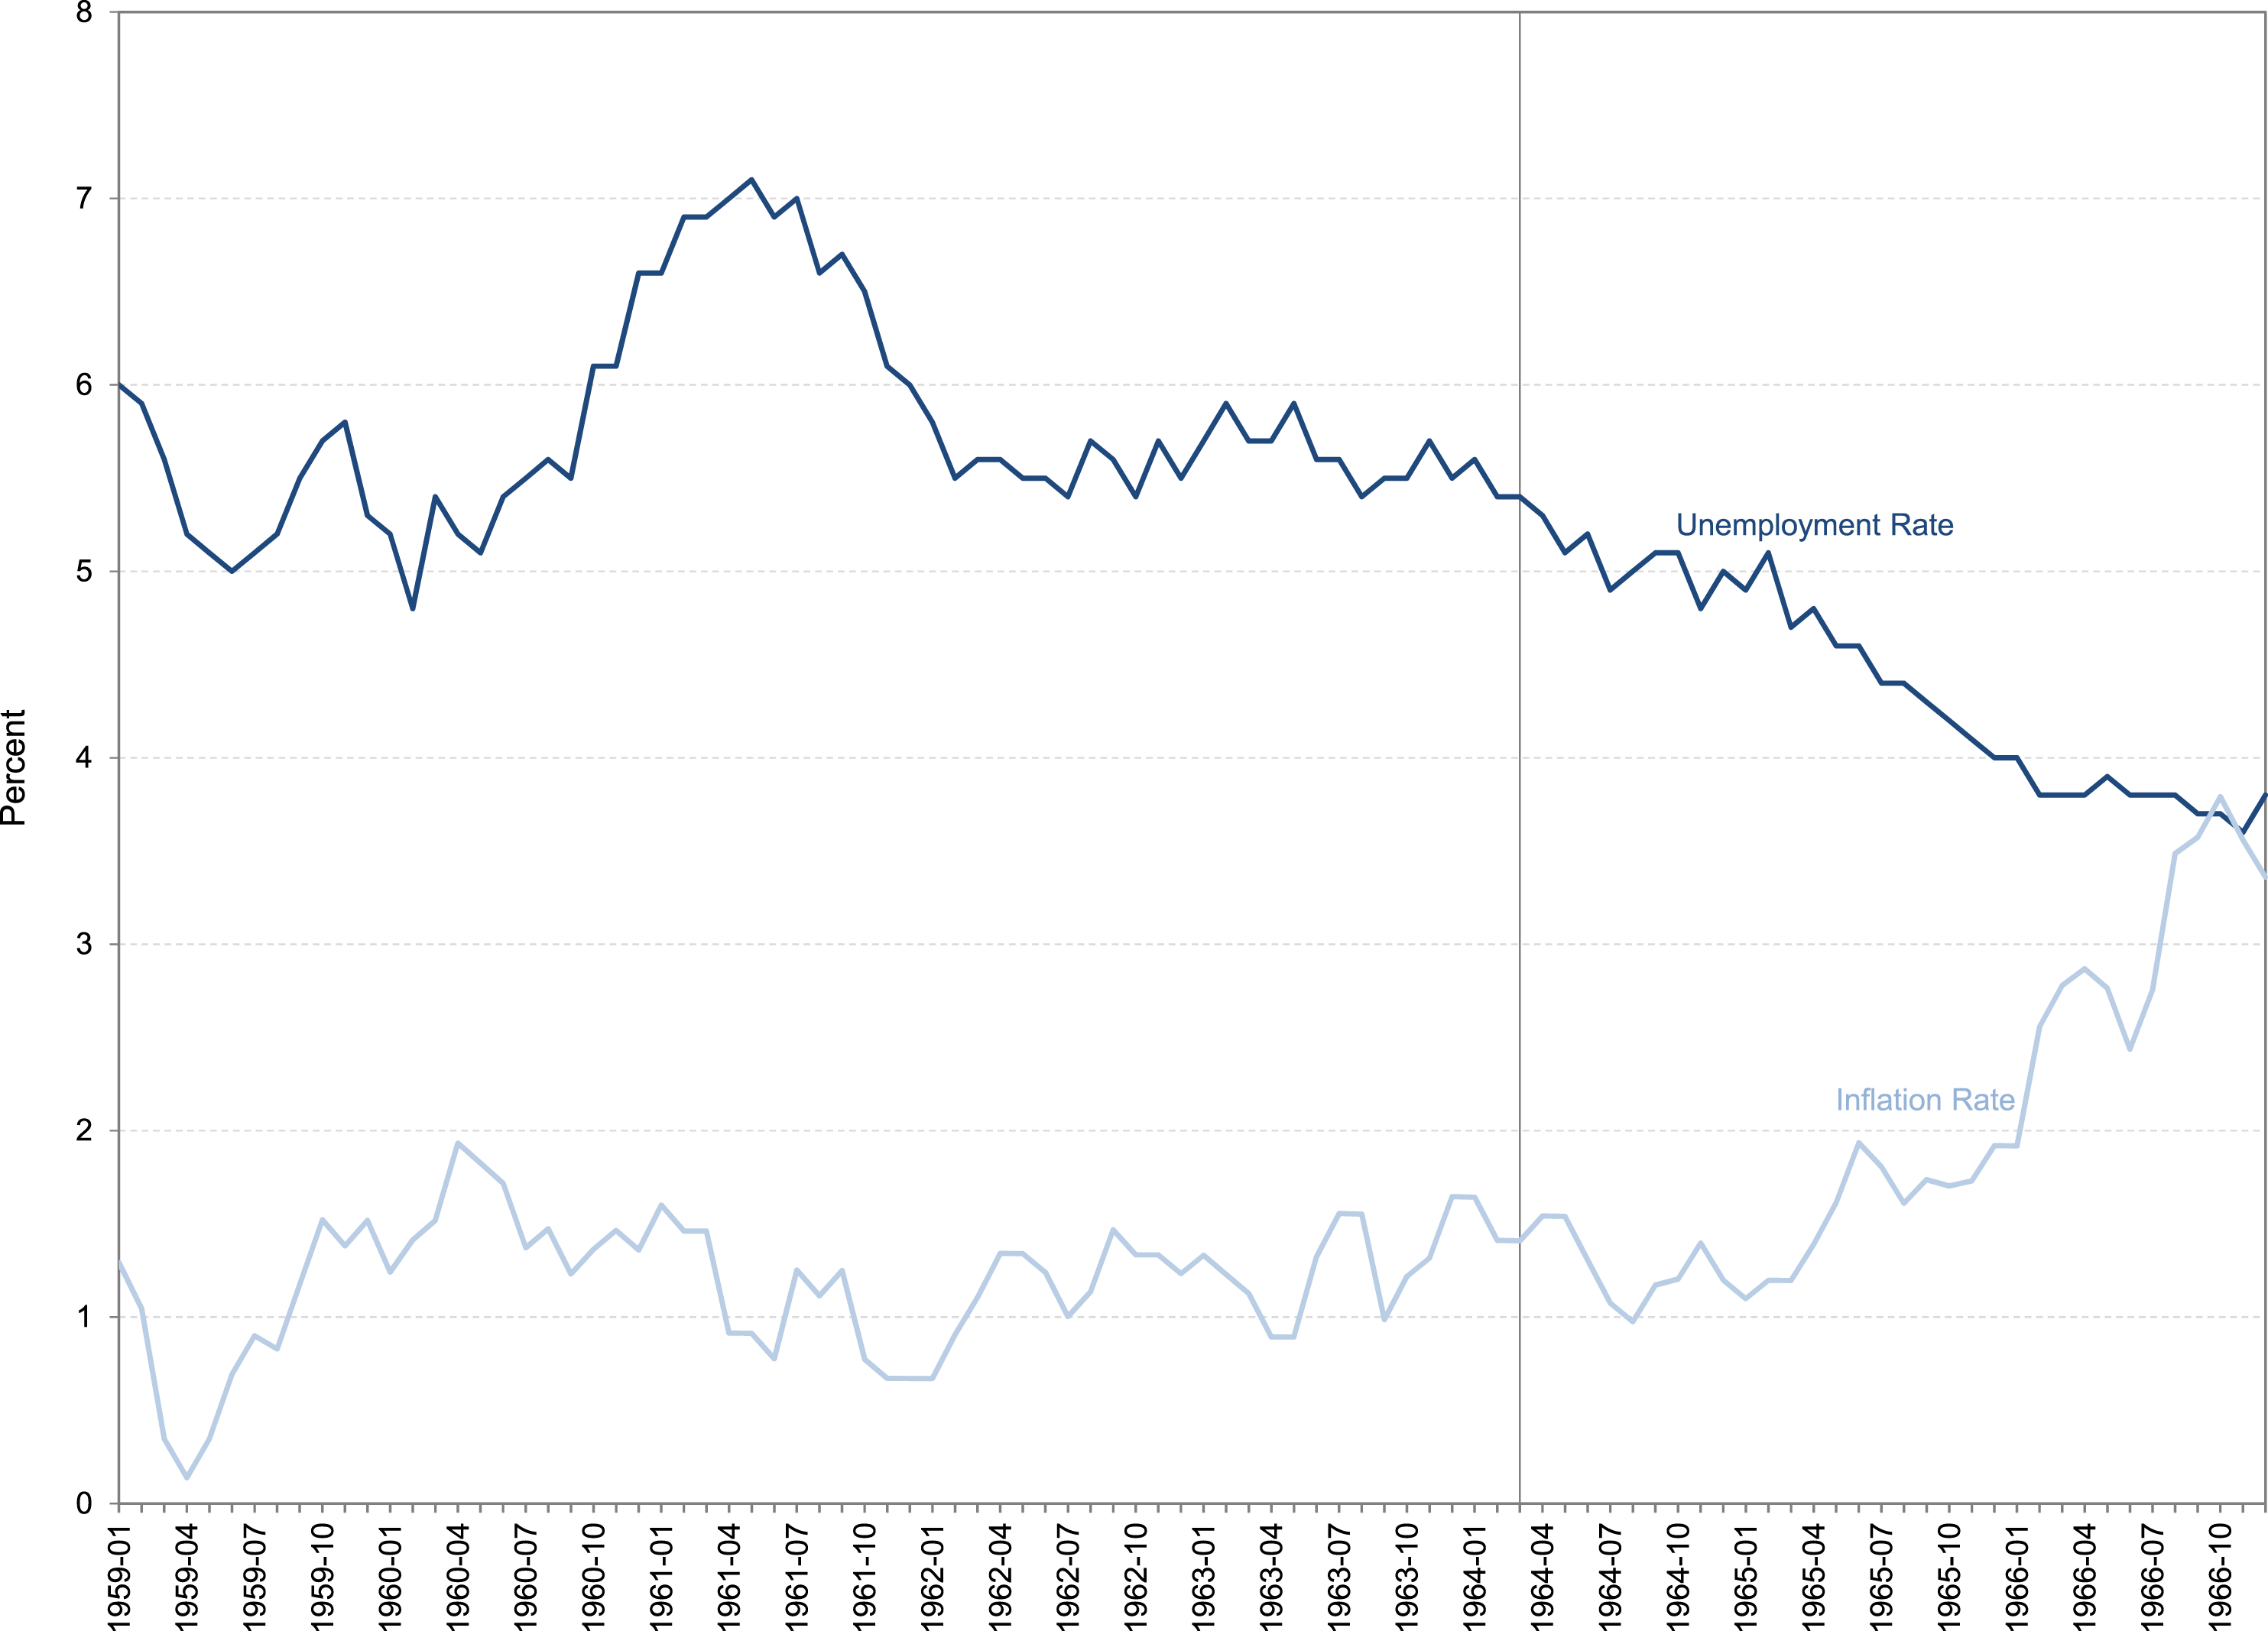
More broadly, one reason that fiscal policy had fallen out of favor as a tool for macroeconomic stabilization was that its lag, both in getting legislated and impacting demand, was unpredictable. By the late 1980s, economists had largely agreed that monetary policy was the preferable tool for short-run aggregate demand management. It was only the very low interest rates of the early 2000s, which decreased the running room of monetary policy, that led to a resurgence in support for countercyclical fiscal policy.
Evidence from the Pandemic
The pandemic has once again shown that fiscal policy may not stimulate the economy when you expect it to. I discussed before that some components of the pandemic fiscal response had a diminished impact. Most obviously, a large chunk of the stimulus payments appear to have been saved. Figure 6 highlights the rapid rise in the net saving of households and institutions (as a share of GDP) during the pandemic. Brunet and Hlatshwayo (2021) discuss that the only precedent for such an enormous rise was during World War II. Daco (2021) of Oxford Economics puts the dollar value of savings in the United States in excess of the pre-pandemic trend at $2.3 trillion in May 2021. As in the early 1940s, some of the increase in saving in 2020 was the result of business closures and shortages of certain goods. But, Brunet and Hlatshwayo estimate that the huge fiscal expansion was a major factor in 2020—just as it was during the World War. Net Saving of Households and Institutions. Notes: The saving data are expressed as a percent of nominal GDP. The data are from the National Income and Product Accounts, Table 5.2 (Saving and Investment by Sector) and Table 1.1.5 (GDP). Source: Bureau of Economic Analysis, https://apps.bea.gov/iTable/index_nipa.cfm, downloaded 1/31/2022.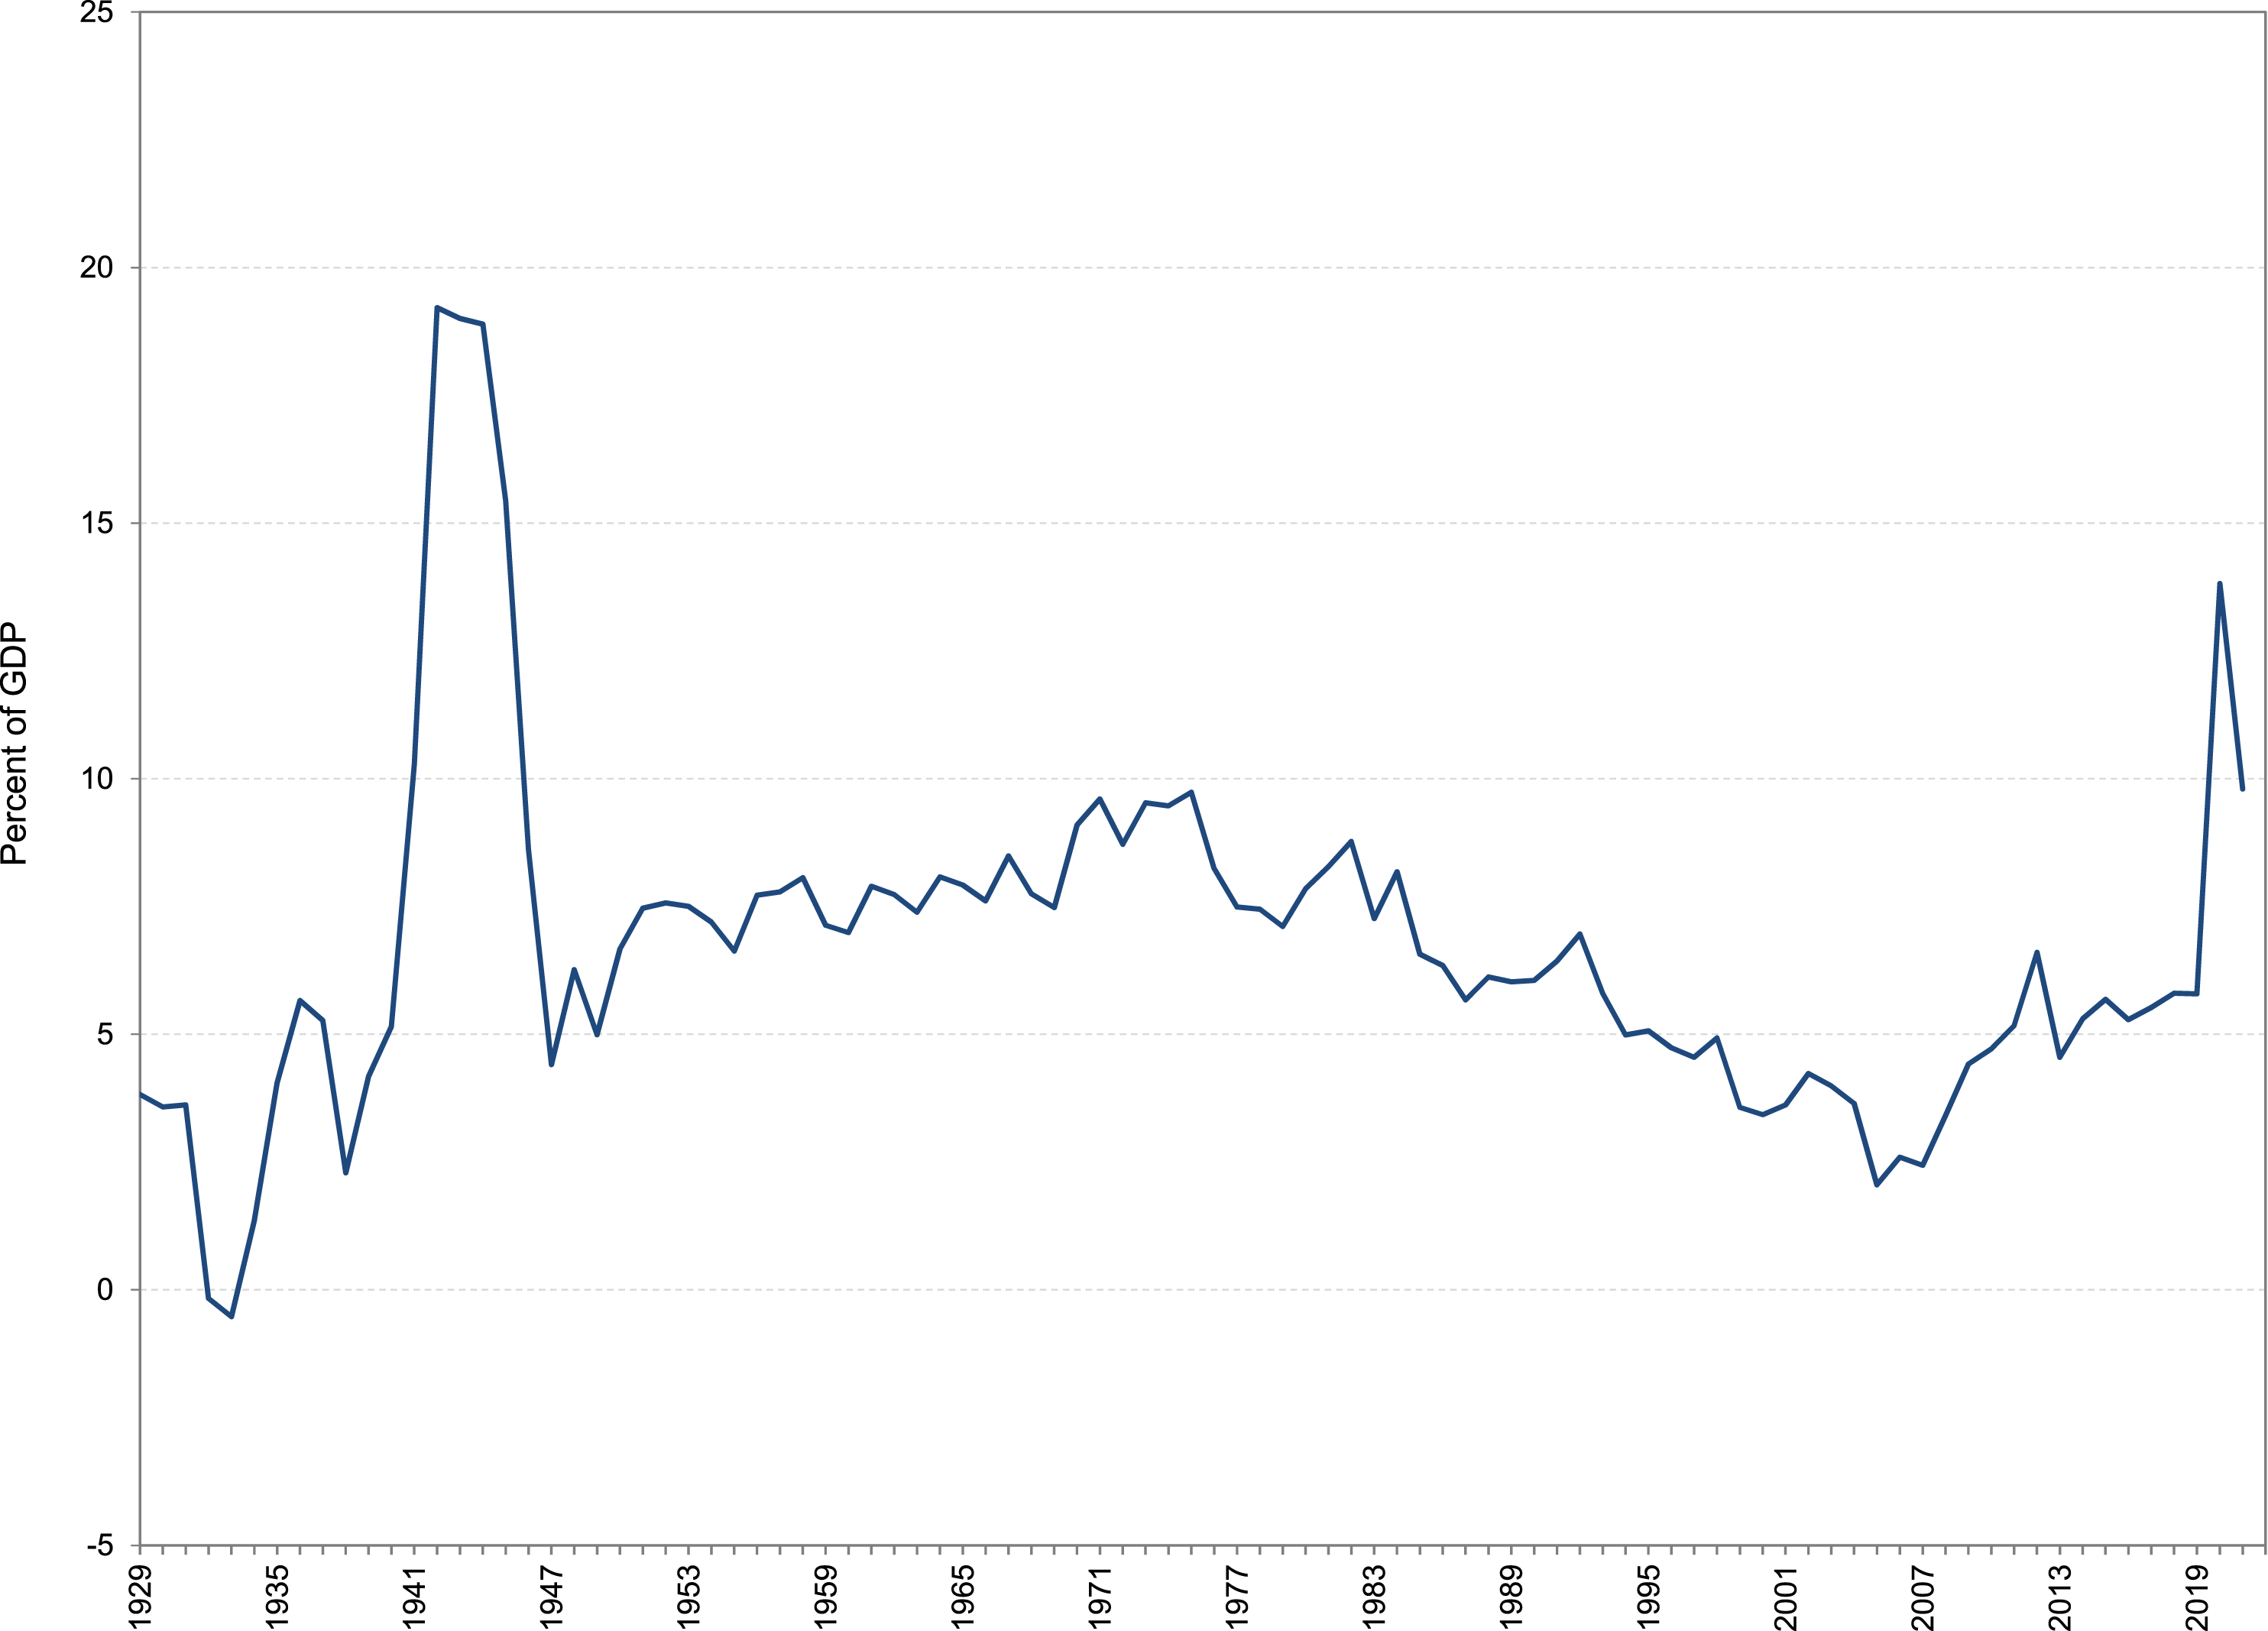
Most of that increased saving is still just sitting on the sidelines. Though there have been predictions that consumer spending will surge, it has only picked up mildly in recent months. So, we may be yet to see some of the main effects of a fiscal expansion that happened more than a year ago. The unusual conditions of the pandemic caused some of the expansion’s impact to be quite delayed.
This is obviously concerning considering what is happening to inflation. Figure 7 shows the percentage change in the consumer price index from a year ago. That number had been hovering around 2% in 2019. It fell to near zero early in the pandemic, in large part because of the fall in the price of oil. It has since risen substantially—the number for December 2021 was 7.0%. CPI Inflation since 2019. Notes: The inflation rate is the Consumer Price Index for All Urban Consumers: All Items in U.S. City Average, percent change from year ago, monthly, not seasonally adjusted. The shaded gray area denotes the pandemic recession as identified by the NBER. Sources: Bureau of Labor Statistics, downloaded from FRED, 2/4/2022.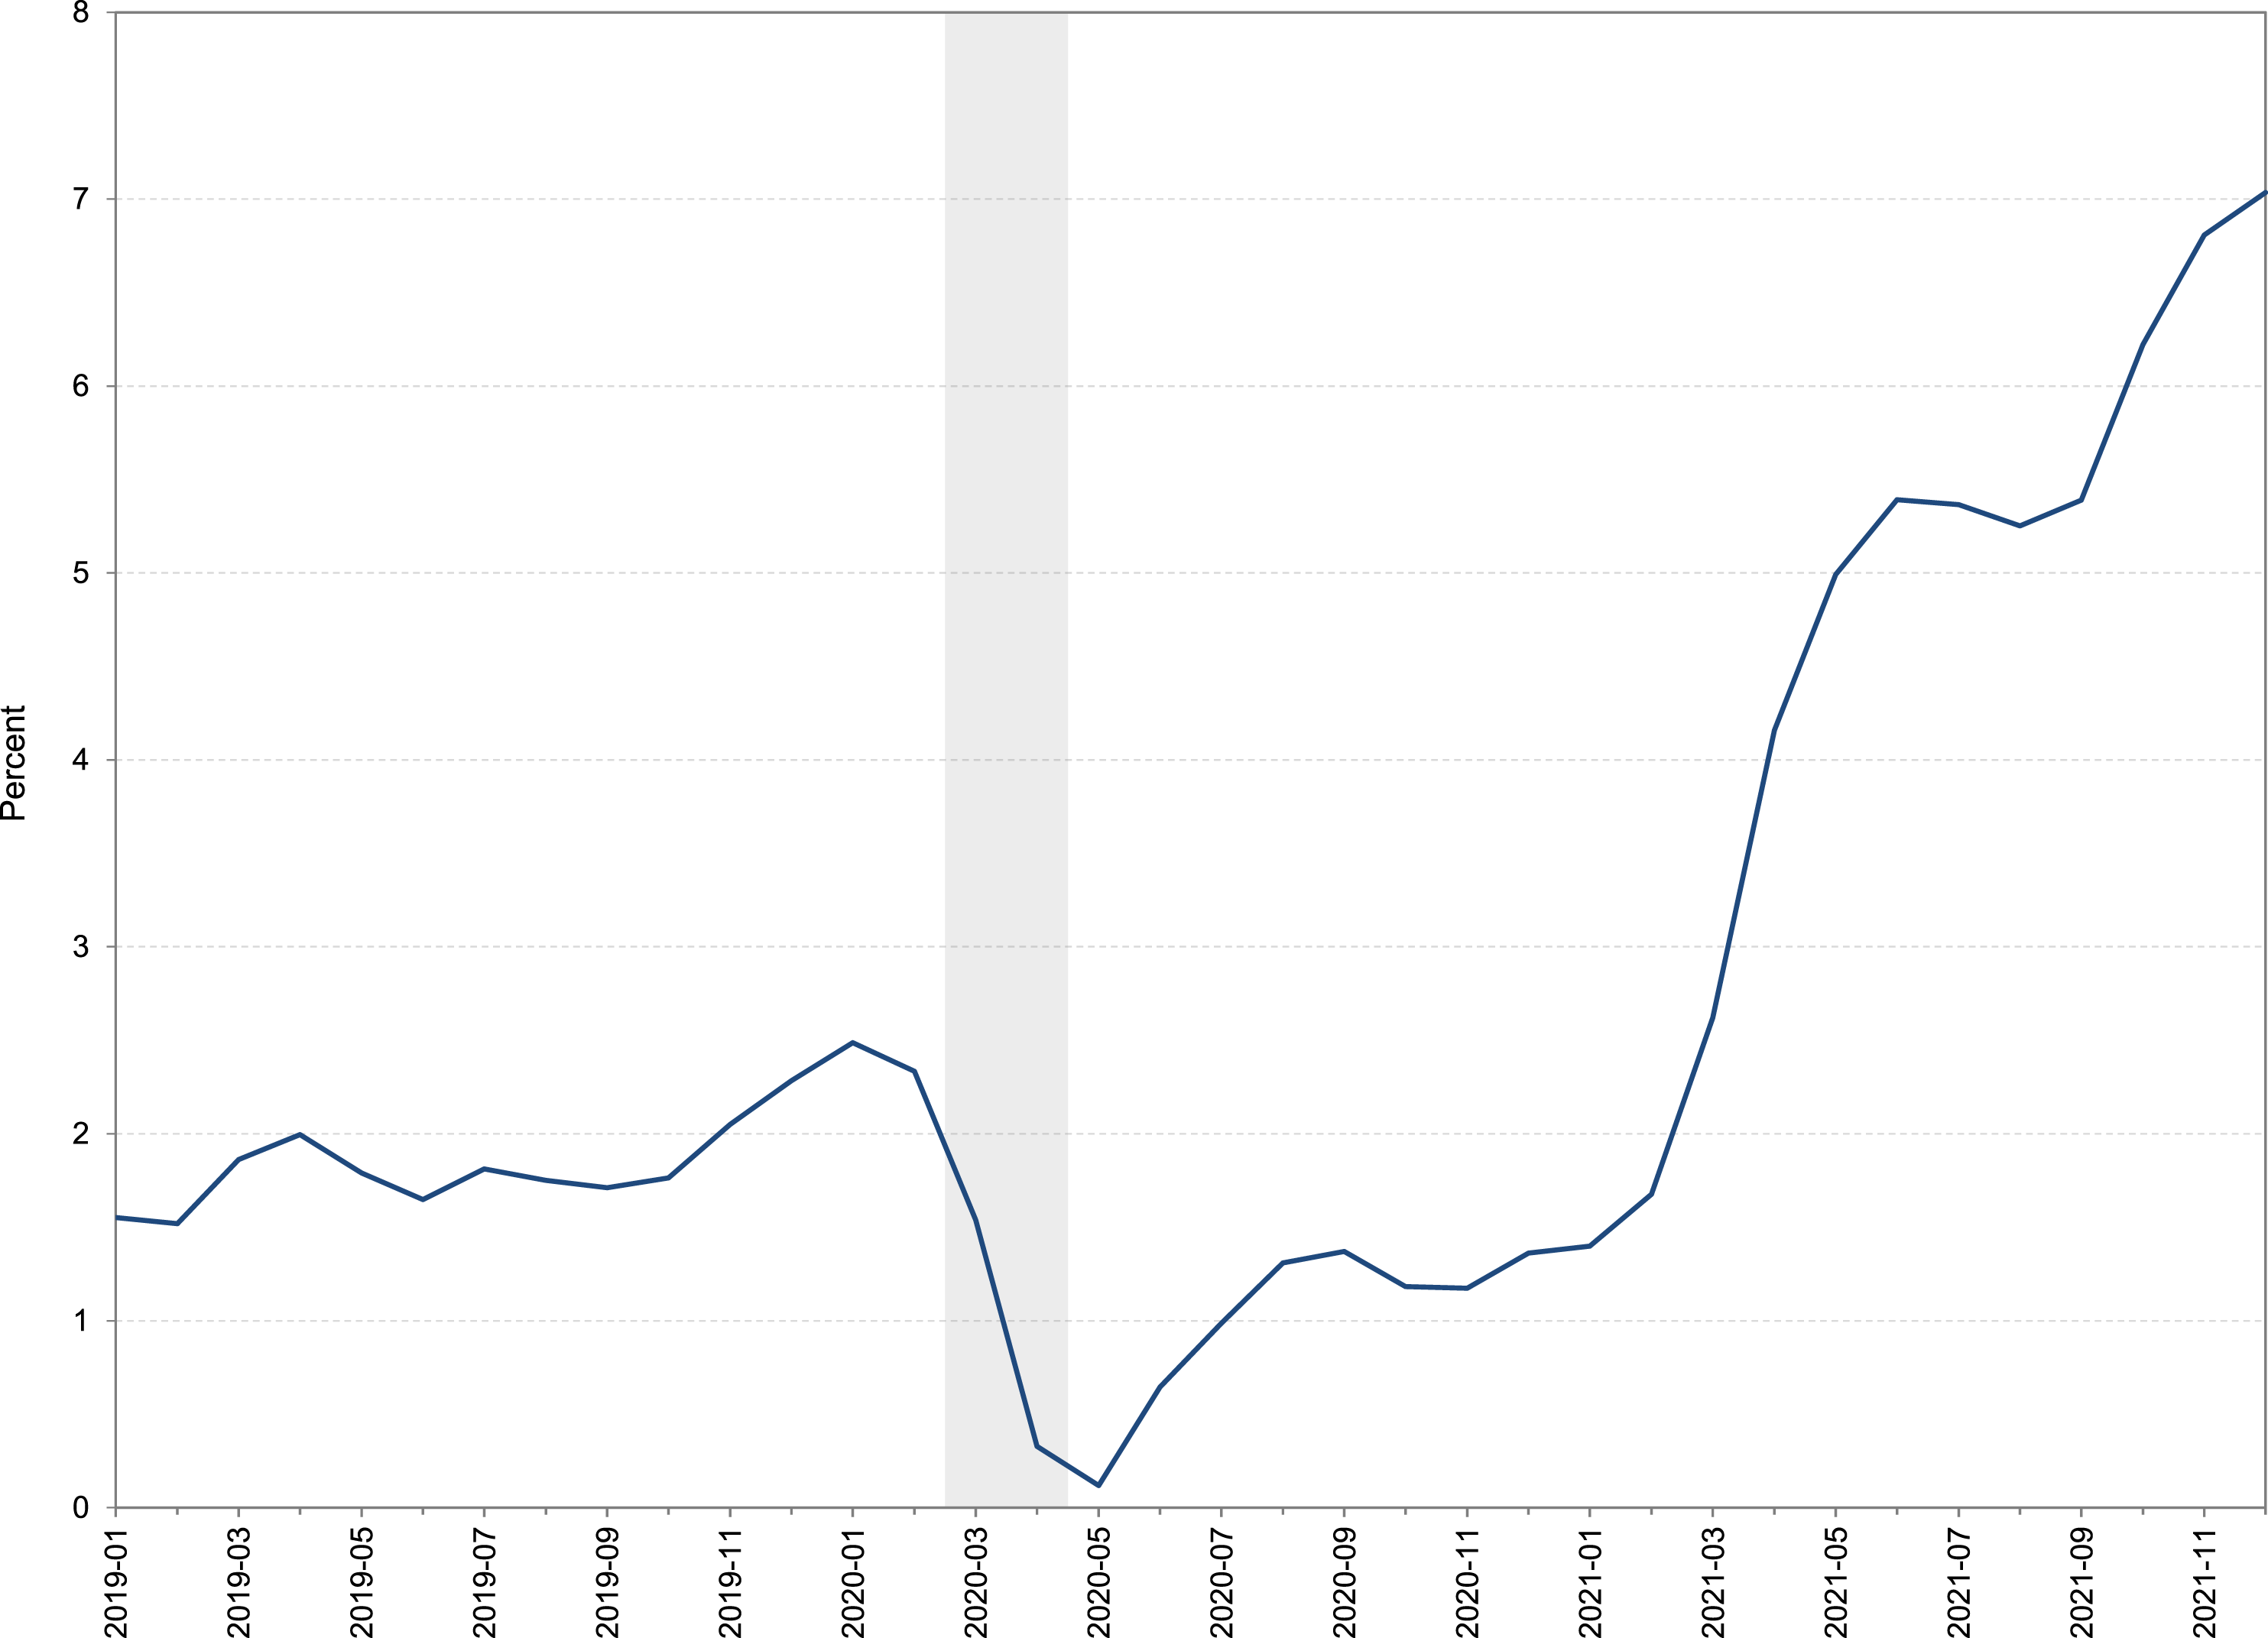
Some of this rise reflects disruptions to supply chains. The prices of ocean shipping and key commodities have risen substantially. But given that those prices have largely stabilized, that can’t be the whole story for why inflation is continuing. It appears that employment and production are greater than the current comfortable level for the economy: the combination of a reduction in potential output caused by a drop in the labor force and the large fiscal stimulus has led to a situation of excess demand. If consumer spending comes racing back because of the large stock of saving before workers come back into the labor force, we could be in a bad way. We could find ourselves with some very poorly timed effects of fiscal policy.
Implications for Other Recessions
This lesson that the impact of fiscal policy may be somewhat unpredictable has implications for using fiscal policy to address future recessions. One is that it is wise to target aid to people who are most likely to respond. What we saw in the pandemic was that both unemployed workers and low-income households tended to spend funds they received. This, of course, makes sense. Those in acute distress are unlikely to save transfer payments. Targeting such recipients is likely to yield more predictable impacts of fiscal stimulus. It also has the benefit of being more effective in terms of its impact on total welfare.
The unpredictability of fiscal stimulus also argues in favor of the kinds of triggers and automatic fiscal policy discussed above. Policies that turn off and on in response to economic conditions, or even to metrics like saving behavior and retail sales, could increase the predictability of fiscal policy.
Debt Still Matters
A fifth and final lesson about fiscal policy from the pandemic is that debt still matters. There has been a recent trend toward downplaying the potential negative effects of persistently large budget deficits and high government debt. And this trend is not just among the proponents of Modern Monetary Theory, but among such prominent mainstream economists as recent American Economic Association President Olivier Blanchard (2019). I believe the pandemic has challenged that view.
Prior Evidence
In a 2018 paper, David Romer and I presented an empirical argument that debt mattered for the fiscal response to financial crises (Romer & Romer, 2018). We developed a scaled measure of financial distress for 24 OECD countries. This measure picked up both full-fledged financial crises, and more limited cases of financial impairment. We combined this new series with data on deliberate changes in the budget surplus in each country over time. That is, we constructed a measure of the change in the high-employment surplus. A rise in the high-employment surplus is a contractionary fiscal action. We found that there is substantial variation in the amount of fiscal expansion across countries following a financial crisis, even controlling for how bad the financial distress was.
We then tested whether the fiscal response to financial distress depends on fiscal space. By fiscal space, we just mean the room the government has to use fiscal policy. One simple measure of this is the debt-to-GDP ratio prior to the financial distress. We found that the debt-to-GDP ratio matters tremendously. There is a strong negative relationship: the higher the debt ratio, the smaller the expansionary fiscal response. We illustrated this empirical finding by comparing the fiscal response to a crisis in two representative cases: a country with a debt ratio one standard deviation below the sample mean, and a country with a debt ratio one standard deviation above the mean.
Figure 8 shows the results. The fiscal response to a financial crisis in these two cases is dramatically (and significantly) different. In response to a moderate financial crisis, a country with a low debt ratio (so lots of fiscal space) decreases its high-employment surplus by 3 percentage points. That is, it runs very expansionary fiscal policy. A country with a high debt ratio (so little fiscal space) actually increases its high-employment surplus by about the same amount. That is, it runs highly contractionary fiscal policy following a financial crisis. Response of the High-Employment Surplus to a Financial Crisis with More and Less Fiscal Space. Notes: The figure shows the implied impulse response function of the high-employment surplus to a moderate financial crisis for a country with a debt-to-GDP ratio in the previous calendar year one standard deviation below the sample mean (“with more fiscal space”), and for a country with a debt ratio one standard deviation above the sample mean (“with less fiscal space”). The dotted lines show the two-standard-error confidence bands. The relationship is estimated on a sample of 30 OECD countries for the period 1980:1–2017:2. Source: Romer and Romer (2019).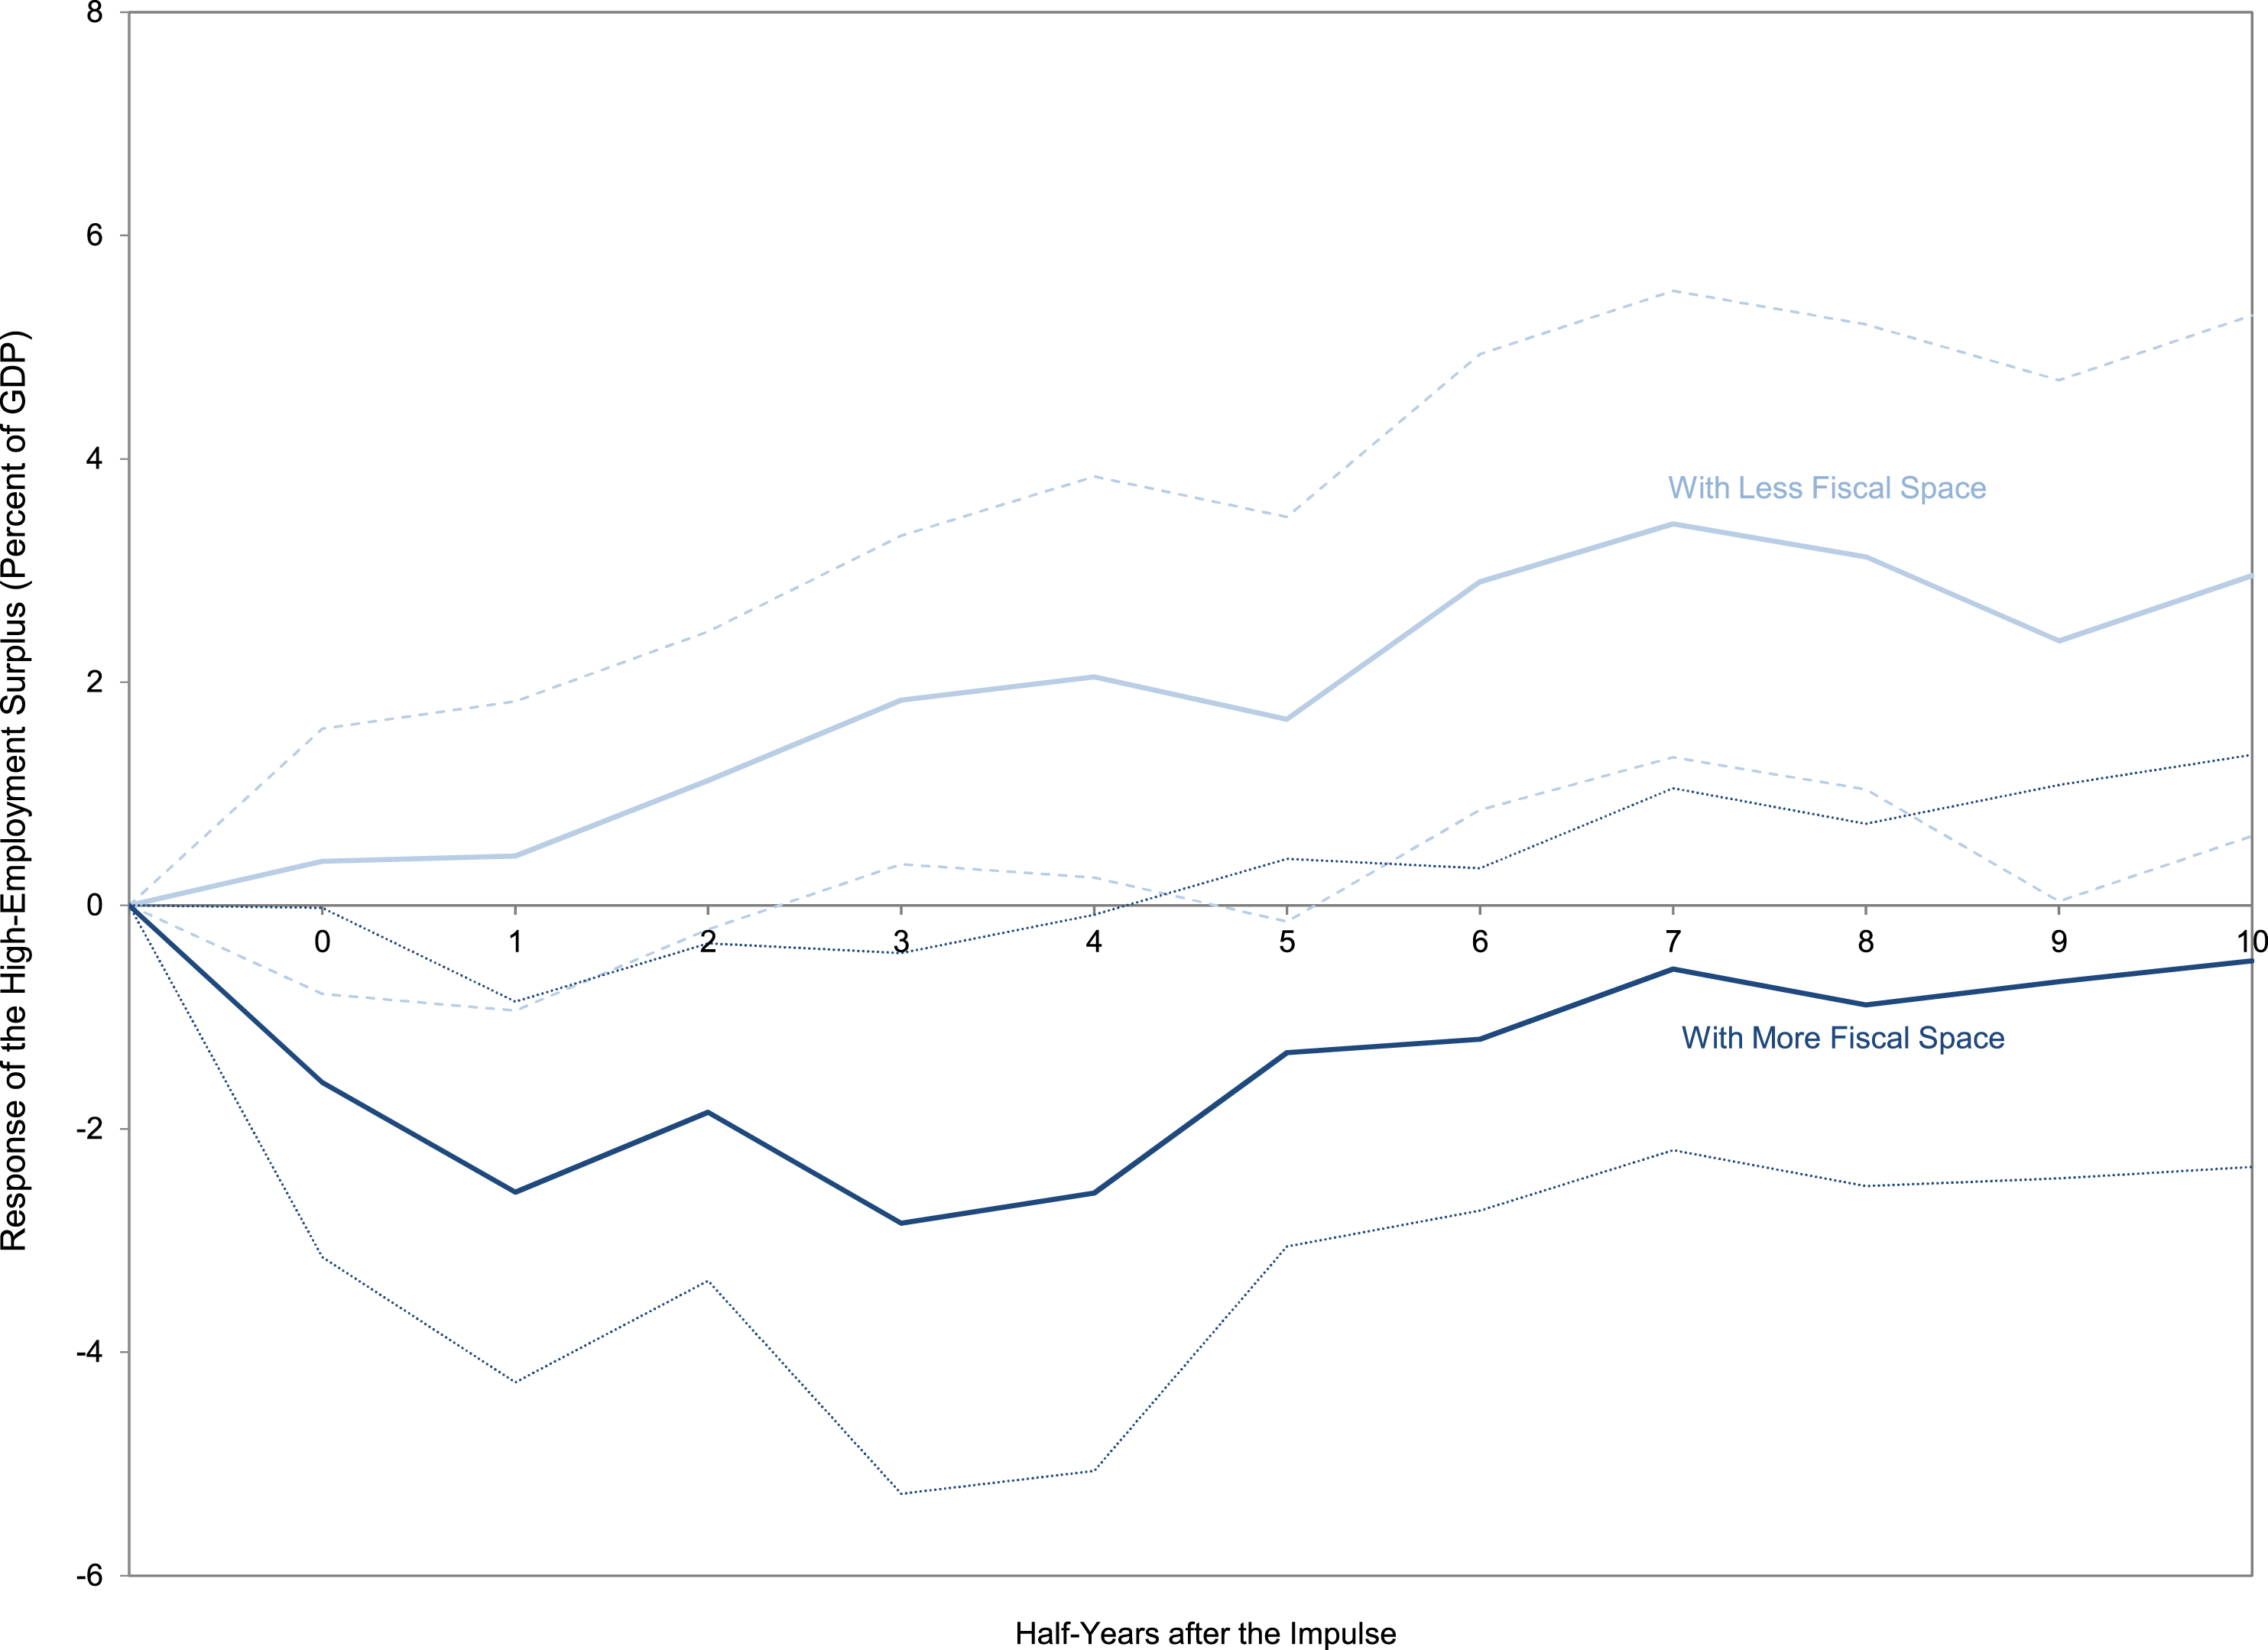
In a subsequent Brookings Paper (Romer & Romer, 2019), we looked at why the debt ratio seems to affect the fiscal response to a crisis. Was it because high debt made countries unable to undertake expansionary policy? Were there genuine market constraints on their ability to borrow? Or was it for some other reason? We find some role for actual market constraints, but it is fairly small. Looking at narrative descriptions of the policymaking process, we find a much more important role for ideas. Even absent market constraints, policymakers in a country with high debt worried about the negative effects of further increases in the debt. It was largely debt worries, rather than identifiable impacts of debt on interest rates or bond ratings, that led to anemic or counterproductive fiscal responses to a financial crisis.
Evidence from the Pandemic
At the start of the pandemic, the inverse relationship between debt loads and fiscal expansion seemed to break down. The fiscal response to the pandemic seemed to be largely unrelated to the previous debt level. Figure 9 shows a scatter plot of debt-to-GDP ratios before the pandemic and the early fiscal response for 30 OECD countries. You can see that there is little obvious relationship. The United States, for example, had a relatively high debt-to-GDP ratio and a very large fiscal expansion. If you cherry pick observations, you can see some of the expected negative relationship, particularly among European countries. High-debt Greece and Italy undertook very small pandemic fiscal expansions; low-debt Germany did quite a lot. But, overall, the relationship just isn’t there. Scatterplot of Early Pandemic Fiscal Packages and Debt-to-GDP Ratios. Notes: The observations marked with squares are a subset of euro area countries. Sources: The fiscal response data are described in the online appendix to Romer (2021). The gross debt ratio data are from the IMF World Economic Outlook Database, October 2020.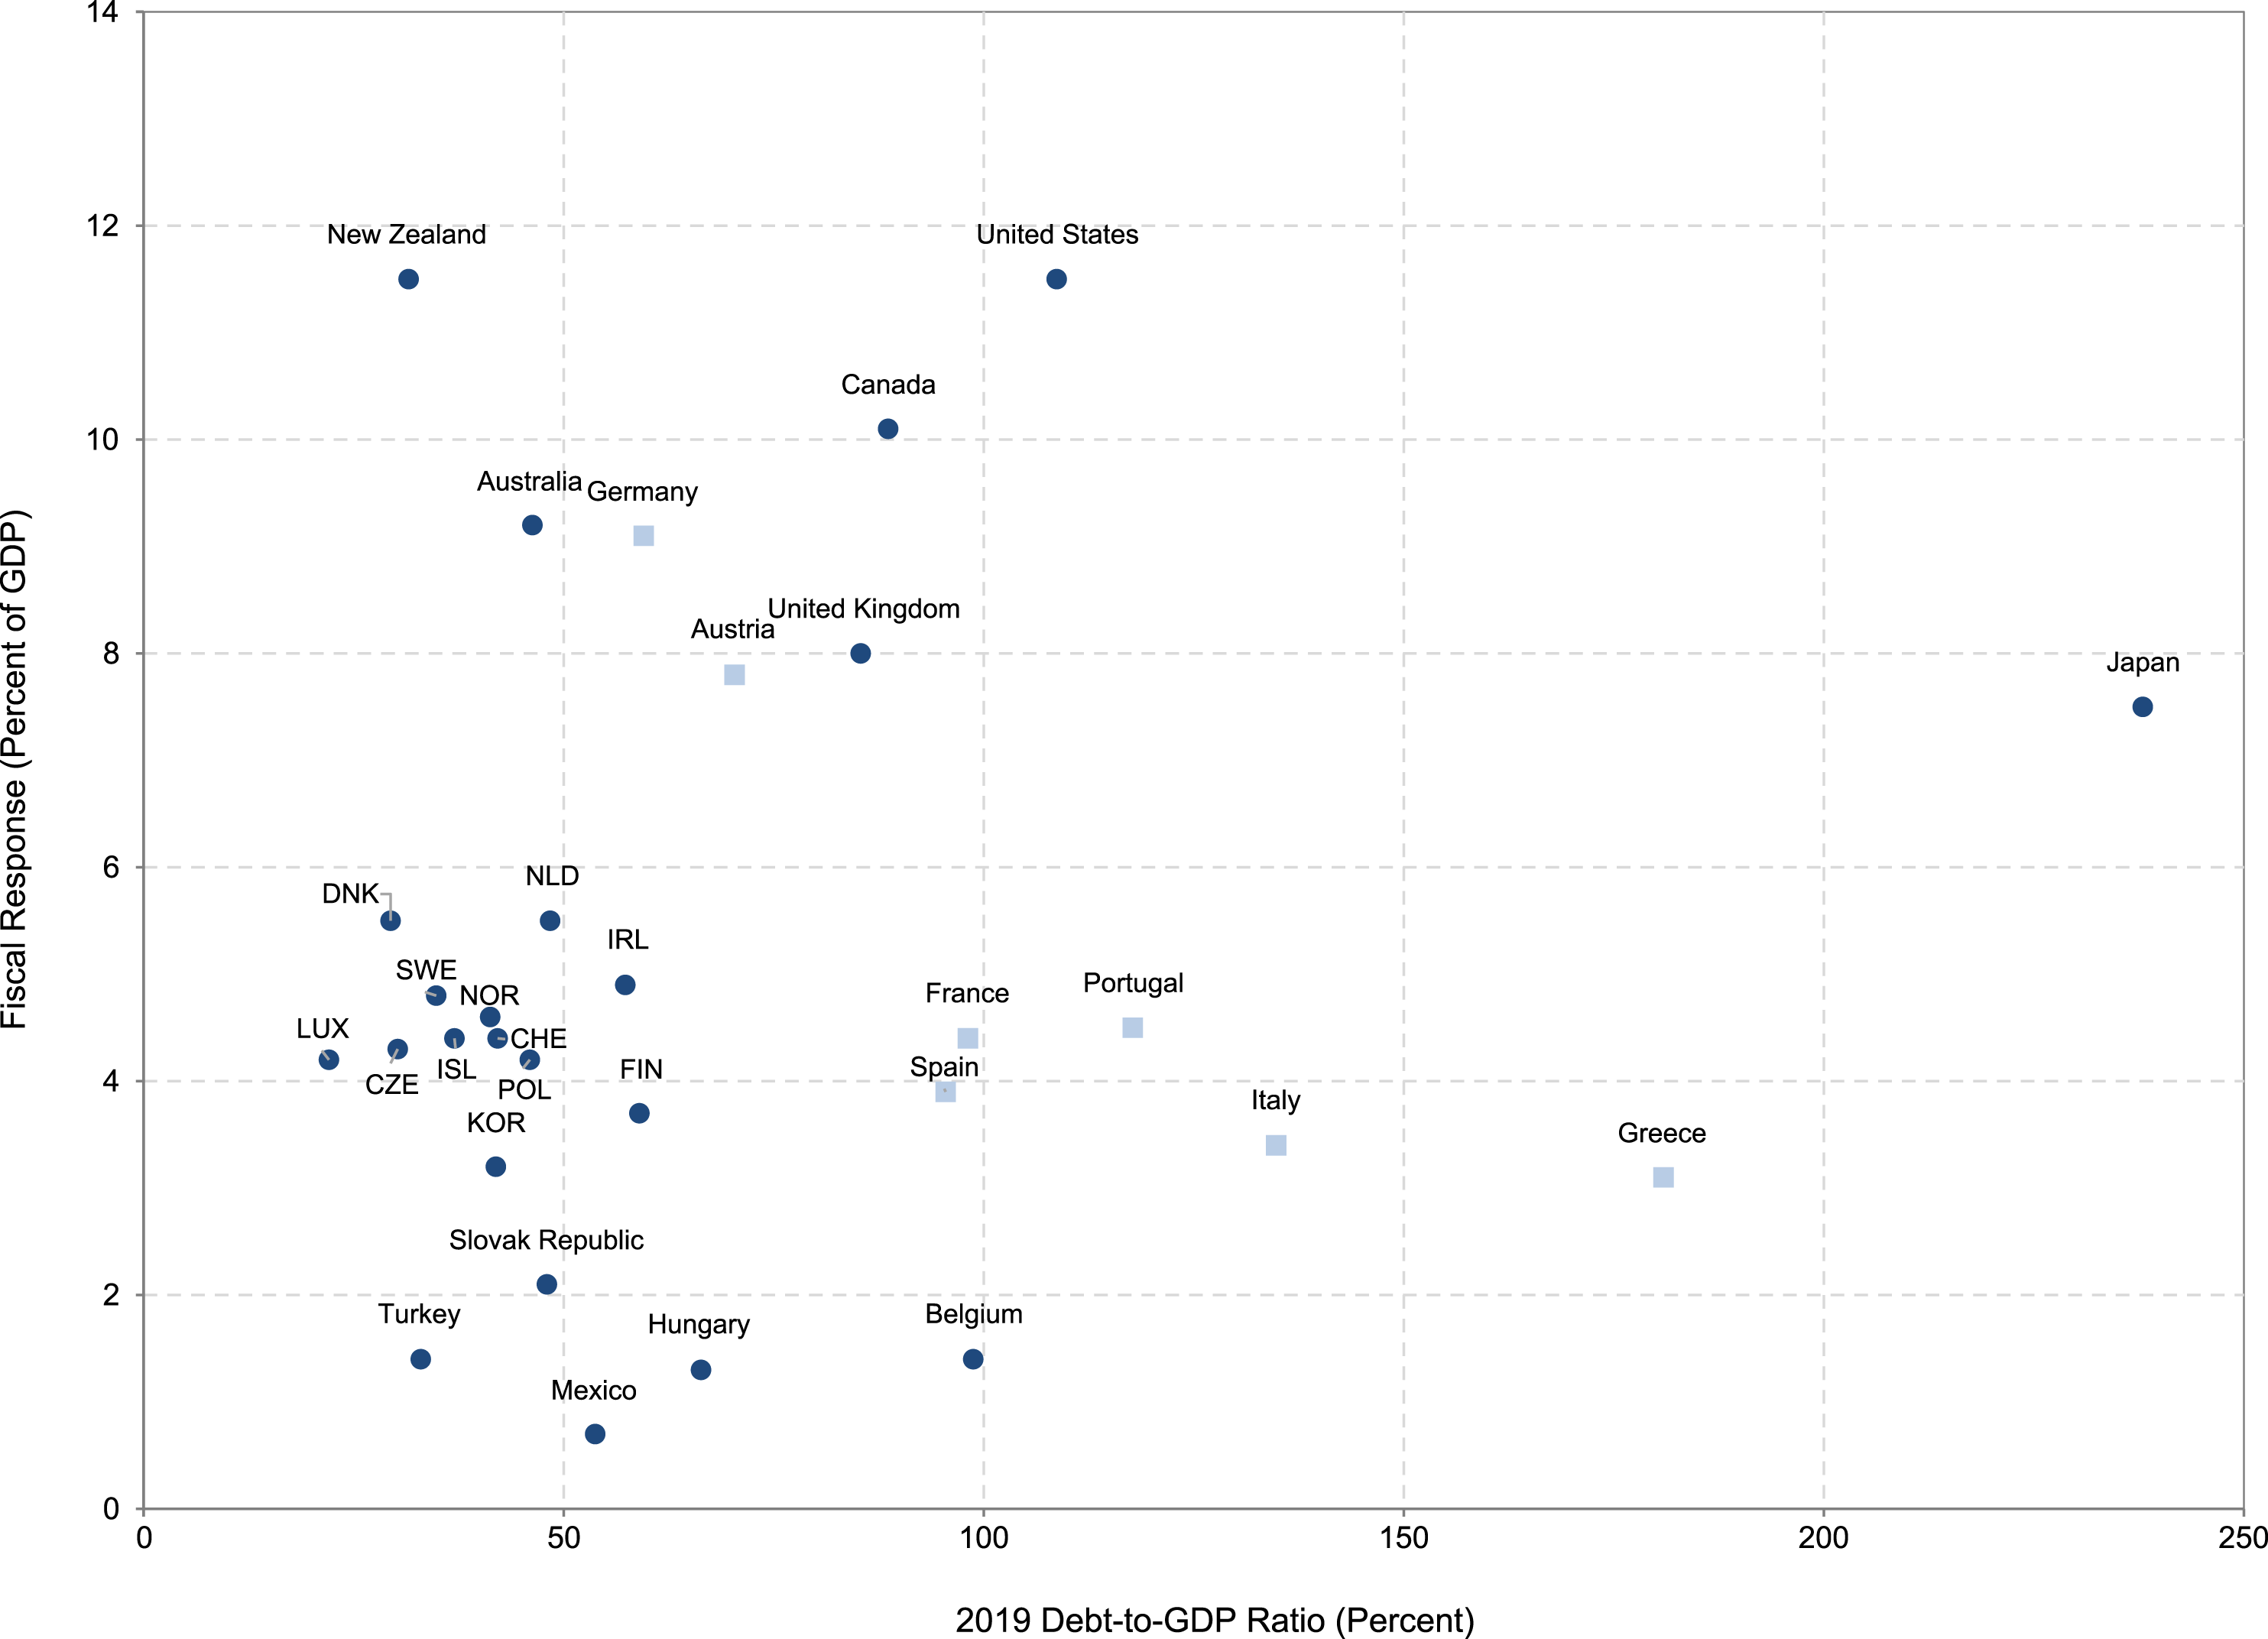
Does this mean that debt doesn’t matter? That high debt doesn’t preclude aggressive action when you need it? I don’t believe so. More likely, it means that the pandemic was exceptional. The novel public health crisis generated a “whatever it takes” sort of political mentality. The initial moves to shut down the economy generated such large and widespread drops in employment that bipartisan agreement was easy to muster. In the United States, the CARES Act passed with a unanimous vote in the Senate and a near-unanimous voice vote in the House. The fact that later actions became much more contentious is consistent with the notion that once the novelty of the pandemic wore off, old patterns started to reemerge.
The recent legislative debate over the Biden administration’s Build Back Better Act shows that concern about the debt and deficit may once again be driving fiscal policy. The bill, which makes popular investments in education, climate, and healthcare, has been held up for several months by two Democratic senators, Joe Manchin and Kristen Sinema. In December 2021, it appeared that Manchin may have sunk it.
Senator Manchin has explicitly cited the deficit and debt as a key reason that he wants to scale down the size of the spending increases. In an op-ed in the Wall Street Journal in September 2021, Manchin wrote: “some in Congress have a strange belief … that spending trillions upon trillions will have no negative consequence for the future. I disagree” (September 2, 2021). Senator Sinema has also cited concern about the debt as one reason she wants a smaller bill.
Manchin even seemed to make a sort of “fiscal space” argument. He wrote: “Those who believe such concerns are overstated should ask themselves: What do we do if the pandemic gets worse under the next viral mutation? What do we do if there is a financial crisis like the one that led to the Great Recession? What if we face a terrorist attack or major international conflict? How will America respond to such crises if we needlessly spend trillions of dollars today?” (Wall Street Journal, September 2, 2021). This thinking is exactly what we saw in our analysis of why the fiscal response to panics depended on the debt ratio.
It also fits with what I observed in 2010 as chair of the Council of Economic Advisers. The recovery from the global financial crisis was painfully slow; the U.S. unemployment rate was still over 9% in June 2010. More fiscal stimulus was clearly called for to spur aggregate demand and support employment growth. But policymakers became greatly concerned about debt levels. The meltdown in Greece was clearly a galvanizing development for the anti-debt crowd. But belief that high debt mattered was widespread, and a major factor blocking further action.
Implications for Other Recessions
The lesson that debt still matters is likely to be relevant in future downturns. That beliefs about the negative effects of high debt have affected fiscal policy decisions in both the global financial crisis and now, suggests that debt fears are a potent force. And, such fears are likely to grow in importance, rather than moderate over time.
Debt loads have increased substantially. Figure 10 shows data from the Congressional Budget Office (CBO) on the ratio of U.S. government debt to GDP. U.S. government debt has increased from 35% of GDP in 2006 to 100% of GDP in 2020. Rather than increasing acceptance of higher debt, this change may well fuel growing concern. Actual and Projected U.S. Government Debt. Notes: The series shows CBO’s measure of the actual debt-to-GDP ratio (in percent) through 2020 and then its projection through 2051. Source: Congressional Budget Office (2021).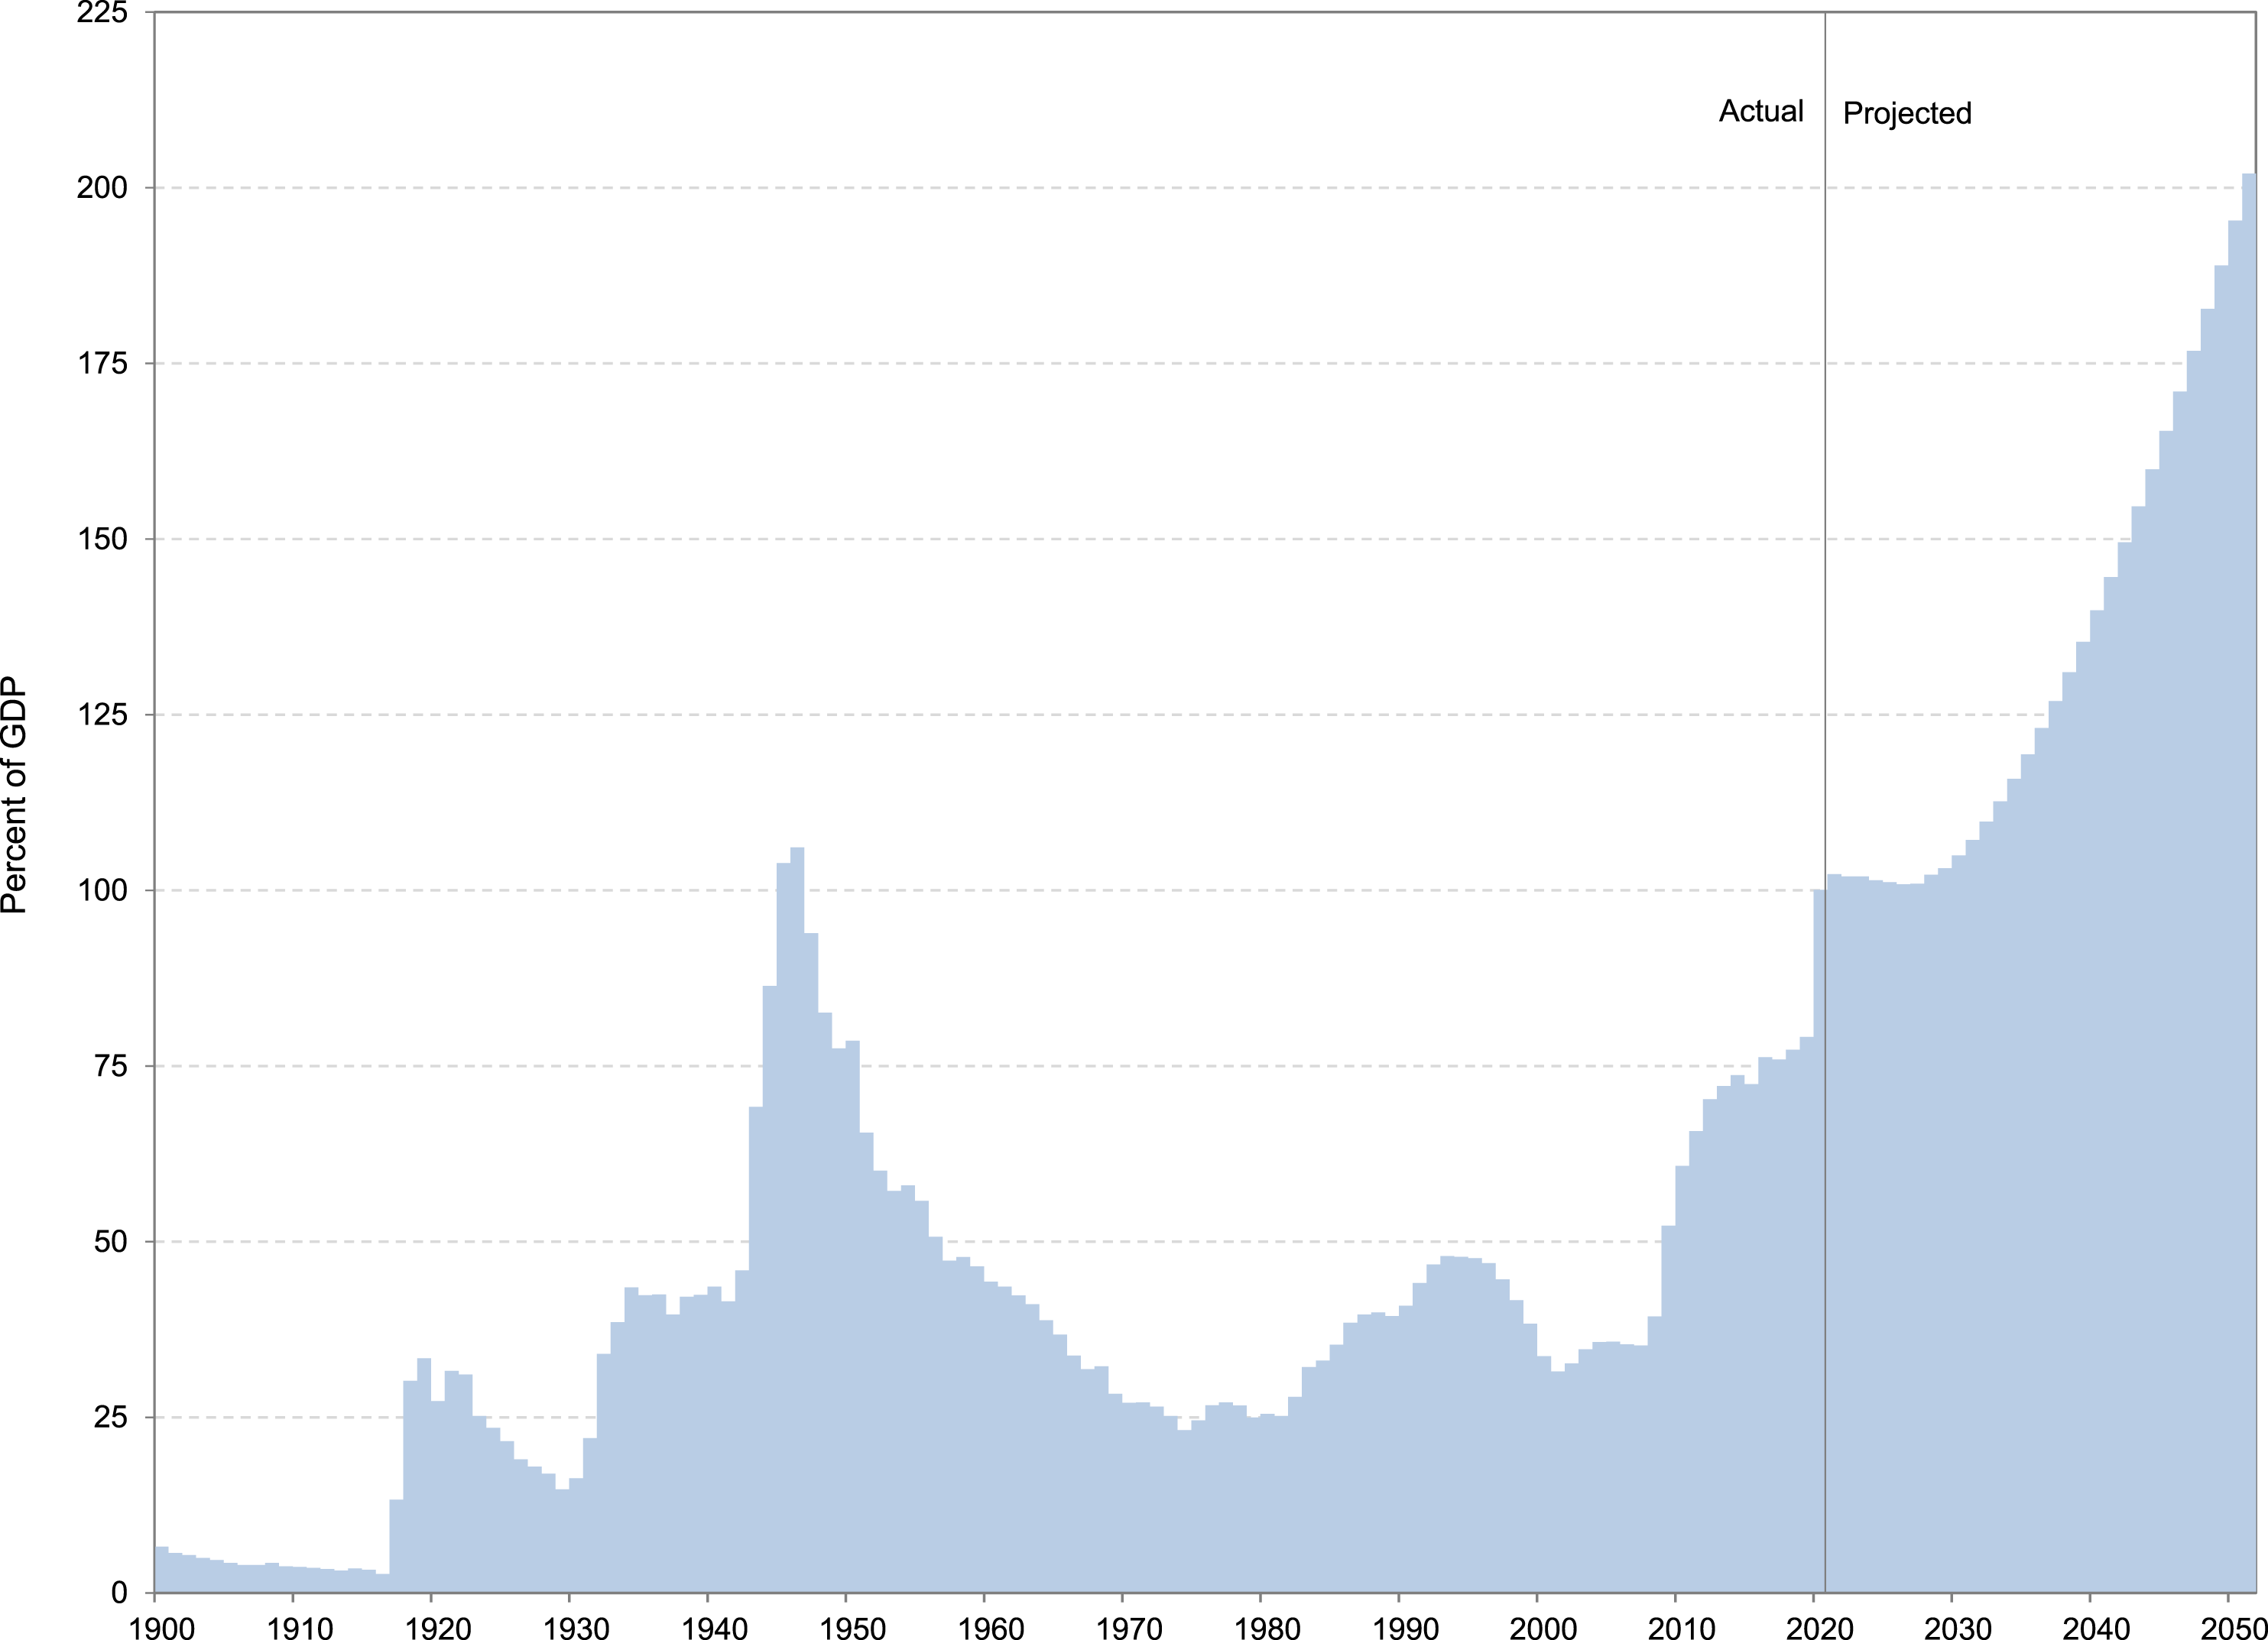
This is especially true in the context of projections that the deficit and debt will rise further because of a long-run imbalance between taxes and government spending. CBO projects that rising expenditures for Social Security and Medicare and Medicaid, coupled with persistently low tax revenues, will double the debt-to-GDP ratio over the next 30 years.
Obviously, at some point, higher debt goes from mattering because people believe that it matters, to having direct consequences through interest rates and fiscal stability. If that ever happens in a major way in the United States, it would unquestionably affect our ability to use fiscal policy to deal with any type of emergency.
Conclusion
The pandemic and the recession that followed were an experience like no other in living memory. Yet, as with many unique experiences, we can learn a great deal from this episode. I have highlighted five important lessons from fiscal policy in the pandemic: 1. Fiscal stimulus can spur spending and raise output and employment. 2. More fiscal stimulus isn’t always better. 3. It is valuable to think of discretionary fiscal policy in terms of social insurance, rather than just in terms of aggregate demand. 4. Fiscal policy may affect the economy at the wrong time. 5. Government debt matters for the ability and willingness of countries to take fiscal actions.
Now, at some level, these are all lessons that we already knew, at least in some form. But the pandemic demonstrated their importance in very stark terms, and provided compelling new evidence. Moreover, as I have described, there are good reasons to believe that these fiscal lessons from the pandemic are likely to carry over to more ordinary recessions—perhaps not to the same extent as in the pandemic, but enough that they can help us to use fiscal policy better in the future. If we remember these lessons, we may at least salvage a little good from the very painful experience of the last 2 years.
Footnotes
Acknowledgements
I am grateful to David Romer for helpful comments and suggestions.
Declaration of Conflicting Interests
The author(s) declared no potential conflicts of interest with respect to the research, authorship, and/or publication of this article.
Funding
The author(s) received no financial support for the research, authorship, and/or publication of this article.