
Abstract
Group psychotherapy has been shown to be effective across a diverse range of participants and settings. However, few quantitative studies have examined outcomes of Group Analytic Psychotherapy (GAP) specifically, or compared this with alternative treatments. In the present study we compare outcomes of weekly group analytic psychotherapy (GAP) and individual psychodynamic psychotherapy (PPT) at a psychotherapy service within the UK’s National Health Service. The service collected Clinical Outcomes in Routine Evaluation (CORE) outcome measures between 2010 and 2020 as part of routine clinical practice, furnishing a large observational dataset (N=600 clients). We found that clients showed clinically significant improvement following either GAP (Cohen’s d=0.77) or PPT (d=0.68), and the rate of change during therapy exceeded that during a pre-treatment waiting period. There were no clinically significant differences in effectiveness between GAP and PPT, of either short-term (<1 year) or long-term (> 1 year) duration. These results support a conclusion that both GAP and PPT are effective in routine clinical practice. We consider the advantages and limitations of quantitative outcome measurement from a group analytic perspective and highlight the possible pitfalls of attempting to optimise therapy based on overly narrow criteria.
Keywords
Introduction
Group Analytic Psychotherapy (GAP) is a form of exploratory psychotherapy, which aims to foster ‘an ever more articulate form of communication’ between the participants (Foulkes, 1964: 290). An analytic group serves as a prototype for the external, social world in which relational patterns in participants’ lives are liable to re-emerge, thereby becoming accessible to interpretation. In this way, the group fosters awareness of formerly unconscious relational conflicts and beliefs (Foulkes, 1964; Noack and Vincent, 2023). A supportive group setting allows participants, equipped with this awareness, to play with different ways of responding (Kay, 1997).
S.H. Foulkes attested that GAP could bring about profound changes in a person’s social and emotional life (Foulkes, 1948, 1964). Although the potential for therapeutic breakdown in group therapy is recognized (Nitsun, 1991), analytic practitioners continue to share Foulkes’ faith in the mutative potential of their groups. However, quantitative data evaluating the effectiveness of GAP are scant. Whilst extensive outcome-based research has found group psychotherapy, across a range of applications and therapeutic models, to be an effective treatment (for reviews see Blackmore et al., 2012; Barkowski et al., 2020; Rosendahl et al., 2021; Schwartze et al., 2019), relatively few quantitative studies have examined the effectiveness of GAP specifically (Blackmore et al., 2012).
This begs the question of why quantitative outcome studies are necessary. It may be argued that clinicians would not continue to deliver GAP, nor clients continue to access it, were it not felt to be helpful for at least some individuals some of the time. Against this, research indicates that therapists often have difficulty recognising deterioration in their clients (Hatfield et al., 2010). Thus, therapists and local services may be interested to gather additional outcome data concerning the treatments they provide (Boswell et al., 2015; Lambert and Harmon, 2018). Furthermore, publicly funded services, such as the UK National Health Service (NHS), must decide which treatments to commission (see Margison et al., 2000; Boswell, 2020). Such commissioning decisions involve integrating data about treatment effectiveness across individuals, a task facilitated by standardized, quantitative outcome measures.
Standardized outcome measurement conventionally defines effectiveness in terms of changes in self-reported symptomatic distress; for example, people may be asked to rate how often they have recently experienced various symptoms, such as ‘feeling like crying’ or ‘feeling tense, anxious or nervous’ (e.g., Evans et al., 2000; Evans et al., 2002). There are valid concerns as to whether such measures adequately capture the effects of analytic therapies (see Stocks et al., 2019). Dalal (2018), for example, notes that symptom measurement appears congruent with a cognitive behavioural approach, which addresses consciously accessible thoughts and feelings. By contrast, analytic therapy views symptoms as unstable epiphenomena of deeper, unconscious conflicts, which may be inaccessible to self-report (see also Milton, 2001). Additionally, standardized measures assume that people’s values are stable and uniform (see Fulford, 2008; Strupp and Hadley, 1978). Within a group analytic view, however, the problems and values that people bring to therapy are not only diverse, but also continuously evolve through interactions with others (Garland, 1982; Schlapobersky, 2015). We might therefore question whether ‘one size fits all’ questionnaires provide useful information concerning the effectiveness of analytic therapies, such as GAP.
In the present paper we take a pragmatic view, namely that quantitative outcome measures are likely to be correlated, albeit not perfectly, with what is valued by clients. This view leaves open the possibility that there are alternative ways of measuring change (e.g., qualitative interviews) and that quantitative measures may reflect factors other than therapeutic change (e.g., the client’s wish to conform to an expectation of improvement, by reporting lower scores after therapy). Nevertheless, we suggest that outcome data are partly informative, at an aggregate level, regarding the changes that matter to clients.
Following this approach, we examine the effectiveness of Group Analytic Psychotherapy (GAP) and Individual Psychodynamic Psychotherapy (PPT) at a psychotherapy service within the UK National Health Service, the Camden and Islington Psychodynamic Psychotherapy Service (CIPPS). The service has collected formal outcome-monitoring data using the Clinical Outcomes in Routine Evaluation outcome measure (CORE-OM) for over ten years, as part of routine clinical practice, furnishing a large observational dataset. The available data address a lack of largescale quantitative studies of GAP in routine clinical practice.
Existing outcome studies of GAP
A previous systematic review, commissioned by the Institute of Group Analysis (IGA) in the UK, revealed only one randomized trial comparing GAP with another treatment modality (Blackmore et al., 2012). This study, carried out in Denmark, found that, for women with a history of sexual abuse, five months of twice-weekly systemic group therapy (N=54) (Cohen’s
A number of non-randomized and observational studies have also examined outcomes of GAP. A majority of these studies have very small sample sizes. Amongst those with larger samples are a study based in Norway (Lorentzen et al., 2002, 2004; N=69) and a multi-centre study in Germany (Tschuschke et al., 2007; N=244 patients). Both studies found substantial effect sizes for long-term GAP at follow-up, (Lorentzen et al., 2002:
Present study aims
In summary, a small number of existing outcome studies support the effectiveness of GAP. However, large-scale studies of GAP in NHS settings are lacking. Furthermore, to our knowledge, no previous studies have compared the effectiveness of GAP and individual psychodynamic psychotherapy (PPT). We address this in the present study, with the following primary aims:
i) To quantify change in CORE-OM score following routine treatment with GAP or PPT, and to compare change between the two modalities;
ii) To compare rates of change per unit time during GAP and PPT of either short-term or long-term duration.
Our secondary aims, which pertain to both modalities combined, were as follows:
i) To compare rates of change per unit time during therapy with those during a pre-therapy waiting period;
ii) To examine whether change was maintained at six month follow up.
We note that in the present dataset, rather than being randomized to treatments, clients are assigned to treatments following an assessment process used in routine practice. The data are also incomplete in various ways; for instance, some clients exited therapy early, or did not complete measures at various time points. However, such incompleteness reflects the reality of clinical practice. Our study represents an example of ‘practice-based evidence’, where the drawbacks of lack of randomization and high rates of dropout are balanced by greater realism derived from evaluating treatments as they are routinely delivered (Margison et al., 2000; Evans et al., 2003; Stiles et al., 2008a).
Methods
Service characteristics
CIPPS is a secondary care outpatient psychotherapy service within Camden and Islington NHS Foundation Trust. Patients are referred from general practice, primary care psychotherapy services and secondary mental health services, with a wide range of mental health difficulties, and/or significant childhood adversity, which have significantly affected their functioning, personality development, emotional lives and adult relationships. Patients are identified as having treatment needs that are beyond the reach of primary care psychotherapy services.
Referrals are discussed within the team and those thought likely to benefit from therapy are offered an assessment, consisting of at least two consultations. Following assessment, clients taken on for therapy are placed on a waiting list for either individual psychodynamic psychotherapy or group analytic psychotherapy of varying duration. All clients are offered a review appointment six-months after completing therapy.
Within the service, clients are allocated to different therapeutic modalities based on how they engaged with the initial assessment consultations, and clinical judgement. In our clinical experience, some factors favouring allocation to a group are as follows: i) assessment suggests that a client might have difficulty managing the intensity of a one-to-one transference relationship; ii) social isolation is a prominent concern; iii) the client has a preference for group therapy and/or; iv) a client has previously completed a one-year individual therapy from which they have gained some benefit. In the latter case a group may be recommended to build upon the progress already made in individual therapy, whilst recognizing that the developmental origins of a client’s difficulties indicate that a year of individual therapy is unlikely to be sufficient.
CORE Outcome Measure (CORE-OM)
CORE-OM is a 34-item self-report questionnaire designed as a generic measure of psychological distress (Evans et al., 2000; Evans et al., 2002). CORE-OM has been extensively evaluated and is widely used to assess outcomes in psychotherapy (e.g. Barkham et al., 2012; Fonagy et al., 2015; Stiles et al., 2008a). Questions are divided into four domains, assessing Subjective Wellbeing, Problems, Functioning, and Risk (to self and others). Each question is rated from zero (not at all) to four (all the time), such that more problems result in higher scores. Standard procedure, followed here, is to multiply the average score by 10 to create a ‘clinical score’ between zero and 40. We calculate this clinical score based on all items, including Risk. A clinical score of >10 is considered as a threshold for clinical ‘caseness’, derived by comparing scores in the general UK population with those of clients in therapy across large samples (Connell et al., 2007). A change in clinical score of ⩾ 5 points is taken to indicate ‘reliable change’, exceeding that which might be expected for 95% of clients were observed change simply due to chance measurement errors (Stiles et al., 2008a).
At CIPPS, all clients are sent a CORE-OM form by post at the time of referral. Clinicians are advised to offer outcome monitoring to their clients again at the time of assessment, at commencement and completion of therapy, at least once during therapy and at the six-month follow-up appointment. Clinicians enter outcome data into an online database (Core Net, Rugby, UK).
Ethics statement
An enquiry form was completed with the Health Research Authority, who advised that, since the study is embedded in the routine clinical audit and evaluation of the service, no approval from a research ethics committee would be required. The study was registered as an audit with the quality improvement department of Camden and Islington NHS Foundation Trust. Consent to participate is implicit in the voluntary completion of the CORE-OM questionnaire as part of routine clinical practice. Patients are not identifiable from the data presented here.
Data processing
We pooled all available data from clients completing therapy over a 11-year period, by querying the Core Net database for measures from clients with a recorded therapy completion date between 01/01/2010 and 20/11/2020, and who had both ‘pre-therapy‘ and ‘post-therapy’ outcome (CORE-OM) measures according to Core Net criteria. Data were anonymized prior to further processing, which was performed using Matlab (Mathworks, Provo, UT, 2019). Following previous guidelines for processing CORE-OM data, we excluded forms wherein more than three questions were left unanswered (Evans, 2015). We also excluded forms pertaining to clients seen at a frequency of less than once per week. Finally, we excluded forms completed more than two years before or after the start of therapy. This search procedure resulted in 2207 measures from 600 clients (modal number of measures per client=3, 431/600 clients have three or more measures). Following previous approaches, for forms with three or fewer unanswered questions, missing entries (215 out of 75,038 questions, i.e. 0.3%) were recomputed as the client’s mean score on all other questions on the same questionnaire (Evans, 2015).
At the point of uploading data onto Core Net clinicians are asked to enter coded time windows at which a form was completed: Referral, Assessment, First Session, During Therapy, Last Session or Follow Up. We checked the consistency of these time codes with the date of each CORE form relative to the stated assessment date, therapy start date and therapy end date using custom computer code. Details of this procedure are found in Supporting Material, below and online. This procedure re-assigned time codes for 345 out of 2,207 forms. We note that this re-assignment only pertains to analyses using the assigned time codes; we also analyse outcomes as a function of elapsed time. The number of clients with data within each time window is summarised in Table 1.
Number of clients per time window.
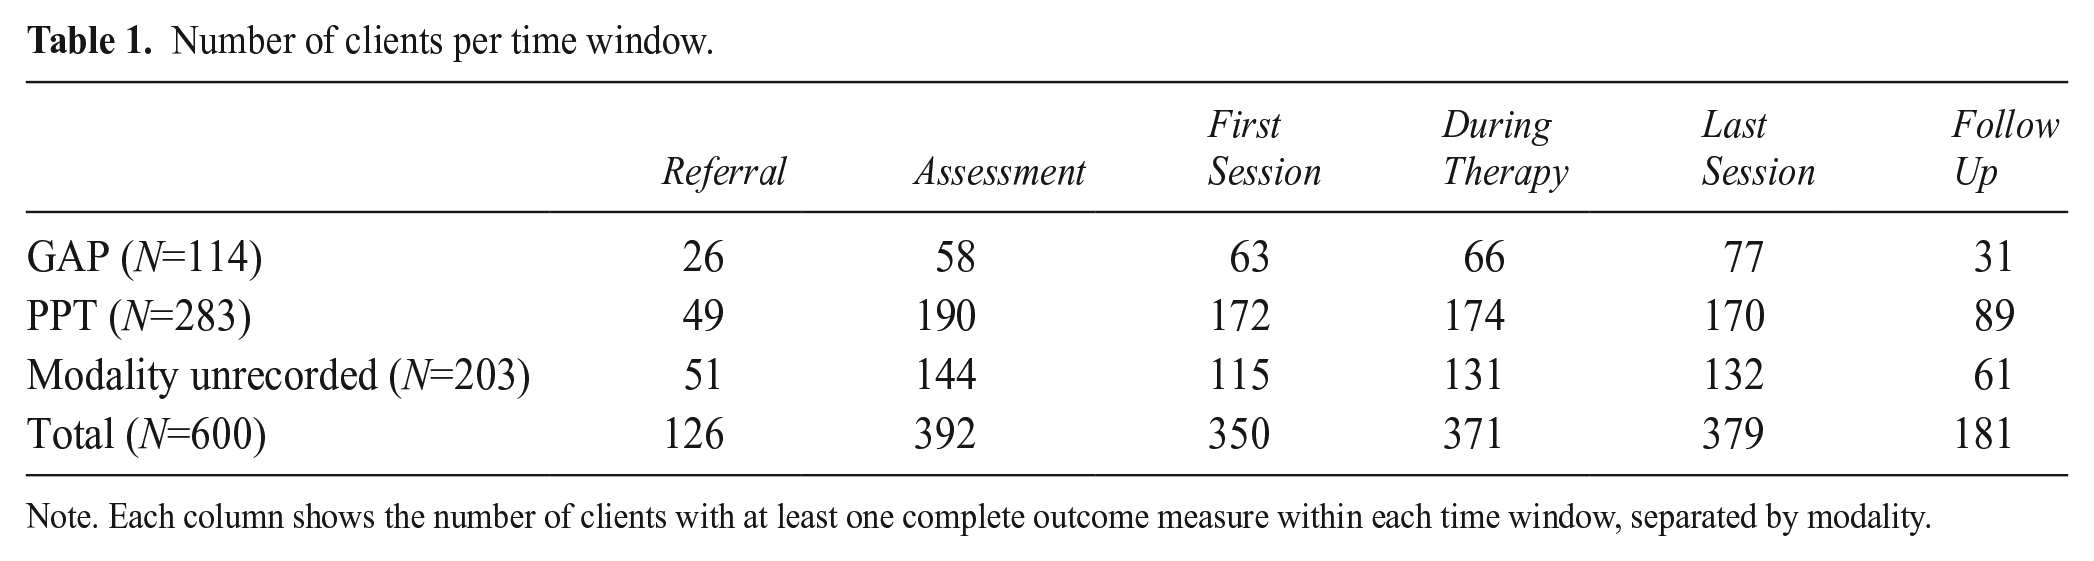
Note. Each column shows the number of clients with at least one complete outcome measure within each time window, separated by modality.
Data from each client included in the analysis pertained to a single episode of therapy; no client completed a second therapy episode under the same CORE Net number. We cannot exclude a possibility that an individual completed therapy, and subsequently entered a second therapy with the service under a new CORE Net number. In this event, our analysis would treat the two episodes as independent.
Data analysis of outcomes
Statistical assumptions
There is increasing awareness of how null hypothesis significance testing (NHST), by imposing an arbitrary decision criterion, can distort the interpretation of data (Amrhein et al., 2019; Wasserstein and Lazar, 2016). To reflect this, we quantify statistical uncertainty associated with our results by reporting 95% confidence intervals, based on a Student’s t distribution (the lowest and highest estimates for the mean, or effect size, that would be reasonably consistent with the data). Where null hypotheses are tested, we report exact p-values. Since this is a relatively large dataset, where even small effects may be statistically significant, we also aim to describe effects in terms that are clinically meaningful. We assume that sampling error is normally distributed, a plausible assumption given the large sample size.
Analysis of change scores
We firstly assess response to therapy by calculating the change in score between First and Last Session, amongst clients with data at both First and Last Sessions (N=223). We express change scores relative to the degree of variability in the data, by calculating the effect size, Cohen’s d, as follows (Cohen, 1988; see Kazdin, 1994):

Where s is the pooled standard deviation (SD) of scores at First and Last Sessions; for paired samples this is given by:

Analysis of scores across time
We go on to examine a relationship between CORE-OM score and elapsed time using linear mixed effects (LME) regression. This method is widely used in the analysis of longitudinal data and expresses a dependent variable as combination of ‘fixed’ effects across all clients, and ‘random’ effects that vary by individual. Specifically, we estimate change in CORE-OM score for each client, per unit time, under an assumption that the rate of change across clients is normally distributed (in essence, LME is a statistical analogue to Foulkes’ so-called ‘basic law of group dynamics’, whereby clients individually deviate from the norm that they collectively constitute; Foulkes, 1948). Clients with incomplete data are included, since the measure of interest is the rate of change across any two or more timepoints.
We use LME to estimate whether faster or slower rates of change are observed for different treatment modalities, by entering these as covariates in the regression model. Covariates were entered as fixed ‘Time x covariate’ interactions. This approach tests whether change over time is greater or smaller for different levels of a given covariate, for example whether clients in group therapy improve faster than those in individual therapy. We tested three separate regression models, as follows.
Firstly, we examined whether different modalities and durations of therapy were associated with different rates of change. To do so we included covariates denoting group as opposed to individual therapy (‘Group’), and denoting therapies of longer than one-year in duration (‘Long-Term’). To test whether an effect of duration differed depending on modality, we included a ‘Group x Long-Term’ interaction. In effect, this analysis fits separate slopes for short-term PPT, short-term GAP, long-term PPT and long-term GAP. We restricted this analysis to clients for whom the therapy modality was documented, and the start date of therapy was known (N=361 clients, 889 scores). We note that a sufficient number of clients received each form of therapy, for us to reliably discriminate effects of duration and modality (Short-term GAP 38 clients, 64 scores; long-term GAP 63 clients, 151 scores; short-term PPT 116 clients, 266 scores; long-term PPT 144 clients, 408 scores).
Secondly, we repeated the analysis of modality and duration, controlling for a range of additional covariates, such as baseline severity and client demographics, based on data entered by clinicians when registering clients on the Core Net database. A full list of covariates for this model is shown in Table 2. For categorical covariates, we selected from a wider range of possible categories only those pertaining to at least 10% of clients.
Demographics of clients and therapy characteristics.
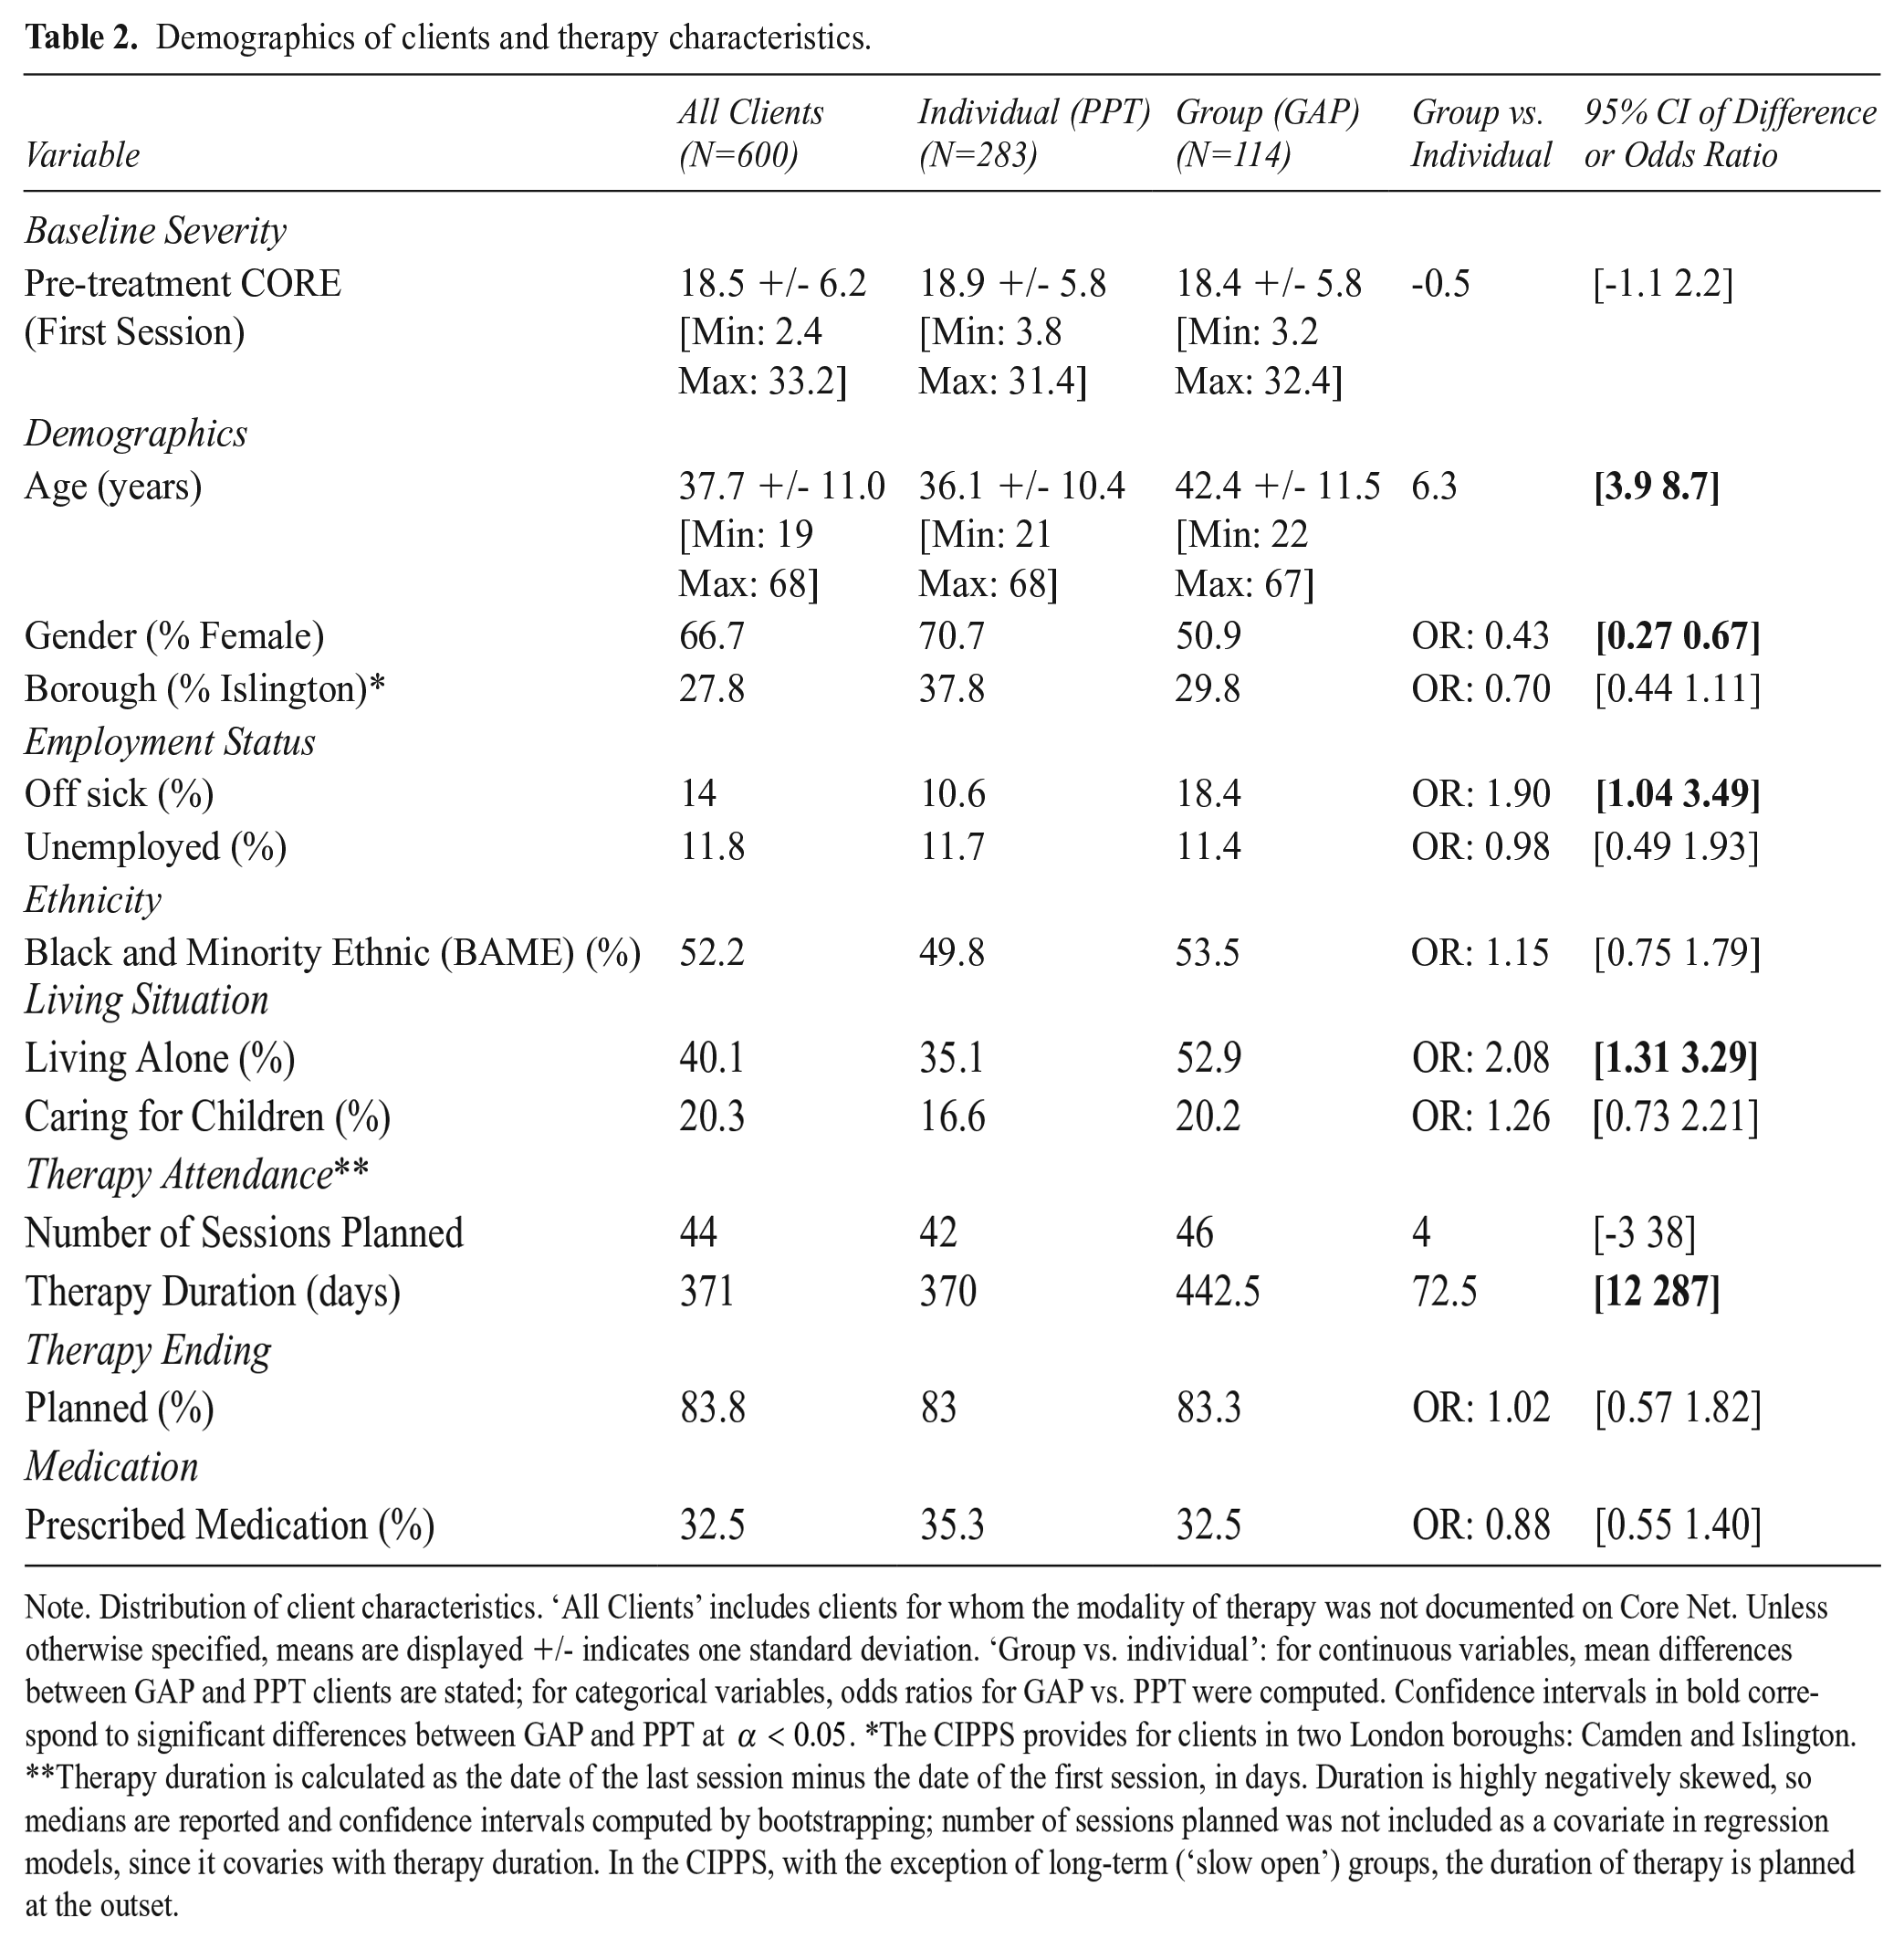
Note. Distribution of client characteristics. ‘All Clients’ includes clients for whom the modality of therapy was not documented on Core Net. Unless otherwise specified, means are displayed +/- indicates one standard deviation. ‘Group vs. individual’: for continuous variables, mean differences between GAP and PPT clients are stated; for categorical variables, odds ratios for GAP vs. PPT were computed. Confidence intervals in bold correspond to significant differences between GAP and PPT at
Thirdly, as an observational waiting-list control, we tested a model with a covariate coding for whether a score was obtained whilst a client was in therapy (of any modality or duration), as opposed to waiting for therapy. This model tests whether clients improve faster during therapy than whilst waiting for therapy: a ‘Time x Therapy’ interaction tests for a specific effect of therapy on change in CORE score. We included scores obtained up to one year before or after starting therapy, from clients for whom the start date of therapy was recorded, resulting in 1,571 scores from 556 clients. Of these, 1,000 scores from 515 clients were at or after the start of therapy, an average of 1.9 scores during therapy per client.
Results
Client demographics
Characteristics of clients accessing the service, separated by modality of therapy, are displayed in in Table 2. GAP was, on average, of longer duration than PPT. Baseline CORE scores were not significantly different between patients assigned to group (GAP) as opposed to individual (PPT) treatment. However, GAP clients were significantly more likely than PPT clients to be older, male, signed off sick from work and living alone. Such demographic differences likely reflect the process by which clients are allocated to therapies; for instance, these characteristics appear consistent with a profile of social isolation, which in our clinical experience favours allocation to a group. (For summary statistics, odds ratios, and 95% confidence intervals the reader is referred to Table 2).
Rate of OM completion
Of the 600 clients in our dataset, who were documented on Core Net as having completed therapy between 01/01/2010 and 20/11/2020, 223 (37%) had outcome data collected at both First and Last Session. We note that some clients might have completed therapy within this time period without this having been recorded on Core Net, therefore the true number completing therapy is likely to have been higher.
Pre-post change and follow-up outcomes
Mean clinical scores at all time windows are shown in Figure 1, for all clients (N=600; Figure 1a) and for clients with data at both First and Last Session, termed ‘pre-post clients’ (N=223; Figure 1b). Amongst pre-post clients, across both modalities combined, the mean score at First Session was 18.6 (95% CI [17.8 19.4]) and at Last Session 14.0 (95% CI [13.0 14.9]). This amounted to a mean change of 4.6 points, 95% CI [3.7 5.5]), with a medium-to-large effect size (Cohen’s d=0.69, 95% CI [0.54 0.85]). Effect sizes were of comparable magnitude amongst clients in GAP (N=27; d=0.77, 95% CI [0.41 1.26]) or in PPT (N=109; d=0.68, 95% CI [0.46 0.92]), and we were unable to reject a null hypothesis that mean change was identical across the two modalities (t(134)=0.14, p=0.885).
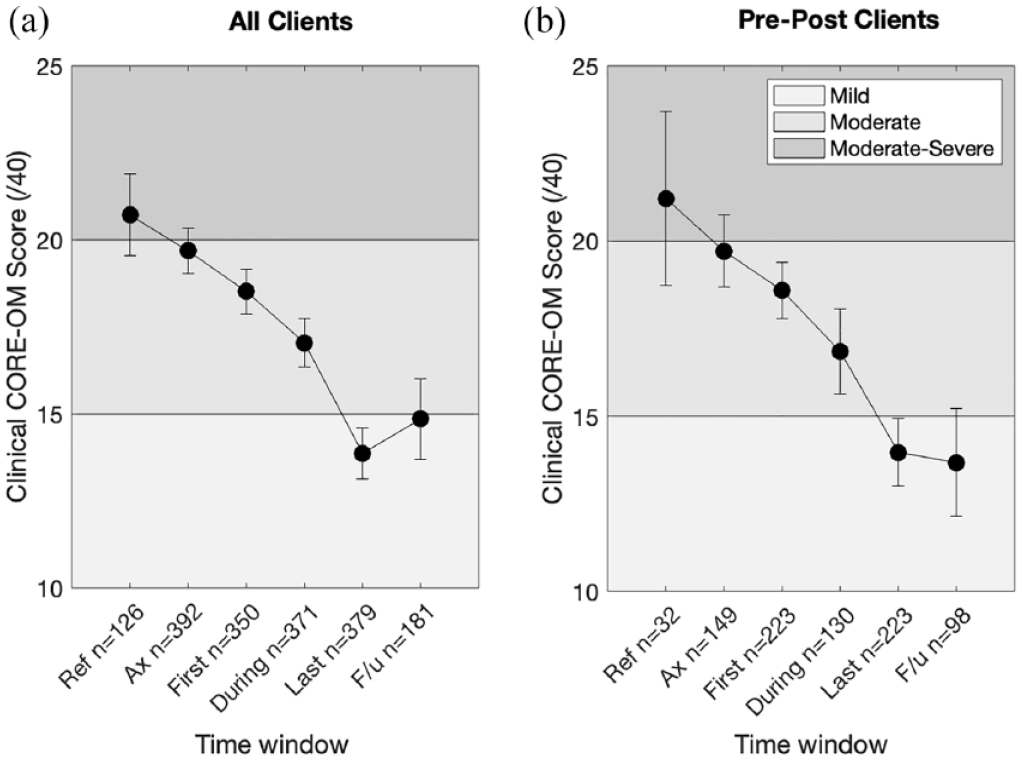
Clinical scores from referral to follow up.
Improvement appeared to be maintained at six-month follow up. Across both modalities combined, amongst clients with data at both Last Session and Follow Up (N=160), we observed almost identical mean scores at Last Session (mean = 14.27) and Follow Up (mean=14.31). Accordingly, we were unable to reject a null hypothesis of zero mean change across follow up (mean change = -0.04; 95% CI [-4.42 1.69], t(159)=-0.89, p=0.38).
The distribution of change across pre-post clients in both modalities is shown in Figure 2. 77.8% of GAP clients and 76% of PPT clients showed at least some improvement during therapy (change score>0). However, only 44.4% of GAP clients and 49.5% of PPT clients exhibited statistically ‘reliable change’ (change score > 5). Reliable change is defined as a change score exceeding that which might be expected for 95% of clients were change simply due to chance or measurement error (Stiles et al., 2008a).
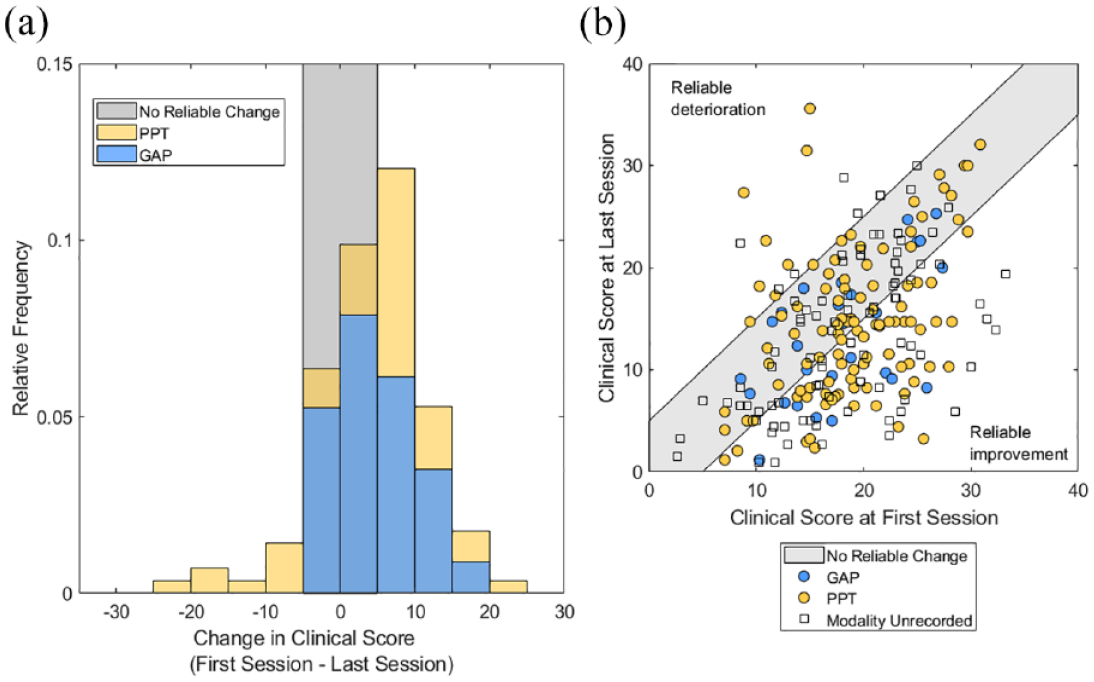
Distribution of change and pre-post scores.
Comparison between GAP and PPT across elapsed time
We next examined whether GAP and PPT of varying durations were associated with different rates of improvement across elapsed time in therapy (N=361 clients; 889 scores). As shown in Figure 3, clients in Long Term therapy (over 1 year duration) improved significantly more slowly than those in short-term therapy (< 1 year duration) (
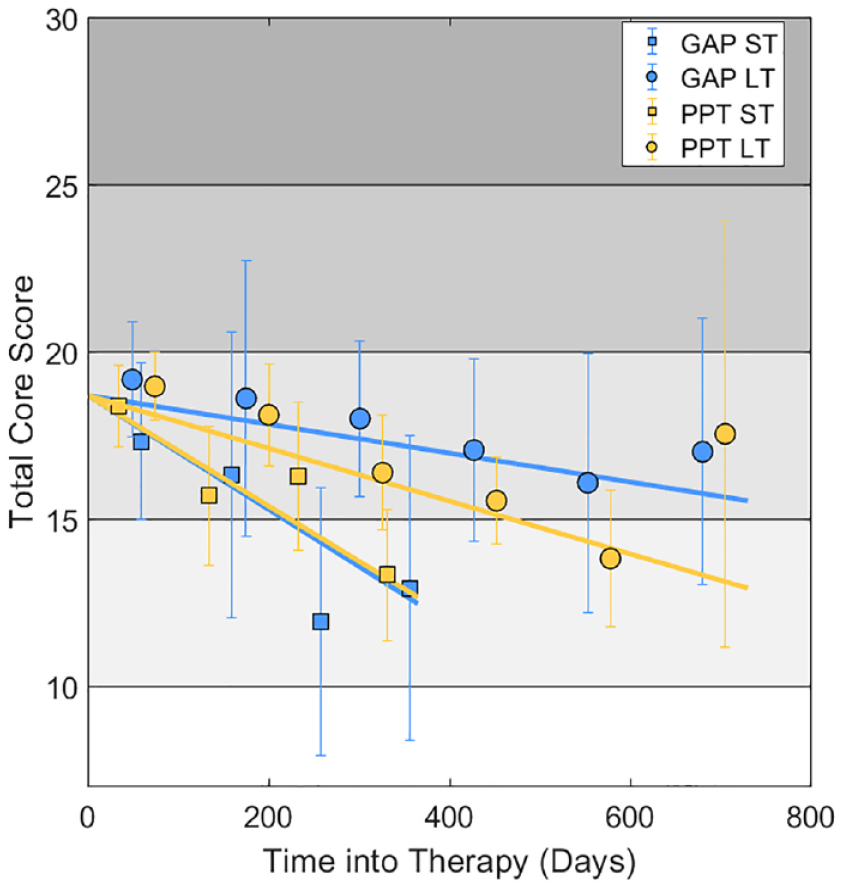
Clinical scores versus elapsed time for GAP and PPT.
Across durations, we found neither a clinically meaningful nor statistically significant, difference in the rate of improvement between Group (GAP) and individual (PPT) therapy (
The aforementioned effects could be attributable to differences in the characteristics of clients or differences in specific therapeutic factors between modalities. To explore this possibility, we repeated the above analysis, controlling for a wider range of covariates, including client demographics and clinician ratings of change. The results are displayed in Supporting Material below and online. Supporting Table 1 shows regression coefficients
As shown in Figure 3, average scores obtained more than 600 days after starting PPT were higher than expected from the linear trend. It is important to note that few clients in the CIPPS are offered individual therapies of longer than 18 months’ duration. Accordingly, the corresponding datapoint in Figure 3 reflects only 10 scores from nine clients, with a wide confidence interval around the mean (in other words, there is considerable uncertainty about this observation). Furthermore, this observation does not necessarily imply that the rate of change decreases towards the end of a long period in therapy, since in this analysis different clients contribute data at different timepoints.
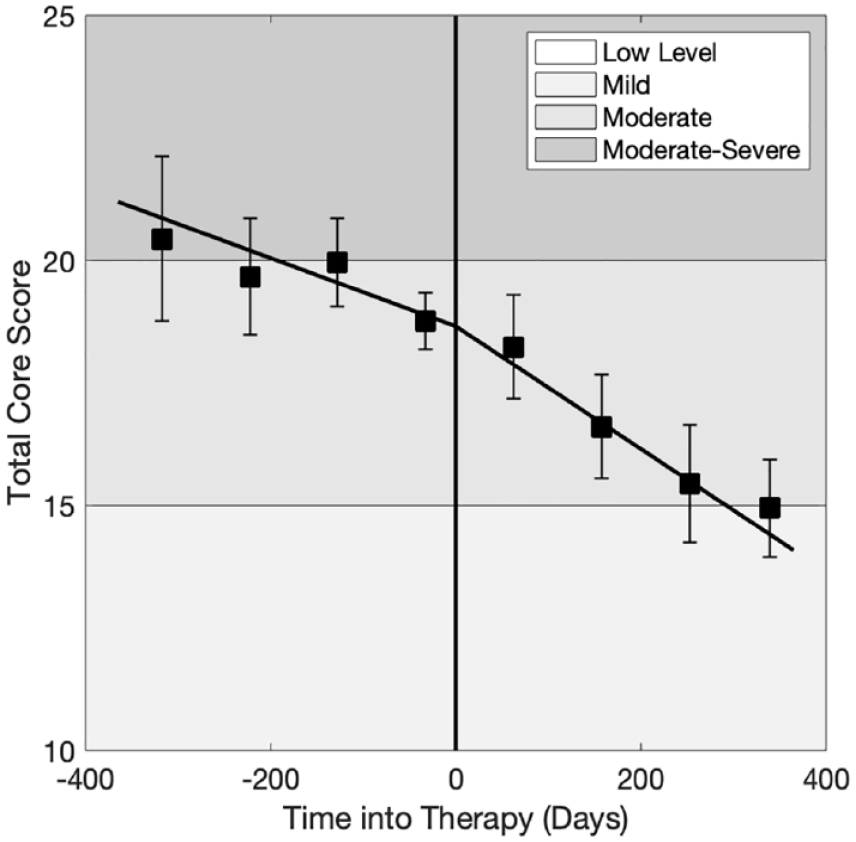
Waiting list versus therapy comparison
Mean scores over a one-year window before and after the start of therapy, across all modalities, are shown in Figure 4 (N=556 clients, 1571 scores). A mixed-effects regression model, which included scores prior to therapy, revealed a small, but statistically significant, effect of Time (
Change in clinical score during therapy versus waiting-list.
Discussion
In this observational study we evaluated the effectiveness of Group Analytic Psychotherapy (GAP) and individual Psychodynamic Psychotherapy (PPT) within a secondary care NHS psychodynamic psychotherapy service, over an 11-year period, between 2010 and 2020. During therapy clients, on average, improved from a Moderate to a Mild level of distress (Cohen’s d=0.69; PPT: d=0.68, GAP: d=0.77). Change accrued incrementally over increasing time in therapy, and was faster in therapies of up to one-year duration, compared with longer-term therapies. Controlling for a range of demographic factors, we found no clinically meaningful difference in effectiveness between GAP and PPT. Finally we found that clients improved more quickly whilst receiving therapy than whilst waiting for therapy, and that improvement was maintained at six month follow up. Taken together, these findings support a conclusion that both GAP and PPT are effective treatments, as delivered in routine NHS practice. We discuss each finding in turn below, in relation to our primary and secondary aims. We end by considering the limitations of quantitative outcome measurement.
Primary findings
GAP and PPT are effective treatments
Averaging across clients, we found medium-to-large effect sizes for both GAP and PPT (Cohen, 1988). The effect size seen here for GAP (d=0.77) exceeds that previously reported in a multi-centre analysis of 14 NHS psychotherapy services, which found a small effect of group therapy (d=0.19), using the CORE-OM (Chiesa et al., 2009). The effect found here is closer to those reported for GAP in clinical trials (Lorentzen et al., 2002:
Notably, we found substantial individual variability in response to therapy. Specifically, while over three quarters of clients showed some improvement during therapy, less than half of clients showed statistically reliable change as designated by CORE-OM documentation. Thus, although a majority of clients improved during therapy, a substantial proportion either did not improve or showed only marginal improvement on the CORE-OM. High rates of ‘non-response’ to psychotherapy are not unusual. In a study of psychotherapy delivered in primary care in the UK, rates of no reliable change or deterioration were 24.9% for psychodynamic psychotherapy and 23.9% for CBT (Stiles et al., 2008a). Meta-analysis of 28 randomized trials of CBT (total N=2109) reveals comparable or even higher rates of response, with an average of 33 to 43% of patients not responding after an average of 13 sessions of treatment (Hansen et al., 2002). We note that patients referred to the CIPPS have treatment needs that are beyond the reach of primary care psychotherapy services, which may account for the higher rates of non-response observed here.
Comparable effectiveness of GAP and PPT
Our data are consistent with a conclusion that, within the CIPPS, group analytic therapy is not inferior to individual psychodynamic therapy. Since the study is observational, we cannot exclude a possibility that dropout rates and/or rates of missing data differed by treatment modality, and we have no data regarding these factors. Similarly, since clients are not randomized to treatments, it is possible that any differences (or lack of difference) between treatment modalities are attributable to differences in the characteristics of clients allocated to different therapies. Indeed, cohorts of clients allocated to GAP and PPT are likely to differ in ways that are only partly captured by the demographic data available. Notwithstanding a lack of randomization, however, our study has the pragmatic advantage that both the treatments themselves, and the process by which clients are assessed and allocated to treatments, are representative of those delivered in the UK’s NHS. As Stiles et al. describe: Our approach followed the logic of clinically representative, or effectiveness research, in which the risks of selection biases associated with lack of randomization and the lack of assurance that the treatments were delivered in a standard way are balanced by the greater realism, or external validity. Results address the effects of treatments as routinely delivered, using practitioners’ versions of the treatments and the patients who typically receive them. (Stiles et al., 2008a: 678)
We can conclude that clients who were selected for group therapy, and for whom outcome data are available, improve to a similar extent as those selected for individual therapy. These data accord with previous findings that group therapy has comparable efficacy to individual therapy (Blackmore et al., 2012; Barkowski et al., 2020; Rosendahl et al., 2021; Schwartze et al., 2019), and indeed with findings that different modalities of individual therapy have comparable effectiveness in primary care settings (Stiles et al., 2008a).
Faster improvement in shorter therapies
We found that improvement was faster in short-term compared with long-term therapies. This could reflect different characteristics of the client group receiving shorter therapies. We note that people are usually offered short-term therapy at the CIPPS because a more focused piece of work is thought to suffice. By contrast, a long-term therapy may be recommended because it is recognized that the process of change is likely to be slow, owing to the complexity of a person’s difficulties. In view of these considerations, it appears unsurprising that people assigned to shorter therapies improve more quickly. An alternative explanation would be that slower improvement in longer therapies resulted because therapy tended to be extended for patients who were not responding. While previous studies have supported this conclusion (Stiles et al., 2015; Stiles et al., 2008b), at the CIPPS the length of treatment (with the exception of long-term ‘slow open’ groups) is agreed at the outset, so treatment tends not to be extended because of non- response.
Secondary findings
Faster improvement during therapy versus waiting list
Clients on average showed an improving trend in scores between referral and starting therapy. Improvement during the waiting period might reflect spontaneous remission over time. Also, being on a waiting list may of itself be a positive experience in so far as it represents the possibility of potential change for the patient. Alternatively, improvement during the ‘waiting time’ may be attributable to active therapeutic interventions in this period. Firstly, the psychotherapy consultation process, which may occur over several sessions with a psychotherapist, might in itself carry therapeutic benefit. Secondly, at the CIPPS, clients may have further meetings with clinicians after the initial consultation and before starting therapy, for instance preliminary meetings with a group therapist before joining a group. Future research might explore which factors contribute to change during the waiting period. Nevertheless, across GAP and PPT combined, we found that clients improved more quickly during therapy than they did whilst waiting for therapy: on average, the CORE-OM clinical score (/40) improved by 2.5 points per year whilst waiting for therapy, and 4.6 points per year during therapy.
Improvement was maintained at six month follow up
Where data were available, improvement was maintained at six-month follow up (our analysis of follow up scores combined data from both PPT and GAP). Owing to high rates of missing data, the confidence interval on estimated change during follow up was relatively wide, indicating uncertainty about this finding. Nevertheless, our data are consistent with an existing finding that, in the treatment of chronic depression, benefits of long-term PPT compared with treatment-as-usual emerged over a three year follow up period (Fonagy et al., 2015). A pressing quality improvement goal for the service is to increase uptake of follow up outcome measurement, which would support future work examining the longer term outcomes of GAP and PPT.
Limitations of quantitative outcome measurement
Therapists often express concern that outcome data will not evidence subtle relational changes that they observe in their patients and will therefore find their therapy to be ineffective (Youn et al., 2012; Rye et al., 2019; Norman et al., 2013; Boswell et al., 2015). An observation that numerous quantitative studies support the effectiveness of psychodynamic or analytic therapies would suggest that therapists’ anxiety in this regard is on the whole unfounded. In our view, a relevant concern associated with symptom-based outcome measures in psychotherapy is that not that they will fail to demonstrate meaningful change on average, rather that they only coarsely approximate what is valued by individual clients (see Green, 2016). This complexity has a bearing on the use of outcome measures in ‘feedback-informed’ psychotherapy.
Individual variability in response to therapy has led to attempts to predict non-response. One approach has been to leverage change in outcomes early in therapy as a predictor of later change (e.g. Fluckiger et al., 2013; Haas et al., 2002; Renaud et al., 1998). Within this paradigm, outcome measurement is used to identify where clients are ‘not on track’, thereby alerting the clinician to a possibility that therapy may be ineffective (Hannan et al., 2005; Hatfield et al., 2010; Boswell et al., 2015; Lambert et al., 2002; Carlier et al., 2012; Boswell et al., 2015; Fortney et al., 2017; Brattland et al., 2018; Saunders et al., 2016). Randomized controlled trials indicate that building such feedback loops into everyday clinical practice ‘improves’ responses to psychotherapy (e.g. Hawkins et al., 2004; Slade et al., 2008; Brattland et al., 2018, De Jong et al., 2014; Carlier et al., 2012; for meta-analyses see Shimokawa et al., 2010; Fortney et al., 2017).
However, as with all forms of optimal control problem, so-called improvement may reflect effects peripheral to those of interest (e.g., Dennis, 2020). For example, from an analytic perspective, a low symptom score could reflect heightened use of manic or schizoid defences, rather than improved psychological or relational functioning. As such, for some people, scores which focus on symptomatic distress might even be expected to worsen within a successful treatment, as psychic defences become less effective in denying or disconnecting from painful reality. More broadly, notions of mental health or illness are culture-bound (Littlewood, 1990; Strupp, 1964; Hill et al., 2016). Thus, although outcome measures purport to be generalisable, they may inadvertently privilege particular cultural notions of distress (Strupp and Hadley, 1978). Feedback-informed psychotherapy therefore carries a risk that therapy is ‘optimized’ towards a criterion that is misaligned with the goals and values of the participants (see Stocks et al., 2019; McLeod, 2001; Nilsson et al., 2007).
Finally, we note that the paradigm of evidence-based practice implies that treatment is well defined and homogenous (Margison et al., 2000). As first described by Foulkes (1957), some operational aspects of GAP, such as the length of sessions and the conductor’s general stance, are indeed tightly defined. In keeping with these criteria, manualized approaches to GAP have been successfully developed (see Lorentzen, 2014). However, as Blackmore et al. (2012) point out, group-analytic therapies also vary considerably, for example in the composition of groups, frequency of sessions (weekly or twice weekly) and membership policies (closed, semi-closed or slow open). The training and experience of group analytic psychotherapists is similarly diverse. Thus, rather than having a single, replicable effectiveness, group-analytic therapies will have outcomes that necessarily vary depending on their specific context. Such heterogeneity is desirable if group analytic therapy is to meet the needs of diverse participants in a flexible way.
We are ultimately in favour of a pragmatic approach to outcome measurement, where organisations decide at a local level how outcome data can best meet the needs of services and their clients. In our view, outcome evaluations such as the present one are useful in guiding the provision of services; however, by reducing psychic change to a standardized symptom score, such studies conceal a rich diversity in the participants and practice of psychotherapy. We therefore feel it is important that quantitative studies are supported by qualitative data exploring the intersubjective processes of psychotherapy in particular settings.
Supporting methods
Assignment of CORE-OM time codes
At the point of uploading data onto Core Net clinicians are asked to enter coded time windows at which a form was completed: at Referral, Assessment, First Session, During Therapy, Last Session or Follow Up. We checked the consistency of these time codes with the date of each CORE form relative to the stated assessment date, therapy start date and therapy end date using custom computer code. Forms were recoded using the following criteria. Forms completed more than 14 days prior to the date of the assessment were coded as Referral. Forms within 14 days of assessment were coded as Assessment. Forms more than 14 days after assessment and within 14 days of the therapy start date were coded as First Session. Forms after 14 days of the therapy start date, and at least 14 days before the therapy end date were coded as During Therapy. Forms within 14 days of the therapy end date were coded as Last Session. Finally, forms more than 28 days after the therapy end date were coded as Follow Up. This procedure re-assigned time codes for 345 out of 2207 forms. We note that this re-assignment only pertains to analyses using the assigned time codes; we also analyse outcomes as a function of elapsed time.
Supplemental Material
sj-docx-1-gaq-10.1177_05333164241257239 – Supplemental material for Effectiveness of group analytic and psychodynamic psychotherapy in routine secondary-care practice
Supplemental material, sj-docx-1-gaq-10.1177_05333164241257239 for Effectiveness of group analytic and psychodynamic psychotherapy in routine secondary-care practice by Giles W. Story, Florence Dalton, Adam Selway, Luigi Caparrotta, Jo O’Reilly, Alan Colam, Alan Larney, Sheila Ritchie and Thomas Hillen in Group Analysis
Supplemental Material
sj-docx-2-gaq-10.1177_05333164241257239 – Supplemental material for Effectiveness of group analytic and psychodynamic psychotherapy in routine secondary-care practice
Supplemental material, sj-docx-2-gaq-10.1177_05333164241257239 for Effectiveness of group analytic and psychodynamic psychotherapy in routine secondary-care practice by Giles W. Story, Florence Dalton, Adam Selway, Luigi Caparrotta, Jo O’Reilly, Alan Colam, Alan Larney, Sheila Ritchie and Thomas Hillen in Group Analysis
Footnotes
Acknowledgements
The authors would like to thank Glyn Lewis, Itamar Cohen, Jason Tsang and Tessa Sloper for their assistance with this work.
Data Availability Statement
Research data are not shared. The data are not publicly available due to privacy or ethical restrictions.
Funding
The author(s) disclosed receipt of the following financial support for the research, authorship, and/or publication of this article: Giles Story receives funding from the National Institute for Health Research as a Clinical Lecturer in Psychiatry. The Max Planck UCL Centre for Computational Psychiatry and Ageing receives funding from the Max Planck Society. The funders had no role in data analysis, decision to publish this work, or preparation of the manuscript.
Supplemental material
Supplemental material for this article is available online.
References
Supplementary Material
Please find the following supplemental material available below.
For Open Access articles published under a Creative Commons License, all supplemental material carries the same license as the article it is associated with.
For non-Open Access articles published, all supplemental material carries a non-exclusive license, and permission requests for re-use of supplemental material or any part of supplemental material shall be sent directly to the copyright owner as specified in the copyright notice associated with the article.