
Abstract
The treatment approach to RA has changed over time, but the main goal of treatment has remained the same, that is, achieving disease remission. Given the lack of RA disease activity tools and biomarkers that can reliably predict RA drug effectiveness not just on joints but also on extra-articular manifestations. The involvement of galectins, especially Galectin-1 (Gal1) in the regulation of immune regulation makes them potential good candidate non-specific biomarkers of autoimmune diseases like RA. Examining the possibility of applying Gal1 as a potential biomarker for evaluating the effectiveness of therapy. A quasi-experimental study was conducted to assess changes in serum Gal1 concentrations in patients with RA, compared with a healthy control group. The study included a total of 88 participants, consisting of 48 patients diagnosed with RA and 40 healthy voluntary blood donors. Patients were enrolled in the study based on a selective recruitment process, provided they met the criteria outlined in the Inclusion Criteria section. The diagnosis of RA was established by physicians in accordance with the ACR/EULAR2010 classification criteria. The collected samples were subjected to concentration determination using a commercial ELISA kit for human Gal1. The serum Gal1 concentration of the examined groups differed significantly (P < 0.0001). There was a significant difference in serum concentration of Gal1 between first and second measurement (pre- and post-intervention) (P = 0.015). The obtained values of post-intervention Gal1 did not show a positive correlation with the values of DAS28-ESR, HAQ-DI, and CDAI. The conducted study showed a pronounced statistical significance in the values of Gal1 concentrations in RA patients (in both time points) compared to the group of healthy subjects, suggesting that lower levels of this marker may be associated with the degree of inflammation characteristic of RA. No significant correlation was observed between Gal1 levels and clinical disease activity indices, limiting conclusions.
Introduction
Rheumatoid arthritis (RA) is a chronic systemic autoimmune disease primarily characterized by peripheral symmetrical arthritis.1,2 With a global prevalence estimated between 0.5% and 1%, RA disproportionately affects women, who are three times more likely to develop the disease than men. 3 RA results from an interaction between genetic (HLA DR01/04, PTPN22, TNFAIP3, and STAT3) 4 and environmental (e.g. tobacco smoking and silica dust) 4 factors and is characterized by the articular and extra-articular production of pro-inflammatory cytokines that favor and maintain joint and systemic inflammation.4,5 The treatment approach to RA has changed over time, but the main goal of treatment has remained the same, that is, achieving disease remission. Since the early 2000s, the classical RA pharmacotherapy involves conventional synthetic disease-modifying antirheumatic drugs (csDMARDs), targeted synthetic DMARDs (tsDMARDs) and biological DMARDs (bDMARDs). csDMARDs for RA typically include methotrexate, leflunomide, sulfasalazine, and hydroxychloroquine. tsDMARDs for RA include baricitinib, filgotinib, tofacitinib, and upadacitinib bDMARDs for RA typically include tumor necrosis factor inhibitors (adalimumab, certolizumab, etanercept, golimumab, and infliximab), interleukin-6 receptor inhibitors (tocilizumab and sarilumab), a T-cell co-stimulation inhibitor (abatacept) and an anti-B-cell CD20 agent (rituximab). Additionally, compounds of biosimilar DMARDs (bsDMARDs) are available on the market, including biosimilar agents of adalimumab, etanercept, infliximab, and rituximab. 6 Besides all these drugs, glucocorticoids are recommended in the initial RA treatment strategy. With these drugs, only 7%–17% patients reportedly achieve remission within 6 months of drug therapy initiation.7,8 Of those who reached remission, only 51% remained in remission over 23 months. 8 RA remission is typically evaluated using a variety of disease activity tools that primarily assess joint health, such as the Disease Activity Score 28 incorporating erythrocyte sedimentation rate (DAS28-ESR) and the Clinical Disease Activity Index (CDAI), or by using the Boolean definition of disease remission.6,9–11 Although the autoantibodies anti-cyclic citrullinated peptide (anti-CCP) and rheumatoid factor (RF) are the main RA biomarkers in clinical practice, 12 some RA patients remain seropositive for those autoantibodies even after achieving remission. Consequently, those autoantibodies are not reliable markers of RA drug effectiveness, and there are not accurate markers of RA drug effectiveness to date to the best of our knowledge.6,13
Galectins, carbohydrate-binding proteins located in the cytosol, that participate in virtually all immune functions, including the regulation of immune responses.14,15 It is important to note that galectins may exert paradoxical effects depending on their site of action, highlighting their complex role in immune regulation. 16
Based on the structural types: prototype galectins (e.g. Galectin-1, -2, -5, -7, -10, -11, -13, -14, -15) containing a single CRD and forming non-covalent homodimers, the Chimera-type galectin (Galectin-3) possessing a single CRD and oligomerizing via its N-terminal domain upon binding to glycan ligands, and Tandem-repeat galectins (e.g. Galectin-4, -6, -8, -9, -12) harboring two distinct CRDs connected by a flexible link and capable of forming higher-order multimers through interactions involving both their N- and C-terminal regions. 14 Galectin-1 (Gal1), the most abundant galectin, exhibits anti-inflammatory properties through its proapoptotic effect on activated T lymphocytes, promoting Th2 over Th1 responses and contributing to immune polarization. 17 Gal 1 also enhances innate immunity by stimulating inducible nitric oxide synthase (iNOS) production, mast cell degranulation and neutrophil infiltration.18,19
The involvement of galectins in the regulation of immune regulation makes them potential good candidate non-specific biomarkers of autoimmune diseases like RA, although it is unclear whether galectins upregulate and/or downregulate immune responses. 14 Given the lack of RA disease activity tools and biomarkers that can reliably predict RA drug effectiveness not just on joints but also on extra-articular manifestations, we carried out a study investigating the potential application of Gal1 as a biomarker for monitoring therapy effectiveness in patients with RA.
Patients and methods
Study design and participants
A quasi-experimental study was conducted to assess changes in serum Gal1 concentrations in patients with RA, compared with a healthy control group.
The study group consisted of 48 patients suffering from RA, treated at the Institute for Treatment and Rehabilitation “Niška Banja” (Niška Banja, Republic of Serbia) between 2022 and 2024. Patients were enrolled in the study based on a selective recruitment process, provided they met the criteria. The healthy control group included 40 voluntary blood donors who self-reported to not being affected by RA or another acute or chronic inflammatory or malignant disease.
Inclusion criteria
The inclusion criteria for participant selection were: diagnosed since 1 year or more at the Institute for Treatment and Rehabilitation Niška Banja in the Republic of Serbia in accordance with the American College of Rheumatology/European League of Associations of Rheumatology 2010 classification criteria (ACR/EULAR 2010), 20 persistently active RA despite being under DMARDs therapy which is shown in Table 3 (for patients pre-intervention), as shown by a DAS28-ESR value >3.2 or a CDAI value >10.9,10 The diagnosis of RA was established by physicians at the Institute for Treatment and Rehabilitation “Niška Banja” (Niška Banja, Republic of Serbia) in accordance with the ACR/EULAR 2010 classification criteria. 20
Exclusion criteria
The exclusion criteria of the conducted study were: presence of malignancies, infections, other autoimmune diseases that can be from the group of rheumatic as well as non-rheumatological diseases, RA diagnosed within 1 year, as well as RA in remission.
Sociodemographic and clinical assessment
Sociodemographic data (sex, age, and Body Mass Index—BMI) were recorded for all participants, while clinical data, including disease duration, disease activity measures (DAS28-ESR and CDAI), HAQ-DI questionnaires, therapy and presence of comorbidities, were obtained from patients’ medical records.
Laboratory assessments
As part of their regular medical visits, RA patients had their blood samples collected at two time points: at baseline prior to a therapy change, and 3 months after the therapeutic intervention (therapy/drug change). Control participants had their blood samples collected at the same time as RA patients. After blood sampling, it was necessary to leave the blood samples at room temperature for the next 30 min to allow the coagulation process of blood elements to take place. After blood coagulation, the test tubes were centrifuged at room temperature for 10 min at 3000 revolutions per minute. The resulting supernatant or serum was separated and transferred to 1.5 mL Eppendorf tubes, which were stored at a temperature of −80ºC until the moment of concentration measurement.
The collected samples were subjected to Gal1 concentration determination using a commercial ELISA kit for human galectin 1 (Human Galectin-1 Quantikine ELISA Kit DGAL10 (R&D Systems, Inc., Minneapolis, MN, USA)). The analysis of the samples was performed by following the protocol that is an integral part of the applied ELISA kit (R&D Systems). As part of the protocol, it was necessary to apply accompanying devices such as a Shaker and Elisa washer (Atlantis Anthos Fuido 2 Microplate Washer, Montreal Biotech). Determination of the optical density was made possible using a spectrophotometer (SpectraMax iD3, Molecular Devices), while the data on the concentration of the samples were obtained using the four-parameter logistic curve.
Values (pre- and post-intervention) of other biological parameters (C-Reactive Protein (CRP), ESR, RF and anti-CCP) were obtained from the patients’ medical records.
Intervention and study outcome
The intervention administered corresponded to the RA DMARDs patients were on before the commencement of this study. However, for the sake of this study, the beginning of RA DMARDs corresponded to the time when pre-intervention serum Gal1 level was performed. The RA DMARDs used after the intervention are listed in Table 3 and included methotrexate (7.5–25 mg/week), hydroxychloroquine (200–400 mg/day), chloroquine (250 mg/day), glucocorticoids (5–10 mg/day), sulfasalazine (0.5–3 g/day), leflunomide (10–20 mg/day), NSAIDs, tsDMARDs, and bDMARDs. Their potential individual impact was evaluated after 3 months of regular treatment, although adherence was not actively monitored, which represents a limitation discussed later in the manuscript.
In addition to blood sampling, it was also necessary to collect data from the patient’s medical history, in order to process information on demographic characteristics, applied therapy, as well as clinical parameters of disease activity (DAS28-ESR, 10 The Health Assessment Questionnaire disability index—HAQ-DI, 21 CDAI 9 ) that are monitored as part of RA. Clinical and laboratory data were collected at two time points, initially, when patients were experiencing active disease and receiving therapy deemed ineffective, and 3 months after switching to new therapeutic regimen.
Sample size calculation
The sample size determination was conducted using the G Power 3.1.9.2 software package, with predefined parameters set to achieve a statistical power of 80% and a type I error probability (α) of 0.05 for two-tailed hypothesis testing based on t-distribution. Utilizing previously published data on Gal1 levels in healthy individuals and patients with rheumatoid arthritis (Ana Triguerero-Martinez, Scientific Reports 10, 2020), 5 the calculated sample size was determined to be 46 participants per group.
Statistical analysis
The obtained results of Gal1 concentrations, as well as the data from medical history were statistically processed and sorted using the SPSS 20.0 program package as well as the Excel program from the Office 365 program package. Before the start of the analysis, the normality of the collected and obtained data was examined. Considering that the sample size for both the patient group and the control group of healthy subjects was less than 50, the Shapiro–Wilk test was applied to assess the normality of the dataset. To avoid heterogeneity in the presentation of results, if the results for one category did not have a normal distribution, they were presented through median and interquartile range. As part of descriptive statistics, frequency (%), medians, and interquartile ranges (IQR) were presented for sociodemographic characteristics (age, sex and BMI), autoantibodies (RF and Anti-CCP), inflammatory biomarkers (CRP and ESR), and concentrations of Gal1. The chi-square (χ2) test was applied to determine the difference in gender distribution between the studied groups. To assess the primary outcome of the study, that is, the potential of Gal1 as a biomarker of the effectiveness of DMARD therapy in RA, the medians of serum Gal1 concentrations pre- and post-intervention in therapy (3 months later) were compared using the non-parametric Wilcoxon signed-rank test due to deviation from normality in the examined groups. In addition, ROC curve analysis was used to assess the diagnostic potential of Gal1 in distinguishing healthy controls and patients in baseline time frame. To assess the impact of individual DMARD drugs in RA therapy on changes in Gal1 concentrations, a univariate linear regression model was used to identify independent predictors of Gal1 change. In the secondary outcome, changes in clinical disease activity indices and functional status, inflammatory markers (CRP and ESR), as well as RF and Anti-CCP, were monitored. Their changes were tested using the Wilcoxon signed-rank test, while McNemar’s test was applied to assess changes in seropositivity frequencies of the mentioned inflammatory biomarkers. In addition, the existence of correlation between the change in serum Gal1 and the change in clinical index values was examined. The overall statistical analysis was performed with a statistical error level of less than 5% (P < 0.05).
Results
Baseline participant characteristics
The study included 88 participants, all of whom were Caucasian and of Serbian nationality, of which 48 were patients suffering from RA (patients who despite therapy, show signs of disease activity) and 40 healthy individuals who served as the control group. The average age of the RA patients was 55.38 ± 11.05 years, while in the control group it was 47.18 ± 11.35 years (P = 0.001). A statistically significant difference was observed between the groups with respect to age, whereas no significant differences were found regarding sex distribution and body mass index (BMI) (P > 0.05). The demographic characteristics, as well as the medians and seropositivity for autoantibodies (RF and Anti-CCP) and inflammatory biomarkers (CRP and ESR), are presented in Table 1. It is important to note that the selection of patients was not randomized due to the quasi-experimental design of the study, which may have introduced potential bias.
Baseline characteristics of study participants.

RA: rheumatoid arthritis; RF: rheumatoid factor; Anti-CCP: anti-cyclic citrullinated peptide antibody; ESR: erythrocyte sedimentation rate; CRP: C-Reactive protein; BMI: Body Mass Index; IQR: interquartile range; N (%): number of patients (percent of them).
Median and interquartile range of raised serum concentration.
Primary study outcome: Accuracy of serum Gal1 as biomarker for RA DMARD effectiveness
The primary outcome of this study was based on the determination of differences in the serum level of Gal1 as a potential biomarker of the effectiveness of DMARD therapy applied in the treatment of patients suffering from RA. The flow diagram shown in Figure 1 represents the flow of recruitment of patients and control groups of subjects in the study. Serum levels of Gal1 were determined both in patients and in the control group of subjects, but also in patients 3 months after the pharmacotherapeutic intervention. The obtained results shown in Table 2, show a statistically significant difference in the median Gal1 concentrations pre-intervention [29.21 (22.62–35.98)] and post-intervention [26.54 (21.53–33.26)] (P = 0.015). The concentration between the patients at both time points and the control group of subjects was also compared, and the obtained results indicate the existence of a statistically significant difference between the examined groups (P < 0.0001).
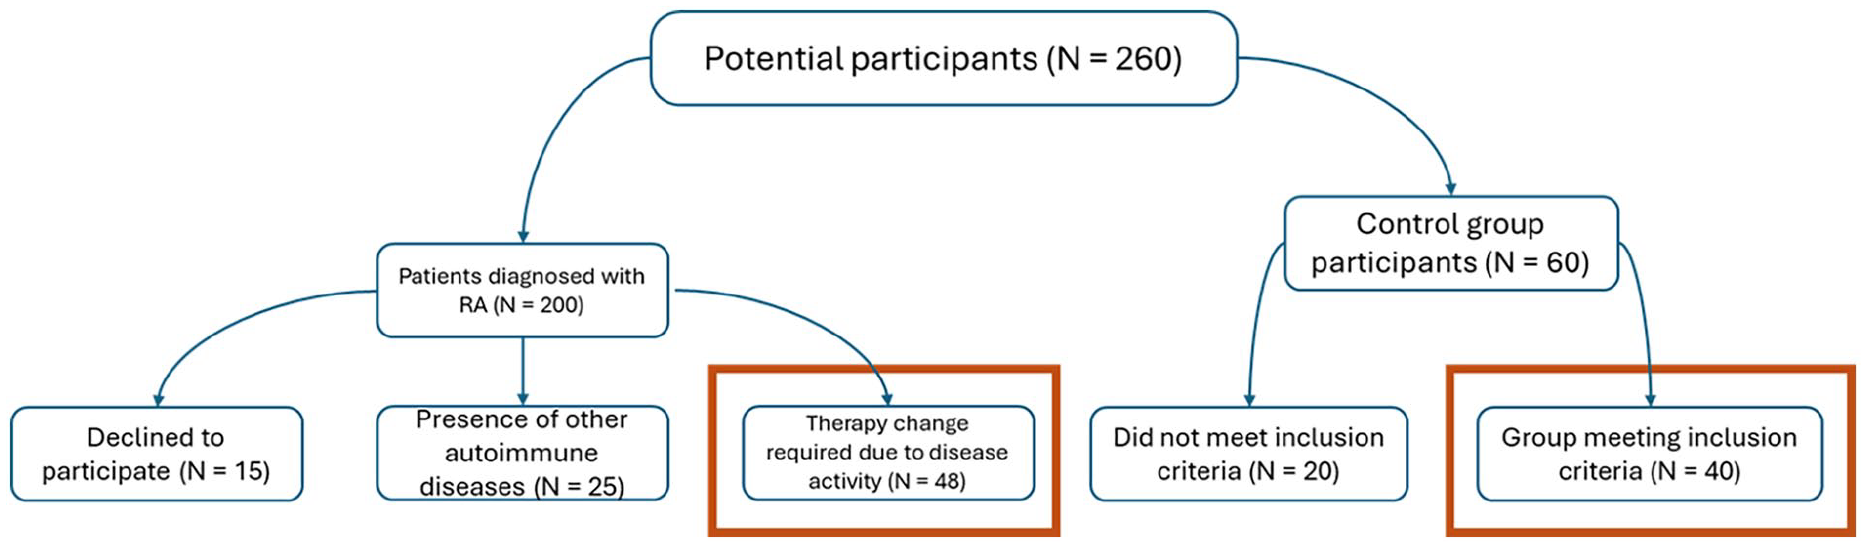
Flowchart of study population screening and inclusion.
Results of primary and secondary study outcome assessment.

Gal1: Galectin 1; DAS28-ESR: disease activity score 28–erythrocyte sedimentation rate; HAQ-DI: The Health Assessment Questionnaire disability index; CDAI: Clinical Disease Activity Index; ESR: erythrocyte sedimentation rate–in first hour; CRP: C-Reactive protein; RF: rheumatoid factor; Anti-CCP: anti-cyclic citrullinated peptide antibodies.
P*: pre-intervention versus post-intervention; P**: pre- and post-intervention versus control group.
In order to examine the association of Gal1 changes (ΔGal1) with pharmacotherapeutic response, a univariate linear regression analysis was conducted in which ΔGal1 represented the dependent variable, while on the other hand, drugs in RA therapy (csDMARDs, tsDMARDs and bDMARDs) were predictors of changes in those values. The obtained results did not show statistical significance of the influence of drugs on changes in Gal1 concentration values (P > 0.05). The frequency of drug use in RA patients pre- and post-intervention is shown in Table 3.
Medication profile in RA patients pre- and post-therapy change.

tsDMARDs: targeted synthetic disease-modifying antirheumatic drugs; bDMARDs: biological disease-modifying antirheumatic drugs; NSAIDs: non-steroidal anti-inflammatory drugs.
To determine the sensitivity and specificity of Gal1 as a potential biomarker for evaluating diagnostic ability, we applied ROC curve analysis. As a first step, the diagnostic ability of Gal1 to distinguish patients from the control group was assessed (Figure 2). In order to interpret the ROC curve results accurately and present the sensitivity and specificity of the examined parameter, it was necessary to determine the optimal cutoff value, which for the pre-intervention measurement of Gal1 concentration was 21.33 ng/mL. Its determination was made according to Youden’s formula. 22 In the comparison between pre-intervention patient samples and the control group, the sensitivity was 85.42%, while the specificity was 97.5% (AUC = 0.951). These ROC analyses primarily illustrate the diagnostic performance of serum Gal1 in distinguishing RA, rather than providing evidence of the effectiveness of the administered DMARDs therapy.

ROC curve analysis of galectin-1 concentrations pre-intervention in patients compared to controls.
Secondary study outcome
The secondary outcome of the study was to assess changes in indices of disease activity (DAS28-ESR and CDAI), functional status (HAQ-DI), autoantibodies (RF and Anti-CCP), and inflammatory biomarkers (CRP and ESR) 3 months after pharmacotherapeutic intervention.
Statistically significant improvements were observed in patients, reflected by reductions in DAS28-ESR, CDAI, and HAQ-DI scores (P < 0.0001) 3 months after the intervention (Table 2). These findings suggest that the observed reductions in disease activity indices may be attributable to the pharmacotherapeutic intervention, considering the elevated baseline values. Moreover, the study showed a statistically significant drop in the titers of autoantibodies (RF and Anti-CCP) typical of RA, suggesting therapeutic effectiveness.
To further investigate the relationship between Gal1 levels and disease indices, a correlation analysis was performed. The analysis examined associations between post-intervention values of Gal1 and the post-intervention values of disease activity indices and functional status. The results did not reveal any significant correlation (P > 0.05).
Clinical indices of disease activity DAS28-ESR, HAQ-DI and CDAI were obtained from patient medical history following both pre- and post-intervention blood sampling. The results clearly demonstrated a statistically significant change in Gal1 concentrations between the two time points (Table 2). The obtained results suggest that, despite the statistically significant decrease in Gal1 levels in patients with RA, due to the lack of correlation of this biomarker with conventional disease activity indices, we cannot claim that it reflects clinical improvements.
Discussion
The treatment of autoimmune diseases is still a very big challenge today, despite the presence of a wide range of conventional synthetic and biological drugs. Therapy of RA requires an adequate therapeutic approach, on the basis of which the most favorable therapeutic modality will be provided from the available range of drugs, which will contribute to the establishment of remission of the disease, improvement of the quality of life and functional capacity of patients. The available and prescribed therapy does not lead to the cure of patients suffering from RA, but it gives the possibility of establishing a remission followed by an improvement in the patients’ functional ability. As a result of the aforementioned, it is very important to have some objective indicators in addition to the subjective indicators of the effectiveness of the applied therapy. For this purpose, we have focused on examining the potential significance of Gal1 as an indicator of the effectiveness of the applied therapy in patients suffering from RA, who on that occasion have an active form of the disease.
As a member of the lectin family of proteins, Gal1 is a protein that is considered to have a very important role in the development of RA. 17 A review conducted by Sundblad et al. 23 indicates a high expression of Gal1 by cells of the immune response, 23 while the study of Méndez-Huergo et al. 24 indicates the possibility of Gal1 as a new regulatory point that is also the link between innate and acquired immune response. 24 Although, the research was based on examining the relationship between tumor immunity and angiogenesis, 17 the inflammatory basis of tumor development may be related to autoimmune diseases. 25
The obtained results indicate a statistically significant difference in Gal1 concentrations between RA patients (in both time frames) and the healthy control group, as presented in Table 2 (P < 0.0001). In addition to examining differences in Gal1 concentrations between RA patients and healthy individuals, changes in Gal1 levels within the patient group were also evaluated before and after a pharmacotherapeutic intervention, which involved the addition of one or more DMARDs. Based on the conducted analysis, a statistically significant difference in Gal1 concentrations was observed within the patient group (P = 0.015) (Table 2). Studies that have examined the diagnostic potential of Gal1 are consistent with our findings. Among the relevant studies, the work of Méndez-Huergo et al., 26 Abdel Rahman et al., 27 and Maged et al. 28 stand out, while the study by Triguero-Martínez et al. 5 investigated the diagnostic and discriminative capacity of Gal1 as a biomarker for early-stage RA. The primary outcome investigated in our study cannot be directly compared to other studies due to a lack of similar research in this specific area.
Within the framework of pharmacotherapeutic interventions, based on an insight into the medical documentation, the most frequently introduced drugs were tsDMARDs (Janus kinase inhibitors—JAKi) and bDMARDs. Specifically, it was recorded that at the time of the pre-intervention sampling, only 4.2% of patients were treated with a JAKi, while after the change in therapy, that number increased to 27.1%. The results are similar with bDMARDs, where the change was from 37.5% on 70.8% of patients. csDMARDs were also introduced in therapy to the examined group of patients, but in a significantly lower percentage than the two previously mentioned groups of drugs. The obtained results can be compared with the study conducted by Harjacek et al., 29 in which they state that a decrease in Gal1 expression was observed in patients receiving appropriate therapy compared to healthy subjects, but that no statistically significant difference was observed between treated and untreated patients. 29 The mentioned team of researchers 29 states that regardless of the absence of significance in the change of expression, there is a trend of reduced expression, which may indicate the effectiveness of the applied therapy in suppressing an excessive immune response. We would like to mention that the results of the mentioned study 29 were obtained from patients suffering from juvenile idiopathic arthritis, and that synovial tissue samples were used in that study. 29 The analysis of changes in Gal1 concentrations (ΔGal1) in the studied group of RA patients did not reveal a statistically significant effect of individual drugs included in the RA DMARD therapy. Although a change in Gal1 concentrations was observed 3 months after therapeutic adjustment, the lack of correlation with clinical disease activity indices prevents us from drawing definitive conclusions regarding its reliability as a biomarker of treatment effectiveness in RA.
As the final part of the primary study outcome, the ROC curve was also performed. Based on the obtained results, we can conclude that there is a significant difference in the concentration of Gal1 between the patients (in pre-intervention) and the control group, which indicates that Gal1 can be used as a biomarker for distinguishing patients/subjects who have inflammation from those without it. On the other hand, the data obtained in the post-intervention measurement show us that the concentrations of Gal1 decreased due to the change of therapy (due to the introduction of the drug with or without the exclusion of one or more of them from the therapy). However, the value remains relatively high when compared to those of the control group of subjects. We conclude that the concentration of Gal1 decreases after 3 months of application of the new therapeutic modality. It can be assumed that due to the change in the therapeutic modality, the inflammatory process decreases because the Gal1 value also decreases. Building upon the results of the ROC curve analysis, the secondary outcome of the study did not demonstrate a correlation between post-intervention Gal1 concentration levels and the values of disease activity indices or functional status following the pharmacotherapeutic intervention. Therefore, the findings of this study provide a valuable foundation for the development of new research hypotheses in future and methodologically more robust studies. However, due to the lack of correlation between the obtained values and the clinical parameters of the disease activity, we cannot make such a claim with certainty. Research by Triguero-Martínez et al. 5 showed that in early RA the concentration of serum Gal1 is higher than the concentrations obtained from the control group of subjects, but the results of the ROC curve show a significantly lower value of AUC (0.761) 5 compared to those obtained by us in our study group of patients with RA, which we can attribute to a more advanced RA stage. Research conducted by Maged et al. 28 indicates a high sensitivity (95%) and specificity (82.1%) of determining the concentration of Gal1 compared to a group of healthy subjects. 28 Also, the research results of Méndez-Huergo et al. 26 show high AUC values (0.82) with high sensitivity (80%) and specificity (73.3%), which is in accordance with the results of our research.
The lack of correlation may be attributed to the subjective answers of the patients in the questionnaires for DAS28-ESR, HAQ-DI, and CDAI. The lack of correlation in relation to the inflammatory markers ESR and CRP may be justified by the short time interval of control measurements of Gal1 concentration. In future research, it will be essential to conduct longer patient follow-up periods (6–12 months), as well as to adequately monitor adherence within the study group. It will also be necessary to investigate the significance of Gal1 in RA by comparing patients who are already receiving therapy with those who are treatment-naïve, in order to more clearly define the role of Gal1 in RA. Taking all this into consideration, the obtained results, if they are positive, could greatly assist rheumatologists in monitoring disease activity and response to the applied therapy.
Conclusion
The conducted study demonstrated a statistically significant difference in Gal1 concentrations between RA patients and healthy controls, suggesting that lower levels of this marker may be associated with the degree of inflammation characteristic of RA. ROC curve analysis confirmed the diagnostic potential of Gal1 as a biomarker. However, no significant correlation between Gal1 levels and clinical disease activity indices were observed, limiting definitive conclusions about its reliability as a marker of treatment effectiveness. Therefore, further research involving a larger patient cohort and more frequent concentration measurements over a defined period is necessary to better evaluate the clinical utility of Gal1. Such studies could determine whether Gal1 may serve as a useful biomarker in assessing RA therapy outcomes, potentially paving the way for its more frequent use in evaluating treatment effectiveness.
The novelty of this study lies in its evaluation of Gal1 as a potential biomarker for both diagnostic and therapeutic purposes, highlighting its prospective clinical application that warrants further validation in future research.
Study limitations
The limitations of this study include the short follow-up interval, the size of the examined patient and control groups, and the lack of control over patient adherence, as there was no possibility to verify whether patients took their therapy regularly. Additionally, we did not have access to data regarding the patients’ socioeconomic status and education level. It is also important to note that patient selection was not random due to the nature of the research topic.
Footnotes
Acknowledgements
The authors would like to thank the doctors of the Institute for Treatment and Rehabilitation “Niška Banja”, the rheumatology clinic and the patients for their help in conducting the research. The authors also would like to thank the Ministry of Science, Technological Development and Innovation of the Republic of Serbia for their support.
Author contributions
NK, TJS, SS, and ID contributed to the literature search and study design. SS followed patients at the Institute for Treatment and Rehabilitation “Niška Banja.” NK and SS collected samples at the Institute for Treatment and Rehabilitation “Niška Banja.” NK, TJS, SS, BĐ, and ID contributed to data collection and analysis. NK, TJS, and ID participated in drafting the manuscript, while SS and BĐ revised it. All authors have read and approved the final manuscript.
Data availability
The data supporting the results of this study are available from the study investigators; however, there are restrictions on their availability. In accordance with the approval obtained from the Ethics Committee, the data are available only to the study researchers but may be made available by the corresponding author upon reasonable request.
Declaration of conflicting interests
The author(s) declared no potential conflicts of interest with respect to the research, authorship, and/or publication of this article.
Funding
The author(s) disclosed receipt of the following financial support for the research, authorship, and/or publication of this article: The work was funded by the Ministry of Science, Technological Development and Innovation of the Republic of Serbia (No. 451-03-137/2025-03/200113; 451-03-136/2025-03/200113).
Approval of the ethics committee
Informed consent for participation in the study was obtained from patients and healthy subjects, and the entire study was approved by the Ethics Committee of the Institute for Treatment and Rehabilitation Niška Banja (No: 03-1626/1) and the Ethics Committee of the Faculty of Medicine of the University of Nis (No: 12-6647-2/3). The research was conducted in accordance with the Helsinki Declaration. Patients and healthy control group participants were fully informed about the study’s objectives and design through an informed consent process. The content of the consent form was clearly formulated to ensure that participants fully understood all aspects of the research. It included a summary of the study, inclusion criteria, blood sampling procedures, and conditions for sample storage. The selection of patients was carried out by a physician responsible for assessing their eligibility for study participation. Upon obtaining informed consent, blood samples were collected. Participants were explicitly informed that the obtained results would be archived and used solely for research purposes, accessible to all members of the research team, and subjected to statistical analysis. Furthermore, the findings could be presented at scientific conferences and published in peer-reviewed journals. Complete data anonymity was strictly ensured. Based on the information provided, participants independently decided whether to take part in the study, and their participation was confirmed by signing the informed consent form.
Ethics approval
Ethical approval for this study was obtained from: Ethics Committee of the Institute for Treatment and Rehabilitation Niška Banja (No: 03-1626/1). Ethical approval for this study was obtained from: Ethics Committee of the Faculty of Medicine of the University of Nis (No: 12-6647-2/3).
Informed consent
Written informed consent was obtained from all subjects before the study.