
Abstract
Background: This study explored the effects and potential mechanism by which PBX/knotted 1 homeobox 1 (PKNOX1) may exacerbate stomach adenocarcinoma (STAD). Methods: For the in silico analysis, we examined TCGA
Introduction
Gastric cancer has the highest incidence and mortality among gastrointestinal malignancies in the Chinese population.1,2 Stomach adenocarcinoma (STAD) is a malignant epithelial tumour with adenoid differentiation of the gastric mucosal epithelium. It accounts for 90% of gastric malignancies and is the most clinically morbid gastric malignant tumour. 3 Although various new treatments such as targeted therapy, and immunotherapy have improved the prognosis of patients with STAD to a certain extent, the overall survival time of patients has not been significantly prolonged. 4 The pathogenesis of STAD is a complex process involving multiple factors that participate in multi-stage evolution and multi-gene interactions. 5 Awad et al. 6 have found that E-cadherin can be used as a biomarker for the detection of STAD cells, while Berlth et al. have reported that monitoring of glucose transporter 14 levels is a highly reliable readout for STAD prognosis. 7 As such, exploring additional genes related to the pathogenesis of STAD could provide helpful insights for the early diagnosis, treatment, and prognosis of STAD.
Three-amino acid loop extension (TALE) homeodomain proteins are a family of transcription factors that consist of mammalian Pbx, MEIS, and Prep proteins. The PBX/knotted 1 homeobox 1 (PKNOX1; also known as PREP1), a homeobox transcription factor of the TALE superclass, is involved in embryonic development, metabolism, tumourigenesis and haematopoiesis.8-10 Therefore, PKNOX1 may act as a tumour promoter. For example, PKNOX1 is indispensable during embryonic development and can inhibit the occurrence of cancer by preventing DNA damage.11,12 In addition, one study has suggested that PKNOX1 promotes cell epithelial-mesenchymal transition (EMT) and cancer metastasis, by controlling the TGF-β-SMAD3 pathway in non-small cell lung carcinoma. 13 However, the effects and potential mechanism of action of PKNOX1 in STAD remain unclear.
The Hedgehog (Hh) signalling pathway is involved in cell cycle regulation and proliferation, cell adhesion and survival, EMT, self-renewal, and angiogenesis.14,15 Many clinical studies have confirmed that Hh signalling is abnormally activated in lung adenocarcinoma, breast cancer, liver cancer, and other tumours, and is closely related to tumour development, prognosis, and drug resistance.16-19 Hedgehog protein homologues, including sonic hedgehog (SHH), desert hedgehog (DHH), and Indian hedgehog (IHH), are highly expressed in the gastrointestinal tract, and the SHH protein is increased in gastric lesions and gastric cancer.20,21 DHH is mainly involved in the formation of the peripheral nervous system, the differentiation of peritubular muscle-like cells and the formation of the embryonic testicular cord,22,23 and has been confirmed to be an independent predictor of renal cell cancer. 24 However, there have been no studies on the expression of DHH in gastric cancer. Our current work aimed to explore the effects and potential mechanisms of PKNOX1 in STAD. Our results indicated that PKNOX1 acts as a transcription factor for DHH and promotes the progression of STAD by regulating the Hh signalling pathway.
Material and methods
Bioinformatics analysis
We used the UALCAN webtool (https://ualcan.path.uab.edu/analysis.html) based on The Cancer Genome Atlas (TCGA)-STAD databases to analyse the expression of PKNOX1 and TEA domain 4 (TEAD4) in STAD. The expression of PKNOX1 in the GEO database was obtained from the GSE172032 and GSE174237 datasets. Moreover, the KMplot webtool (https://kmplot.com/analysis/index) was used to generate survival curves, including overall survival (OS), progression-free survival (PFS), and post-progression survival (PPS). The Gene Set Enrichment Analysis (GSEA) for pathway enrichment was performed using the LinkedOmics tool (https://www.linkedomics.org/) based on the KEGG database. GSEA enrichment analysis for transcription was conducted using the R package (clusterProfiler) and the dataset ‘ENCODE_TF_ChIP-seq_2015’" to "GSEA enrichment analysis for transcription was conducted using the R package (clusterProfiler) and the dataset ‘ENCODE_TF_ChIP-seq_2015’ (https://maayanlab.cloud/Enrichr). The prediction of PKNOX1 upstream transcription factors used the HumanTFDB (http://bioinfo.life.hust.edu.cn/HumanTFDB) and hTFtarget (http://bioinfo.life.hust.edu.cn/hTFtarget) datasets. The TEAD4/PKNOX1 and PKNOX1/DHH binding sites were predicted using the JASPAR website (http://jaspar.genereg.net/). The cBioPortal tools (http://www.cbioportal.org/) were used to study the correlation between PKNOX1 and DHH. The clinical data of 415 patients with STAD in the TCGA dataset were obtained from the GDC Data Portal (https://portal.gdc.cancer.gov/).
Cells culture and transfection
The normal human gastric mucosal epithelial cell line GES-1 and gastric cancer epithelial cell lines (SNU-216, HGC27, MKN-45, and AGS) were supplied by Procell Life Science&Technology Co.,Ltd. (Wuhan, China). All cells were cultured in RPMI 1640 medium with 10% foetal calf serum at 37°C, and 5% CO2. The HEK-239T cells (Procell, Wuhan, China) were cultured in a complete DMEM medium containing 10% foetal calf serum at 37°C, and 5% CO2.
The silencing RNAs si-PKNOX1-1 and si-PKNOX1-2, which specifically targeted PKNOX1, were synthesised and purified by RiboBio (Guangzhou, China). PKNOX1 was cloned into a pc-DNA3.1 eukaryotic expression vector (Tsingke Biotechnology Co., Ltd (Beijing, China). Transfection was performed using the Lipofectamine 2000 reagent (Invitrogen, Carlsbad, CA, USA). Transfection efficiency was tested using western blotting and real-time qPCR (RT-qPCR).
RT-qPCR
Total RNA was extracted from cells using the TRIzol® one-step extraction method (TaKaRa, Dalian, China) and cDNA was reverse-transcribed using a TaKaRa RT kit (TaKaRa, China). The SYBR Green System (TaKaRa, China) was used for PCR amplification. The mRNA expression levels of the genes of interest were normalized to a reference gene, and the 2−ΔΔCT method was used to calculate the fold-change in expression.
Western blot
Total protein was isolated using a protein extraction kit (Solarbio, Beijing, China), and protein quantity was determined using the BCA method. The protein samples were subjected to 12% SDS-PAGE, transferred to membranes, blocked with skimmed milk powder, and incubated overnight with primary antibodies at 4°C. The following primary antibodies were used: anti-PKNOX1 (ab154587, Abcam, USA), anti-Snail (ab216347, Abcam, US), anti-E-cadherin (A20798, Abclonal, USA), anti-vimentin (A2584, Abclonal, USA), anti-DHH (ab270453, Abcam, USA), anti-cyclin D2 (CCND2, #3741, Cell Signaling Technology, USA), anti-glioma-associated oncogene protein 1 (GLI1, #3538, Cell Signaling Technology, USA), smoothened (SMO, A3274, Abclonal, US), N-cadherin (A0433, Abclonal, USA), TEAD4 (A23774, Abclonal, USA), and anti-GAPDH (#5174, Cell Signaling Technology, Inc.; China) as the control. The membranes were incubated with horseradish peroxidase-conjugated secondary antibody. Quantity One Gel Analysis Software was used to determine the absorbance of each group of protein bands.
Cell counting kit-8 assay
The cells were inoculated in a 96-well sterile cell culture plate (3 × 10³ cells/well) and cultured in a 37°C, 5% CO2 incubator with saturated humidity. After inoculation for 24, 48, and 72 h, a cell counting kit-8 (CCK-8) solution (C0038, Beyotime, Shanghai) was prepared and added to each well to a final volume of 10%, and the OD450 value of each well was measured.
Cell colony formation
Cells were seeded into a culture plate (500 cells/well) and cultured in culture medium for 14 days. Cells were then fixed with methanol for 15 min. After washing with PBS, the cells were stained with 0.1% crystal violet solution (Beyotime, Shanghai, China). Colonies were observed under a microscope.
Scratch assay
Cells were seeded in a six-well plate, and when the cell confluence was 90%, a 200 μL sterile pipette tip was used to streak the plate from top to bottom. The plate was then observed under the microscope and the initial size of the scratch was measure (time 0). After 24 h, the length of the scratches was measured again to calculate the wound healing rate of the cells. Representative images were taken at each stage.
Cell migration assay
Cells were inoculated into Matrigel®-free and Matrigel®-containing upper compartments of Transwell® plates, and 750 μL of cell culture medium containing 10% foetal bovine serum was added to the lower compartment. After culturing for 24 h, the Transwell® upper chamber was removed, and the cells that had not passed through the membrane were wiped off with a cotton swab. After staining with 0.1% crystal violet solution, slides were mounted on a microscope to observe and count the number of perforated cells.
Dual-luciferase reporter assay
The sequences of the wild-type (WT) and mutant (Mut) DHH or PKNOX1 promoter including the PKNOX1-or TEAD4 binding sites were sub-cloned into the pGL3-luciferase reporter construct, and were each co-transfected with a PKNOX1, TEAD4 or vector into HEK-293T cells. After cells were cultured at 37°C for 48 h, a Dual-Luciferase Reporter Assay System was used according to the manufacturer’s instructions. Renilla luminescence served as the internal reference.
Statistical analysis
Data were analysed using the Prism software 9.0 (GraphPad, USA). The Mann–Whitney U test was used to analyse the differences between two groups. Survival analysis was performed using the Kaplan–Meier method, while correlation testing was conducted using Pearson’s correlation analysis. A p-value threshold of 0.05 was used as a cut-off for considering results as statistically significant when below that mark.
Results
PKNOX1 is highly expressed in STAD
The expression level of PKNOX1 in STAD was analysed using TCGA and Gene Expression Omnibus (GEO) datasets, and was found to be highly expressed in STAD primary tumours (Figure 1(a) and (b)). Higher PKNOX1 expression was associated with lower survival rates (Figure 1(c)). The PKNOX1 levels in STAD cells increased remarkably, especially in MKN-45 and AGS cells (Figure 1(d) and (e)). In addition, the expression of PKNOX1 was significantly upregulated in patients with STAD compared with that of healthy individuals. However, there were no significant differences in sex, age, or stage among patients with STAD (Table 1). Taken together, these results suggest that PKNOX1 is highly expressed in STAD, and linked to a poor survival rate in patients with STAD. PKNOX1 is highly expressed in STAD. (a, b) PKNOX1 is significantly upregulated based on the analysis of the TCGA-STAD and GEO datasets. (c) The effect of PKNOX1 expression on the overall survival, progression-free survival, and post-progression survival in STAD; (d) PKNOX1 protein levels as determined by western blot.; (e) PKNOX1 mRNA level measured by RT-qPCR
**
p<.01, compared with the GES-1 cell group). Full-length blots/gels are provided in the supplementary material. Clinical information of 415 STAD patients in TCGA data.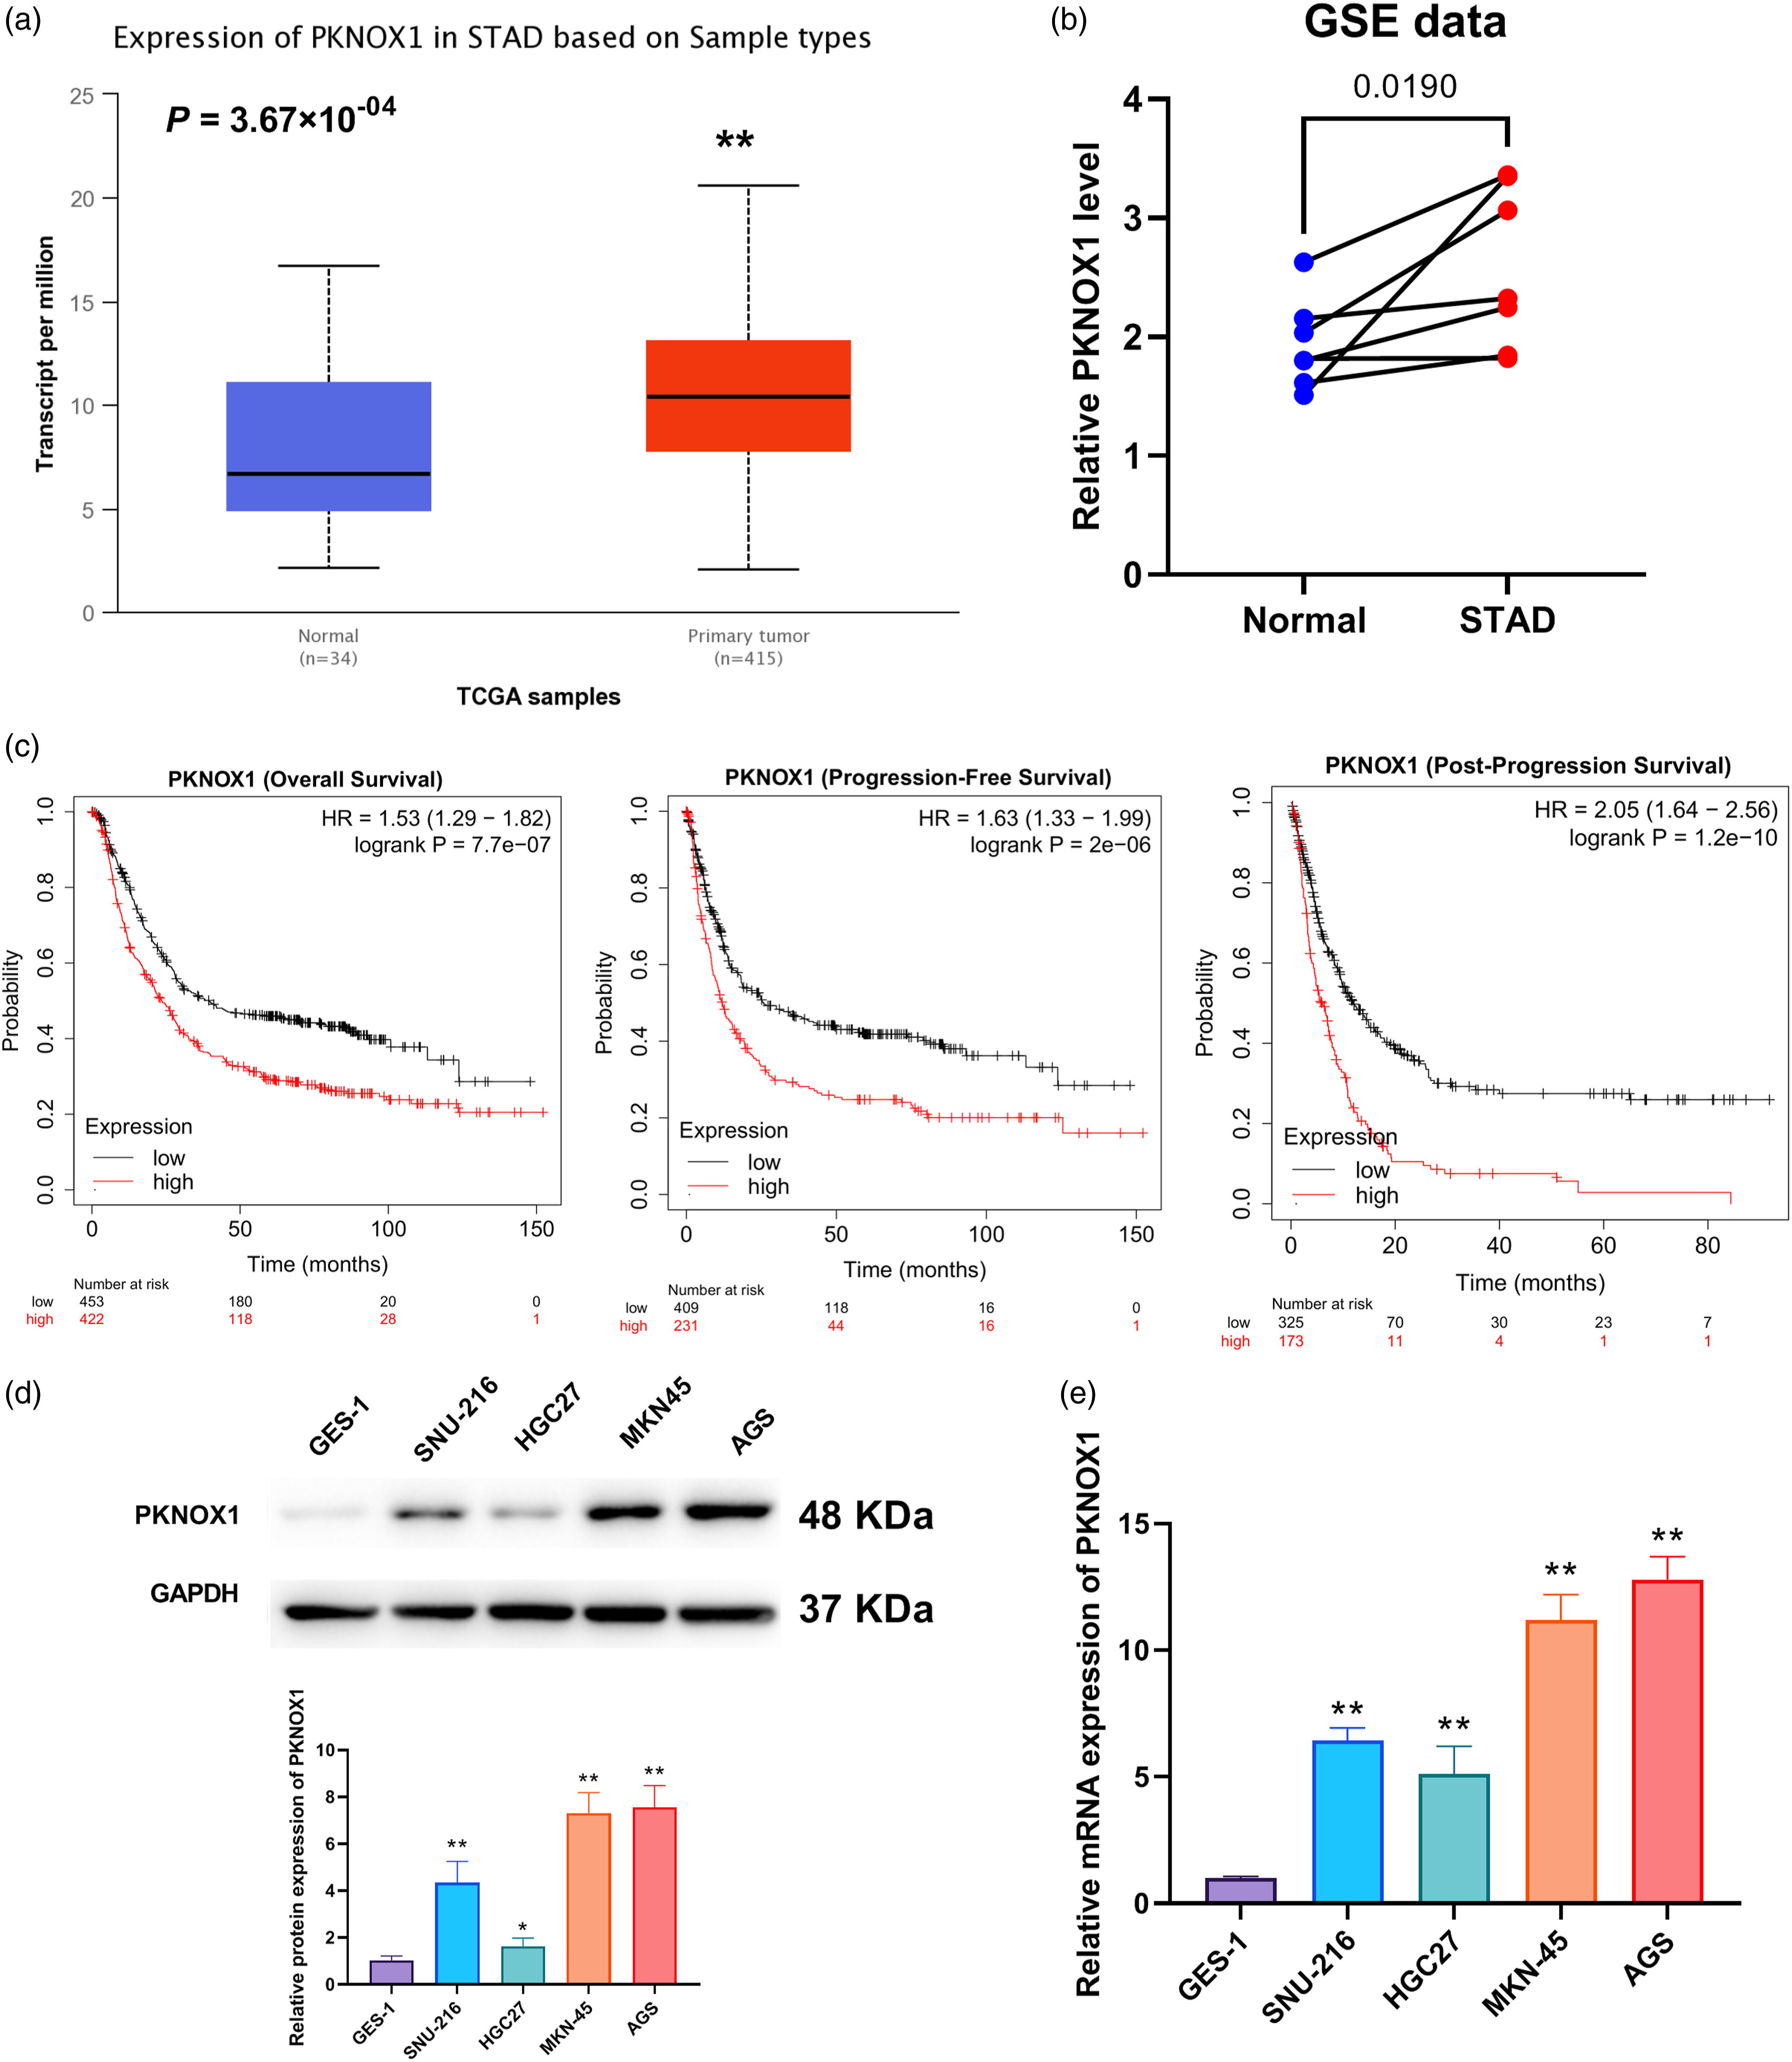

Knockdown of PKNOX1 inhibits STAD cells viability and proliferation
Based on our previous experiments, MKN-45 and AGS cells were selected for subsequent experiments. As shown in Figure 2(a) and (b), PKNOX1 was downregulated in cells transfected with si-PKNOX1, especially in cells transfected with si-PKNOX1-1, indicating successful transfection. Moreover, compared to the si-NC group, cell viability and proliferation in the si-PKNOX1-1 group was decreased (Figure 2(c) and (d)). This finding shows that downregulation of PKNOX1 reduces STAD cell viability and proliferation. Knockdown of PKNOX1 inhibits STAD cell viability and proliferation. (a) PKNOX1 protein level as determined by Western Blot. (b) PKNOX1 mRNA levels measured by RT-qPCR. (c) Cell viability assessed using an CCK-8 assay kit. (d) Cell proliferation as determined by the cell colony formation assay.
**
p<.01, compared with the si-NC group). Full-length blots/gels are presented in the supplementary material.
Knockdown of PKNOX1 inhibits STAD cells migration, invasion, and EMT
Our observations from the scratch assay indicated that the wound healing rate in the si-PKNOX1-1 group was significantly lower than that of the si-NC group (Figure 3(a)). As shown in Figure 3(b) and (c), the number of migrating and invading cells in the si-PKNOX1-1 group was also significantly lower than the corresponding numbers in the si-NC group. These findings suggest that PKNOX1 downregulation attenuates STAD cell migration and invasion. Compared to the si-NC group, the protein levels of Snail, vimentin, and N-cadherin in the si-PKNOX1-1 group were significantly decreased, while E-cadherin levels were increased (Figure 3(d)). Similarly, the mRNA levels of Snail, vimentin, and N-cadherin in the si-PKNOX1-1 group decreased significantly, while the abundance of E-cadherin mRNA increased (Figure 3(e)). Collectively, these results support that the downregulation of PKNOX1 inhibits EMT in STAD cells. Knockdown of PKNOX1 inhibits STAD cells migration, invasion and EMT. (a) Cells migration as measured by the scratch wound healing assay. (b, c) Cell migration and invasion were determined by the Transwell® assay. (d) Snail, vimentin, E-cadherin, and N-Cadherin protein levels, assessed by western blot; (e) mRNA levels of Snail and Vimentin, E-cadherin, and N-Cadherin measured by RT-qPCR.
**
p<.01, compared with the si-NC group). Full-length blots/gels are provided in the supplementary material.
PKNOX1 as a candidate TEAD4-regulated oncogene in STAD
To explore the possible mechanism by which PKNOX1 was upregulated in the STAD cells, we searched for possible transcription factors that may increase PKNOX1 transcription. Venn analysis demonstrated two important transcription factors, TEAD4 and FOXA1, are upregulated in the STAD tissues and can also bind the promoter of PKNOX1 (Figure 4(a)). Considering its high score and biological relevance, TEAD4 was selected for further analyses. Using the ENCODE_TF_ChIP-seq_2015 dataset based on TCGA-STAD data, we conducted a GSEA enrichment analysis and confirmed the significant enrichment of TEAD4 (Figure 4(b)). As the transcription factor, TEAD4 is significantly upregulated in TCGA-STAD (Figure 4(c)). Furthermore, our analysis revealed an inverse correlation between increased TEAD4 expression and poorer OS in patients with STAD (Figure 4(d)). This suggests that TEAD4 expression may serve as a candidate prognostic indicator for the outcome of patients with STAD. PKNOX1 as a candidate TEAD4-regulated oncogene in STAD. (a) Venn analysis for identifying the transcription factor of PKNOX1. (b) TEAD4 GSEA enrichment curve enriched by the transcription factor dataset. (c) TEAD4 levels in STAD based on sample types. (d) TEAD4 expression related to overall patient survival in STAD. (e) Binding sites of TEAD4 on the PKNOX1 promoter region, obtained by the JASPAR. (f) The targeting relationship between PKNOX1 and TEAD4 as measured by a dual-luciferase reporter assay. (g, h) Relative protein expression levels of TEAD4 and PKNOX1 as detected by western blot. (i, j) Cell proliferation as measured by the CKK8 and colony formation assays. (k, l) Cell migration and invasion were determined by the Transwell® assay. *p < .05 and **p<.01, comparisons made with reference to the vector-transfected group; #p < .05 and ##p<.01, comparisons made with reference to the TEAD4+si-NC group). Full-length blots/gels are presented in the supplementary material.
To explore the regulatory mechanisms underlying the effects of TEAD4 on the PKNOX1 transcription, we investigated its binding sites in the PKNOX1 promoter region (Figure 4(e)). Result showed a putative interaction site between TEAD4 and PKNOX1 promoter. Functional assays demonstrated that TEAD4 upregulation significantly enhanced the luciferase activity in cells transfected with a WT PKNOX1 promoter construct (Figure 4(f)). Notably, this stimulatory effect was substantially attenuated when the binding sequence was mutated reinforcing the importance of the TEAD4-PKNOX1 interaction. The TEAD4 overexpression led to a significant increase in TEAD4 protein levels, as well as PKNOX1, relative to the control group (Figure 4(g) and (h)). Altogether, these findings highlight the positive correlation between PKNOX1 and TEAD4 expression and emphasise the potential TEAD4-dependent regulation of PKNOX1. Functional assays evaluating cell proliferation and migration showed that TEAD4 overexpression significantly promoted both proliferation and migration (Figure 4(i)). Of note, when TEAD4 was overexpressed in conjunction with si-PKNOX1, TEAD4’s positive effect on cell migration and proliferation was attenuated. These suggest that TEAD4-mediated cell proliferation and migration partially relies on PKNOX1 expression. Our collective results indicate that PKNOX1 may function as an oncogene in STAD, and is potentially regulated by the transcription factor TEAD4.
PKNOX1 regulates the Hh signalling pathway
Our GSEA based on the KEGG database indicated that PKNOX1 was enriched in various pathways, with the Hh signalling pathway being among the enrichment results (Figure 5(a) and (b)). Considering the important role of hedgehog pathway in the progression of STAD, we choose this pathway to further verification. Compared to the si-NC group, the protein levels of DHH, CCND2, GLI1, and SMO were significantly decreased in the si-PKNOX1-1 group (Figure 5(c) and (d)). Taken together, these results suggest that the downregulation of PKNOX1 can inhibit the Hh signalling pathway in STAD cells. PKNOX1 regulates the Hh signalling pathway. (a) KEGG analysis of PKNOX1 correlated gene-associated pathways; (b) GSEA analysis of the Hh signalling pathway; (c, d) DHH, CCND2, GLI1, and SMO protein levels as determined by western blot.
**
p<.01, compared with the si-NC group). Full-length blots/gels are provided in the supplementary material.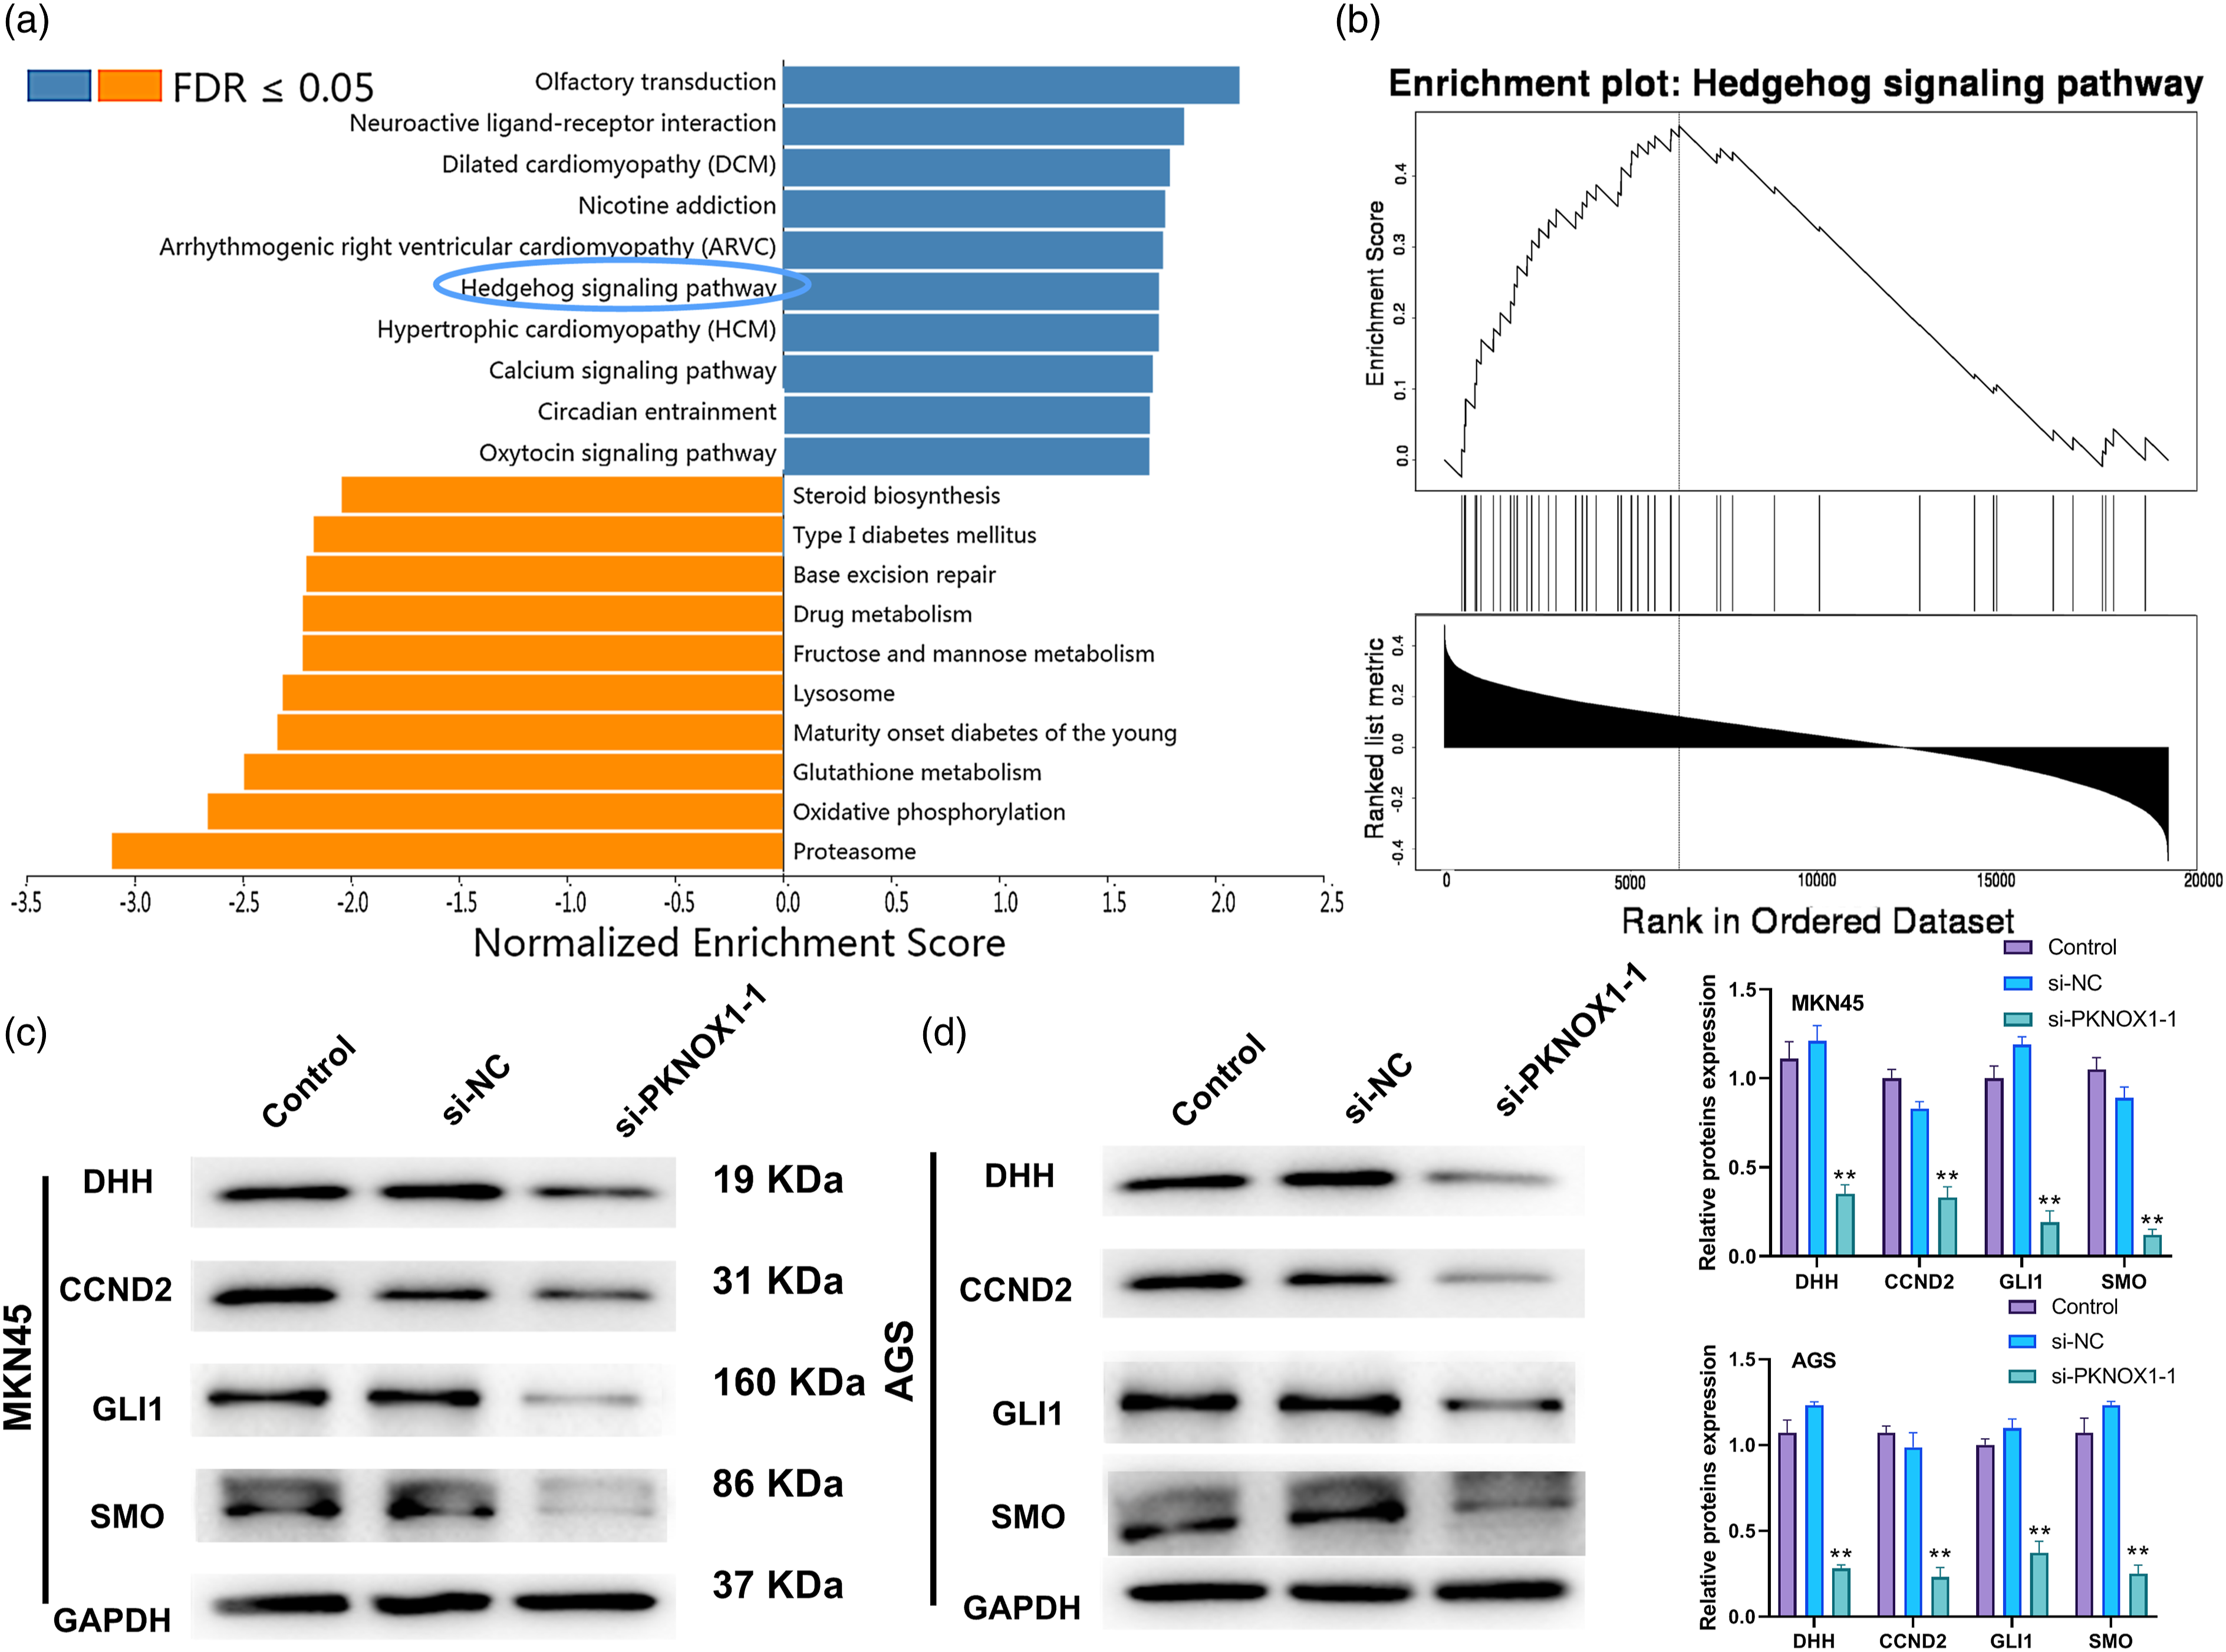
Knockdown of PKNOX1 inhibits cells proliferation, migration, invasion, and EMT in STAD via the Hh signalling pathway
To verify the Hh pathway through which PKNOX1 mediates its effects on cell fate in STAD cells, we treated cells with either an Hh inhibitor (GANT61, 20 μmol/L, Sigma, USA) or activator (SAG, 5 nmol/L, Sigma, USA). Compared with the si-NC group, DHH, CCND2, GLI1, and SMO protein levels were decreased in the si-PKNOX1-1 and the si-NC+GANT61 groups, while they were increased in the si-NC+ SAG group. Moreover, relative to the si-PKNOX1-only group, DHH, CCND2, GLI1, and SMO protein levels were further decreased in the si-PKNOX1-1+GANT61-treated cells, while they were elevated in the si-PKNOX1-1+SAG group (Figure 6(a)). In addition, cell proliferation, migration, and invasion in the si-PKNOX1-1 and the si-NC+GANT61 groups were more distinctly attenuated compared to the si-NC group, and were conversely higher in the si-NC+SAG-treated cells. We observed cell proliferation, migration, and invasion to be inhibited in the si-PKNOX1-1+GANT61 and improved in the si-PKNOX1-1+SAG groups, relative to the si-PKNOX1-1-only condition (Figure 6(b) and (c)). Furthermore, compared to the si-NC group, we found that protein levels of Snail, vimentin, and N-cadherin were decreased in the si-PKNOX1-1 and si-NC+GANT61 groups, but increased in the si-PKNOX1-1+SAG group. In contrast, E-cadherin levels were increased in the si-PKNOX1-1 and si-NC+GANT61 groups, and decreased upon cell co-incubation with si-PKNOX1-1 + SAG (Figure 6(d)). These results collectively showcase, that downregulation of PKNOX1 inhibits cell proliferation, migration, invasion, and EMT in STAD and PKNOX1 effects are likely mediated via the Hh signalling pathway. Knockdown of PKNOX1 in STAD inhibits cells proliferation, migration, invasion, and EMT in a Hh signalling-dependent manner. (a) DHH, CCND2, GLI1, and SMO protein levels, measured by western blot. (b) Cell proliferation was determined by a cell colony formation assay. (c) Cell migration and invasion, assessed by a Transwell® assay; (d) Snail, vimentin, and E-cadherin protein levels, determined by western blot.
**
p<.01, compared with the si-NC group;
##
p<.01; compared with the si-PKNOX1-1 group). Full-length blots/gels are presented in the supplementary material.
PKNOX1 is a transcription factor for DHH
Using the dataset ‘Human TCGA STAD UNC RNAseq HiSeq RNA BI Gene Firehose RSEM log2’ from the CBioPortal tool, a correlation analysis was conducted between the expression levels of PKNOX1 and DHH. The results revealed that PKNOX1 levels positively correlated with DHH expression (Figure 7(a)). The binding sites of PKNOX1 are shown in Figure 7(b). The binding sites of PKNOX1 on the DHH promoter region were obtained from the JASPAR website (Figure 7(c)). We measured luciferase activity to be higher in cells co-transfected with the WT DHH promoter region and PKNOX1, compared to that of the NC+PKNOX1 group. Conversely, luciferase activity was lower in cells co-transfected with the Mut DHH promoter construct and PKNOX1, relative to the WT DHH promoter+PKNOX1 group (Figure 7(d)). Furthermore, as PKNOX1 levels were the lowest in HGC27 cells, we selected this cell line for PKNOX1 overexpression to verify its relationship with DHH. Our results indicated that DHH expression was higher in cells exogenously overexpressing PKNOX1, compared to control cells treated with an empty vector (Figure 7(e)). Taken together, our findings suggest that PKNOX1 likely binds to the promoter region of DHH and promotes DHH expression, which activates the Hh signalling pathway in STAD (Figure 7(f)). PKNOX1 is a transcription factor of DHH. (a) Correlation analysis between PKNOX1 and DHH. (b) The PKNOX1 binding sequence. (c) The putative binding sites of PKNOX1 on the DHH promoter region, obtained by the JASPAR. (d) Luciferase activity was detected in cells transfected with constructs containing the wild-type or mutant form of the DHH promoter region, following transfection with PKNOX1. (e) PKNOX1 and DHH protein levels were measured by western blot. (f) Schematic representation of PKNOX1’s putative role in STAD.
*
p<.05, compared with the NC-PKNOX-1 group;
#
p<.05, compared with the WT DHH promoter+PKNOX1 group;
##
p<.01, compared with the si-PKNOX1-1 group). Full-length blots/gels are provided in the supplementary material.
Discussion
In 2018, approximately one million new patients with gastric cancer and 783,000 deaths were recorded worldwide, of which at least half of these new cases and deaths occurred in China.25,26 Early symptoms of gastric cancer are atypical and are accompanied by infiltration and metastasis, which cause the patient to be in an advanced stage at the time of presentation and at great risk of missing the opportunity for surgical treatment, resulting in poor clinical efficacy and prognosis.27,28 The key measures for the prevention and treatment of STAD include early diagnosis and treatment. In this study, PKNOX1 was selected to study its expression and function in STAD. We found that PKNOX1 was highly expressed in STAD primary tumours and cell lines, and that higher PKNOX1 expression was associated with a lower survival rate. The abnormal expression of PKNOX1 in STAD suggests that PKNOX1 could be potentially used as a promising new marker for the early diagnosis and treatment of STAD.
We next investigated the effects of PKNOX1 on STAD cells in subsequent experiments. Cancer metastasis is a key factor affecting the efficacy and prognosis of patients. 29 The EMT is closely associated with primary and secondary invasion in various tumours. 30 The results of or our present work showed that PKNOX1 downregulation suppressed STAD cell viability, proliferation, migration, invasion, and EMT. Similarly, Cimmino et al. 10 found the upregulation of PKNOX1 promoted the cell migration, proliferation, and angiogenesis in mouse aortic endothelial cells. The transcription factor PKNOX1 reportedly facilitates EMT and metastasis in non-small cell lung adenocarcinoma, causing tissue deterioration and metastasis. 13 This finding is consistent with the results of our study, as PKNOX1 downregulation inhibited STAD progression, suggesting that PKNOX1 functions as a potential oncogene in STAD. However, Zhang et al. 31 have reported that PKNOX2 acts as a tumour suppressor in gastric cancer by transcriptionally activating IGFBP5 and p53. This divergent role of PKNOX2 highlights the complexity of the PKNOX family in gastric tumourigenesis. Further investigation into the interplay between PKNOX1 and PKNOX2 may enhance our understanding of their functions in gastric cancer progression and provide insights into potential therapeutic strategies.
The TEAD comprises a family of transcription factors that regulate the expression of genes involved in cell proliferation, apoptosis, and metastasis. 32 Among the TEAD family members, TEAD4 has emerged as a potential therapeutic target and prognostic marker for breast and gastric cancer, as previous studies have demonstrated TEAD4’s crucial role as an oncogene, and particularly as a transcription factor, during the development and progression of cancer.33-40 However, no study has shown that TEAD4 acting as a transcription factor promote PKNOX1 transcription and the upregulation of Hh signalling downstream, which facilitates the advancement of gastric cancer. Here, we conducted Venn analysis, which revealed an intersection of TEAD4 as a transcription factor associated with PKNOX1. To elucidate the regulatory mechanisms through which TEAD4 affects PKNOX1 expression, we performed cell function experiments. The results demonstrated that TEAD4 overexpression enhanced the proliferation and migration of gastric cancer cells. However, the knockdown of PKNOX1 reversed this effect. In summary, our findings highlight the potential role of TEAD4 as a regulator of PKNOX1 expression and its impact on gastric cancer progression, thus providing valuable insights into novel therapeutic targets for this disease.
To explore the downstream regulatory mechanism of PKNOX1 in STAD, we analysed the signalling pathways that PKNOX1 may regulate. We found that PKNOX1 is likely involved as a positive regulator of the Hh signalling pathway in STAD. When the Hh signalling pathway ligand is activated, it binds to the PTCH1 receptor and upregulates SMO. SMO then promotes the formation of GLI transcription activating complexes, which induce the expression of target genes, such as GLI1 and CCND2.41,42 We observed that PKNOX1 downregulation decreased the expression of DHH, CCND2, GLI1, and SMO. In contrast, treatment with the Hh agonist compound SAG reversed the inhibitory effect of PKNOX1 downregulation on cell proliferation, migration, invasion, and EMT. In relation to this effect, when Hh signalling was pharmacologically inhibited by treatment with the Hh inhibitor compound GANT61, malignant behaviour of gastric cancer cells was also inhibited. Taken together, our results suggest that PKNOX1 plays its roles in STAD progression through activation of the Hh signalling pathway.
In human tumours, detecting the expression of effector genes downstream of the Hh signalling pathway is an important step in measuring the activity of the Hh pathway. Previous studies have been limited to only a small number of pathway target genes. The expression of the SHH ligand increases in gastric lesions and cancer.20,43 As in the downstream Hh signalling pathway, the inhibition of SMO and GLI1 is conducive to repressing gastric cancer cell migration and invasion. 44 According to existing reports, DHH function is localised in the gonads, including ovarian granulosa cells and testicular supporting cells.45,46 In our present study, PKNOX1 levels positively correlated with DHH expression. Our collective findings also showed that PKNOX1 is a candidate transcription factor for DHH, suggesting that PKNOX1 may bind to DHH and promote tumour progression by upregulating the Hh signalling pathway.
In conclusion, here we showed that PKNOX1 is highly expressed in STAD, and positively regulates the Hh signalling pathway by facilitating DHH expression, thereby promoting the development of STAD. Additionally, our work indicated that TEAD4 may contribute to the up-gulation of PKNOX1’s expression. A limitation of this study was the lack of in vivo experiments to verify the role of PKNOX1 in STAD progression. Future studies would need to focus on animal models to investigate the functional significance of these regulatory pathways in STAD. The findings presented here could be used for the identification of new potential target genes for the diagnosis and treatment of STAD.
Data Availability Statement
The datasets used and analyzed during the current study are available from the corresponding author on reasonable request.
Footnotes
Author contributions
B.L. designed the study; B.L. and L.L. performed the research; S.Z. and L.L. analyzed data; B.L. wrote the paper. All authors have read and approved the manuscript.
Declaration of conflicting Interests
The author(s) declared no potential conflicts of interest with respect to the research, authorship, and/or publication of this article.
Funding
The author(s) received no financial support for the research, authorship, and/or publication of this article.